Page 1
IMPACT OF ISO 9001 QUALITY CERTIFICATION ON THE FINANCIAL PERFORMANCE OF ORGANIZATIONS LISTED AT THE
NAIROBI STOCK EXCHANGE
BY
GEORGE STANLEY MWAURA
D61/8836/2006
A RESEARCH PROJECT PRESENTED IN PARTIAL FULFILLMENT OF THE REQUIREMENTS OF THE DEGREE OF MASTER OF BUSINESS
ADMINISTRATION
SCHOOL OF BUSINESS
UNIVERSITY OF NAIROBI
NOVEMBER, 2011
Page 2
D ECLA RA TIO N
This research project is my original work and has not been submitted for the award of
a degree in any other university.
George Stanley Mwaura
Signature: _ Date
This research project has been approved for presentation by my supervisor,
Lecturer: Department of Finance and Accounting
dDate
Page 3
ACKNOWLEDGEMENTS
I want to extend my profound gratitude to God who never cease in loving us and for
His continued guidance and protection. I would especially like to thank Mr. J. Karanja
as my supervisor. As my teacher and mentor he has taught me more than I could ever
give him credit for here. He has shown me by his example what a good financial
manager and a person should be.
I want to thank my family members who have been extremely supportive o f me
during my pursuit of this project. I am grateful to all of my fellow students and the
staff o f the School of Business for their tremendous support and encouragement
during my research.
May God bless you all.
iii
Page 4
DEDICATION
I dedicate this project to Almighty God who has been my strength and wisdom. To
my family, for your love and encouragement.
iv
Page 5
ABSTRACT
The academic literature offers two approaches to explain how quality management
practices could have an effect on business performance. First, the operational view
highlights that firms adopting quality management schemes such as ISO 9001,
improve their performance as a result of the prevention of production process failures
and that the costs linked to quality improvements must be seen as investments, and
the benefits from those investments are reflected in firm performance measures
leading to the achievement o f important financial and organizational gains.
The study shows that certified companies had better results not only after certification
but also prior to the certification date. The values of sales, size, operation expenses
and earnings per share three years before and after certification however shows no
significant differences implying that the good performance was visible in the
companies before and after ISO 9001 certification.
The analysis however showed a significant difference between ISO 9001 certified and
non-certified firms. There was a significant difference in the mean values of the
variables between certified and non-certified firms except for operating expenses.
Based on the high values o f the variables among the ISO 9001 certified firms, this
implies that ISO 9001 certification had such a significant impact on general firm
financial performance.
v
Page 6
TABLE OF CONTENTS
INTRODUCTION..............................................................................................................1
1.1 BACKGROUND TO THE STUDY....................................................................... 1
1.2 STATEMENT OF THE PROBLEM......................................................................6
1.3 RESEARCH OBJECTIVE......................................................................................8
1.4 SIGNIFICANCE OF THE STUDY........................................................................ 8
CHAPTER TWO............................................................................................................... 9
LITERATURE REVIEW............................................................................................... 9
2.1 INTRODUCTION..................................................................................................9
2.2 BACKGROUND....................................................................................................9
2.3 THEORETICAL FRAMEWORK........................................................................10
2.3.1 WHY FIRMS SEEK ISO 9001 CERTIFICATION..........................................13
2.4 EMPIRICAL LITERATURE.................................................................................15
2.4.1 STOCK REACTION TO ISO 9001 CERTIFICATION.................................. 15
2.4.2 ORGANIZATION PERFORMANCE............................................................... 17
2.4.3 QUALITY AND COST......................................................................................20
2.4.4 MANAGERIAL CONTROL AND EMPLOYEE INVOLVEMENT...........22
2.4.5 STRATEGIC BENEFIT......................................................................................23
2.4.6 CRITICISM OF ISO 9001 CERTIFICATION................................................ 26
2.5 SUMMARY AND CONCLUSION..................................................................... 28
C H A P T E R O N E ..............................................................................................................................1
VI
Page 7
C H A P T E R T H R E E 30
RESEARCH METHODOLOGY............................................................................. 30
3.1 INTRODUCTION..................................................................................................30
3.2 RESEARCH DESIGN..........................................................................................30
3.3 TARGET POPULATION.....................................................................................30
3.4 SAMPLING PROCEDURE................................................................................ 30
3.5 DATA COLLECTION AND ANALYSIS......................................................... 31
3.6 DATA RELIABILITY AND VALIDITY.......................................................... 32
CHAPTER FOUR........................................................................................................... 33
DATA ANALYSIS, RESULTS AND DISCUSSION..................................................33
4.1 INTRODUCTION..................................................................................................33
4.2 COMPARISON OF FIRM PERFORMANCE BEFORE AND
AFTER ISO 9001 CERTIFICATION..................................................................33
4.3 COMPARISON OF ISO 9001 CERTIFIED AND NON-CERTIFIED
FIRMS.....................................................................................................................41
CHAPTER FIVE........................................................................................................... 46
SUMMARY, CONCLUSION AND RECOMMENDATION............................... 46
5.1 INTRODUCTION.................................................................................................46*
5.2 SUMMARY AND CONCLUSIONS OF THE FINDINGS............................ 46
5.3 LIMITATION OF THE STUDY......................................................................... 48
5.4 SUGGESTIONS FOR FURTHER RESEARCH.............................................. 48
REFERENCES................................................................................................................49
vii
Page 8
CH A PTER O N E
INTRODUCTION
1.1 BACKGROUND TO THE STUDY
Today’s business managers in general are not sceptical of whether they shall adopt
ISO 9001. Instead, they are more concerned with how to implement the quality
management standard most successfully and how their companies can be
differentiated from other ISO 9001 certified competitors in the industry after
obtaining the certification. ISO 9001 is a supplier quality guarantee model formulated
from the customer’s view point which gives customers an assurance about the quality
of products or services supplied which they can use as a basis for deciding whether or
not to purchase products or services. The premise o f ISO 9001 is that well defined and
documented procedures improve consistency o f output. The choice o f implementing
ISO 9001 family Quality Management Standards makes a firm seek internal
improvements and strategic benefits associated with the quality program. The internal
improvements include requiring that all business activities related to a product be
conducted in a three part continuous cycle of planning, control and documentation
leading to better documentation, greater quality awareness, increased productivity and
efficiency. External benefits will include good customer perception on quality,
improved customer satisfaction, increased competitive advantage and reduced
customer quality audit.
Fluctuating structural economic, social and political conditions world over and in
Kenya particular make it necessary for all organizations to review and tightly control
costs and expenditures in an endeavour to maximize shareholder wealth. At such
periods of time, management often has the tendency to put quality on the back burner
1
Page 9
due to financial constraints. Ironically, those are the occasions which present the
greatest opportunities for minimizing operational losses by the judicious pursuit of
quality improvement projects. Active participation in these processes has presented
great challenges to the implementers as well as the shareholders o f the restructured
firms. This phenomenon has brought to face the grim reality to shareholders and
managers alike, that for an organization to succeed and gain a competitive edge, a
traceable standardized management system has to be put in place that would provide a
benchmark in the firm’s or the organizations undertakings in dealings with
employees, its suppliers of raw materials and buyers of its products or services.
The widely accepted view is that implementing an effective quality improvement
program requires that firms move away from the philosophy of using inspection to
weed out defective products to a philosophy o f preventing defects from occurring in
the first place. The principles, procedures, and elements to achieve this include top
management commitment, improved communications between management and
workers, training and education, higher employee involvement, continuous process
improvement, statistical process control, developing long term relationships with
quality suppliers, and a true focus on quality throughout the entire organization; as
documented in Edward Deming's 14 points (Deming, 1982), Juran's Breakthrough
Sequence (Juran and Gryna 1980), and Crosby's 14-point program (Crosby, 1979).
These steps are difficult to implement because they involve drastic changes in
management philosophy, changes in management/labour relations, changes in
performance measurement and reward systems, and uprooting entrenched habits and
methods. Furthermore, these changes need to be adopted wholeheartedly by the entire
organization which requires that the organization learns how to change. Therefore, it
2
Page 10
is not surprising that recent surveys by some management consulting firms suggest
that many firms have not been effective at implementing quality improvement
programs. It is often assumed by management that consideration for quality
improvement related to the products and services offered raises the cost of operations
above the current levels. It is based on the assumption that improvements inherently
involve higher expenditures. It can be simply demonstrated that not all quality
improvements carry higher price tags higher efficiency may be obtained, in some
cases by simplifying tasks, thereby reducing costs.
Moreover, for certain cases o f quality improvements, the added costs associated with
the quality improvement are outweighed by the financial benefits derived from the
changes. Recently, many firms in Kenya have invested substantial time and money to
achieve and maintain ISO 9001 registration. The question addressed in this study is
whether the firms' shareholders benefit from this registration process. The primary
reason to believe shareholders may benefit from ISO registration is that successfully
completing the registration process demonstrates management's commitment to
quality. The increase in perceived quality should result in new customers, increased
sales, and reduced operating costs. In some cases, the ISO 9001 standard has been
imposed on small firms by their larger customers, particularly in the automobile
industry. Van der Wiele and Brown (1997) study revealed that the immediate benefits
of certification included an enhanced awareness of quality and related issues,
improved customer service, strengthened managerial control, and greater uniformity
in product and service quality; at the same time, it appeared that some benefits might
take a longer period to emerge.
3
Page 11
ISO 9001 certification has emerged as a managerial tool that aims to achieve a better
performance at both the firm and the plant level through continuous improvements of
processes and techniques. The academic literature offers two approaches to explain
how quality management practices could have an effect on business performance.
First, the operational view highlights that firms adopting quality management
schemes (such as ISO 9001) improve their performance as a result o f the prevention
of production process failures (reducing internal process variability), the
empowerment of workers to identify potential sources o f quality gains, and a
commitment to customer satisfaction (Garvin, 1984). Second, the strategic approach to
adoption emphasizes that the costs linked to quality improvements must be seen as
investments, and the benefits from those investments are reflected in firm
performance measures (Rust, Zahorik and Keiningham, 1995).
As a result, it can be expected that quality management enhances product quality
(design, conformance and durability, amongst others), leading to the achievement of
important financial and organizational gains derived from technological innovations
and quality improvements (Dean and Bowen, 1994). Despite these arguments,
empirical research examining the consequences of the adoption of ISO 9001
certification is not conclusive. On the one hand, some papers show a strong effect of
ISO 9001 certification on business performance (Corbett, Montes-Sancho and Kirsch,
2005; Gonza' lez- Benito and Gonza' lez-Benito, 2005; Terziovski, Power and Sohal,
2003).
Sun (1999) investigated ISO 9001 certification in Norwegian companies and found
that it was significantly correlated with quality results, especially the reduction of
defective products and customer complaints and the improvement of business
performance such as profitability and productivity. Lloyds Register of Quality
4
Page 12
Assurance’s (1996) survey found certified companies sales growth, profit margins and
return on capital employed were much better than the industry average. Support for
this can be found in a Spanish longitudinal study that compared the return on assets
employed of 400 accredited and 400 non-accredited firms between 1994 and 1998
(Heras et al. 2002). On the other hand, the positive relationship between ISO
certification and business performance appears as weak and not always significant in
empirical research (Tsekouras, Dimara and Skuras, 2002). Batchelor's (1992) study of
over 600 registered UK firms, found that only 15 per cent of firms achieved gains
from quality certification. These benefits were largely internal, such as reduction in
error rates and procedural efficiency, rather than external dimensions such as market
share. Terziovski et al. (1997) study of 1,000 firms in Australia and New Zealand that
found that Quality certification had no significant, positive relationship with business
performance. Haversjo (2000), analysis of the returns on capital employed of 800
companies between 1989 and 1995 found no significant improvement post
certification.
Moreover, operational and strategic-oriented literature offers two main explanations
for the feeble impact of ISO certification on firm performance. First, the lack of
commitment from firms’ personnel and management team regarding ISO
implementation, along with the fact that ISO results are not observable in the short
term, may lead to system failure (Samson and Terziovski, 1999). Second, quality
management practices, such as ISO certification, might be context reliant on other
factors such as market environment and the intensity of competition (Karmarkar and
Pitbladdo, 1997; Powell, 1995).
5
Page 13
1.2 STATEMENT OF THE PROBLEM
ISO 9001 certification has emerged as a managerial tool that aims to achieve a better
performance at both the firm and the plant level through continuous improvements of
processes and techniques. The academic literature offers two approaches to explain
how quality management practices could have an effect on business performance.
First, the operational view highlights that firms adopting quality management
schemes such as ISO 9001, improve their performance as a result of the prevention of
production process failures (reducing internal process variability), the empowerment
of workers to identify potential sources of quality gains, and a commitment to
customer satisfaction (Garvin, 1984). Second, the strategic approach to adoption
emphasizes that the costs linked to quality improvements must be seen as
investments, and the benefits from those investments are reflected in firm
performance measures (Rust, Zahorik and Keiningham, 1995). As a result, it can be
expected that quality management enhances product quality (design, conformance and
durability, amongst others), leading to the achievement of important financial and
organizational gains derived from technological innovations and quality
improvements (Dean and Bowen, 1994).
Mwihaki (2006) studied the effect of ISO certification on operation performance and
found a weak positive relationship between sales as the dependent variable and
predictors variables of customer complaints, production rejects, sales return and
conversion costs in the study.
Gatimu (2007) study found that firms that adopted ISO 9001 were firms that already
had a quality system in place and therefore adoption of the standard was to enable the
6
Page 14
firm strengthen and improve its already existing quality system. The main reasons that
motivated firms to adopt ISO 9001 were identified as: to enable firm gain competitive
advantage mainly in overseas markets, aid the firm in increasing efficiency and
productivity, to play a role as part of the firm's larger improvement strategy and to
enable the firm compete more effectively in overseas markets.
Kimani (2007) study identified greater quality awareness leads to improved product
and improved customer perception while the greatest challenge identified was that
certified organizations had on a moderate scale experienced high surveillance audit
costs and the fact that ISO 9001 will not work without management support.
Despite these arguments, empirical research examining the consequences of the
adoption of ISO 9001 certification is not conclusive. On the one hand, some papers
show a strong effect of ISO 9001 certification on business performance (Corbett,
Montes-Sancho and Kirsch, 2005; Gonza' lez-Benito and Gonza' lez-Benito, 2005;
Terziovski, Power and Sohal, 2003). On the other hand, the positive relationship
between ISO certification and business performance appears as weak and not always
significant in empirical research (Tsekouras, Dimara and Skuras, 2002).
Other than the research done elsewhere in other countries, the studies done in the
Kenya market have been too few to give a conclusive result and none has been carried
out on the impact of ISO 9001 Quality Certification on financial performance of
organizations in Kenya, hence there existed a research gap that the necessitated the
need to carry out the research. This study attempts to establish if the financial
performance of a firm in Kenya changes following its certification to ISO 9001.
7
Page 15
1.3 RESEARCH OBJECTIVES
1. To determine the impact of ISO 9001 Quality Certification on the financial
performance of firms listed at the Nairobi Stock Exchange.
2. To compare the financial performance of ISO 9001 certified firms and non-ISO
9001 certified firms listed at the Nairobi Stock exchange.
1.4 SIGNIFICANCE OF THE STUDY
The research aims to contribute to literature by offering insights on impact of ISO
9001 Quality Certification on financial performance to an organization. It is
anticipated that the findings of this study will be important to;
Organization management and directors as it will provide an insight into the various
approaches of ISO 9001 quality management practises and the benefits that may
accrue following its implementation.
The government in the developing policy papers, policy making regarding taxation
and other regulatory requirements and guidelines on quality management tools in the
country.
The academicians who will be furnished with relevant information regarding ISO
9001 Quality Management practices. The study will contribute to the general body of
knowledge and form a basis for further research.
8
Page 16
C H A PTER T W O
LITERATURE REVIEW
2.1 INTRODUCTION
This chapter reviews the literature on the reasons for implementing ISO 9000 series
quality management system and its impact on the firm.
2.2 BACKGROUND
The International Organization for Standardization (ISO) is the world’s largest
developer of voluntary International Standards for business, government and society.
ISO has a membership of 163 (“ISO”, 2010) national standards institutes from
countries large and small, industrialized and developing, in all regions of the world.
Kenya is represented in this organization by the “Kenya Bureau of Standards”. ISO
develops voluntary technical standards which add value to all types of business
operations by contributing to the dissemination of technology and good business
practices by supporting the development, manufacturing and supply o f more efficient,
safer and cleaner products and services.
Emphasis on quality has led to demand by organizations for external recognition of
quality, which in turn provided some impetus for the International Organization for
Standardization’s (ISO) development of the ISO 9000 series of international quality
management standards for quality assurance of products and services. ISO/TC 176,
comprising experts from businesses and other organizations around the world,
monitors the use of the standards to determine how they can be improved to meet user
needs and expectations when the next revisions are due. All ISO standards are
9
Page 17
reviewed regularly for relevancy; changes are made when there is a demonstrated
need to improve the standard.
ISO 9001 is a supplier quality guarantee model formulated from the customer’s view
point which gives customers an assurance about the quality of products or services
supplied which they can use as a basis for deciding whether or not to purchase
products or services. Up to the end of December 2008, at least 982, 832 ISO 9001
(2000 and 2008) certificates had been issued in 176 countries and economies. The
2008 total represents an increase of 31,346 (+3 %) over 2007, when the total was
951 486 in 175 countries and economies. (“ISO Survey,” 2008). In Kenya the
number o f ISO certified firms has grown from a low of 24 in the year 2003 to a high
of 204 in 2007 (“ISO Survey”, 2007).
2.3 THEORETICAL FRAMEWORK
The premise of ISO 9001 is that well defined and documented procedures improve
consistency of output. The ISO 9001 standards are based on the concepts that certain
minimum characteristics of a quality management could be usefully standardized,
giving mutual benefit to suppliers and customers and focus on process rather than
product quality (Withers and Ebrahimpour, 1998). Sharma (2005) indentifies Internal
Improvement theory and External Improvement theory which attempt to explain
possible sources of gains following ISO 9001 certification. Both theories give a
consistent view that performance of certified firms exceeds performance of
uncertified firms.
10
Page 18
The latest version o f ISO 9001, which was released in November 2008, and its
predecessor ISO 9001:2000 indicate that the standard is constituted by eight
principles (“ISO”, 2008). Thus, it is very possible that certified organizations may not
implement these principles in similar extents and may exhibit varying patterns of
implementation by paying extra attention to some principles that are in line with their
corporate strategies. The ISO 9000 series standards introduce the eight quality
management principles on which the quality management system standards are based.
The eight quality management principles as defined in ISO 9000:2005, Quality
management systems Fundamentals and vocabulary, and in ISO 9004:2000, Quality
management systems Guidelines for performance improvement are Customer focus,
Leadership , Involvement o f people, Process approach, System approach to
management, Continual improvement , Factual approach to decision making and
Mutually beneficial supplier relationships. These principles can be used by senior
management as a framework to guide their organizations towards improved
performance. The principles are derived from the collective experience and
knowledge of the international experts who participate in ISO Technical Committee
ISO/TC 176, Quality management and quality assurance, which is responsible for
developing and maintaining the ISO 9000 standards.
One of the main requirements for acquiring the ISO 9000 standards is that a firm’s
quality system must be documented (Curkovic and Pagell, 1999). This is generally
done at two levels, a quality manual and a procedures manual (Nwankwo, 2000).
However the registration process for the ISO 9001 standards consists of an audit of
the implementation of the company’s documented quality system after it has been
verified and seen to conform to the requirements o f the applicable ISO 9001 standard.
A third party implements the audit (Ofori and Gang, 2001; Abraham et al., 2000).
11
Page 19
The latest version o f ISO 9001, which was released in November 2008, and its
predecessor ISO 9001:2000 indicate that the standard is constituted by eight
principles (“ISO”, 2008). Thus, it is very possible that certified organizations may not
implement these principles in similar extents and may exhibit varying patterns of
implementation by paying extra attention to some principles that are in line with their
corporate strategies. The ISO 9000 series standards introduce the eight quality
management principles on which the quality management system standards are based.
The eight quality management principles as defined in ISO 9000:2005, Quality
management systems Fundamentals and vocabulary, and in ISO 9004:2000, Quality
management systems Guidelines for performance improvement are Customer focus,
Leadership , Involvement of people, Process approach, System approach to
management, Continual improvement , Factual approach to decision making and
Mutually beneficial supplier relationships. These principles can be used by senior
management as a framework to guide their organizations towards improved
performance. The principles are derived from the collective experience and
knowledge o f the international experts who participate in ISO Technical Committee
ISO/TC 176, Quality management and quality assurance, which is responsible for
developing and maintaining the ISO 9000 standards.
One o f the main requirements for acquiring the ISO 9000 standards is that a firm’s
quality system must be documented (Curkovic and Pagell, 1999). This is generally
done at two levels, a quality manual and a procedures manual (Nwankwo, 2000).
However the registration process for the ISO 9001 standards consists of an audit of
the implementation of the company’s documented quality system after it has been
verified and seen to conform to the requirements o f the applicable ISO 9001 standard.
A third party implements the audit (Ofori and Gang, 2001; Abraham et
11
Page 20
Registration is dependent on periodic follow up audits. Organization wishing to
remain registered must always maintain their quality system compliant to ISO 9001
standards.
ISO 9001 certification is not a standardised package that can be applied in the same
way in every organization (Singels et al., 2001). Although the same set of principles
and guidelines for ISO 9001 implementation is widely shared by organizations,
certified organizations in fact implement the standard in very different ways (Lee and
Yu, 2009). “The standards only recommend the essential elements of a proper quality
assurance system without recommending the way to apply them” (Tsioras and
Gotzamani, 1996 p. 66). ISO 9001 is a management control procedure (Yahya and
Goh, 2001) which involves a business in documenting the processes of design,
production and distribution to ensure that the quality of its products and services
meets the needs of customers (Quazi et al., 2002).
ISO 9001 is more to do with achieving conformance to predetermined standards than
it is to do with instilling the concept of excellence associated with customer
responsive management (Davis and Manrodt, 1996), or a customer value delivery
orientation throughout an organization (Woodruff, 1997). Najmi and Kehoe (2001)
and Heras et al (2002) suggested that ISO 9001 presents a sound basis for assuring the
customer o f the quality of the products and services, as well as the processes that
create them. The standards implementation may also contribute towards continuous
improvement since documentation and standardization are proposed as the first and
the last step of any formal improvement effort (Vonderembse, 1996). Documentation
o f processes offers a good opportunity for companies to evaluate and improve them,
12
Page 21
while the regular quality audits that are required by the standards offer important
improvement information to the companies that are willing to use it.
2.3.1 WHY FIRMS SEEK ISO 9001 CERTIFICATION
The choice o f implementing ISO 9000 family Quality Management Standards makes
a firm seek internal improvements and strategic benefits associated with the quality
program. The internal improvements include requiring that all business activities
related to a product be conducted in a three part continuous cycle of planning, control
and documentation leading to better documentation, greater quality awareness,
increased productivity and efficiency. External benefits will include good customer
perception on quality, improved customer satisfaction, increased competitive
advantage and reduced customer quality audit. This cycle along with a necessary
quality conformance system that maintains regular calibration of measuring and
testing equipments are some o f the immediate improvements. ISO 9001 aims to
prevent shipment of product that does not meet the quality standard, thereby reducing
the number o f returns from the buyer, warranty costs and reworking.
Reduction o f the number inspection of products from ISO 9001 certified firms also
becomes a strategic benefit to purchasing firms. Continuing improvement, marketing
strategy, customers’ requirements are reasons cited for seeking ISO Certification
(Naroola and Connell, 1996; Beattie and Sohal, 1999; Anderson et al., 1999). Jones el
al. (1997) have identified three main categories of reasons for seeking registration:
Non-developmental reasons: major customer(s) requiring certification, the desire not
to be locked out of future tendering processes or markets, realization that ISO
13
Page 22
certification is progressively becoming a requirement for doing business, the
opportunity to use ISO 9001 certification as a marketing and public relations tool.
Developmental reasons: the desire to improve the company’s internal processes, and
the desire to enhance the overall competitive performance of the company.
Mixed reasons: a combination o f developmental and non-developmental reasons.
ISO 9001 is also necessitated by the desire of a firm to meet customer requirements,
improving the quality o f work done, competitive advantage and as an important
strategy and requirement to compete more effectively in international market
(Mwihaki, 2006).
Pursuit o f ISO 9001 certification is primarily motivated by external forces such as
customer pressures, for advertising purposes, the need to enter the global marketplace
or competitive pressures (e.g., Anderson et al., 1999; Rayner and Porter, 1991; Beattie
and Sohal, 1999). These factors, among others, are used to explain the prevalence of
ISO 9000 certification among firms in the world today. A study on companies in«
Taiwan (Huamg et al., 1999) has shown the dominance of external factors in the
process o f deciding on the implementation of a quality assurance standard. On the
other hand, there is also evidence showing that the desire to create more efficient
processes (i.e. improving overall company’s performance) can be identified as an
important reason for certification (Vloeberghs and Bellens, 1996).
Anderson et al. (1999) find that US firms with higher exports to Europe are more
likely to seek ISO 9001 certification, and Corbett (2003) finds that exports drive early
certifications. Adams (1999) finds that ISO 9000 certification in New Zealand
increases with firm size, Tobin’s Q and market segmentation. Naveh and Marcus
(2000), using a detailed survey of ISO 9001 in the US, find that “going beyond” the
14
Page 23
requirements of the standard increases its value to the firm. King and Lenox (2001)
find some evidence that ISO 9001 and ISO 14000 certification respectively improve
firms’ environmental performance, suggesting that both standards do also have an
impact on production practices.
Taylor (1995) found that the four main reasons for seeking certification were
customer pressure, the desire to achieve improved efficiency and productivity, the
opportunity to develop higher-grade products, and image/marketing advantages. Van
der Wiele and Brown (1997), in a survey of 160 Western Australian companies,
identified similar reasons for seeking ISO 9001 certification, namely customer
requirements, the desire to improve customer service, marketing, internal efficiency,
and the utilization of ISO 9001 as the basis for a quality push.
Although the reasons for seeking ISO 9001 registration display considerable
variation, it can be concluded that companies are driven either by external
circumstances, internal drive, or both forces, to seek ISO 9001 certification.
2.4 EMPIRICAL LITERATURE
2.4.1 STOCK REACTION TO ISO 9001 CERTIFICATION
While award of ISO 9001 certification is an indication that the firm has an effective
quality improvement program in place, this information may not be a complete
surprise to the stock market and consumers because past actions of the firms could
have indicated to the stock market and consumers that the firm is trying to implement
15
Page 24
a quality improvement program. These actions could include press releases by the
firm about a shift in focus of the quality of its products and services; top management
o f the firm emphasizing the importance of quality in their meetings with employees,
suppliers, shareholders, and analysts; and the firm organizing high visibility events
such as employee recognition day on quality. Accordingly, the stock market may have
assigned a probability for the success of the quality improvement program, and hence
may have incorporated part of the value o f such programs even before the firm has
won a quality award.
The effect on expected future cash flows depends on whether improvements are made
in the conformance or the performance dimension of quality. Conformance is the
degree to which a product's design, manufacturing, and operating specifications meet
some predetermined standards. It is a measure o f the consistency of quality.
Performance refers to the primary operating characteristics of products. It is a measure
o f the level o f quality.
Docking and Dowen (1999), Beirao and Sarsfield (2002) and Nicolau and Sellers
(2002) found a positive effect in the stock markets o f the USA, Portugal and Spain.
However, Martfnez-Costa and Marti'nez-Lorente (2003) did not find positive effects
in the Spanish stock market and Aarts and Vos (2001) found a negative relationship in
the New Zealand market. Hendricks and Singhal (1996) in their research found out
that the stock market reacts positively to winning quality awards announcements and
implementing a quality improvement program that effectively improves conformance
quality is likely to have a positive impact on the net expected future cash flows of the
firm.
16
Page 25
2.4.2 ORGANIZATION PERFORMANCE
Two recent papers using longitudinal analysis and financial data are Corbett et al.
(2005) and Sharma (2005). They have found positive results o f ISO 9001
implementation. Corbett et al. (2005) have found that a firms’ decision to seek their
first ISO 9001 certification is indeed followed by significant abnormal improvements
in financial performance. They compared certified firms and not-certified firms before
and after certification and they measured financial performance using different
measures: ROA, ROS, cost of goods sold divided by sales, sales growth and asset
turnover. Sharma (2005) also compared both kinds of firms before and after
certification and used profit margin, sales growth and earnings per share as measures
o f financial performance.
Heras et al. (2002) presented some results that would undermine these previous
studies, since they found that certified companies had better results not only after
certification but also prior to the certification date, which could indicate that
companies only undertake the certification process when they have enough resources
and are not overwhelmed by negative results. Juran and Gryna (1980) develop the
notion of an optimal conformance level by trading off the appraisal and prevention
costs (the costs of achieving high quality) with the internal and external failure costs
(the costs of producing poor quality products). They argue that the optimal
conformance level implies a strictly positive proportion of defectives, and once the
optimal conformance level has been achieved, any attempt to improve further will
actually increase costs. The work of Romano (2000) presents a longitudinal analysis.
It compares the growth in different measures of performance six months before and
after certification. The sample is comprised of 100 Italian companies and the
17
Page 26
performance measures were internal and external quality, quality costs and timing
(cycle, manufacturing, punctuality in delivery etc.). The conclusions are that
registered companies improve their internal quality and the reliability of the
production process.
A reduction in the internal quality costs and an increase in the inspection costs are
also noticeable. An insight into the importance of having a developmental orientation
towards quality is provided by the study by Chapman et al. (1997) of large service and
manufacturing firms in Australia. They found that improved financial performance
(sales per employee) was linked to greater integration of quality plans into strategic
business plans. This relationship was found to be stronger in service firms than in
manufacturing ones. Jacobson and Aaker (1987) found product quality had a positive
influence on return on investment, market share and price.
The results o f an extensive study by Terziovski et al. (1997) o f 1,341 manufacturing
sites were contradictory. They concluded that the presence or absence o f ISO 9001
certification is a poor indicator o f organizational performance and quality as measured
with respect to defect rates, warranty costs, and other key measures such as full on-
time delivery. Batchelor (1992) supports this view by providing empirical evidence
showing that only 15 percent of the 647 certified manufacturing and service
organizations had derived business value on nine dimensions of organizational
performance. These dimensions were market share, new customers, customer
satisfaction, procedural efficiency, staff motivation, staff attitudes, error rates,
wastage, and costs.
18
Page 27
An investigation of 65 firms in the furniture industry (Forker et al., 1996) discovered
that quality defined as conformance to specification was significantly related to sales
growth and the return achieved on the sales growth. These findings indicate the
powerful impact that better conformance can have on reducing costs, attracting and
retaining customers.
Yeung et al. (2003) conducted empirical research in the Hong Kong electronics
industry to study how the “objectives of gaining ISO certification”, the “attitudes to
implementation” and “confidence of understanding the standard” among senior
management affect the development o f a quality management system and
organizational performance. Their results revealed that the likely cause o f ISO 9001
ineffectiveness at enhancing organizational performance was senior executives1
“incorrect” understanding of and attitudes to the standard. This is supported by a
recent rigorous empirical study (Terziovski et al., 1997) of 1,000 firms in Australia
and New Zealand that found that Quality certification had no significant, positive
relationship with business performance. They noted that the principal motivation for
pursuing Quality certification was the ability of the certificate to open customers'
doors that were previously closed, or would close, if Quality certification were not
achieved.
Surveys by Terziovski et al. (1997) and Singels et al. (2001) find no link between ISO
9000 and organizational performance among Australian and Dutch firms respectively,
though Terziovski et al. (2003) do find that higher reported business performance is
positively associated with a broader set of motivations for seeking ISO 9001
certification. Casadesus et al. (2001) find that Basque companies report substantial
operational and financial benefits from certification.
19
Page 28
A study conducted by the Australian Manufacturing Council (1994) found that
managers o f certified companies, particularly those working in the export market,
voiced similar views that customer perception of product quality increases following
certification. Firms with a high level of adoption in the principles ISO 9001
outperformed those with a relatively lower level of adoption in both overall
performance and behavioural response (Lee and Yu, 2009), lending support to
Deming’s (1982) quality chain reaction theory, which states that focus on quality will
lead to outcomes such as employee and customer satisfaction, efficiency, and
profitability.
2.4.3 QUALITY AND COST
Empirical studies have found that quality and costs are positively correlated for
differentiated-product businesses and capital good businesses (Gale and Branch 1982
and Phillips et al. 1983). It is reasonable to expect that a product with high
performance quality will be more expensive to produce as it can require more reliable
and durable components, more effort in designing the product, and more labour hours
in manufacturing, and more of other resources. Since costs and prices are generally
positively correlated, one would expect that high performance quality products will
sell at higher prices. This suggests that a high performance product will sell in smaller
volume, and may have a smaller market share. These are businesses where quality is
likely to be equated with the performance dimension.
The empirical evidence on the relation between performance quality and price is
mixed. Using quality ratings developed by Consumer Reports, which typically focus
20
Page 29
on product performance, Reisz (1979) found that nondurables generally had a weak or
negative correlation between quality and price, whereas durables showed a strong
positive correlation. Studies based on experimental data instead of market data found
a positive correlation (McConell, 1968). Garvin's (1983) study of the room air
conditioning industry, and Abernathy et al. (1981) study of the automobile industry,
shows that manufacturers with higher conformance quality have lower costs.
Surveys that have collected data on quality costs (Crosby 1979) provide additional
evidence that conformance level and costs are inversely related. Studies based on
PIMS data base also find that quality and costs are negatively related for
homogeneous products (Gale and Branch 1982), and in component and supplies
businesses (Phillips et al. 1983). On the other hand, Deming (1982) and Crosby
(1979) prescribe that the optimal conformance level is zero defects. This prescription
is based on the belief that producing higher conformance quality products is always
less costly than producing low conformance quality products. This has led to the
famous claim by Crosby (1979) that quality is "free."
Mcadam and Mckeown (1999) found that the benefits of ISO 9001 implementation
far exceeded the costs. They suggested that companies should view ISO 9001 as the
starting point for TQM implementation, rather than as the terminus o f their quality
“journey”. The main benefits o f certification appeared to be a reduction in customer
complaints, increased productivity, lower costs, increased sales and improved control
within the enterprise. Sun (2000) found better warranty costs, quality costs, defect
rates and customer satisfaction o f certified firms in a sample of 316 Norwegian
companies.
21
Page 30
2.4.4 MANAGERIAL CONTROL AND EMPLOYEE INVOLVEMENT
Flynn et al.’s (1995) study of the transportation, electronics and machinery industries
found that good internal quality (made right first time) was associated with greater
employee involvement and better process control. Greater employee involvement
could be associated with the total quality ideal, while better process control should
com e from the quality control that underpins good quality assurance systems. This
indicates that better process control should lead to lower rework and diminishing costs
o f quality.
Vloeberghs and Bellens (1996) also note that ISO 9001 implementation causes both
internal and external changes within an organization. Internally, the company will
develop a robust system of procedures, with clearly defined responsibilities and duties
that will help to clarify the organizational structure. Externally, the company will be
better able to respond to customers’ needs, and the level of trust between the company
and its customers will be increased.
A study by Van der Wiele and Brown (1997) revealed that the immediate benefits of
certification included an enhanced awareness of quality and related issues, improved
customer service, strengthened managerial control, and greater uniformity in product
and service quality; at the same time, it appeared that some benefits might take a
longer period to emerge. They suggested that, for the quality system to operate
effectively, it was important that managers viewed ISO 9001 certification as merely
the starting point for improving the company’s internal procedures rather than an end
in itself, and that employees’ were committed to, and participated actively in, the
process of implementation.
22
Page 31
From the point of view of documentation, Joubert (1998) pointed out that ISO
certification enables employees to communicate ideas to one another and review and
alter current processes so that operational procedures are uniform between different
work stations; this also reduces the time needed to train employees. As regards
external benefits, certification makes the company’s existing and potential customers
aware that the company is seeking to provide better product quality; the company can
therefore expect to enjoy greater customer loyalty and enjoy a competitive advantage,
with a consequent increase in sales. Tzelepis et al. (2006) argue that the adoption of
ISO 9001 reduces managerial inefficiency, rather than being a new production factor.
2.4.5 STRATEGIC BENEFIT
Findings from the World-class Manufacturing Project (Flynn et al., 1997) indicate
that achieving conformance to specification with low levels o f rework has a direct
effect on competitive advantage, while management perception o f the plant's product
quality and customer service, relative to its competitors (quality differential), had an
even greater impact. "Right first time" was strongly associated with better process
flow management while quality differential was shown to be linked with better
process management and quality control.
Huamg (1998) conducted a questionnaire survey to study the motivations and benefits
for implementing ISO 9001 in Taiwan. He reported that ISO 9001 provided
significant benefits of internationalisation, quality management, enhancing sales, and
cost reduction for small and medium-sized enterprises. Moreover, he suggested that
implementing ISO 9001 with the active motivation of improving enterprises and
23
Page 32
internationalisation would lead to quality improvement as time progresses. Adanur
and Allen (1995), in a survey of 150 textile companies, identified five benefits of ISO
9001: reduced customer complaints and improved supplier quality, better involvement
of people, restriction of inferior-quality products from being shipped, increased
business, and reduced costs.
Motwani et al. (1996) have summarized the benefits o f ISO 9001 into six categories;
doing business with European countries, recognition by the international community,
marketing edge, improvement in quality, productivity and costs reduction in the need
for second-party audits by prospective customers. Beattie and Sohal (1999) claim that
the main strategic business benefit that ISO 9001 certification provides is an improved
relationship with customers, leading to increased market share. The main operational
business benefit is the documentation of operational procedures, which strengthens
employee capabilities and allows the company to respond more quickly to changes in
market demand. They also reported that when companies derive benefits from their
ISO 9001 certification efforts, virtually all of these benefits are reported as operational
improvements, such as improved efficiencies, reductions in operating costs,
reductions in scrap, and fewer defects. Certification does thus lead to an improvement
in product quality.
In their discussion of whether ISO 9001 certification is beneficial to Taiwanese
companies, Huamg et al. (1999) suggest that certification was found to provide
significant benefits in terms of improved quality, enhanced international
competitiveness, reduced costs and increased sales. The external effectiveness that
ISO 9001 can provide for companies mainly takes the form of enhanced customer
24
Page 33
loyalty resulting from the improved relationships with customers due to the reduction
in complaints. This in turn can lead to increased sales and higher market share.
Calisir et al. (2005), in a survey o f 43 ISO 9001 certified Turkish textile companies,
reported that most benefits of certification were actually associated with increased
product quality, reduced error/defect rate in production, and increased overseas
market share. Atwater and Discenza (1993) reported that their respondents from a
sample of 29 firms listed the ISO 9001 registration benefits as follows: improved
plant operating efficiency, greater customer satisfaction, and improved competitive
position. A study by Beattie and Sohal (1999) found that improved market share was
the number one benefit in the list o f strategic business benefits, supported by customer
service, which in turn was the second most important operational benefit.
Rayner and Porter (1991) emphasized the fact that certification tends to result in
improved marketing. Magd et al. (2003) conducted a survey of 140 ISO 9001 (or
9002) certified manufacturing companies in Saudi Arabia. They successfully obtained
feedback from 83 companies which were registered to either ISO 9001 or ISO
9002:1994. The results o f the study suggested that an increase in quality awareness,
an improvement in quality system efficiency and an improvement in customer service
were found to be the most important benefits of ISO 9001. Shih et al. (1996) studied
Taiwanese companies that had secured ISO 9001 certification, and found that
certification provided significant benefits in terms of increased employee
productivity, superior documentation systems, better quality control, enhanced sales
competitiveness and clear division of responsibility. If a company adopts the right
attitude and makes effective use o f the documentation of quality processes, this can
reduce the company’s wastage rate, reduce delivery times, and allow the company to
25
Page 34
achieve more success in preventing problems from occurring. If, on the other hand, a
company’s management becomes complaisant after securing certification, this can
lead to a loss o f direction that can be extremely dangerous.
Using the Profit Impact o f Marketing Strategies (PIMS) data base, Buzzell and
Wiersema (1981), Craig and Douglas (1982) and Phillips, Chang, and Buzzell (1983)
among others, confirm the positive association between quality and market share.
They find that businesses that improved quality in the 1970s increased their market
share five to six times faster than those that declined in quality, and three times faster
than those whose relative quality remained unchanged. A source o f potential benefits
of ISO 9001 adoption comes from process improvement in terms o f productivity
gains, cost and waste reduction, the elimination o f procedural problems, better
management control, quality enhancement and efficiency improvement (Bhuiyan and
Alam, 2005; Casadesu's and Karapetrovic, 2005). Other possible mechanisms that
influence firm performance have to do with marketing reasons. Acquisition and
retention of customers, entry into new markets and fewer dissatisfied customers have
been cited as marketing advantages of certification (Buttle, 1997).
2.4.6 CRITICISM OF ISO 9001 CERTIFICATION
Almost from its inception, critics have denounced ISO 9001 as being strong on form
and short on substance. Chen (2001) reported that, although certification led to an
upgrading o f the quality system, allowed transactions to proceed more smoothly,
reduced the number of customer complaints and caused the defect rate to fall, it also
led to an increase in the amount of documentation that had to be processed and caused
manufacturing cost to rise.
26
Page 35
In contrast to the studies reporting business benefits, Batchelor's (1992) study of over
600 registered UK firms, found that only 15 per cent o f firms achieved gains from
quality certification. These benefits were largely internal, such as reduction in error
rates and procedural efficiency, rather than external dimensions such as market share.
Beattie and Sohal (1999) state that certified quality management systems per se do not
achieve major benefits, but when they are combined with quality-improvement
initiatives, substantial improvements can be expected. Dalgleish (2002) criticizes the
ISO 9001 process by pointing out that the process requires an inordinate and
unnecessary paperwork. He also points out that as the certificate leads to a pass/fail
mentality, the ISO 9001 certificate hinders quality and efficiency, the very things it is
supposed to encourage. Singels et al. (2001) found worse ROA, productivity, cash
flow, market share, sales growth and market growth o f certified companies.
Corrigan (1994), Henkoff (1993), Johannsen (1995), Stephens (1994), negative view
is based are summarized in the following: implementation of the standards may result
in the development of a static quality system, which increases bureaucracy and
reduces flexibility and innovation. Excessive obedience to the documented procedures
may discourage critical thinking, while in many cases process standardization acts as
a barrier for processes improvement. Effective thinking should continuously criticise
the basic principles described in written procedures and search for innovations.
Implementation of the standards cannot be considered as a sign o f top management
commitment to quality since many believe that the “true” motives behind certification
are mainly related to the possession of the certificate itself and not to the quality
improvement that it may offer. In cases of bad implementation, the company is more
likely to move one step backwards, instead of forwards because of the general
27
Page 36
disappointment and resentment that may be caused to the employees as a result of
excessive bureaucracy and workload.
Another criticism of the standard is that they cannot guarantee efficiency. Auditors
check the existence of the necessary procedures to ensure conformance to the
standards requirements but they do not check the efficiency of these procedures. A
quality system may be too complex and inefficient and still be certified.
Implementation o f the standards cannot really guarantee effectiveness in terms of
customer satisfaction since the emphasis is on conforming to company driven
specifications and not to the true customer requirements. But the only judge of quality
is the customer and not the certification body.
Taylor (1995) conducted a survey o f senior executives in 682 organizations to study
organizational difference in ISO 9001 implementation practices. O f the 682
responses, 115 were from organizations registered to ISO 9001. Taylor found that
there were significant differences in ISO 9001 implementation practice between large,
medium and small organizations. He reported that small organizations were shown to
have particular problems in terms o f understanding the purpose of ISO 9001, methods
of measuring its business impact, and knowledge o f where the potential benefits
might lie. On the positive side, small organizations were more likely to seek
registration for all activities
2.7 SUMMARY AND CONCLUSION
The analysis o f the literature shows that the effect of ISO 9001 certification on
company results is not clear. ISO certification might be seen as a strategic tool that
could facilitate the creation of a competitive advantage, and that managers could
28
Page 37
'c n t 33 3 cost r*-control tool. Using different methodologies, some
csults but others have found negative ones. There is
enough to be compelling to support the broad range of
ed quality certification is associated with lower costs
i quality improvement or increased market sales through
qualu\ and improved market opportunities. It is clear, from the
mess performance that better quality does have a consistent
T "ith improved business performance but other studies show
*** *8*1 c following ISO certification. The review also shows that factors
** ' 1 ' 1 qiulit> assurance systems, such as effective process control,
8** *y coWns and better conformance quality, are linked to better business
pvfaflMKC Although the balance appear to be more inclined towards the positive
M lly p o tliu is , the evidence is not decisive and it is necessary to add more research
«*«Amcc to the topic.
29
Page 38
C H A P T E R T H R E E
RESEARCH METHODOLOGY
3.1 INTRODUCTION
This chapter presents the research design and methodology that was used to carry
out the research. It presents the research design, the population, sample size and
sampling procedure, data collection and data analysis.
3.2 RESEARCH DESIGN
Research design refers to the way the study is designed, that is the method used to
carry out the research. In the study correlational research was used in the study.
Correlational research attempts to determine whether and to what degree a
relationship exists between two or more quantifiable variables.
3.3 TARGET POPULATION
The study focused on firms listed at the Nairobi Stock Exchange that have been
certified to ISO 9001 Quality Management System standard from the years 1999 to
2009 and those that have not been certified over the same window period.
3.4 SAMPLING PROCEDURE
Random sampling is the process o f selecting a sample in such a way that all
individuals in the defined population have an equal and independent chance o f being
selected for the sample. Simple random sampling method was used to select the firms
that have been ISO 9001 certified and those that that have not been ISO 9001 certified
30
Page 39
from the target population. The method spreads the sample more evenly over the
population and is easier to conduct
3.5 DATA COLLECTION AND ANALYSIS
The research was carried out using secondary data from published financial
accounting statements. For this study, earnings per share (EPS) is used as dependent
variable to measure overall financial performance of firms. The Independent variables
are given below together with a brief justification for their inclusion:-
Sales is used since it is believed that an ISO 9001 certified firm attracts more
customers compare to a non-ISO certified firm thus increasing sales. Foker et al.,
(1996) found that quality defined as conformance to specification was significantly
related to sales growth through the fact that better quality attracted and retained more
customers.
Operating expenses is included since ISO 9001 is supposed to reduce internal costs
and thus improve business performance (Maani et al., 1994; Flynn et al., 1995). This
is also in line with Deming (1986), who purports that as quality improves, waste is
eliminated leading to a reduction costs and an improvement in financial performance.
Size (Company size) is included to control the size effects on performance.
Age is included because Finley and Buntzman (1994) argued that the performance of a
company is influenced by its age. Age refers to the number of years a company is
listed on Nairobi Stock Exchange.
ISO Status is coded as ISO Status: ISO 9001 certified=l and non-ISO 9001
certified=0. The variable ISO status is used in the pooled panel data.
31
Page 40
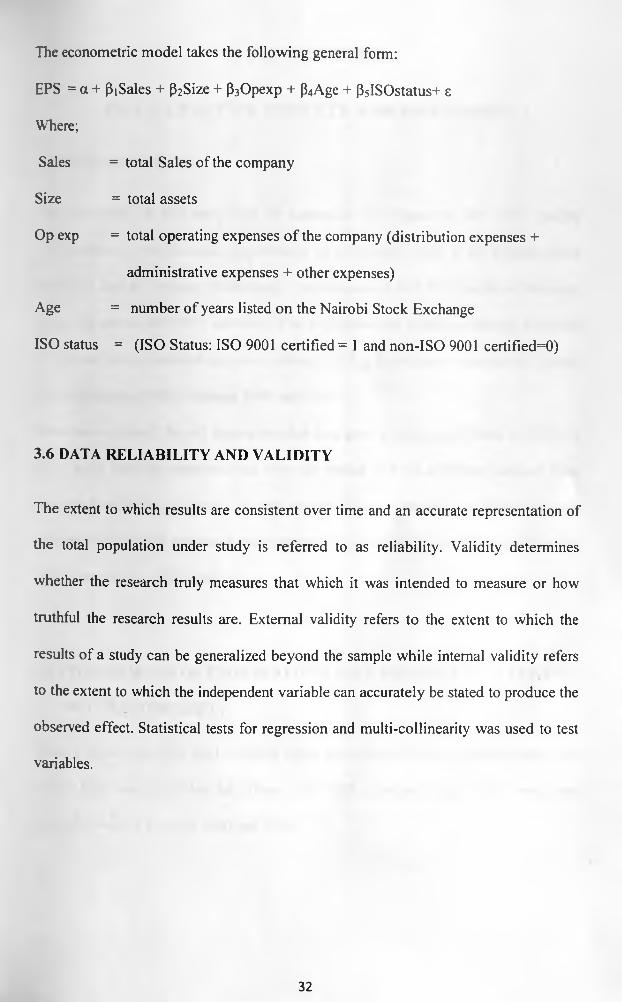
The econometric model takes the following general form:
EPS = a + ^Sales + P2 Size + p3Opexp + P4Age + P5 lSOstatus+ e
Where;
Sales = total Sales of the company
Size = total assets
Op exp = total operating expenses o f the company (distribution expenses +
administrative expenses + other expenses)
Age = number o f years listed on the Nairobi Stock Exchange
ISO status = (ISO Status: ISO 9001 certified = 1 and non-ISO 9001 certified=0)
3.6 DATA RELIABILITY AND VALIDITY
The extent to which results are consistent over time and an accurate representation of
the total population under study is referred to as reliability. Validity determines
whether the research truly measures that which it was intended to measure or how
truthful the research results are. External validity refers to the extent to which the
results of a study can be generalized beyond the sample while internal validity refers
to the extent to which the independent variable can accurately be stated to produce the
observed effect. Statistical tests for regression and multi-collinearity was used to test
variables.
32
Page 41
C H A P T E R FO U R
DATA ANALYSIS, RESULTS AND DISCUSSION
4.1 INTRODUCTION
The objectives o f this study was to determine the impact of ISO 9001 Quality
Certification on the financial performance of companies listed at the Nairobi Stock
Exchange and to compare the financial performance o f ISO 9001 certified firms and
those that are not ISO 9001 certified . The population and sample o f interest consisted
o f all companies (certified and non-certified) trading in ordinary shares at the Nairobi
Stock Exchange (NSE) between 1999 and 2009.
Data was collected for all companies that had been continuously listed at NSE for
these years and had complete data over this period. A total o f fifteen certified firms
w'ere included in the analysis. For each certified firm, a control non-certified firm was
selected and the data compared over the same time period (3years before certification
and 3years after certification).
4.2 COMPARISONS OF FIRM PERFORMANCE BEFORE AND AFTER ISO
9001 CERTIFICATION
Table 1 shows the ISO 9001 certified firms listed at NSE that were included in the
study. Data was available for fifteen ISO 9001 certified firms. The firms were
certified between the year 2000 and 2009.
33
Page 42
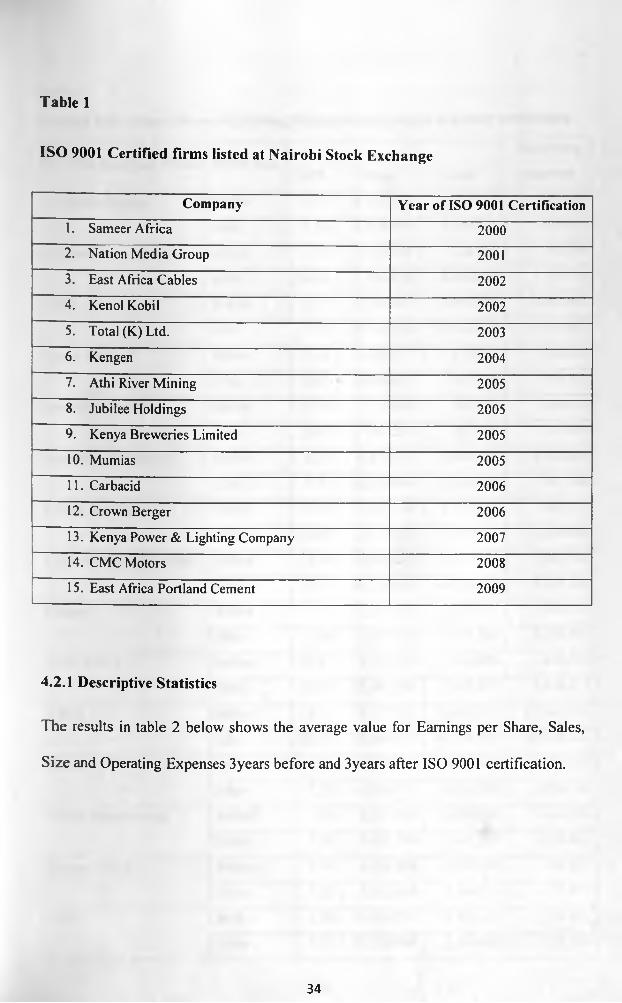
Table 1
ISO 9001 Certified firms listed at Nairobi Stock Exchange
Company Year of ISO 9001 Certification1. Sameer Africa 20002. Nation Media Group 2001
3. East Africa Cables 2002
4. Kenol Kobil 2002
5. Total (K) Ltd. 2003
6. Kengen 2004
7. Athi River Mining 2005
8. Jubilee Holdings 2005
9. Kenya Breweries Limited 2005
10. Mumias 2005
11. Carbacid 2006
12. Crown Berger 2006
13. Kenya Power & Lighting Company 2007
14. CMC Motors 2008
15. East Africa Portland Cement 2009
4.2.1 Descriptive Statistics
The results in table 2 below shows the average value for Earnings per Share, Sales,
Size and Operating Expenses 3years before and 3years after ISO 9001 certification.
34
Page 43
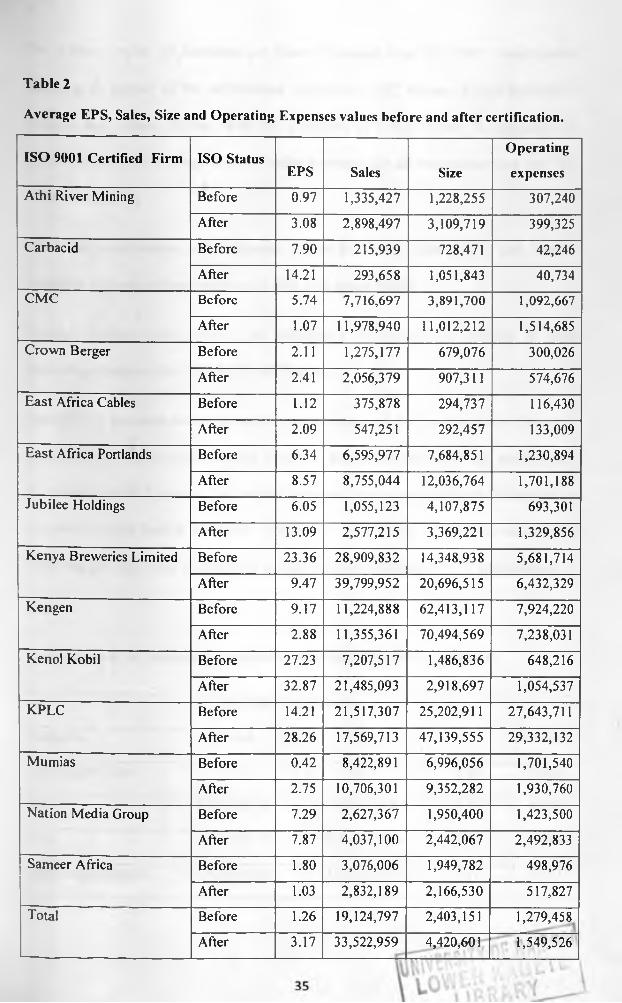
Table 2
Average EPS, Sales, Size and Operating Expenses values before and after certification.
ISO 9001 Certified Firm ISO StatusEPS Sales Size
Operating
expensesAthi River Mining Before 0.97 1,335,427 1,228,255 307,240
After 3.08 2,898,497 3,109,719 399,325Carbacid Before 7.90 215,939 728,471 42,246
After 14.21 293,658 1,051,843 40,734CMC Before 5.74 7,716,697 3,891,700 1,092,667
After 1.07 11,978,940 11,012,212 1,514,685Crown Berger Before 2.11 1,275,177 679,076 300,026
After 2.41 2,056,379 907,311 574,676East Africa Cables Before 1.12 375,878 294,737 116,430
After 2.09 547,251 292,457 133,009
East Africa Portlands Before 6.34 6,595,977 7,684,851 1,230,894
After 8.57 8,755,044 12,036,764 1,701,188Jubilee Holdings Before 6.05 1,055,123 4,107,875 693,301
After 13.09 2,577,215 3,369,221 1,329,856Kenya Breweries Limited Before 23.36 28,909,832 14,348,938 5,681,714
After 9.47 39,799,952 20,696,515 6,432,329Kengen Before 9.17 11,224,888 62,413,117 7,924,220
After 2.88 1 1,355,361 70,494,569 7,238,031
Kenol Kobil Before 27.23 7,207,517 1,486,836 648,216
After 32.87 21,485,093 2,918,697 1,054,537
k p l c Before 14.21 21,517,307 25,202,911 27,643,711
After 28.26 17,569,713 47,139,555 29,332,132
Mumias Before 0.42 8,422,891 6,996,056 1,701,540
After 2.75 10,706,301 9,352,282 1,930,760
Nation Media Group Before 7.29 2,627,367 1,950,400 1,423,500
After 7.87 4,037,100 2,442,067 2,492,833
Sameer Africa Before 1.80 3,076,006 1,949,782 498,976
After 1.03 2,832,189 2,166,530 517,827
Total Before 1.26 19,124,797 2,403,151 1,279,458
After 3.17 33,522,959 4,420,601 1,549,526
Page 44
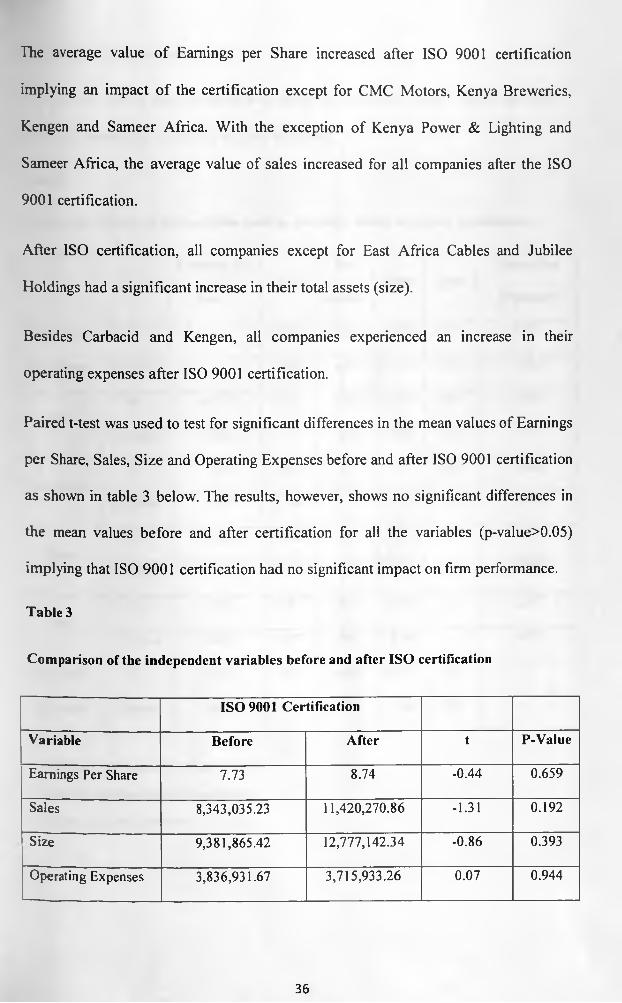
The average value o f Earnings per Share increased after ISO 9001 certification
implying an impact o f the certification except for CMC Motors, Kenya Breweries,
Kengen and Sameer Africa. With the exception of Kenya Power & Lighting and
Sameer Africa, the average value of sales increased for all companies after the ISO
9001 certification.
After ISO certification, all companies except for East Africa Cables and Jubilee
Holdings had a significant increase in their total assets (size).
Besides Carbacid and Kengen, all companies experienced an increase in their
operating expenses after ISO 9001 certification.
Paired t-test was used to test for significant differences in the mean values of Earnings
per Share, Sales, Size and Operating Expenses before and after ISO 9001 certification
as shown in table 3 below. The results, however, shows no significant differences in
the mean values before and after certification for all the variables (p-value>0.05)
implying that ISO 9001 certification had no significant impact on firm performance.
Table 3
Comparison of the independent variables before and after ISO certification
ISO 9001 Certification
Variable Before After t P-Value
Earnings Per Share 7.73 8.74 -0.44 0.659
Sales 8,343,035.23 11,420,270.86 -1.31 0.192
Size 9,381,865.42 12,777,142.34 -0.86 0.393
Operating Expenses 3,836,931.67 3,715,933.26 0.07 0.944
36
Page 45
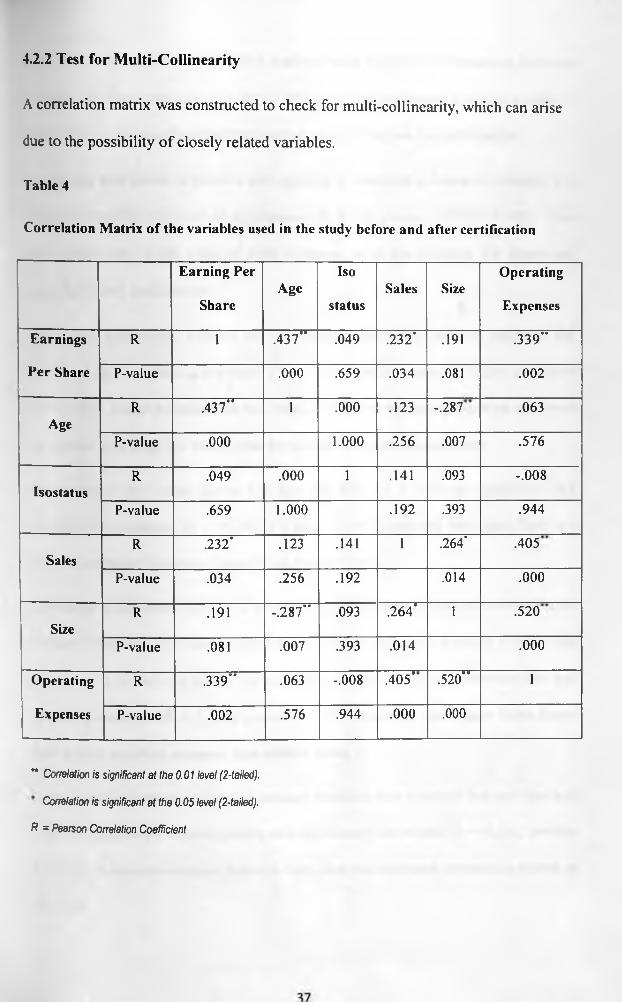
4.2.2 Test for Multi-Collinearity
A correlation matrix was constructed to check for multi-collinearity, which can arise
due to the possibility o f closely related variables.
Table 4
Correlation Matrix of the variables used in the study before and after certification
Earning Per
ShareAge
Iso
statusSales Size
Operating
Expenses
Earnings R 1 .437" .049 .232' .191 .339”
Per Share P-value .000 .659 .034 .081 .002
AgeR . _ _** .437 1 .000 .123 ---.287 .063
P-value .000 1.000 .256 .007 .576
IsostatusR .049 .000 1 .141 .093 -.008
P-value .659 1.000 .192 .393 .944
SalesR .232' .123 .141 1 .264' .405
P-value .034 .256 .192 .014 .000
SizeR .191 -.287” .093 .264' 1 _ _ „ .520
P-value .081 .007 .393 .014 .000
Operating R .339” .063 -.008 .405” .520” 1
Expenses P-value .002 .576 .944 .000 .000
” Correlation is significant at the 0.01 level (2-tailed).
Correlation is significant at the 0.05 level (2-tailed).
R = Pearson Correlation Coefficient
Page 46
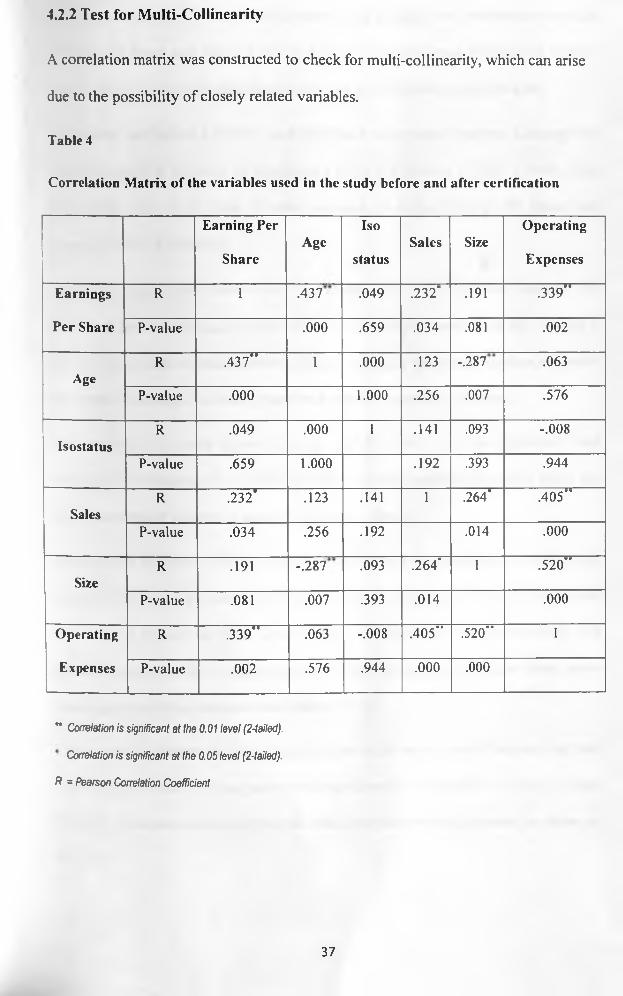
4.2.2 Test for Multi-Collinearity
A correlation matrix was constructed to check for multi-col linearity, which can arise
due to the possibility of closely related variables.
Table 4
Correlation Matrix of the variables used in the study before and after certification
Earning Per
ShareAge
Iso
statusSales Size
Operating
Expenses
Earnings R 1 .437 .049 .232’ .191 .339”
Per Share P-value .000 .659 .034 .081 .002
AgeR .437” 1 .000 .123 -.287 .063
P-value .000 1.000 .256 .007 .576
IsostatusR .049 .000 1 .141 .093 -.008
P-value .659 1.000 .192 .393 .944
SalesR .232' .123 .141 1 .264' .405"
P-value .034 .256 .192 .014 .000
SizeR .191 -.287 .093 .264' 1 .520"
P-value .081 .007 .393 .014 .000
Operating R ------r r r ”-----.339 .063 -.008 .405” .520" 1Expenses P-value .002 .576 .944 .000 .000
* * Correlation is significant at the 0.01 level (2-tailed).
Correlation is significant at the 0.05 level (2-tailed).
R = Pearson Correlation Coefficient
37
Page 47
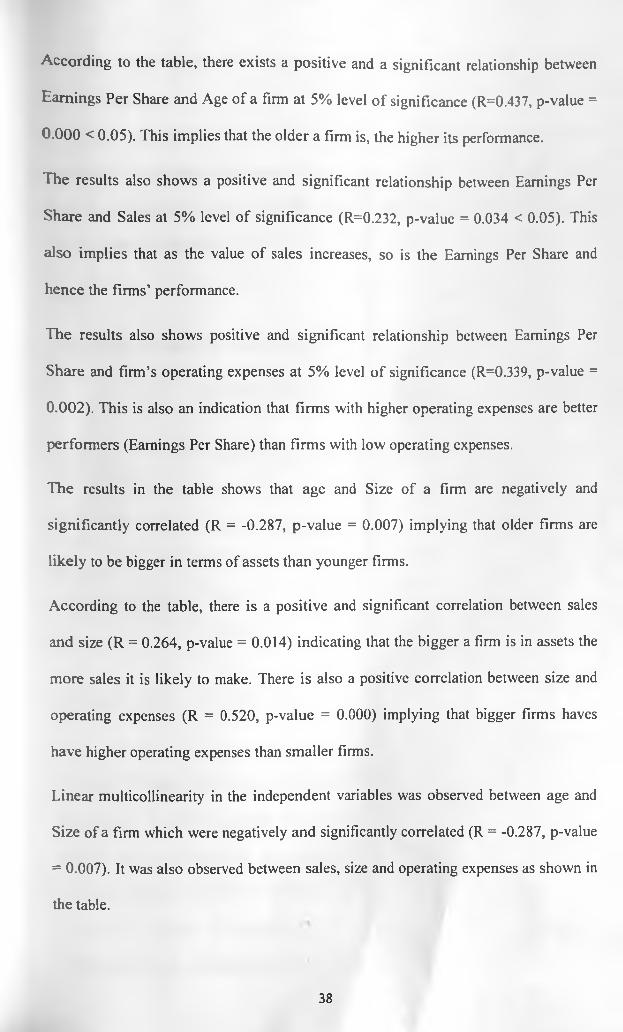
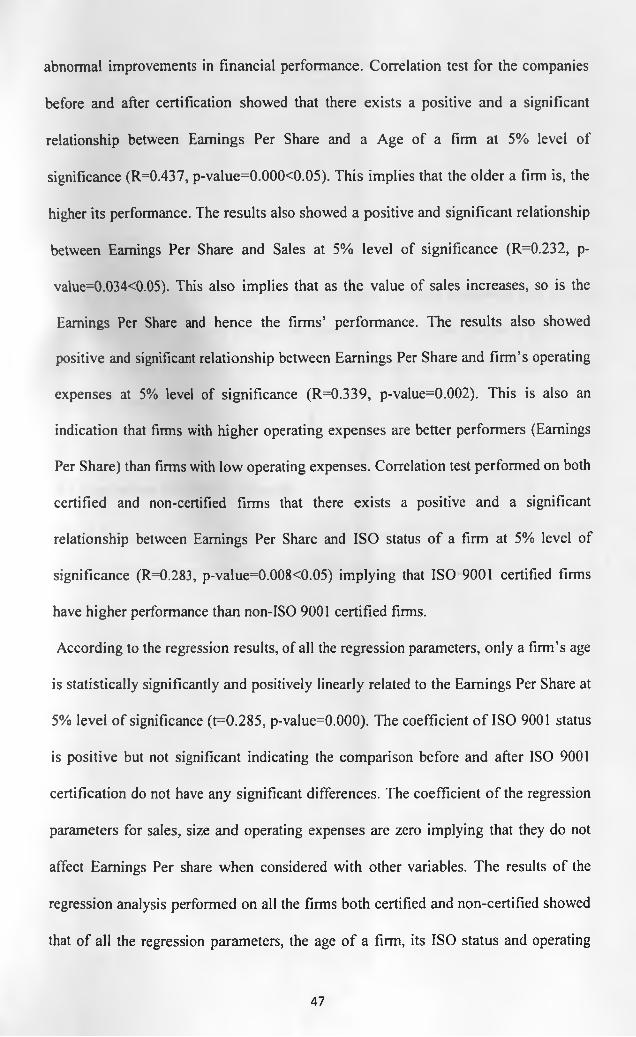
According to the table, there exists a positive and a significant relationship between
Earnings Per Share and Age of a firm at 5% level o f significance (R=0.437, p-value =
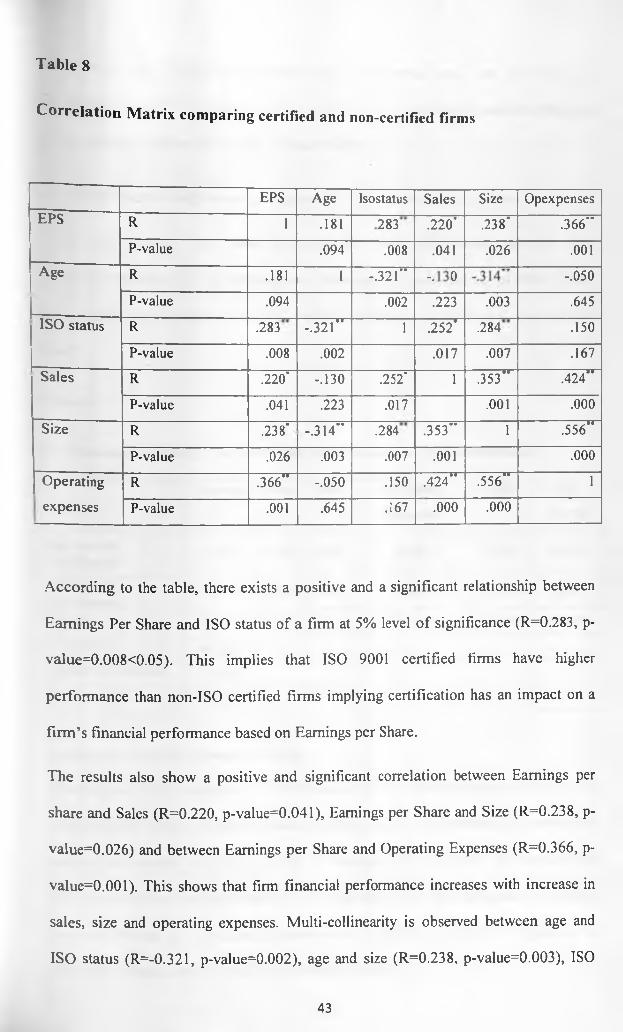
0.000 < 0.05). This implies that the older a firm is, the higher its performance.
The results also shows a positive and significant relationship between Earnings Per
Share and Sales at 5% level of significance (R=0.232, p-value = 0.034 < 0.05). This
also implies that as the value o f sales increases, so is the Earnings Per Share and
hence the firms’ performance.
The results also shows positive and significant relationship between Earnings Per
Share and firm’s operating expenses at 5% level o f significance (R=0.339, p-value =
0.002). This is also an indication that firms with higher operating expenses are better
performers (Earnings Per Share) than firms with low operating expenses.
The results in the table shows that age and Size of a firm are negatively and
significantly correlated (R = -0.287, p-value = 0.007) implying that older firms are
likely to be bigger in terms of assets than younger firms.
According to the table, there is a positive and significant correlation between sales
and size (R = 0.264, p-value = 0.014) indicating that the bigger a firm is in assets the
more sales it is likely to make. There is also a positive correlation between size and
operating expenses (R = 0.520, p-value = 0.000) implying that bigger firms haves
have higher operating expenses than smaller firms.
Linear multicollinearity in the independent variables was observed between age and
Size of a firm which were negatively and significantly correlated (R = -0.287, p-value
= 0.007). It was also observed between sales, size and operating expenses as shown in
the table.
38
Page 48
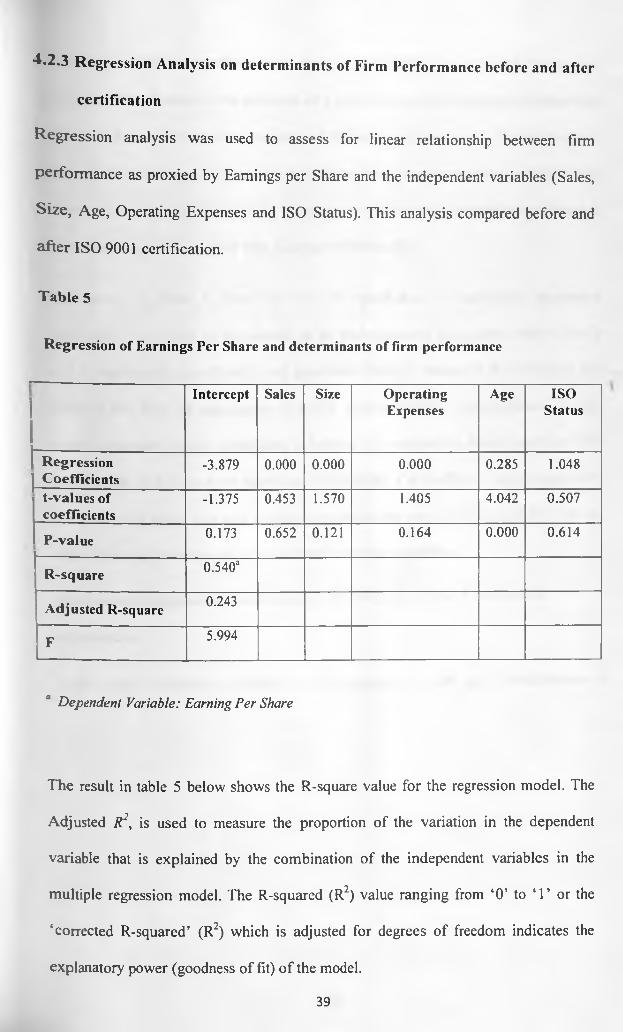
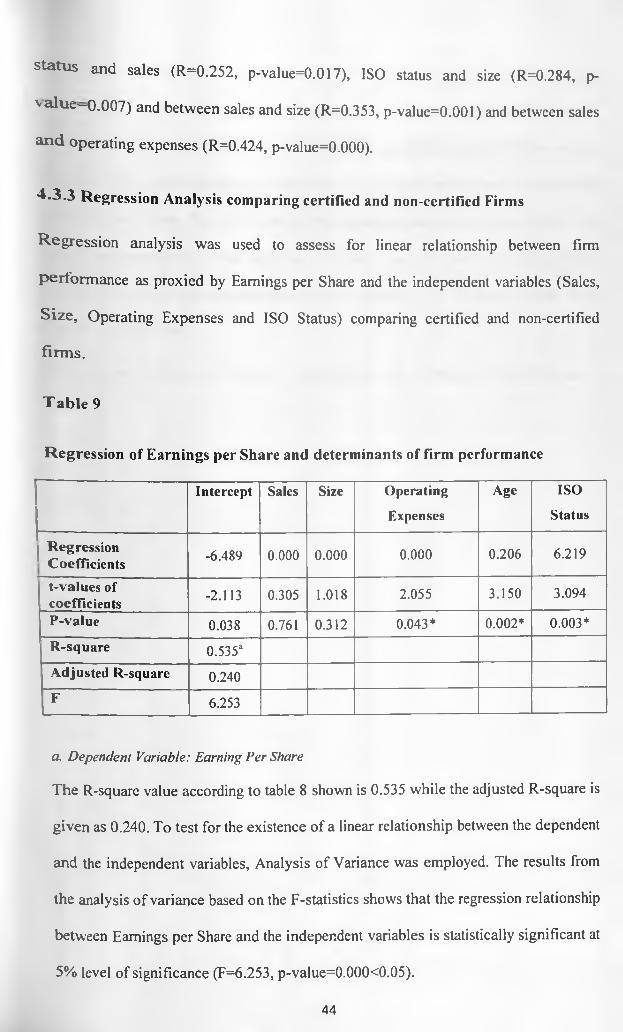
■*•2.3 Regression Analysis on determinants of Firm Performance before and after
certification
R egression analysis was used to assess for linear relationship between firm
perform ance as proxied by Earnings per Share and the independent variables (Sales,
S ize, Age, Operating Expenses and ISO Status). This analysis compared before and
after ISO 9001 certification.
Table 5
Regression of Earnings Per Share and determinants of firm performance
Intercept Sales Size OperatingExpenses
Age ISOStatus
RegressionCoefficients
-3.879 0.000 0.000 0.000 0.285 1.048
t-values of coefficients
-1.375 0.453 1.570 1.405 4.042 0.507
P-value 0.173 0.652 0.121 0.164 0.000 0.614
R-square 0.540a
Adjusted R-square 0.243
F 5.994
J Dependent Variable: Earning Per Share
The result in table 5 below shows the R-square value for the regression model. The
Adjusted R2, is used to measure the proportion of the variation in the dependent
variable that is explained by the combination of the independent variables in the
multiple regression model. The R-squared (R2) value ranging from ‘O’ to ‘1’ or the
‘corrected R-squared’ (R2) which is adjusted for degrees of freedom indicates the
explanatory power (goodness of fit) o f the model.
39
Page 49
^ le R-square value according to the table is 0.540 while the adjusted R-square is
g iven as 0.243. To test for the existence o f a linear relationship between the dependent
a n d the independent variables, Analysis o f Variance was employed. The results from
th e analysis o f variance based on the F-statistics shows that the regression relationship
be tw een Earnings per Share and the independent variables is statistically significant at
5 % level of significance (F=5.994, p-value=0.000<0.05).
The results in table 5 show the test of significance o f individual regression
parameters. According to the results, o f all the regression parameters, only a firm’s
age is statistically significantly and positively linearly related to the Earnings Per
Share at 5% level o f significance (t=0.285, p-value=0.000). The coefficient of ISO
status is positive but not significant indicating the comparison before and after ISO
certification do not have any significant differences. The coefficient of the regression
parameters for sales, size and operating expenses are zero implying that they do not
affect Earnings Per share when considered with other variables.
The resultant regression equation based on the findings in table 5 can then be
expressed as;
EPS = -3.879 + 0.000Sales +0.000Size +0.000OpExpenses + 0.285 Age + 1.048 ISOStatus +e
40
Page 50
4 3 C ° M P A R I S 0 N OF ISO 9001 CERTIFIED AND NON-CERTIFIED FIRMS
4'3 '1 ^ esc **»ptive statistics comparing certified and non-certified firms.
Independent t-test was used to test for significant differences in the mean values of
Earnings per Share, Sales, Size and Operating Expenses between ISO 9000 certified
firms and non-certified firms.
Table 6a
A v era g es for EPS, Sales, Size and Operating Expenses for non-ISO 9001 certified firm s
N o n -IS O 9001 C e r tif ie d Firms EPS Sales Size O perating
expensesB am buri Cement 9.2 22,100,333 18,774,667 8,611,000
B A T 14.3 15,297,898 5,529,351 7,192,647
B O C 12.0 1,200,580 1,375,947 317,661
1 C a r and General 4.4 726,717 509,201 170,340
EA A G A D S 0.4 61,082 204,471 10,155
E xpress Kenya -0.4 3,073,334 329,494 458,039
K akuzi 1.4 1,314,027 1,728,786 89,981
K apchorua Tea 1.3 548,302 935,410 48,811
K enya Airways 1.9 27,682,333 18,132,333 6,803,667
P an Africa Insurance 3.3 1,416,816 1,232,280 423,441
R ea Vipingo 0.0 619,995 623,316 207,724
Sasini -1.4 1,175,293 3,437,281 270,049
Standard Group 1.1 1,327,228 193,713 792,889
U nga Group 4.0 9,489,824 3,719,515 823,407
W illiam son Tea -0.5 1,095,643 3,226,485 228,927
41
Page 51
Table 7
Com parison of the mean values of the variables betw een certified and non-
certified firms
r ISO 9001 Certification
V ariable Non-ISO Certified ISO Certified t P-Value
Earnings Per Share 3.37 8.74 -2.717 0.008
Sales 5,808,627 11,420,271 -2.429 0.017
Size 3,996,817 12,777,142 -2.764 0.007
Operating Expenses 1,837,637 3,715,933 -1.395 0.167
The results shows that there is a significant differences in the mean values of the
variables between certified and non-certified firms (p-value<0.05) except for
operating expenses. This implies that ISO 9001 certification had a significant impact
on general firm performance based on the high values of the variables under
consideration among the ISO 9001 certified firms,
4.3.2 Test for Multi-Collinearity Correlation Matrix
A correlation matrix comparing certified and non-certified firms was constructed to
check for multi-collinearity, which can arise due to the possibility of closely related
variables.
42
Page 52
Table 8
Correlation Matrix comparing certified and non-certified firms
EPS Age Isostatus Sales Size OpexpensesEPS R 1 .181 m00<N .220' .238' .366”
P-value .094 .008 .041 .026 .001Age R .181 1 -.321”
oi* -.050
P-value .094 .002 .223 .003 .645ISO status R .283 ---, ••-.321 1 .252’ .284 .150
P-value .008 .002 .017 .007 .167
Sales R .220" -.130 .252' 1 .353” 1 2 4 ^
P-value .041 .223 .017 .001 .000
Size R .238' -.314” .284 .353” 1 .556"
P-value .026 .003 .007 .001 .000
Operating R "366” ~ -.050 .150 .424” .556“ 1
expenses P-value .001 .645 .167 .000 .000
According to the table, there exists a positive and a significant relationship between
Earnings Per Share and ISO status of a firm at 5% level o f significance (R=0.283, p-
value=0.008<0.05). This implies that ISO 9001 certified firms have higher
performance than non-ISO certified firms implying certification has an impact on a
firm ’s financial performance based on Earnings per Share.
The results also show a positive and significant correlation between Earnings per
share and Sales (R=0.220, p-value=0.041), Earnings per Share and Size (R=0.238, p-
value=0.026) and between Earnings per Share and Operating Expenses (R=0.366, p-
value=0.001). This shows that firm financial performance increases with increase in
sales, size and operating expenses. Multi-collinearity is observed between age and
ISO status (R=-0.321, p-value=0.002), age and size (R=0.238, p-value=0.003), ISO
43
Page 53
s ta tu s and sales (R=0.252, p-value=0.017), ISO status and size (R=0.284, p-
v a lu e —0.007) and between sales and size (R=0.353, p-value=0.001) and between sales
a n d operating expenses (R=0.424, p-value=0.000).
4 .3 .3 Regression Analysis comparing certified and non-certified Firms
R egression analysis was used to assess for linear relationship between firm
perform ance as proxied by Earnings per Share and the independent variables (Sales,
S ize , Operating Expenses and ISO Status) comparing certified and non-certified
firm s.
T a b le 9
Regression of Earnings per Share and determinants of firm performance
Intercept Sales Size Operating
Expenses
Age ISO
Status
RegressionCoefficients -6.489 0.000 0.000 0.000 0.206 6.219
t-values of coefficients -2.113 0.305 1.018 2.055 3.150 3.094
P-value 0.038 0.761 0.312 0.043* 0.002* 0.003*
R-square 0.5353Adjusted R-square 0.240F 6.253
a. Dependent Variable: Earning I’er Share
The R-square value according to table 8 shown is 0.535 while the adjusted R-square is
given as 0.240. To test for the existence of a linear relationship between the dependent
and the independent variables, Analysis of Variance was employed. The results from
the analysis of variance based on the F-statistics shows that the regression relationship
between Earnings per Share and the independent variables is statistically significant at
5% level of significance (F=6.253, p-value=0.000<0.05).
44
Page 54
According to the results in table 8 below, of all the regression parameters, the age of a
firm, its ISO status and operating expenses are significantly and positively linearly
related to the Earnings Per Share at 5% level o f significance (p<0.05). This implies
that ISO 9001 certified firms are more likely to have better performance than non-ISO
9001 certified firms. The coefficient of the regression parameters for sales, size and
operating expenses are zero implying that they may not linearly affect a firm’s
performance. The resultant regression equation based on the findings in table 8 can
then be expressed as;
EPS = -6.489 + O.OOOSales + O.OOOSize + 0.000OpExpenses + 0.206 Age + 6.219 ISOStatus + e
45
Page 55
CHAPTER FIVE
SUMMARY, CONCLUSION AND RECOMMENDATIONS
5.1 Introduction
The objective of this study was to determine the impact of ISO 9001 quality
certification on financial performance and compare the financial performance of ISO
9001 certified and non ISO 9001 certified companies listed at the Nairobi Stock
Exchange.
5.2 Summary and Conclusions of the findings
A significant increase in the value of sales, size, operation expenses and earnings per
share in almost all the firms listed at NSE after the ISO 9001 certification is observed
indicating that ISO 9001 certification has an impact on the variables under study.
Paired t-test performed to compare the values o f sales, size, operation expenses and
earnings per share three years before and after certification however shows no
significant differences implying that the good performance was visible in the
companies before and after ISO 9001 certification. These results are similar to Heras
et al. (2002) whose results indicated that certified companies had better results not
only after certification but also prior to the certification date. The analysis however
showed a significant difference between ISO 9001 certified and non-certified firms.
There was a significant differences in the mean values o f the variables between
certified and non-certified firms (p-value<0.05) except for operating expenses. Based
on the high values of the variables among the ISO 9001 certified firms, this implies
that ISO 9001 certification had such a significant impact on general firm performance.
These results are similar to Corbett et al. (2005) whose results indicated that a firms’
decision to seek their first ISO 9001 certification is indeed followed by significant
46
Page 56
abnormal improvements in financial performance. Correlation test for the companies
before and after certification showed that there exists a positive and a significant
relationship between Earnings Per Share and a Age of a firm at 5% level of
significance (R=0.437, p-value=0.000<0.05). This implies that the older a firm is, the
higher its performance. The results also showed a positive and significant relationship
between Earnings Per Share and Sales at 5% level of significance (R=0.232, p-
value=0.034<0.05). This also implies that as the value of sales increases, so is the
Earnings Per Share and hence the firms’ performance. The results also showed
positive and significant relationship between Earnings Per Share and firm’s operating
expenses at 5% level of significance (R=0.339, p-value=0.002). This is also an
indication that firms with higher operating expenses are better performers (Earnings
Per Share) than firms with low operating expenses. Correlation test performed on both
certified and non-certified firms that there exists a positive and a significant
relationship between Earnings Per Share and ISO status o f a firm at 5% level of
significance (R=0.283, p-value=0.008<0.05) implying that ISO 9001 certified firms
have higher performance than non-ISO 9001 certified firms.
According to the regression results, of all the regression parameters, only a firm’s age
is statistically significantly and positively linearly related to the Earnings Per Share at
5% level of significance (t=0.285, p-value=0.000). The coefficient o f ISO 9001 status
is positive but not significant indicating the comparison before and after ISO 9001
certification do not have any significant differences. The coefficient o f the regression
parameters for sales, size and operating expenses are zero implying that they do not
affect Earnings Per share when considered with other variables. The results of the
regression analysis performed on all the firms both certified and non-certified showed
that of all the regression parameters, the age o f a firm, its ISO status and operating
47
Page 57
expenses are significantly and positively linearly related to the Earnings Per Share at
5% level of significance (p<0.05). This implies that ISO certification had a significant
relationship with firm performance.
5.3 Limitation of the Study
The key limitation of this study was that historical financial statements and reports
were not available for some companies listed at NSE. Test assumption is made that
there is a linear relationship between firm performance and ISO certification in the
course of the research.
5.4 Suggestions for further research
Given the quantitative nature of the study there is need for a study that will assess the
link o f long term financial performance of ISO certified firms and firm value.
48
Page 58
REFERENCES
1. Aarts, F. & Vos, E. (2001). The impact of ISO registration on New Zealand firms’
performance: a financial perspective, The TQM Magazine, Vol. 13 No. 3,
pp. 180-91.
2. Abraham, M., Crawford, J., Carter, D., & Mazotta, F., (2000). Management
decisions for effective ISO 9000 accreditation. Management Decision, Vol.
38 No. 3 pp. 182-93
3. Adams, M. (1999). Determinants o f ISO Accreditation in the New Zealand
Manufacturing Sector. Omega 2 7 ,285-292.
4. Adanur, S. & Allen, B. (1995), First results on the effects of ISO 9000 in the US
textile industry. Benchmarking for Quality Management & Technology,
Vol. 2 No. 3, pp. 41-52.
5. Anderson, S. W., Daly, J. D., & Johnson, M. F. (1999). Why firms seek ISO 9000
certification: Regulatory compliance or competitive advantage. Production
and Operations Management', v8\ pp28-43.
6. Atwater, J.B. & Discenza, R. (1993). ISO 9000: Implication for US business,
Proceedings o f the 1992 Decision Sciences National Meeting, Washington
DC, November, Vol. 3.
7. Batchelor, C. (1992), “Badge of quality”, Financial Times, 1 September.
49
Page 59
8. Beattie, K.R. & Sohal, A.S. (1999). Implementing ISO 9000: A study of its benefits
among Australian organizations. Total Quality Management, 10(1), pp.95-
106.
9. Beirao, G. & Sarsfield, C. (2002). The reaction of the Portuguese stock market to
ISO 9000 certification. Total Quality Management, Vol. 13 No. 4, pp. 465-
74.
10. Bhuiyan, N. & Alam, N. (2005). An investigation into issues related to the latest
version o f ISO 9000, Total Quality Management, 16, pp. 199-213.
11. Buzzel, R.D. & Wiersema, F.D. (1981). Modelling changes in market share: a
cross sectional analysis, Strategic Management Journal, pp. 27-42.
12. Calisir, F. (2000) Factors affecting service companies’ satisfaction with ISO 9000.
Managing Service Quality Vol. 17 No. 5, 2007 pp. 579-593
13. Calisir, F., Kulak, O. & Dogan, I. (2005), Factors influencing Turkish textile
companies’satisfaction with ISO 9000. Total Quality Management &
Business Excellence, Vol. 16 No. 10, pp. 1193-204.
14. Casadesus, M. , Gimenez, G. & Heras, I. (2001). Benefits o f ISO 9000
implementation in Spanish industry. European Business Review 3(6) 327-
335.
50
Page 60
15. C asadesu 's, M. & S. Karapetrovic (2005). Has ISO-9000 lost some of its lustre?
A longitudinal impact study, International Journal o f Operations and
Production Management, 25, pp.580-596.
16. Chapman, R.L., Murray, P.C. & Mellor, R. (1997). Strategic quality management
and financial performance indicators. International Journal o f Quality &
Reliability Management, Vol. 14 No. 4, pp. 432-48.
17. Chen, H. M. (2001). An Exploration of the Relationship Between ISO 9000
Certification and Implementation Result Indicators. Quality Management
Monthly, March, pp.91-95. (in Chinese)
18. Corbett, C.J. & Kirsch D.A. (2001). International Diffusion of ISO 14000
Certification. Production and Operations Management 10 (3) 327-342.
19. Corbett, C.J. (2003). Global Diffusion of ISO 9000 Through Supply Chains.
Manuscript.
20. Corbett, C., Montes-Sancho, M. & Kirsch, D. (2005). The financial impact of ISO
9000 certification in the United States: an empirical analysis, Management
Science, 51, pp. 1046-1059.
21. Corrigan, J (1994). Is ISO 9000 the path to TQM? Quality Progress, May, pp.
33-6
51
Page 61
-2 . Costa, M. M. & Lorente, A. R. (2007). A triple analysis of ISO 9000 effects on
company performance. International Journal o f Productivity and
Performance Management Vol. 56 No. 5/6, 2007 pp. 484-499
23. Craig, C.S. & Douglas, S.P. (1982). Strategic factors associated with market share
and financial performance, Quarterly Review o f Economics and Business,
Summer, pp. 101-11.
24. Crosby, P. B., Quality is Free, McGraw-Hill, New York, NY, 1979.
25. Curkovic, S & Pagell, M. (1999). A critical examination of the ability of ISO
9000 certification to lead to a competitive advantage. Journal o f Quality
Management Vol. 4 No. 1 pp.51-67
26. Dalgleish, S. (2002). ISO 9000: More hindrance than help. Quality, v41nl0; pp
64-64
27. Davis, F. & Manrodt, K. (1996).Customer Responsive Management, Basil
Blackwell, Oxford.
28. Dean, J. & Bowen, D. (1994). Managing theory and total quality: improving
research and practice through theory development, Academy o f
Management Review, 19, pp. 392—418.
52
Page 62
^ 9 . D em ing, E. W., (1982). Quality, Productivity and Competitive Position, MIT
Center for Advanced Engineering, Cambridge, MA.
30. Deming, E. W., (1986). Out o f the crisis, MIT Center for Advanced Engineering,
Cambridge, MA.
31 . Docking, D.S. & Dowen R.J. (1999). Market interpretation o f ISO 9000
registration. The Journal o f Financial Research XXII (2) 147-160.
32. Easton, G.S. & Jarrell S.L. (1998). The Effects of Total Quality Management on
Corporate Performance: An Empirical Investigation. Journal o f Business
71(2) 253-307.
33. Finley, L., & Buntzman, G. F. (1994). What does affect company performance?
Arkansas Business and Economic Review, 27(2), 1.
34. Forker, L.B., Vickery, S.K. & Droge, C.L. (1996), The contribution of quality to
business performance, International Journal o f Operations & Production
Management, Vol. 16 No 8, pp. 44-62.
35. Flynn, B.B., Schroeder, R.G. & Sakakibara, S. (1995), The impact of quality
management practices on performance and competitive advantage, Decision
Sciences, Vol. 26 No. 5, pp. 659-92.
53
Page 63
^ ****** B .B ., Schroeder, R.G., Flynn, E.J., Sakakibara, S. & Bates, K.A. (1997),
W orld-class manufacturing project: overview and selected results,
International Journal of Operations & Production Management, Vol. 17 No.
7, pp. 671-85
37. G a le , B . T. & Branch, B. S. (1982), Concentration Versus Market Share, The
Antitrust Bulletin, 27 (Spring), 83-105.
38. G arv in , D. A. (1984). What Does Product Quality Really Mean? Sloan
Management Review 26(1) 25-36
39. G arv in , D. A. (1983). Quality on the Line. Harvard Business Rev., 61,4, 65-75.
4 0 . G onza ' lez-Benito, J. & Gonza' lez-Benito, O. (2005). An analysis of the
relationship between environmental motivations and ISO 14001
certification, British Journal o f Management, 16, pp. 133-148.
41. Giguere, M. & Smith, P.E. (1999). ISO 9000: service companies can benefit. Ivy
Business Journal, Vol. 63, pp. 13-16.
42. Guler, I., Guillen M.F., & Macpherson J.M. (2000). “Global Competition,
Institutions, and the Diffusion of Organizational Practices: The
International Spread of the ISO 9000 Quality Standards”. Administrative
Science Quarterly 47(2) 207-232.
54
Page 64
43. Haversjo, T. (200).The financial effects o f ISO 9000 registration for Danish
companies. M anagerial A ud iting Journal, Vol. 15 no. 1/2. pp.47-52
44. Hendricks, K. & Singhal, V. (1996) Quality Awards and the Market Value of the
Firm: An Empirical Investigation: Management Science, Vol. 42. No. 3 pp.
415-436
45. Hendricks, K.B. & Singhal V.R. (1997). Docs Implementing an Effective TQM
Program Actually Improve Operating Performance? Empirical Evidence
from Firms That Have Won Quality Awards. Management Science 4j(9)
1258-1274.
46. Hendricks, K.B. & Singhal V.R. (2001b). Firm characteristics, total quality
management, and financial performance. Journo, o f OperoOons
M anagem ent 19 269-285.
47. Henkoff, R. (1993). TTte ho, new sea. ofquality. F or, o n .. 28 June, pp.68-71
,8. H e r a s , D i c k G.P.M. * Casadesds M. (2002). .SO 9000 registration's tmpact on
sales and profitability: A longitudinal analysis of performance Wore and
after certification. — # ( N * “
Management 19( 6 ) 774-791
55
Page 65
49. Huamg, F. (1998). Integrating ISO 9000 with TQM spirits: a survey, Industrial
Management & Data Systems, Vol. 98 No. 8, pp. 373-9.
50. Huamg, F., Homg, C. and Chen, C. (1999). A study of ISO 9000 process,
motivation and performance, Total Quality Management 10(7), pp.1009-
1025.
51. ISO central secretariat (2009). Selection and use of ISO 9000 family of standards
Retrieved from < http://www.iso.org/iso/publications and e-
products/management standards publications.htm>
52. ISO central secretariat (2008). The ISO Survey of certification 2007 Available
from < http://www.iso.org/iso/publications and e-
products/management standards publications.htm>
53. Jacobson, R. & Aaker, D. (1987), The strategic role o f product quality,
Journal o f Marketing, Vol. 51. pp. 31-44.
54. Johannsen, C. G. (1995). Application of the ISO 9000 standards of quality
management in professional services: an information sector case, Iotal
Quality Management, Vol. 6 No. 3.
55. Jones, R., Arndt, G. & Kustin, R. (1997). ISO 9000 among Australian companies:
impact of time and reasons for seeking certification on perceptions of
benefits received. International Journal o f Quality and Reliability
Management, Vol. 14, No.7, pp.650-60.
Page 66
49. Huamg, F. (1998). Integrating ISO 9000 with TQM spirits: a survey, Industrial
Management & Data Systems, Vol. 98 No. 8, pp. 373-9.
50. Huamg, F., Homg, C. and Chen, C. (1999). A study o f ISO 9000 process,
motivation and performance, Total Quality Management 10(7), pp.1009-
1025.
51. ISO central secretariat (2009). Selection and use of ISO 9000 family of standards
Retrieved from < http://www.iso.ore/iso/publications and e-
products/manaeement standards publications.htm>
52. ISO central secretariat (2008). The ISO Survey of certification 2007 Available
from < http://www.iso.ore/iso/publications and e-
products/manaeement standards publications.htm>
53. Jacobson, R. & Aaker, D. (1987), The strategic role o f product quality,
Journal o f Marketing, Vol. 51, pp. 31-44.
54. Johannsen, C. G. (1995). Application of the ISO 9000 standards of quality
management in professional services: an information sector case, Iotal
Quality Management, Vol. 6 No. 3.
55. Jones, R., Arndt, G. & Kustin, R. (1997). ISO 9000 among Australian companies:
impact of time and reasons for seeking certification on perceptions of
benefits received. International Journal o f Quality and Reliability
Management, Vol. 14, No.7, pp.650-60.
56
Page 67
56. Joubert, B. (1998). ISO 9000: international quality standards. Production and
Inventory Management Journal, second quarter, pp.60-65.
57. Juran, J. M. and F. M. Gryna, Quality Planning and Analysis, McGraw- Hill, New
York, 1980.
58. Karmarkar, U. & Pitbladdo, R. (1997). Quality, class, and competition,
Management Science, 43, pp. 27-39.
59. Kimani, J. (2007). The role of ISO 9001 certification in developing competitive advantage
for Kenyan organizations. Unpublished MBA Research Project, University o f
Nairobi.
60. King, A. & Lenox, M. (2001). Lean and Green? An Empirical Examination of the
Relationship Between Lean Production and Environmental Performance.
Production and Operations Management 10(3) 244-256.
61. Kioko, N. (2002). The strategic use of international standards; The case of ISO
9000 registered firms in Kenya. Unpublished MBA Research Project,
University of Nairobi.
57
Page 68
3-- Lamport, M., Seetanah, B., Conhyedass P & Sannassee, R. V. (2010)
International Research Symposium in Service Management. ISSN 1694-
0938
63. Laszlo, G. The role of quality cost in TQM The TQM Magazine Volume 9 •
Number 6 • 1997 • pp. 410-413
64. Lee, P., To, W. & Yu, B. (2009).The implementation and performance outcomes
o f ISO 9000 in service organizations: An empirical taxonomy.
International Journal o f Quality & Reliability Management Vol. 26 No. 7,
2009 pp. 646-662
65. Lima, Resende M. & Hasenclever L. (2000). Quality Certification and
Performance of Brazilian Firms: An Empirical Study. Inti Journal o f
Production Economics 66 143-147.
66. Lin, G (1996). The ISO 9000 Breakthrough-the Road to Internationalized
Quality Management. Taipei Quality Management Association, January
(second edition), (in Chinese)
67. Lloyds register of Quality Assurance (1996), Fitter Finance. The Effects o f ISO
9000 on Business Performance. Report o f Survey Findings, Llyods,
London.
58
Page 69
68 . M aani, K.E., Putterill, M.S. and Sluti, D.G. (1994) “Empirical analysis of quality
improvement in manufacturing”, International Journal o f Quality and
Reliability Management, Vol.l 1 No 7, pp. 19-37.
69. M acadam, R., & Mckeown. M. (1999). Life after ISO: an analysis o f the impact of
ISO 9000 and total quality management on small business in Northern
Ireland. Total Quality Management; vlO; 229-241
70. Magd, H., Kadash, N. & Curry, A. (2003) ISO 9000 implementation: a study of
manufacturing companies in Saudi Arabia Managerial auditing journal
313-322
71. Marti'nez-Costa, M. & Marti'nez-Lorente, A.R. (2003), Effects of the ISO 9000
certification on the firm’s performance: a vision from the market, Total
Quality Management & Business Excellence, Vol. 14 No. 10, pp. 1179-91.
72. Motwani, J., Kumar, A. & Cheng, C.H. (1996). A roadmap to implementing ISO
9000”. International Journal o f Quality and Reliability Management,
Vol.13, N o.l, pp.72-83.
73. Mwihaki, J. (2006). The effect o f ISO certification on operation performance; case
of Johnson Diversy, Unpublished MBA Research Project, University o f
Nairobi.
59
Page 70
74. Najmi, M. and Kehoe, D.F. (2001), “The role of performance measurement
systems in promoting quality development beyond ISO 9000”, International
Journal of Operations & Production Management, Vol. 21 No. 1, pp. 159-
72.
75. Naroola, G. & Connell, R.M. (1996). How to Achieve ISO 9000 Registration
Economically and Efficiently, Marcel Dekker, Inc.
76. Naveh, E. & Marcus, A. (2000). Implementation of A Management Practice:
Assimilation and Going Beyond. Manuscript.
77. Nicolau, J.L. & Sellers, R. (2002). The stock market’s reaction to quality
certification: empirical evidence from Spain, European Journal o f
Operational Research, Vol. 142 No. 3, pp. 632-41.
78. Nwankwo, S. (2000). Managing Quality, 2nd ed., Prentice-Hall, Hemel
Hempstead.
79. Ofori, G. & Gang, G. (2001) ISO 9000 certification of Singapore construction
enterprises: its costs and benefits and its role in the development of the
industry. Engineering Construction and Architectural Management, Vol 8
No.2, pp 145-57
60
Page 71
80. Quazi, A. H., Hong, W. C. & Meng, T. C. (2002). Impact of ISO 9000
certification on quality management practises: a comparative study. Total
Quality Management, Vol. 13 No. 1, pp.53-73
t
81. Phillips, L.W., Chang, D.R. & Buzzel, R.D. (1983). Product quality, cost position,
and business performance: a test of key hypotheses. Journal o f Marketing,
Vol. 37, pp. 26-43.
82. Ragothaman, S. & Korte, L. (1999). The ISO 9000 international quality
registration: an empirical analysis of implications for business firms,
International Journal o f Applied Quality Management, Vol. 2 No. 1, pp.
59-73.
83. Rayner, P. & Porter, L. (1991). BS5750/ISO 9000-the experience o f small and
medium sized businesses. International Journal o f Quality and Reliability
Management, 8(6), pp. 16-28.
84. Romano, P. (2000). ISO 9000: what is its impact on performance? Quality
Management Journal, Vol. 7 No. 3, pp. 38-56.
85. Rust, R., A. Zahorik and T. Keiningham (1995). Return on quality (ROQ): making
service quality financially accountable, Journal o f Marketing, 59, pp. 58-
70.
61
Page 72
86. Samson. D. & Terziovski, M. (1999). The relationship between total quality
management practices and operational performance, Journal o f Operations
Management, 17, pp. 393-409.
87. Shih, L.H., Huamg, F. & Lin, B. (1996). “ISO in Taiwan: A survey, Total Quality
Management". 7(6), pp.681-690.
88. Sharma, D.S. (2005). The association between ISO 9000 and financial
performance. The International Journal o f Accounting, Vol. 40 No. 2, pp.
151-72.
89. Simmons, B.L. & White, M.A. (1999). The relationship between ISO 9000 and
Business Performance: Does Registration Really Matter?” Journal o f
Managerial Issues 11(3) 330-343.
90. Singels, J., Ruel G. & Van de water, H. (2001). ISO 9000 Series: Certification and
Performance. International Journal o f Quality and Reliability Management
18(1)62-75.
91. Stimson, W (2005). Sarbanes-Oxley and ISO 9000. Retrieved from
<http://www.asa.org>
92. Stephens, K. S. (1994). ISO 9000 and total quality. Quality Management Journal,
Fall, pp. 57-71
62
Page 73
93. Sun. H. (1999). Diffusion and contribution of the total quality management: an
empirical study in Norway. Total Quality Management vlO; 901-914
94. Sun, H. (2000). Total quality management, ISO 9000 certification and
performance improvement. International Journal of Quality & Reliability
Management, Vol. 17 No. 2, pp. 168-79.
95. Taylor, W.A. (1995). Senior executives and ISO 9000 - attitudes, behaviours and
commitment. International Journal o f Quality and Reliability Management,
Vol. 12, No.4, pp.40-57.
96. Terziovski, M., Power D. & Sohal A.S. (2003). The Longitudinal Effects of the
ISO 9000 Certification Process on Business Performance. European
Journal o f Operational Research 146 580-595.
97. Terziovski, M., Samson, D. & Dow, D. (1997). The business value of quality
management systems certification: Evidence from Australia and New
Zealand. Journal o f Operations Management 15 1-18.
98. Tsekouras, K., Dimara, E. & Skuras D. (2002). Adoption of a quality assurance
scheme and its effect on firm performance: a study of Greek firms
implementing ISO 9000, Total Quality Management, 13, pp. 827-841.
99. Tsiotras, G. & Gotzamani, K. (1996). ISO 9000 as an entry key to TQM: the case
o f the Greek industry. International Journal o f Quality and Reliability
Management, Vol. 13 No. 4, pp.64-76.
63
Page 74
100. Tzelepis, D., Tsekouras, K., Skuras, D. & Dimara, E. (2006).The effects ot ISO
9001 on firms’ productive efficiency, International Journal of Operations
and Production Management, 26, pp. 1146-1163.
101. Van der wiele, T. & Brown, A. (1997). ISO 9000 series experiences in small and
medium-sized enterprises. Total Quality Management, 8(2 & 3), pp.300-
304.
102. Vloeberghs, D. & Bellens, J. (1996). Implementing the ISO 9000 standards in
Belgium. Quality Progress, June, pp.43-48
103. Winifred, W. (2007). The strategic challenges faced by films in the adoption of ISO 9000
quality systems management standard the case of manufacturing firms in Nairobi's
industrial area Unpublished MBA Research Project, University o f Nairobi.
104. Withers, E. B., & Ebrahimpour, M (1998). Quality implications o f ISO 9000
certification: a case study of European firms available at www.sbaer.uca.edu
105. Woodruff, R. (1997). Customer value: the next source of competitive advantage.
Journal of Marketing Science, Vol. 25 No.2, pp. 189-93
64
Page 75
106. Yahya. S & Goh, K. W. (2001). The implementation of an ISO 9000 quality
system. International Journal of Quality & Reliability Management, Vol. 18
No. 9, pp. 941-66
107. Yeung, A.C.L., Lee, T.S. & Chan, L.Y. (2003). Senior management perspectives
and ISO 9000 effectiveness: an empirical research. International Journal o f
Production Research, Vol. 41 No. 3, pp. 545-69.
65