190 INTRODUCTION The shallow tectonic earthquake of magni- tude 7.5 on September 28, 2018 in Palu, Central Sulawesi, Indonesia not only caused damage to the basic infrastructures, but also triggered three types of secondary disasters, namely tsunami, liq- uefaction and landslide (Bao et al., 2019; Carvajal et al., 2019; Miyajima et al., 2019; Bradley et al., 2019). The three types of those disasters have ba- sically caused the same impact as an earthquake, in addition to fatalities in very large numbers. The three massive exposed areas were Palu, Sigi and Donggala, as the areas closest to the earthquake epicenter (Pancoro et al., 2018). Not less than one month, almost the entire area collapsed after further rehabilitated and reconstructed (Maryanti, 2019). The status of national disasters has been issued by the Government of Indonesia related to the impact of a very massive disaster. Various national and international parties have devoted attention to this disaster and they have provided humanitarian assistance and moral support to re- build affected areas (Lanini et al, 2019). In addition to primary and secondary impacts, the earthquake also triggered a tertiary disaster Journal of Ecological Engineering Received: 2019.11.18 Revised: 2019.12.23 Accepted: 2020.01.10 Available online: 2020.01.25 Volume 21, Issue 2, February 2020, pages 190–200 https://doi.org/10.12911/22998993/116325 Impact of Landslides Induced by the 2018 Palu Earthquake on Flash Flood in Bangga River Basin, Sulawesi, Indonesia I Gede Tunas 1* , Arody Tanga 1 , Siti Rahmi Oktavia 1 1 Department of Civil Engineering, Faculty of Engineering, Universitas Tadulako, Kampus Bumi Tadulako Tondo, Jalan Soekarno – Hatta Km.9 Palu, Central Sulawesi, 94117, Indonesia * Corresponding author’s e-mail: [email protected]ABSTRACT High magnitude flash flood has occurred several times in some areas in Central Sulawesi Province after the 2018 Palu Earthquake, one of them is in the Bangga River, Sigi Regency, Indonesia. It has caused massive impacts such as damaging agricultural and plantation areas and submerging public facilities and infrastructure and even causing fatalities. The flood carries a variety of materials, especially high concentration sediments which are thought to originate from eroded soils due to landslides induced by a 7.5 magnitude earthquake. These materials are eroded and transported by the flow at the upstream watershed due to heavy rainfall. This study intends to investigate the potential of landslides, factors that trigger floods and increased flooding after the earthquake. This research was conducted by investigating the landslides potency based on field surveys and interpretation of the latest satellite imagery, analyzing the characteristics of rainfall as a trigger for flooding, and predicting the flood potency as the primary impact of these two factors. Rainfall-flood transformation was simulated with the HEC-HMS Model, one of the freeware semi-distributed models commonly used in hydrological analysis. The model input is the configu- ration of river networks generated from the National DEM (DEMNAS), hourly rainfall during floods and other watershed parameters such as land cover, soil types and river slope. The similar simulation was also carried out on the condition of the watershed before the earthquake. Based on the results of the analysis, It can be inferred that flash floods in the Bangga River are mainly caused by heavy rainfall with long duration and landslide areas in the upper watershed triggered by the 2018 Palu Earthquake with an area of approximately 10.8 km 2 . The greatest depth of rainfall as a trigger for flooding is 30.4 mm with a duration of 8 hours. The results of the study also showed that landslides in the upper watershed could increase the peak flood by 33.33% from 118.56 m 3 /s to 158.08 m 3 /s for conditions before and after the earthquake. Keywords: flash flood, heavy rainfall, landslide, watershed, the 2018 Palu Earthquake.
Transcript
190
INTRODUCTION
The shallow tectonic earthquake of magni-tude 7.5 on September 28, 2018 in Palu, Central Sulawesi, Indonesia not only caused damage to the basic infrastructures, but also triggered three types of secondary disasters, namely tsunami, liq-uefaction and landslide (Bao et al., 2019; Carvajal et al., 2019; Miyajima et al., 2019; Bradley et al., 2019). The three types of those disasters have ba-sically caused the same impact as an earthquake, in addition to fatalities in very large numbers. The three massive exposed areas were Palu, Sigi and
Donggala, as the areas closest to the earthquake epicenter (Pancoro et al., 2018). Not less than one month, almost the entire area collapsed after further rehabilitated and reconstructed (Maryanti, 2019). The status of national disasters has been issued by the Government of Indonesia related to the impact of a very massive disaster. Various national and international parties have devoted attention to this disaster and they have provided humanitarian assistance and moral support to re-build affected areas (Lanini et al, 2019).
In addition to primary and secondary impacts, the earthquake also triggered a tertiary disaster
Journal of Ecological Engineering Received: 2019.11.18Revised: 2019.12.23
Accepted: 2020.01.10Available online: 2020.01.25
Volume 21, Issue 2, February 2020, pages 190–200https://doi.org/10.12911/22998993/116325
Impact of Landslides Induced by the 2018 Palu Earthquake on Flash Flood in Bangga River Basin, Sulawesi, Indonesia
I Gede Tunas1*, Arody Tanga1, Siti Rahmi Oktavia1
1 Department of Civil Engineering, Faculty of Engineering, Universitas Tadulako, Kampus Bumi Tadulako Tondo, Jalan Soekarno – Hatta Km.9 Palu, Central Sulawesi, 94117, Indonesia
ABSTRACTHigh magnitude flash flood has occurred several times in some areas in Central Sulawesi Province after the 2018 Palu Earthquake, one of them is in the Bangga River, Sigi Regency, Indonesia. It has caused massive impacts such as damaging agricultural and plantation areas and submerging public facilities and infrastructure and even causing fatalities. The flood carries a variety of materials, especially high concentration sediments which are thought to originate from eroded soils due to landslides induced by a 7.5 magnitude earthquake. These materials are eroded and transported by the flow at the upstream watershed due to heavy rainfall. This study intends to investigate the potential of landslides, factors that trigger floods and increased flooding after the earthquake. This research was conducted by investigating the landslides potency based on field surveys and interpretation of the latest satellite imagery, analyzing the characteristics of rainfall as a trigger for flooding, and predicting the flood potency as the primary impact of these two factors. Rainfall-flood transformation was simulated with the HEC-HMS Model, one of the freeware semi-distributed models commonly used in hydrological analysis. The model input is the configu-ration of river networks generated from the National DEM (DEMNAS), hourly rainfall during floods and other watershed parameters such as land cover, soil types and river slope. The similar simulation was also carried out on the condition of the watershed before the earthquake. Based on the results of the analysis, It can be inferred that flash floods in the Bangga River are mainly caused by heavy rainfall with long duration and landslide areas in the upper watershed triggered by the 2018 Palu Earthquake with an area of approximately 10.8 km2. The greatest depth of rainfall as a trigger for flooding is 30.4 mm with a duration of 8 hours. The results of the study also showed that landslides in the upper watershed could increase the peak flood by 33.33% from 118.56 m3/s to 158.08 m3/s for conditions before and after the earthquake.
Keywords: flash flood, heavy rainfall, landslide, watershed, the 2018 Palu Earthquake.
191
Journal of Ecological Engineering Vol. 21(2), 2020
namely flash floods in the Bangga River, one of the important sub-watersheds in the Palu water-shed as a source of irrigation and clean water (Wi-djaja and Gautama, 2019). Heavy rainfall with long duration is predicted is predicted to have eroded most of the landslides on the upper wa-tershed surface due to the earthquake shocks, as well as in some other areas such as Aso Volcano in Japan (Saito et al., 2018) and NE Abruzzo Hills Area in Central Italy (Piacentini et al., 2018). Sediments originating from the avalanche mate-rial are transported by large flows with high mass concentrations heading downstream and damag-ing all areas crossed. Irrigation weir that supplies water for more than 300 hectares of paddy fields in the middle segment of the watershed was se-verely damaged due to flooding and could not be operated until the results of this investigation were reported. The local government stated that there had been damage to the weir’s body and en-ergy basin and that the building had to be rebuilt based on current flow conditions, topography and seismic factors.
National Disaster Mitigation Agency of Indo-nesia (2019) noted that at least 17 floods occurred after the 2018 Palu earthquake until July 2019 with different duration, magnitude and impact. During this period, one flood was recorded with magnitude and destructive force on 28 April 2019. Floods have inundated all residential, agricultural and plantation areas located in the middle and lower reaches of the watershed. More than 2,400 residents in the area were evacuated to areas that were safe from the threat of flooding and imme-diately received emergency assistance from the local government. The flood this time is the flood with the longest inundation period with a dura-tion of more than one days, the most extensive inundation area and the greatest destructive force.
Documents about flooding in this area have not been widely published. Almost all research-ers devote their time, energy and thought to in-vestigating the earthquake, tsunami and lique-faction in Palu and the surrounding area because the phenomenon is considered to be very unique and cause different views and perceptions among researchers. Hui et al. (2018) and Socquet et al. (2019) investigated the source and propagation of the 2018 Palu earthquake as a result of strike-slip faults on the western side of the northern part of Sulawesi Island. The two researchers also veri-fied the magnitude of the Palu earthquake with a magnitude of 7.5. Three other researchers noted
about liquefaction carried out by Watkinson and Hall (2019), Cummins (2019) and Bradley et al. (2019). They argue that liquefaction at several sites in Central Sulawesi is a liquefaction phe-nomenon that is very different from what has happened in other places because it occurs in a relatively large area. The three researchers also concluded that the Gumbasa irrigation channel that supplies irrigation water for more than 4000 hectares also played a role and contributed to liq-uefaction at three sites in Palu and Sigi namely Petobo, Jonooge and Sibalaya. Furthermore, some researchers studied the tsunami in Palu Bay with wave height reaching 3 meters. Frederik et al. (2019) conducted a submarine bathymetry investigation in Palu Bay to collect data related to the cause of the tsunami. Besides the analysis of the causative factors as observed by Sassa and Takagawa (2019), a study of the impact of the tsu-nami on settlements at the Coast of Palu Bay and Donggala was also carried out for the reconstruc-tion of the affected area (Paulik et al., 2019).
Among those disaster publications, none of the researchers investigated floods in Palu and its surroundings after the 2018 Palu Earthquake. Studies relating to floods were generally pub-lished before the earthquake. The only publica-tion about flooding in the Bangga River is the testing of GAMA I synthetic unit hydrographs for predicting flood hydrographs (Andiesse, 2012). Flood analysis only uses rainfall data as the in-put and calibration of the model parameters was not accommodated. For larger scale watersheds, flood analysis is carried out by Tunas and Maadji (2018) in the Palu watershed as the mother of the Bangga Catchment. This paper is the only publi-cation about earthquake-related flooding. There-fore this topic becomes very important and inter-esting because It is related to the tertiary impact of the Palu 2018 earthquake.
Specifically, this paper aims to predict flash floods in the Bangga River as a result of land-slides in the upstream watershed triggered by the earthquake. The results of this study can be used as a reference for preparing a comprehensive di-saster mitigation program. Disaster mitigation programs are not only related to post-disaster ac-tivities but also include pre-disaster activities to mitigate the impacts and risks of disasters (Mar-din and Shen, 2018; Huang et al., 2018). Related to this, this publication will be very useful as ba-sic information on disaster mitigation in Indone-sia, especially in Central Sulawesi, because this
Journal of Ecological Engineering Vol. 21(2), 2020
192
area is located in a multi-prone area of disasters such as floods, earthquakes, liquefaction, tsuna-mis and other disasters (Tunas, 2019).
MATERIAL AND METHODS
Site Description
This study was carried out in the Bangga wa-tershed, a medium sized watershed located on the western side of the Palu watershed, Sulawesi Indonesia (Figure 1). The area of this watershed is 68.19 km2 with an outlet point at the Bangga Weir, only about 2.2% of the Palu watershed area which reaches 3048 km2. This elongated shape of catchment stretches from Southwest to Northeast and lies in geographical coordinates between lati-tudes 1°15’16.98”S and 1°21’18.51”S, and lon-gitudes 119°49’20.82”E and 120°56’03.48”E. As part of the Palu watershed, this catchment pres-ents the characteristics of the Palu watershed in the middle segment, with flow forming fish bone patterns. This pattern is generally spread on both
sides of the Palu watershed, west side and east side. The similarity of this flow pattern can also be found downstream of the Palu watershed in or-der of three to four and with low density.
Most of the Palu Watershed area is covered by primary forests which have decreased in density due to climate change (Tunas et al., 2019). This type of land cover can be seen in the upstream watershed to the middle segment. Until now, the types of forest plants that grow in this area are still maintained and not converted. In addition to the mountainous and hilly topography which is not possible for land conversion, the forest con-servation program by the local government also plays a role in the preservation of forests in the upper reaches of the watershed. Government policy only allows the exploitation of watershed areas in the downstream and a little in the middle segment. Topographical conditions in this seg-ment tend to be suitable for the development of settlements, agriculture, plantations and fisheries.
When observed from climatic factors, in gen-eral the Bangga Catchment also represents the climate characteristics of the Palu Watershed in
Figure 1. Site location of the research. Bangga River is the part of the Palu Catchment, one of the largest river basin in Sulawesi Island, Indonesia.
193
Journal of Ecological Engineering Vol. 21(2), 2020
the middle and downstream. The climate of this region is a combination of tropical rainforest cli-mate (Type A) and dry climate (Type B). Average annual rainfall in the upper watershed is generally higher than the middle and downstream segments. In the upstream part, evaporation is relatively lower than the middle and downstream parts with rainfall depth of more than 1000 mm/year. Changes in climate types change gradually from upstream to downstream following changes in to-pography and land cover.
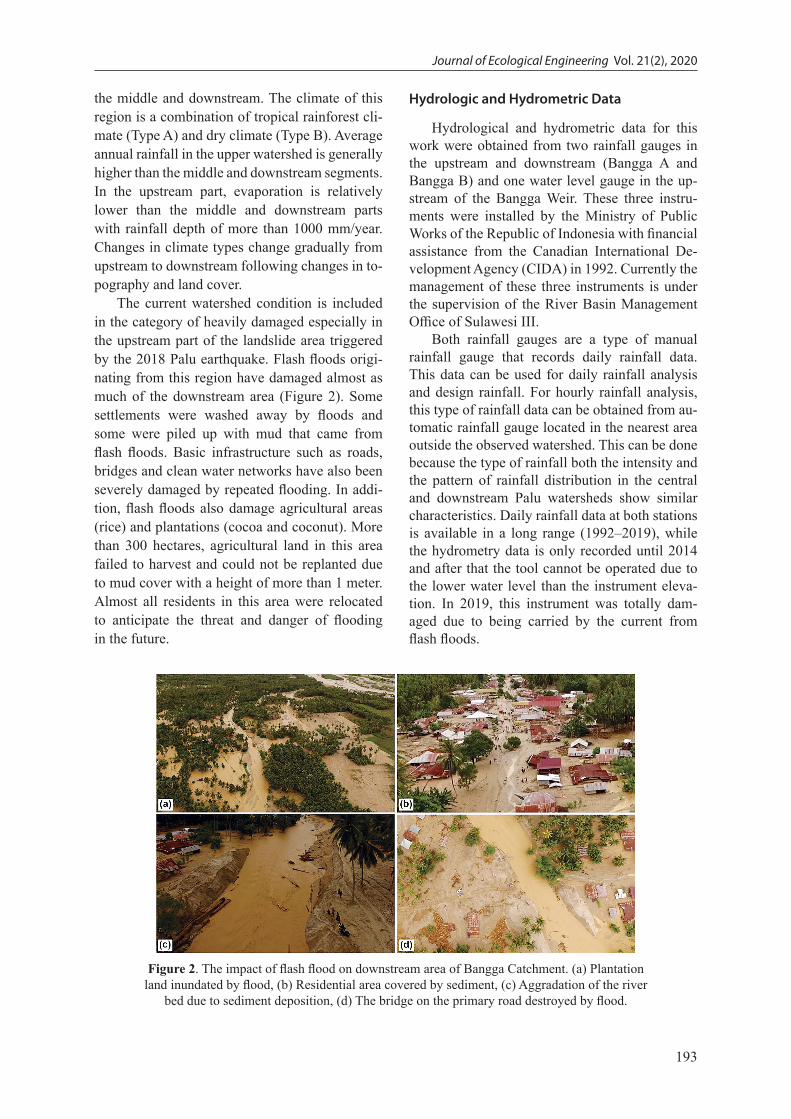
The current watershed condition is included in the category of heavily damaged especially in the upstream part of the landslide area triggered by the 2018 Palu earthquake. Flash floods origi-nating from this region have damaged almost as much of the downstream area (Figure 2). Some settlements were washed away by floods and some were piled up with mud that came from flash floods. Basic infrastructure such as roads, bridges and clean water networks have also been severely damaged by repeated flooding. In addi-tion, flash floods also damage agricultural areas (rice) and plantations (cocoa and coconut). More than 300 hectares, agricultural land in this area failed to harvest and could not be replanted due to mud cover with a height of more than 1 meter. Almost all residents in this area were relocated to anticipate the threat and danger of flooding in the future.
Hydrologic and Hydrometric Data
Hydrological and hydrometric data for this work were obtained from two rainfall gauges in the upstream and downstream (Bangga A and Bangga B) and one water level gauge in the up-stream of the Bangga Weir. These three instru-ments were installed by the Ministry of Public Works of the Republic of Indonesia with financial assistance from the Canadian International De-velopment Agency (CIDA) in 1992. Currently the management of these three instruments is under the supervision of the River Basin Management Office of Sulawesi III.
Both rainfall gauges are a type of manual rainfall gauge that records daily rainfall data. This data can be used for daily rainfall analysis and design rainfall. For hourly rainfall analysis, this type of rainfall data can be obtained from au-tomatic rainfall gauge located in the nearest area outside the observed watershed. This can be done because the type of rainfall both the intensity and the pattern of rainfall distribution in the central and downstream Palu watersheds show similar characteristics. Daily rainfall data at both stations is available in a long range (1992–2019), while the hydrometry data is only recorded until 2014 and after that the tool cannot be operated due to the lower water level than the instrument eleva-tion. In 2019, this instrument was totally dam-aged due to being carried by the current from flash floods.
Figure 2. The impact of flash flood on downstream area of Bangga Catchment. (a) Plantation land inundated by flood, (b) Residential area covered by sediment, (c) Aggradation of the river
bed due to sediment deposition, (d) The bridge on the primary road destroyed by flood.
Journal of Ecological Engineering Vol. 21(2), 2020
194
Digital Elevation Model (DEM)
DEM data are needed to develop a watershed model. The data used for the preparation of the watershed model is the National DEM (DEM-NAS) with a resolution of 8 meters. National DEM is one of the DEM data that was built from several data sources including IFSAR data (5m resolution), TERRASAR-X (5m resolution) and ALOS PALSAR (11.25m resolution). The DEM-NAS spatial resolution is 0.27-arcsecond, using the EGM2008 vertical datum (Geospatial Infor-mation Office of Indonesia – BIG, 2019).
Catchment delineation and stream configura-tion were performed using QGIS (version 3.6). The software is formerly know as Quantum GIS, a open-source desktop and freeware for geographic information system (GIS) analyses. It is has simi-lar capacity and purpose as ArcGIS. In ArcGIS, this analysis is performed using the Spatial An-alyst Tool, while in QGIS It is optimized using Geographic Resources Analysis Support System (GRASS) Tool. DEM visualization and the result of the analyses were illustrated in Figure 3.
HEC-HMS Model
HEC-HMS is a freeware for hydrological analysis. This is included in the semi-distributed model and can be applied to various watershed characteristics (Patil et al., 2019). The structure of this model consists of four components of the Basin Model, Meteorological Model, Control
Specification and Time-Series Data (Natarajan et al., 2019). This model also has five important pa-rameters for Subbasin Area analysis namely Can-opy, Surface, Loss, Transform, and Baseflow and two parameters for reach analysis namely Rout-ing and Loss/Gain (Bay et al., 2019).
Important equations in the HEC-HMS Model used in this study are:1. Surface runoff volume. Evaporation, transpi-
ration and infiltration are the three main factors that influence the volume of runoff. The three components of the hydrologic cycle represent the amount of precipitation loss and can be stated by the formula of the Soil Conservation Service (SCS) Curve Number (CN). The num-ber of precipitation excess and precipitation loss could be estimated using the following equations:
𝑃𝑃" =(𝑃𝑃 − 0.2𝑆𝑆)+
𝑃𝑃 + 0.8𝑆𝑆 (1)
𝑆𝑆 = #
1,000 − 10𝐶𝐶𝐶𝐶𝐶𝐶𝐶𝐶
(foot − poundsystem)
25,400 − 254𝐶𝐶𝐶𝐶𝐶𝐶𝐶𝐶
(SI)= (2)
where 𝑃𝑃" is the accumulation of precipitation excess (mm),
𝑃𝑃 is the accumulation of rainfall excess (mm),
𝑆𝑆 is the potency of maximum retention (mm) and
𝐶𝐶𝐶𝐶 refers to the curve number which ranges from 0 to 100.
Figure 3. Watershed model derived from National DEM (DEM NAS). (a) DEM of the study area, (b) Catchment boundary and stream network of Bangga Watershed generated from DEM.
195
Journal of Ecological Engineering Vol. 21(2), 2020
2. Direct runoff. Overland flow and interflow are the main component of direct runoff. One of the methods in HEC-HMS environment that commonly applied in Indonesian catchment is Snyder. The method is a synthetic unit hydro-graph formula and can be expressed as:
𝑄𝑄" = 0.278 )𝐶𝐶"𝑇𝑇,- 𝐴𝐴 (3)
𝑇𝑇" = 𝐶𝐶%(𝐿𝐿𝐿𝐿()*., (4)
𝑇𝑇" = 𝑇𝑇$ +𝑇𝑇&2
(5)
where: 𝑄𝑄" and 𝐴𝐴 are the peak flow due to 1mm rainfall depth (m3/s) and the area of catch-ment (km2) respectively,
𝐶𝐶" and 𝐶𝐶" refer to storage and empirical constants of watershed.
𝐿𝐿 and 𝐿𝐿" are the length of mainsteram and the distance from the upstream to the stream point closest to the catchment can-ter (km).
𝑇𝑇" , 𝑇𝑇" and 𝑇𝑇" are lag time, peak time and rainfall duration consecutively (hour).
3. Baseflow. This component is the part of pre-cipitation stored continuously in aquifers. It is the portion of the total runoff and can be pre-sented as the exponential recession formula:
𝑄𝑄" = 𝑄𝑄$𝑘𝑘" (6)where: 𝑄𝑄" and 𝑄𝑄" are baseflow at the initial time
(t=0) and at the time t (m3/s), 𝑘𝑘 is constant of exponential decay.
4. Channel flow. Flow routing in the channel basically can be performed using one-dimen-sional dynamic wave equation. One method for solving it is the Muskingum formula derived from water balance concept, they are:
where: 𝐼𝐼 and 𝑂𝑂 represent inflow and outflow (m3/s),
𝑆𝑆 = storage (m3), 𝐾𝐾 is travel time of the flow in the channel
(hour), and 𝑋𝑋 = dimensionless weighting factor.
RESULTS AND DISCUSSION
Landslide
The landslide in the study area was investi-gated by field surveys and satellite imagery anal-ysis (Figure 4). The field investigation aims to verify the interpretation of satellite imagery. Land characteristics of the catchment were analyzed by two images published by BIG (2019) in 2017 and 2019 representing conditions before and after the 2018 Palu earthquake (Figure 4b and Figure 4c). Based on the identification of the two imagery, It is indicated that the landslide covers the upper watershed area of around 10.8 km2 (Figure 4a).
In general, landslide areas are in the upland intermediate of landform (Figure 5a). The topog-raphy in this area is classified as steep hills with a combination of valleys that form tributaries. Geo-morphology like this tends to be very unstable and prone to ground movement if it gets an outer force such as earthquake and heavy rain. Simul-tance of the two forces can generate very inten-sive erosion, due to unstable ground conditions. Surface erosion will occur continuously, as long as the volume of landslides in the area has not been transported downstream by flow. Two main factors, rainfall erosivity and soil erodibility, play an important role in triggering erosion and flood-ing. The magnitude of the two factors is propor-tional to the potential for erosion and flooding in the river channel.
In addition, all landslide areas are in the zone of soil with podzolic type (Figure 5b). This type of soil is generally red-yellow or red-brown with a depth of up to 1 m. Podzolic soil texture is dominated by sand and clay with moderate to high porosity. The high sand content in this soil results in low cohesion and non-compact nature. This soil is infertile and formed by weathering the host rock in a very long period of time. As a result of not being compact, this land easily landslides when it is on a sloping topography and is easily eroded by heavy rainfall.
Many landslide cases due to earthquake trig-gers in various regions of the world can verify the results of this study, especially in earthquake-prone areas in Asia such as Japan and China.
Journal of Ecological Engineering Vol. 21(2), 2020
196
Saito et al. (2018) reported landslides around Asa volcano, Japan induced by heavy rainfall after the 2016 Kumamoto earthquake. The landslide area is located on upside hillslopes and produced mil-lions of cubic meters of sediment downstream. A similar incident had also occurred in China in the past as published by Zhuang et al. (2018). The 1920 Haiyuan earthquake has triggered landslides covering an area of about 177 km2 with a greater volume than landslides in the Avo volcano region. Both types of landslides occur in hilly areas and are triggered by large magnitude earthquakes.
Erosion in landslide areas due to heavy rain-fall has also been confirmed in various regions. Piacentini et al. (2018) has investigated soil ero-sion in Central Italy, precisely at the NE Abruzzo Hills Area. The rate of soil erosion is influenced not only by the characteristics of the soil, but also depends on the nature of rainfall such as intensity and duration. Zhang et al. (2019) predicts the rate of soil erosion due to extreme rainfall on Loess Plateau, China. Statistically, 84.9% of heavy rain-fall factors influence the rate of erosion in the two watersheds investigated.
Figure 4. Land cover of Bangga Catchment visualized with satellite imagery. (a) The site of landslide area in the upstream of the catchment, (b) Landcover at the landslide area before earthquake with 2017
satellite imagery, (c) Landcover on the landslide area after earthquake with 2019 satellite imagery.
197
Journal of Ecological Engineering Vol. 21(2), 2020
Rainfall
As previously reported, heavy rainfalls have occurred and caused flash floods in the Bangga River. Non-uniform intensity rainfall occurred on 28 to 29 April, 2019. Based on data from both rainfall stations at the study site, it was indicated that the daily rainfall on the first day was greater on the second day. Rainfall on these two days each with a depth of more than 100 mm/day or more than 20 mm/hour and included in the category of very heavy rainfall as classified in Table 1. Re-corded at the rainfall station at Indonesian Agency for Meteorological, Climatological and Geophys-ics for Central Sulawesi Province, rainfall on the first day started at 04:00 AM with low intensity. Intensity increased in the next several hours and reached its peak at 06.00 PM. Rainfall intensity at the peak time is 30.4 mm/hour. It gradually de-creases until the next day with moderate to very mild intensity. The dominant rainfall on these two days had moderate intensity.
Hydrological studies show that light and mod-erate rainfall in the first eight hours played a role in saturating the ground surface in all catchment
areas. Especially in landslide areas, mild erosion has begun to occur at the beginning of rainfall. This is indicated by changes in the color of water in the river along with the increase in flow but with very low sediment concentration. Rainfall at subsequent intensities triggers greater erosion in proportion to the increased erodibility of the soil due to saturation.
Floods
Hydrological simulations using the HEC-HMS Model have been carried out under two conditions, before the earthquake and after the earthquake. The difference between the two conditions is the landslide area in the upper catch-ment. CN in landslide areas increased from 60 to 90. Changes in CN in landslide areas reduce infiltration into the soil and increase runoff. This means that most of the rainfall on ground sur-face has the potential to be a direct runoff, as the largest part of flood volume in rivers. In addition sediment eroded in the landslide area also con-tributes to increased discharge (Kha et al., 2018). The results of the rainfall-flood simulation in both conditions were presented in Figure 6.
As presented in Figure 6, the total duration of rainfall from the beginning to the end of the rain-fall is 37 hours and almost reaches 2 days. The flood hydrograph has two peaks where the first peak is greater than the second peak. Basically the flow of the river has started to increase gradually at the beginning of the rainfall. The increase in flow did not initially cause inundation in both riv-er banks and channel capacity was still sufficient. A sudden increase in flow occurs at 05.00 PM and
Table 1. Rainfall classification based on rainfall intensity (Triatmodjo, 2008)
Figure 6. Simulation results using the HEC-HMS Model in the Bangga River on April 28 to 29, 2019
Journal of Ecological Engineering Vol. 21(2), 2020
198
reaches the peak of flooding at 07.00 PM. It is this peak of the flood that causes inundation and damage on the lower side of Bangga Catchment.
The results of flood prediction with hourly rainfall input as presented in Figure 6 produce two types of flood hydrograph due to differences in land cover in the Bangga Watershed, especial-ly in landslide areas, namely hydrograph before the earthquake (red line) and hydrograph after the earthquake (black line). The graph trends of the two hydrographs are the same but both hy-drographs have different discharges. The reason for the similarity of trends in the two graphs is that the parameters and equations used for the simulation on the HEC-HMS Model are not dif-ferent. The difference in discharge is caused by an increase in direct runoff proportionately to CN (Cahyono et al., 2019; Gao eta al., 2019). The concept of linearity that is applied in determining CN has a proportional change in discharge at all hydrograph times (Salami et al., 2017; Yuan et al., 2019). But actually theoretically the phenomenon of rainfall-discharge transformation occurs non-linearly. Difficulties in accommodating physical processes require simplifying assumptions.
Landslide area of 10.8 km2 in the Bangga Wa-tershed is indicated to have increased the peak flood discharge by around 33.3%. Quantitatively, this number is equivalent to a flow of 39.52 m3/s at the peak of the first flood. For the 68.19 km2 wa-tershed area, this increase in flood peaks is clas-sified as very large. The cross section capacity of the Bangga River in the downstream segment is predicted to only reach 80 m3/s. It can be inferred that the channel capacity has actually been ex-ceeded even without landslides in the upper wa-tershed. For this case heavy rainfall of very long duration can be stated as the main cause, whereas for flooding after the earthquake, a combination of these two factors: landslide and heavy rainfall were the determinants of flash floods.
CONCLUSION
Field investigations and scientific analysis have been carried out to estimate the effect of landslides on floods after the 2018 Palu earth-quake. Site observation and interpretation on the satellite imagery published in 2017 and 2019 indicated that landslide has occurred on the up-per Bangga Watershed with an area of 10.8 km2 caused by an earthquake with a magnitude of 7.5.
These slides took place mostly at the hill area of the catchment with a high slope more than 40% due to tectonic activity which causes loss of com-paction and cohesion strength of the soil.
Rainfall with high intensity and long dura-tion is predicted to have triggered erosion in the landslide area. The eroded materials induce flash floods carrying high concentrations of sediment and damaging various types of areas in the down-stream watershed. Specifically, the results of the study indicate that the two factors, namely the landslide area and heavy rainfall as the cause of flash floods in the Bangga River. The landslides in the upper watershed could increase the peak flood by 33.33% from 118.56 m3/s to 158.08 m3/s for conditions before and after the earthquake.
Acknowledgments
This work was funded by the Faculty of En-gineering, Universitas Tadulako (DIPA Grant) with Number: SP DIPA-042.01.2.400962/2019. We thank the faculty leaders for the financial sup-port that has been provided for the research. We also express the highest appreciation to all those who have supported this research, especially to the Regional Disaster Management Agency of Central Sulawesi Province (BPBD), the Human Settlement and Water Resources Office of Central Sulawesi Province (CIKASDA) and the Water Resources Management Board (BWS III).
REFERENCES
1. Andiesse V.W. 2012. The testing of GAMA I syn-thetic unit hydrograph for analysis of flood design in Bangga Catchment. MEKTEK, 14(1), 1–9. [in Indonesian]
2. Bai Y., Zhang Z., Zhao W. 2019. Assessing the im-pact of climate change on flood events using HEC-HMS and CMIP5. Water, Air, and Soil Pollution. 230(119).
3. Bao H., Ampuero J.P., Meng L., Fielding E.J, Liang C., Milliner C.W.D, Feng T., Huang H., Early and persistent supershear rupture of the 2018 magni-tude 7.5 Palu earthquake. Nature Geoscience, 12, 200–205.
4. Bradley K., Mallick R., Alfian D., Andikagumi H., Benazir B., Brocard G., Feng G., Hill E.M., Hub-bard J., Majewski J., Meilianda E., Switzer A., Wei S., Yun S.H. 2009. Wet rice cultivation was the pri-mary cause of the earthquake-triggered Palu land-slides. EarthArxiv, Preprint article.
199
Journal of Ecological Engineering Vol. 21(2), 2020
5. Bradley K., Mallick R., Andikagumi H., Hubbard J., Meilianda E., Switzer A., Du N., Brocard G., Alfian D., Benazir B., Feng G., Yun S.H., Majewski J., Wei S., Hill, E.M. 2019. Earthquake-triggered 2018 Palu Valley landslides enabled by wet rice cultivation. Nature Geoscience, 12, 935–939.
6. Cahyono C., Adidarma W.K., 2019. Influence analy-sis of peak rate factor in the flood events’ calibration process using HEC–HMS. Modeling Earth Systems and Environment, 5(4), 1705–1722.
7. Carvajal M., Cornejo C.A., Sepúlveda I., Melnick D., Haase J.S. 2019. Nearly instantaneous tsuna-mis following the Mw 7.5 2018 Palu earthquake. Geophysical Research Letter, 46(10), 5117–5126.
8. Cummins P.R., 2019. Irrigation and the Palu land-slides. Nature Geoscience, News and Views.
9. Frederik M.C.G., Udrekh, Adhitama R., Hananto N.D., Asrafil, Sahabuddin S., Irfan M., Moefti O., Putra D.B., Riyalda B.F. 2019. First results of a bathymetric survey of Palu Bay, Central Sulawesi, Indonesia following the Tsunamigenic Earthquake of 28 September 2018. Pure and Applied Geophys-ics, 76(8), 3277–3290.
10. Gao Y., Zhang Z., Liu Y. 2019. Sensitivity analysis of parameters of a HEC-HMS model with polders. Journal of Coastal Research, 93,163–169.
11. Geospatial Information Office of Indonesia (BIG). 2019. http://tides.big.go.id/DEMNAS/. Accessed on 20 August 2019. [in Indonesian]
12. Huang C.L., Hsu, N.S, Liu H.J., Huang Y.H., 2018. Optimization of low impact development layout designs for megacity flood mitigation. Journal of Hydrology, 564, 542–558
13. Hui G., Li S., Wang P., Suo Y., Wang I.D. Somer-ville I.D., 2018. Linkage between reactivation of the sinistral strike-slip faults and 28 September 2018 Mw7.5 Palu Earthquake, Indonesia. Science Bul-letin, 63(24), 1635–1640.
14. Kha D.D., Nhu N.Y., Anh T.N. 2018. An approach for flow forecasting in ungauged catchments – A Case study for Ho Ho reservoir catchment, Ngan Sau river, Central Vietnam. Journal of Ecological Engineering, 19(3), 74–79.
15. Lanini A., Yodo S., Syafiuddin I. 2019. The protec-tion of refugees rights of natural disasters in Central Sulawesi Indonesia. Proc. The 3rd International Con-ference on Globalization of Law and Local Wisdom (ICGLOW 2019), 358, 48–50.
16. Mardin R., Shen, Z. 2018. Integrated criteria for flood disaster mitigation in indonesian urban mas-terplan; housing and settlement suitability case in Palu Urban masterplan. Urban Planning and Water-related Disaster Management, Springer Nature, Ba-sel, Switzerland.
17. Maryanti S. 2019. Spatial analysis of social facility
building damage due to the 2018 earthquake in Palu City, Central Sulawesi Province. Bachelor Thesis, Universitas Muhammadiyah Surakarta. [in Indonesian]
18. Miyajima M., Setiawan H., Yoshida M., Ono Y., Kosa K., Oktaviana I.S., Martini, Irdhiani. 2019. Geotechnical damage in the 2018 Sulawesi earth-quake, Indonesia. Geoenvironmental Disasters, 6, 1–8.
19. Natarajan S., Radhakrishnan N. 2019. Simulation of extreme event-based rainfall–runoff process of an urban catchment area using HEC-HMS. Modeling Earth Systems and Environment, 5(4), 1867–188.
20. National Disaster Mitigation Agency of Indonesia (BNPB). 2019. https://www.bnpb.go.id/berita. Ac-cessed on 19 September 2019. [in Indonesian]
21. Pancoro W., Mangoki, W., Prasetyo S.Y.J. 2019. Evaluation of earthquake affected areas in Palu City using OBIA method on Landsat Image 8. Indonesian Journal of Computing and Modeling, 2(1), 32–35. [in Indonesian]
22. Patil V.K., Saraf V.R., Karad O.V., Ghodke S.B., Gore D.K., Dhekale S.S. 2019. Simulation of rain-fall runoff process using HEC-HMS model for Up-per Godavari Basin Maharashtra, India. European Journal of Engineering Research and Science, 4(4), 102–107.
23. Paulik R., Gusman A., Williams J.H., Pratama G.M., Lin S.L., Prawirabhakti A., Sulendra K., Zachari M.Y., Fortuna Z.E.D., Layuk N.B.P., Suwarni N.W.I. 2019. Tsunami hazard and built environment damage observations from Palu City after the Sep-tember 28 2018 Sulawesi earthquake and tsunami. Pure and Applied Geophysics, 176(8), 3305–3321.
24. Piacentini T., Galli A., Marsala V., Miccadei, E. 2018. Analysis of soil erosion induced by heavy rainfall: a case study from the NE Abruzzo Hills area in Central Italy. Water, 10(10), 1314.
25. Saito H., Uchiyama S., Hayakawa Y.S., Obanawa H. 2018. Landslides triggered by an earthquake and heavy rainfalls at Aso volcano, Japan, detected by UAS and SfM-MVS photogrammetry. Progress in Earth and Planetary Science, 5(15).
26. Salami A.W., Bilewu S.O., Ibitoye A.B., Ayanshola A.M. 2017. Runoff hydrographs using Snyder and SCS synthetic unit hydrograph methods: A case study of selected rivers in south west Nigeria. Jour-nal of Ecological Engineering, 18(1), 25–34.
27. Sassa S., Takagawa T. 2019, Liquefied gravity flow-induced tsunami: first evidence and comparison from the 2018 Indonesia Sulawesi earthquake and tsunami disasters. Landslides, 16(1), 195–200.
28. Socquet A., Hollingsworth J., Pathier E., Bouchon M. 2019. Evidence of supershear during the 2018 magnitude 7.5 Palu earthquake from space geodesy. Nature Geoscience, 12, 192–199.
Journal of Ecological Engineering Vol. 21(2), 2020
30. Tunas I.G. 2019. The application of ITS-2 model for flood hydrograph simulation in large-size rain-forest watershed, Indonesia. Journal of Ecological Engineering, 20(7), 112–125.
31. Tunas I.G., Anwar N., Lasminto U. 2018. A syn-thetic unit hydrograph model based on fractal char-acteristics of watersheds. International Journal of River Basin Management, 17(4), 465–477.
32. Tunas I.G., Maadji, R. 2018. The use of GIS and hydrodynamic model for performance evaluation of flood control structure. International Journal on Advanced Science, Engineering and Information Technology (IJASEIT), 8(6):2413–2420
33. Watkinson I.M., Hall R. 2019. Impact of commu-nal irrigation on the 2018 Palu earthquake-triggered landslides. Nature Geoscience, Article in press.
34. Widjaja B., Gautama K.A. 2019. Prediction of the impact of following landslide in Poi Village with the Bingham model. Proc. The 2019 National Civil Engineering Seminar, 95–99. [in Indonesian]
35. Yuan W., Liu M., Wan F. 2019. Calculation of criti-cal rainfall for small-watershed flash floods based on the HEC-HMS hydrological model. Water Re-sources Management, 33(2), 555–2575.
36. Zhang Y., Zhao Y., Liu B., Wang Z., Zhang S. 2019. Rill and gully erosion on unpaved roads under heavy rainfall in agricultural watersheds on China’s Loess Plateau. Agriculture, Ecosystems & Environment, 284(106580).
37. Zhuang J., Peng J., Xu C., Li Z., Densmore A., Milledge D., Iqbal J., Cui Y. 2018. Distribution and characteristics of loess landslides triggered by the 1920 Haiyuan Earthquake, Northwest of China. Geomorphology, 314, 1–12.