ASHA’s National Center for Evidence-Based Practice in Communication Disorders • July 2013 Impact of Literacy Intervention on Achievement Outcomes of Children With Developmental Language Disorders: A Systematic Review Jaumeiko J. Coleman and Rebecca A. Venediktov National Center for Evidence-Based Practice in Communication Disorders American Speech-Language-Hearing Association, Rockville, MD Gary A. Troia Department of Counseling, Educational Psychology, and Special Education Michigan State University, East Lansing, MI Beverly P. Wang National Center for Evidence-Based Practice in Communication Disorders American Speech-Language-Hearing Association, Rockville, MD
Transcript
ASHA’s National Center for Evidence-Based Practice in Communication Disorders • July 2013
Impact of Literacy Intervention on Achievement Outcomes of Children With Developmental Language Disorders: A Systematic Review
Jaumeiko J. Coleman and Rebecca A. Venediktov National Center for Evidence-Based Practice in Communication Disorders
American Speech-Language-Hearing Association, Rockville, MD
Gary A. Troia Department of Counseling, Educational Psychology, and Special Education
Michigan State University, East Lansing, MI
Beverly P. Wang National Center for Evidence-Based Practice in Communication Disorders
American Speech-Language-Hearing Association, Rockville, MD
ASHA’s National Center for Evidence-Based Practice in Communication Disorders • July 2013 1
ABSTRACT Purpose: In this systematic review, the authors examined the impact of literacy intervention on achievement outcomes of school-age children with developmental language disorders.
Method: Databases containing peer-reviewed academic studies were searched for randomized and nonrandomized controlled trials that reported efficacy and comparative efficacy findings in English. Methodological quality and strength of evidence were also evaluated.
Results: Nine reading intervention studies were accepted; no writing intervention studies were identified that met the inclusion criteria for this systematic review. Findings were grouped by reading intervention category (e.g., synthetic phonics) and outcome (e.g., spelling). Efficacy was noted for all reading intervention categories for a variety of outcomes, with synthetic phonics efficacy findings being the most prevalent, followed by analytic phonics and the whole-word method. Comparative efficacy findings were limited and mixed. Strength of evidence ratings were strongest for synthetic phonics, followed by analytic phonics.
Conclusions: Consistent with previous research, synthetic phonics interventions resulted in improvements across achievement outcome categories. In future studies, researchers should provide both statistical and clinical significance data to facilitate comprehensive interpretation of study findings via meta-analysis. Also, the efficacy and comparative efficacy of writing intervention should be researched in this population.
Keywords: school age, developmental language disorder, literacy intervention, achievement outcomes
The American Speech-Language-Hearing Association’s National Center for Evidence-Based Practice (N-CEP) was charged with developing an evidence-based systematic review (EBSR) of studies reporting on the impact of written language (i.e., reading and writing) interventions on achievement outcomes of school-aged children with developmental language disorder (DLD). The relatively recent adoption of the Common Core State Standards by the bulk of the United States and its territories underscores the importance of this topic (Common Core State Standards Initiative, 2012). The standards were created to promote quality and consistency in education for all students so as to adequately prepare them for college and the workforce. The standards stem from the domains of mathematics and English language arts and literacy in history/social studies, science, and technical subjects. A primary consideration in the development of the English language arts standards was the need to prepare students to (a) independently and proficiently use listening and speaking to obtain, assess, and present increasingly complex information (www.corestandards.org); (b) read and comprehend texts that increase in complexity; and (c) write logical arguments, informational/explanatory texts, and narratives as students progress through school (Common Core State Standards Initiative, 2012). School-aged children with difficulty in any of these language domains are at risk for poor performance in many areas of life—school, the workforce, and independent functioning in aspects of everyday living, such as engaging in self-care activities and managing finances (e.g., Conti-Ramsden & Durkin, 2008, 2012; Graham & Hebert, 2010; Johnson, Beitchman, & Brownlie, 2010; Maughan, 1995). Given the complexity surrounding the acquisition of written language skills and
ASHA’s National Center for Evidence-Based Practice in Communication Disorders • July 2013 2
the accompanying profound importance of these skills, the impact of various interventions to habilitate DLD must be examined.
At the inception of this EBSR, a search of the current literature base was conducted for systematic research syntheses and guidelines that focus on achievement outcomes associated with written language interventions that have been used with school-age participants who have DLD. Several systematic reviews, meta-analyses, and guidelines have been published on the efficacy of certain therapy protocols designed to address deficits in reading and/or writing (see, e.g., Duff & Clarke, 2010; Gersten et al., 2008; Graham & Perin, 2007; National Institute of Child Health and Human Development [NICHD], 2000; U.S. Department of Education, 2010; Wanzek, Wexler, Vaughn, & Ciullo, 2010). Reading interventions tended to be based on phonics and/or whole-word methods, whereas writing interventions typically addressed the development of skills associated with improving the writing process and/or product.
A variety of reading interventions have been implemented across disorder categories; many of these interventions are based on different theories of reading development progression (see, e.g., Chall, 1983) and the reading process (see, e.g., Adams, 1990). These theories have led to the implementation of phonics, the whole-word method, or a hybrid of the two, all of which form the basis for the bulk of reading interventions previously researched. Phonological processing deficits—such as impaired phonological awareness, phonological memory, or phonological learning; nonword repetition; and rapid automatic naming—are thought to be the primary causes of specific reading disability (Lyon, 1995; Lyon, Shaywitz, & Shaywitz, 2003). As such, a logical and substantiated
conclusion is that these children struggle with words at the phoneme level (van Kleeck, Gillam, & Hoffman, 2006). Given that conclusion, phonics instruction—which emphasizes the acquisition of letter–sound correspondence as well as how those letter-sound combinations are used in spelling and reading (NICHD, 2000)—appears to be a natural selection for improving reading, especially for struggling readers. Within the realm of phonics, practitioners can select between several types of phonics methods. For example, synthetic phonics, which focuses on word decoding at the phonemic level, and analytic phonics, which addresses reading at the onset–rime level, may be selected on the basis of a clinician’s beliefs about the client’s method as well as current skill level. As an alternative, some researches have suggested using a whole-word method. Although children with language-based disorders who have reading difficulty may present with phonological and orthographical processing impairments, the former tends to be the core deficit, and, as such, some researchers have suggested that the relatively unimpaired route (i.e., use of a whole-word method) should be used for reading instruction (Foorman, Breier, & Fletcher, 2003). In fact, rapid word recognition is thought to be a function of skilled readers’ ability to recognize a whole word as quickly as they can name a single letter (Ehri & Snowling, 2004). It has been surmised that because whole words correspond more consistently with spoken words, they are easier to access than single letters or entire sentences (Ehri & Snowling, 2004). Findings from a systematic review on the impact of phonics in teaching reading and spelling revealed a positive effect of systematic synthetic or analytic phonics instruction on reading accuracy when compared with a whole-language or whole-word method (Torgerson, Brooks, & Hall, 2006). Nonstatistically significant findings
ASHA’s National Center for Evidence-Based Practice in Communication Disorders • July 2013 3
corresponding with negligible effect sizes (in favor of systematic phonics instruction) were noted for all other outcomes (e.g., reading comprehension, spelling). No significant differences were noted between the outcomes of synthetic phonics instruction versus analytic phonics instruction.
A substantial amount of writing intervention efficacy research has been completed on other populations of school-aged children—in particular, children with learning disabilities, a population that includes children with language-based learning difficulties. For example, considerable improvements in writing achievement have been noted across studies of children with learning disabilities (LD). Emphasis on handwriting and writing mechanics (e.g., spelling, capitalization, and punctuation) in primary grades was found to support the acquisition of later composing skills, and instruction on planning, writing, and revising strategies was found to improve the length, structure, and overall quality of written output (Baker, Chard, Ketterlin-Geller, Apichatabutra, & Doabler, 2009; Baker, Gersten, & Graham, 2003; Graham, 2006; Graham & Perin, 2007). To concomitantly improve the reading and writing skills of students with LD, researchers indicate that students should write about texts that they read, and educators should (a) teach them writing skills and processes that authors use to produce texts and (b) increase how much and how often students write (Graham & Hebert, 2010).
It is surprising to note, however, that no systematic review or guideline has reported exclusively on written language studies of school-aged children with a diagnostic label of “DLD.” As such, the relevance of findings from those research syntheses and guidelines to the DLD population remains unknown. Thus, an EBSR is warranted to
better understand the effect of written language interventions on the academic achievement of school-aged children with DLD and to determine whether particular written language interventions may be more or less advantageous for children with DLD. Prior to initiating this EBSR, we considered the following two issues pertaining to DLD that affect the characterization of the participant population for this EBSR:
1. Several definitional concerns exist that complicate attempts to identify, from study to study, those participants who might fall into the DLD category.
2. These definitional issues result in different implications for researchers, who focus on etiology and disorder classification, and clinicians, who concentrate on language intervention needs in order to achieve targeted functional communication outcomes as mechanisms for selecting efficacious interventions.
Definitional Issues Research of the DLD definition revealed that, although there is a general consensus regarding the exclusion criteria for DLD (i.e., presence of a language impairment in the absence of sensory impairment, frank neurological disorder, psychiatric or emotional condition, and intellectual disability; Leonard, 2002; Lyon, 1995; Verhoeven & van Balkom, 2004), there is little agreement regarding the language profiles that should be included in the DLD diagnosis, and no consistent definition or classification system is widely accepted (Hall, 1997). The following list denotes the specific definitional issues that are associated with DLD as well as information that supports or negates each issue.
• Typically, definitions are provided for what are often referred to as “subtypes of DLD,” including specific language
ASHA’s National Center for Evidence-Based Practice in Communication Disorders • July 2013 4
impairment (SLI) and developmental dyslexia (see, e.g., Catts, Adlof, Hogan, & Weismer, 2005). The shared language basis of SLI, developmental dyslexia, and developmental dysgraphia is exemplified by the commonality of their characteristics (see Table 1 for definitions of these terms). In regard to dyslexia and SLI, McArthur, Hogben, Edwards, Heath, and Mengler (2000) reported high co-morbidity between SLI and dyslexia as follows: 53% of children diagnosed with dyslexia or SLI could be equally classified as having the other condition, 55% of children with dyslexia present with oral language difficulties, and 51% of children with SLI demonstrate characteristics of dyslexia (i.e., word reading deficits).
• SLI—as well as developmental dysphasia/aphasia—is considered by some to be another label for DLD (Verhoeven & van Balkom, 2004).
• In other cases, a distinction has been made between “pure or specific DLD” (i.e., SLI) and co-morbid DLD. In cases of specific DLD, the primary deficit is DLD as defined by a particular set of inclusion and exclusion criteria; in cases of co-morbid DLD, individuals with other developmental disorders, such as autism, also present with characteristics of DLD (Hall, 1997; Rapin, 1996). Tomblin (2011) expounded upon the co-morbidity notion by reporting that individuals with SLI and autism share neurological features (e.g., small right perisylvan volumes relative to the left hemisphere), which suggests that they are overlapping conditions in their neurodevelopmental characteristics and that they share common risk
factors or etiologies. However, characteristics of the disorders differ notably, such as those in the linguistic realm (e.g., social communication deficits in autism versus language structure impairments in SLI). Therefore, although a close relationship between these two developmental disorders is evident, each is its own distinct disorder.
• The spoken language difficulties of a portion of the children diagnosed with DLD early in life “resolve” by school age, leading some to consider those difficulties to be an artifact of “developmental lag” versus an actual disorder (Rapin, 1996). However, those same children may later resurface as needing additional educational support when written language instruction begins and as language demands become more prevalent and complex across school subjects (Rapin, 1996). It is likely the chronicity of DLD that results in the phenomenon reported anecdotally, in which the developmental trajectory of some children with DLD includes later diagnosis of specific learning disability (SLD) when written language difficulties arise. This notion pertaining to the association between DLD and SLD is further substantiated by the overlap in their classification criteria (see definitions for DLD and SLD in Table 1) as well as the “popular conceptualization of [learning disability] as having to do with language processing disorders” (Scanlon, 2013, p. 27). Yet, the definition of SLD used in federal special education legislation is not narrow enough to solely pertain to participants with “pure DLD” because it includes participants with conditions
ASHA’s National Center for Evidence-Based Practice in Communication Disorders • July 2013 5
such as brain injury or minimal brain dysfunction.
• Certain language-based disorders, such as developmental dyslexia and developmental dysphasia, are considered subtypes of both SLD and DLD (Berninger & O’Malley May, 2011; Catts, 1989, 1996; Tannock, 2013).
• Controversy exists as to whether the DLD population includes individuals with only spoken language disorder or also extends to those with sole or concomitant written language disorder (see, e.g., Catts, 1989, 1996). In fact, it is not uncommon for children with written language difficulty to have a previously diagnosed (see, e.g., Catts, Fey, Tomblin, & Zhang, 2002; Stothard, Snowling, Bishop, Chipchase, & Kaplan, 1998) or concurrent (e.g., Cain & Oakhill, 2006) spoken language disorder. The relationship between spoken and written language is also noted from a developmental perspective: The building blocks for reading and writing include adequate listening and speaking skills (see, e.g., Shanahan, 2006).
• Discrepancy-based criteria—or, using the discrepancy between a referential standard for global functioning or ability (e.g., IQ, nonverbal mental age, chronological age) and a target skill area (e.g., overall language performance, academic achievement in reading) to determine whether individuals qualify for a particular disorder or are eligible for clinical services—have been applied by some researchers (Kamhi, 1998; Lahey, 1990). Yet, controversy exists as to whether this practice is sound, given the arbitrary cutoff points that lack a
strong rationale for the chosen degree of discrepancy (Lahey, 1990). In addition, the use of discrepancy-based criteria has resulted in children with language difficulties in the absence of an IQ–language ability discrepancy being excluded from clinical services (Kamhi, 1998). Further, in some instances, a “wait-to-fail” model is employed, whereby seemingly at-risk students are monitored and, if an IQ–achievement discrepancy arises, then those students are provided with special education services. It is obvious that this means some students are not receiving early intervention services because they do not meet the IQ–discrepancy criteria, despite demonstrating a need for those services. Another point of concern is that discrepancy scores can be unreliable, resulting in individuals moving into or out of a disorder category from one evaluation period to the next (Bishop, 2004). Finally, research indicates that children with average and below-average nonverbal IQs have benefitted equally from language therapy (Cole, Dale, & Mills, 1992; Fey et al., 1994, as cited in Kamhi, 1998).
Intervention Selection: Researcher Versus Clinician Perspective The definitional issues associated with DLD have repercussions not only for the determination of pertinent linguistic profiles (and, hence, the disorder labels they subsume) but also for the selection of efficacious interventions. Researchers have focused on the identification of disorder etiology as a foundation for selecting effective interventions for the population of children with DLD (Dempsey & Skarakis-Doyle, 2010; Tomblin, 2011); as such, the detection of systematic linguistic
ASHA’s National Center for Evidence-Based Practice in Communication Disorders • July 2013 6
impairments along with the related underlying processes and mechanisms that distinguish one disorder population from another is paramount (Dempsey & Skarakis-Doyle, 2010). In so doing, the variability in disorder characteristics is relatively controlled, which allows for more robust assertions about treatment efficacy and effectiveness. Conversely, clinicians are charged with enhancing the communication skills of all children on their caseloads; thus, although the diagnostic label is important, improved functional communication—versus accurate disorder classification—is the target outcome.
Application of the conceptual framework of the World Health Organization’s International Classification of Functioning Disability and Health (ICF) to persons with language impairment substantiates consideration of targeted functional communication outcomes in addition to the diagnostic label as indicated by (a) individuals grouped on the basis of etiology or clinical category and (b) linguistic profile may function in markedly different ways (Dempsey & Skarakis-Doyle, 2010). As a consequence, etiological boundaries tend to blur when human functioning becomes the clinical basis for describing language ability (Dempsey & Skarakis-Doyle, 2010; Morris, 1988). Thus, although distinct diagnostic criteria based on linguistic skills are imperative to uncovering the etiology of DLD or characterizing its linguistic sequelae, they are not sufficient for predicting an individual’s functional language use or determining how to enhance language use through specific interventions. More specifically, “intervention methods that are successful in improving the everyday functioning of a child with a [language impairment] may not be [successful] for another child with [language impairment] even when their etiological classification and the extent and nature of
their linguistic impairments are similar—because in other important components of functioning the children may, in fact, differ” (Dempsey & Skarakis-Doyle, 2010, p. 432). Moreover, the fact that developmental disabilities share many commonalities suggests that some interventions may be suitable for children with quite distinct disorders (Campbell & Skarakis-Doyle, 2007).
Although researchers and clinicians may differ in the ways in which they select treatments for children with DLD, their ultimate goal is the same—to identify and implement interventions that show proven efficacy. Thus, a balanced approach to choosing a written language intervention should include consideration of the aforementioned definitional issues about what constitutes a DLD, the child’s diagnosis, and target functional communication outcomes. Phases of Research Evaluation of the therapeutic effect of target interventions should occur within controlled and real-world environments; cost-effectiveness of intervention implementation should also be determined. Researchers of communication disorders have adapted frameworks within which the impact of interventions can be assessed in these ways along a continuum delineated as phases of clinical outcomes research (e.g., pre-trial studies, feasibility studies, exploratory studies, efficacy studies, effectiveness studies, and cost-effectiveness studies; Fey & Finestack, 2009; Robey, 2004; Robey & Schultz, 1998). Initially, developmental aspects of the research are considered (e.g., exploratory studies). Then, efficacy in controlled (i.e., efficacy) and then real-world (i.e., effectiveness) environments are considered. Finally, the financial aspects associated with achieving efficacy in the real world are evaluated (i.e.,
ASHA’s National Center for Evidence-Based Practice in Communication Disorders • July 2013 7
cost-effectiveness). Myriad research has substantiated the efficacy of written language interventions across several other populations, some of which likely include our target population; therefore, studies accepted for this EBSR evaluate efficacy, effectiveness, and/or cost-effectiveness of target interventions. Focus of This EBSR Considering that (a) there is a lack of consensus as to what constitutes “pure DLD,” (b) multiple factors beyond an individual’s diagnostic label have been implicated as influencing language performance, and (c) in education (including special education and related services), “classification is based on perceived educational needs rather than clinical diagnosis” (Tannock, 2013, p. 12), a broad scope of inclusion was chosen for this EBSR. This means that all studies of children with spoken or written language difficulty—regardless of diagnostic label—would be considered for acceptance in this EBSR as long as our select inclusion and exclusion criteria were not violated. Moreover, the use of discrepancy-based criteria was not a requisite for study acceptance, given the multitude of concerns associated with its application. In the set of studies synthesized in this EBSR, participants met the following inclusion and exclusion criteria, as these criteria comprise the most consistently used exclusion criteria for identifying individuals with DLD: school-aged children with spoken and/or written language learning difficulties in the absence of intellectual disability, psychiatric or emotional condition, frank neurological disorder, and sensory impairment (Leonard, 2002; Lyon, 1995; Verhoeven & van Balkom, 2004).
The following questions were addressed in this EBSR:
1. What is the effect of reading intervention on achievement outcomes of school-aged children with DLD (i.e., spoken and/or written language learning difficulties in the absence of intellectual disability, psychiatric or emotional condition, frank neurological disorder, and sensory impairment)?
2. What is the effect of writing intervention on achievement outcomes of school-aged children with DLD (i.e., spoken and/or written language learning difficulties in the absence of intellectual disability, psychiatric condition, frank neurological disorder, and sensory impairment)?
METHOD To complete this EBSR, a multistep approach was taken: (1) identify peer-reviewed articles that address the population of interest and clinical questions; (2) evaluate the methodological rigor of accepted studies; (3) determine the quality of the body of research linked to each outcome; (4) categorize written language interventions and achievement outcomes; and (5) assess the findings in relation to the clinical questions. Search Strategy The four authors agreed upon the clinical questions, prolific authors, search terms, inclusion and exclusion criteria, and search criteria that formed the basis of the systematic review conducted from August 2010 through September 2011 (see full list of key words and 28 databases in the Appendix). The review considered peer-reviewed randomized and nonrandomized controlled studies, published from 1980 to the present, in which authors examined the
ASHA’s National Center for Evidence-Based Practice in Communication Disorders • July 2013 8
efficacy of reading and/or writing interventions using (a) normed test outcomes, (b) experimental task outcomes, (c) curriculum-based assessment outcomes, and/or (d) student, parent, and teacher ratings of the intervention effect(s) to measure achievement outcomes. Because the clinical questions that were posed included evaluation of the impact of written language interventions on achievement outcomes, this EBSR reports on outcomes in the domains of reading, writing, and mathematics (impaired verbal and nonverbal numerical skills have been noted in individuals with SLI; see Arvedson, 2002; Fazio, 1994, 1996, 1999; Koponen, Mononen, Rasanen, & Ahonen, 2006). Inclusion and Exclusion Criteria Participants included school-aged children 6–18 years of age with spoken and/or written language impairments in the absence of intellectual disability, psychiatric or emotional condition, frank neurological disorder, and sensory impairment. We included in this EBSR only those studies that specifically stated the inclusion of participants presenting with spoken and/or written language deficits or a disorder (i.e., inclusion criteria) in the absence of the aforementioned exclusion criteria. Together, these inclusion and exclusion criteria constitute this EBSR’s participant classification criteria (see Table 2 for participant classification criteria). Some studies that included participants with SLI, SLD, and reading impairment were excluded because information was not provided regarding all of our exclusionary criteria. Studies that contained mixed-age populations were excluded unless the mean age of the participants was within the target age range or the data were segregated by age.
Study Selection and Critical Appraisal All relevant titles and abstracts were evaluated for preliminary inclusion by the first two authors independently. The same authors independently reviewed the full texts of all initially accepted studies to determine final inclusion. In cases of disagreement, the conflict was resolved by consensus or under the advisement of the third author. Accepted studies were then evaluated for quality using ASHA’s appraisal scheme (Cherney, Patterson, Raymer, Frymark, & Schooling, 2008; Mullen, 2007). The first two authors examined study quality by evaluating the following indicators: adequacy of the protocol description, blinding of assessors, description of the sampling process and whether random sampling occurred, controlling for order effects through randomization or counterbalancing, reporting of p values relevant to the clinical questions, reporting of effect sizes relevant to the clinical questions, analysis of intention-to-treat for randomized controlled trials (RCTs), and treatment fidelity (see Table 1 for a detailed description of ASHA’s appraisal scheme). Disagreement regarding quality was resolved via consensus or via consultation with the third author.
Data Extraction Data points that were extracted included clinical question(s) addressed, study design, demographic characteristics (e.g., number of participants, age range, diagnostic information), intervention and service delivery characteristics (e.g., intervention type, duration of treatment), treatment outcome characteristics (e.g., outcomes measured, psychometric properties), and study limitations. The first two authors individually perused each article and then discussed the findings until they reached a
ASHA’s National Center for Evidence-Based Practice in Communication Disorders • July 2013 9
consensus on all information to be extracted from each article. Statistical Significance and Effect Size For this EBSR, results were considered statistically significant if the p value was less than .05. When pertinent and sufficient quantitative outcome data were provided in studies that did not report p values, effect sizes, or confidence intervals, those statistics were computed. For the purpose of assigning descriptive labels to effect sizes reported, the following modified version of Cohen’s (1988) classification of effect size magnitude was used: small = .34 or less; medium = .35–.64; large = .65 or greater. For efficacy findings, positive effect sizes favor the treatment. Reading Intervention and Achievement Outcome Categories Analysis of the treatments used across studies revealed common features that allowed for grouping of treatments into one of the following four categories or a combination of those categories (see Table 1 for definitions of the categories): analytic phonics, phonological awareness, synthetic phonics, and whole-word method. The majority of the study findings were clustered into one of the following outcome categories: word-recognition-in-isolation, word-recognition-in-text, nonword reading, word recognition speed, text reading fluency, text comprehension, spelling, and mathematics. Strength of Evidence We used a modified version of the Cincinnati Children’s Hospital grading-of-evidence scheme, Let Evidence Guide Every New Decision (LEGEND; Cincinnati Children’s Hospital, 2011) to determine the strength of evidence for each outcome category in this EBSR. In consideration of the Agency for Healthcare Research and
Quality’s (AHRQ) recommended domains (i.e., risk of bias, directness, consistency, precision) for guiding the grading of strength of evidence (Viswanathan et al., 2012), selective outcome reporting—a construct associated with risk of bias—was evaluated as part of the grading of strength of evidence for this EBSR. In addition, because articles accepted for this EBSR are intervention studies, treatment fidelity was also considered when grading the strength of evidence. Select quality indicators in the LEGEND grading-of-evidence scheme that were not pertinent to this EBSR were omitted (e.g., application of findings in your clinical setting, identification of adverse effects).
For each reading intervention by outcome category comparison, the quantity of studies, quality of each study (i.e., RCTs [Levels 2a, 2b] and controlled trials [Levels 3a, 3b]), and strength of evidence grade (i.e., high, moderate, low, unassignable) were reported. Study quality Levels 1a, 1b, 4a, 4b, 5a, and 5b were not applied because no meta-analyses (i.e., Levels 1a, 1b), qualitative studies (i.e., Levels 4a, 4b), or expert opinion or case study findings (i.e., Levels 5a, 5b) were accepted for this EBSR. The “a” and “b” designators for each level of study quality indicate “good quality” or “lesser quality,” respectively. The “unassignable” grade was applied when no high-quality studies (i.e., Level 2a) were reported or when outcomes were provided from a small number of lower-quality studies (i.e., Levels 2b, 3a, 3b).
Interrater Reliability We used Cohen’s kappa coefficient and weighted kappa (both designated as “κ”) to calculate the interrater reliability of the two authors who completed the sifting of abstracts and full-text articles, the critical appraisal process, and strength of evidence ratings. Cohen’s κ was used in instances in
ASHA’s National Center for Evidence-Based Practice in Communication Disorders • July 2013 10
which only two rating options equal in weight were available for selection. Weighted κ was applied to critical appraisal items that had hierarchical rating options (i.e., sampling process, random allocation, controlling for order effects, precision). We used Landis and Koch’s (1977) scale for interpreting κ to categorize the strength of the agreement: poor agreement (< .00), slight agreement (0.00–0.20), fair agreement (0.21–0.40), moderate agreement (0.41–0.60), substantial agreement (0.61–0.80), and almost perfect agreement (0.81–1.00). Percent agreement was reported when the κ could not be computed or when the κ value was 0.
RESULTS No studies of participants identified with a diagnosis of a spoken language disorder (e.g., SLI), developmental dysgraphia, or learning disabilities met this EBSR’s target population classification criteria for inclusion. Also, no studies were identified that addressed the second clinical question (i.e., “What is the effect of writing intervention on achievement outcomes of school-aged children with DLD [i.e., spoken and/or written language learning difficulties in the absence of intellectual disability, psychiatric or emotional condition, frank neurological disorder, and sensory impairment]?”). In regard to phases of research, several studies took place in a real-world setting (i.e., school), which is one requisite for classification as an effectiveness study. However, other characteristics of the accepted studies were more consistent with efficacy studies, such as the fact that the population studied was narrow and that service delivery aspects were relatively controlled within each study across the control and intervention groups. As such, studies were classified as “efficacy studies” or “comparative efficacy studies”; none were classified as “effectiveness
studies” or “cost-effectiveness studies.” We included only those comparative studies that were part of an efficacy study, to ensure that efficacy or effectiveness had been determined for the interventions of interest prior to those interventions being compared with one another. For example, in an efficacy study, the authors compared control group data to similar data from at least one intervention group, whereas authors examined comparative efficacy by comparing outcomes data from two or more intervention groups from the same study. Therefore, the final accepted collection of studies for this EBSR represents only those studies of reading intervention efficacy for school-aged participants with reading impairments or disorders.
The systematic search yielded 1,014 citations. Of those, 1,005 were rejected after a review of the abstract or full text; therefore, nine studies were accepted for this EBSR. A list of excluded studies, which includes the reason(s) for ineligibility, is available upon request.
Interrater reliability for article selection was substantial (κ = .76). For critical appraisal, interrater reliability was in the moderate agreement range or higher for κ (.44–1.00) and high for percent agreement (order effects = 100%, study protocol = 90%). There was moderate agreement for grading of the body of evidence as indicated by the κ rating of .41 (see Table 3).
Study Quality As indicated in Table 2, the majority of studies are RCTs with an inadequate description of the allocation scheme. In most studies, an adequate description of the protocol was provided, convenience sampling was used, and treatment fidelity was assessed. Evaluation of order effects was not applicable, as all studies were either parallel-group RCTs or nonrandomized controlled trials. Also, in many instances, p
ASHA’s National Center for Evidence-Based Practice in Communication Disorders • July 2013 11
values and/or effect sizes were reported or calculable.
Additional data that were extracted and that were associated with study quality were the reporting of equivalence of groups at pre-test (see Table 3), study limitations (see Table 4), and the internal consistency of outcome measures administered. With regard to internal consistency, only Blachman et al. (2004) and Soriano, Miranda, Soriano, Nievas, and Felix (2011) provided those data for all outcome measures or some outcome measures, respectively, that were used in their studies. Internal consistency scores ranged from .87 to .97 for all standardized and experimental measures administered in Blachman et al. (2004). In Soriano et al. (2011), internal consistency was reported only for the PROLEC-SE: Text Comprehension task (Ramos & Cuetos, 2003; Cronbach’s ɑ = .84).
Participant and Intervention Characteristics Table 4 provides characteristics of the study participants, all of whom were 6.0–11.5 years of age and were diagnosed with reading disability or difficulty. Most studies reported that participants spoke English as their primary language and, typically, included more male than female participants. Interventions were administered primarily by study authors and/or teachers in classrooms in pediatric hospitals, schools, or other academic settings (see Table 3). Although the total number of sessions and duration of treatment varied across studies, most were provided three to five times per week for 50–60 min per session in an individual or small-group format. Table 5 contains study condition descriptions. Study Findings Due to the amount of data reported in the studies selected for this EBSR, standardized
and experimental task data are summarized in the efficacy and comparative efficacy sections below; only statistically significant findings are reported. The majority of the studies in this EBSR address both treatment efficacy and comparative efficacy. No curriculum-based assessment outcomes or student, parent, or teacher ratings on the intervention effects were reported. Table 4 provides detailed data extracted from the accepted studies, including sample sizes, p values (statistically significant and nonsignificant), and effect sizes with accompanying confidence intervals, when available. Text-reading fluency data were reported in two studies: Shaywitz et al. (2004) and Soriano et al. (2011; see Table 1 for a distinction between text-reading fluency and word recognition speed). Written language outcomes that did not correspond to the seven achievement outcome categories are reported in Table 6. Given the link between written language and spoken language (Kamhi & Catts, 2005), spoken language outcomes in the accepted studies are reported in Table 7. Summary of efficacy findings across reading intervention categories. A summary of efficacy findings within the following intervention categories is provided in the subsequent sections: synthetic phonics reading interventions, analytic phonics reading interventions, whole-word reading interventions, and integrated reading interventions
Synthetic phonics reading interventions. Efficacy findings related to synthetic phonics interventions (treatment group [TG] in Blachman et al., 2004; phonological analysis and blending/direct instruction [PHAB/DI] in Lovett et al., 1994; experimental intervention [EI] in Shaywitz et al., 2004: intervention program [IP] in Soriano et al., 2011) were reported for the following outcomes: word-recognition-in-
ASHA’s National Center for Evidence-Based Practice in Communication Disorders • July 2013 12
isolation, word-recognition-in-text, nonword reading, word recognition speed, text comprehension, spelling, and mathematics. Although data were available from standardized tests for all outcomes, only word-recognition-in-isolation, word recognition speed, and spelling data were reported from experimental tasks. A substantial number of statistically significant standardized test results in favor of the treatment group (17/23 results in favor of the treatment group [FTG]) were noted within all outcome categories with the exception of mathematics. Most effect sizes across outcomes ranged from medium to large in magnitude (ds = 0.45–2.91). Experimental task findings pertained only to word-recognition-in-isolation, word recognition speed, and spelling outcomes; almost all outcomes in those categories were statistically significant in favor of the treatment group (7/8 FTG).
Analytic phonics reading interventions. Efficacy findings related to analytic phonics interventions (word identification strategy training [WIST] in Lovett et al., 1994; word analogy training [WAT] in O’Shaughnessy & Swanson, 2000) were reported from both standardized tests and experimental tasks. Word-recognition-in-isolation, nonword reading, text comprehension, spelling, and mathematics outcomes were provided from standardized tests, whereas only word-recognition-in-isolation outcomes were reported from experimental tasks. All statistically significant findings and effect size directions favored the treatment group, with the exception of the mathematics outcomes, which were in favor of the control group (d = –0.86). At least one statistically significant result from a standardized test was noted for all outcomes with the exception of word-recognition-in-isolation (5/14 FTG). Excluding mathematics outcomes, medium (nonword reading) and large (text comprehension and spelling)
effect sizes were reported (ds = 0.47–0.65). For experimental data, only word-recognition-in-isolation outcomes were reported; across studies, all findings in this outcome category for which statistical significance was discussed were statistically significant (2/2 FTG).
Whole-word reading interventions. Efficacy outcomes associated with whole-word method interventions (oral and written language skills [OWLS] in Lovett, Ransby, & Barron, 1988, and in Lovett, Ransby, Hardwick, Johns, & Donaldson, 1989; regular [equals] exception group [REG = EXC] in Lovett, Warren-Chaplin, Ransby, & Borden, 1990) were reported from standardized tests and experimental tasks. Standardized test data included findings from all outcome categories. Experimental task data, however, were available for all outcome categories with the exception of mathematics. For standardized test data, only word-recognition-in-isolation outcomes had statistically significant results, and they favored the treatment group (3/5 FTG). An effect size, which was medium in magnitude, was reported for word-recognition-in-isolation (d = 0.41). For experimental task data, statistically significant findings were found in favor of the treatment group in word-recognition-in-isolation (3/12 FTG), word-recognition-in-text (1/1 FTG), nonword reading (0/1 FTG), word recognition speed (5/11 FTG), text comprehension (2/2 FTG), and spelling (4/6 FTG). Using data provided in Lovett et al. (1988), medium (word recognition speed, d = 0.44) and large (word-recognition-in-isolation, d = 0.71) effect sizes were computed for experimental tasks.
Integrated reading interventions. Standardized test and experimental task efficacy findings associated with combined synthetic phonics and analytic phonics interventions (decoding skills [DS] in Lovett et al., 1988, 1989; dyslexia training program
ASHA’s National Center for Evidence-Based Practice in Communication Disorders • July 2013 13
[DTP] in Oakland, Black, Stanford, Nussbaum, & Balise, 1998) fell into all achievement outcome categories with the exception of mathematics. The bulk of the statistically significant data in favor of the treatment group from standardized tests (3/5 FTG) and experimental tasks (5/6 FTG) was in word-recognition-in-isolation. For word-recognition-in-isolation outcomes, a small (d = 0.06) and a medium (d = 0.63) effect were reported from standardized test outcomes, whereas medium to large effects (ds = 0.60–2.15) were reported from experimental task data. Statistical significance was also noted across standardized tests and experimental tasks for spelling outcomes (3/6 FTG). Small effect sizes were generated from standardized test data for nonword reading (d = 0.13) and for text comprehension (d = 0.33).
Only one study—Lovett et al. (1990)—reported achievement outcomes pertaining to a combined synthetic phonics and whole-word-method intervention (i.e., regular [does not equal] exception group; REG≠EXC). Standardized test data were available for word-recognition-in-isolation, word-recognition-in-text, nonword reading, spelling, and mathematics; none of the findings were statistically significant. Experimental task data were provided for word-recognition-in-isolation (2/6 FTG), word recognition speed (4/4 FTG), and spelling (3/4 FTG).
O’Shaughnessy and Swanson (2000) reported achievement efficacy data related to a combined synthetic phonics and phonological awareness intervention (i.e., phonological awareness training [PAT]). Word-recognition-in-isolation, nonword reading, text comprehension, spelling, and mathematics outcomes were provided from standardized tests. The only experimental task outcome was word-recognition-in-isolation. Few statistically significant findings were reported. Two were from
standardized test data: (a) nonword reading outcomes in favor of the treatment group and (b) mathematics outcomes in favor of the control group. Both experimental task findings pertaining to word-recognition-in-isolation were statistically significant in favor of the treatment group. Effect sizes were medium (nonword reading, text comprehension, and spelling; ds = 0.36–0.45) and large (mathematics; d = –0.77) in magnitude for standardized test findings and were large (word-recognition-in-isolation; ds = 1.07–1.61) for experimental task findings.
Overall summary of efficacy findings across reading intervention categories. Efficacy findings were most abundant for the synthetic phonics and then analytic phonics interventions. In many instances when standardized test and experimental task data were available for a specific reading intervention category, statistically significant treatment efficacy findings were more abundant from experimental tasks than from standardized tests. Summary of efficacy findings across outcomes categories. A summary of efficacy findings within the following outcome categories is provided below: word-recognition-in-isolation outcomes, word-recognition-in-text outcomes, nonword reading outcomes, word recognition speed/text reading fluency outcomes, text comprehension outcomes, spelling outcomes, and mathematics outcomes.
Word-recognition-in-isolation outcomes. Word-recognition-in-isolation was evaluated in multiple studies across all reading intervention categories that administered standardized tests and/or experimental tasks. Efficacy was noted for synthetic phonics method, whole-word method, and a combined synthetic phonics and analytic phonics interventions method using
ASHA’s National Center for Evidence-Based Practice in Communication Disorders • July 2013 14
standardized tests, whereas experimental task findings revealed efficacy for all reading intervention categories. For the most part, large effect sizes (majority above d = 0.65) were reported for experimental task findings.
Word-recognition-in-text outcomes. For word-recognition-in-text, only efficacy of synthetic phonics was noted via standardized test findings; this outcome was evaluated across all interventions except for analytic phonics method and a combined synthetic phonics and phonological awareness method. Only one study (Lovett et al., 1989) reported experimental measures of word-recognition-in-text. Efficacy was noted for the whole-word method (i.e., OWLS) but not for the combined synthetic phonics and analytic phonics intervention method (i.e., DS).
Nonword reading outcomes. Standardized test nonword reading data were used to evaluate efficacy of all reading interventions; only synthetic phonics method, analytic phonics method, and a combined synthetic phonics and phonological awareness method resulted in statistically significant differences in favor of the treatment group. Large (d = 0.89, synthetic phonics) and medium (d = 0.47, analytic phonics; d =.45, combined synthetic phonics and phonological awareness) effect sizes were reported; in addition, a small effect size was reported for the nonstatistically significant result that was associated with a combined synthetic phonics and analytic phonics method (d = 0.13). Neither of the two reading interventions (i.e., whole-word method and a combined synthetic phonics and analytic phonics method) for which experimental task data were reported was statistically significant.
Word recognition speed/text reading fluency outcomes. Treatment efficacy was noted for synthetic phonics standardized test findings; all other intervention categories that reported standardized test word recognition speed findings (i.e., whole-word method and a combined synthetic phonics and analytic phonics method) were not statistically significant. Large effect sizes (ds = 0.76–2.91) were reported for synthetic phonics. For experimental task data, efficacy was noted for synthetic phonics method, whole-word method, and a combined synthetic phonics and whole-word method; findings associated with a combined synthetic phonics and analytic phonics method were not statistically significant; however, a medium effect size (d = 0.40) was noted. A medium effect size (d = 0.44) was also reported for the whole-word-method finding. For text reading fluency, only efficacy findings from a synthetic phonics intervention were provided; the findings were statistically significant in favor of the synthetic phonics group, and accompanying effect sizes were large (ds = 0.93–2.74).
Text comprehension outcomes. Efficacy of all reading intervention categories was evaluated via standardized test text comprehension findings with the exception of a combined synthetic phonics and whole-word method. Statistical significance in favor of the treatment group was noted for synthetic phonics (small to medium effect sizes, ds = 0.13–0.55) and analytic phonics (large effect size, d = 0.65). Statistical significance was not reached by two combined interventions (i.e., synthetic phonics combined with analytic phonics , and synthetic phonics combined with phonological awareness ); however, small (d = 0.33) and medium (d = 0.36) effect sizes, respectively, were reported. Efficacy findings from experimental tasks were provided for two intervention categories:
ASHA’s National Center for Evidence-Based Practice in Communication Disorders • July 2013 15
whole-word method and a combined synthetic phonics and analytic phonics method. Efficacy was noted only for the whole-word method.
Spelling outcomes. Efficacy findings were provided for all reading intervention categories for spelling through the use of standardized test data; efficacy was noted for synthetic phonics (large effect size, d = 1.13) and analytic phonics (large effect size, d = 0.65). Mixed findings were revealed for combined synthetic phonics and analytic phonics interventions: In one study (Lovett et al., 1994), efficacy was demonstrated, whereas, in the other study (Oakland et al., 1998), the nonstatistically significant finding was accompanied by a null effect (d = 0). Although no statistically significant difference was noted for a combined synthetic phonics and phonological awareness intervention method, a medium effect size (d = 0.42) was reported. All experimental task findings were in favor of the treatment group for each of the following intervention categories: synthetic phonics, whole-word method, a combined synthetic phonics and analytic phonics method, and a combined synthetic phonics and whole-word method.
Mathematics outcomes. Mathematics efficacy findings were reported through the use of standardized test data for all reading intervention categories except a combined synthetic phonics and analytic phonics method. Not only was efficacy not found for any of the reading interventions, but the performance of the participants in the group that used the analytic phonics method and the participants in the group that used the combined synthetic phonics and phonological awareness intervention method was surpassed by their respective control groups (both had large effect sizes: d ≥ –0.77). Also, small and medium effect sizes (ds = –0.33 to –0.37) were reported for synthetic phonics findings, which were not
significantly better than those of the control group. No experimental task mathematics efficacy findings were provided.
Overall summary of efficacy findings across outcome categories. Treatment efficacy was noted for all reading interventions used to address word-recognition-in-isolation outcomes. Spelling outcomes also improved following a variety of reading interventions (i.e., synthetic phonics, analytic phonics, whole-word method, combined analytic phonics and synthetic phonics intervention, and combined synthetic phonics and whole-word method) as measured by standardized tests and/or experimental tasks. Summary of comparative efficacy findings. Comparative efficacy findings for the following interventions are addressed in the paragraphs below: synthetic versus analytic phonics interventions and phonics versus whole-word method interventions. An overall summary of comparative efficacy findings is also provided.
Synthetic phonics versus analytic phonics interventions. In addition to providing efficacy data, two of the included studies evaluated comparative efficacy between different types of phonics interventions as follows: Lovett et al. (1994) compared an analytic phonics intervention (WIST) to a synthetic phonics intervention (PHAB/DI). O’Shaughnessy and Swanson (2000) reported comparative efficacy findings from an analytic phonics intervention (WAT) and a combined synthetic phonics and phonological awareness intervention (PAT). Few statistically significant findings were reported from standardized tests. Participants who received a synthetic phonics intervention (PHAB/DI) surpassed participants who received an analytic phonics intervention (WIST) on a word-recognition-in-isolation outcome and on
ASHA’s National Center for Evidence-Based Practice in Communication Disorders • July 2013 16
both nonword reading findings. For experimental tasks, participants in the WAT group surpassed those in the PAT group on a word-recognition-in-isolation outcome. The only effect size reported is from an experimental task that measured word-recognition-in-isolation (WAT>PAT; d = 1.09).
Phonics versus whole-word method interventions. Comparative efficacy was reported between phonics and whole-word method interventions in the Lovett et al. (1988, 1989, 1990) studies. Lovett et al. (1988, 1989) analyzed differences between a combined synthetic phonics and analytic phonics intervention (DS) and a whole-word-method (OWLS) intervention. Lovett et al. (1990) compared a whole-word method (REG=EXC) intervention to a combined synthetic phonics and whole-word method (REG≠EXC) intervention. A statistically significant finding from a standardized test in favor of a whole-word method intervention (REG=EXC) versus a combined synthetic phonics and whole-word intervention (REG≠EXC) on a word-recognition-in-isolation task was revealed in Lovett et al. (1990). For experimental tasks, mixed findings were reported for comparisons between the combined synthetic phonics and analytic phonics intervention (DS) and the whole-word method intervention (OWLS). Statistical significance was in favor of the DS group for word-recognition-in-isolation, word recognition speed, and spelling, whereas the OWLS group reached statistical significance for word-recognition-in-text, word recognition speed, and text comprehension. REG=EXC participants outperformed the REG≠EXC group on spelling outcomes. Effect sizes, which were available only from experimental tasks, were medium (word recognition speed: d = 0.40) and large (word-recognition-in-isolation: ds = 1.05, 1.63) in magnitude.
Overall summary of comparative efficacy findings. Across all comparative efficacy findings, no pattern surfaced regarding a type of intervention that consistently resulted in superior performance; however, statistical significance was achieved by multiple intervention groups across reading intervention categories for the word-recognition-in-isolation outcome.
Strength of Evidence Table 5 contains the grades for the strength of evidence for each reading intervention category across outcomes. As indicated in Table 5, the highest strength of evidence rating awarded for any comparison was “moderate” with the synthetic phonics containing the majority of those evidence ratings, followed by the analytic phonics categories. “Moderate” grades were also applied to the following reading intervention/outcome category comparisons (the outcomes are in parentheses): whole-word method (word-recognition-in-text), a combined synthetic phonics and analytic phonics method (word-recognition-in-isolation, text comprehension), and a combined phonological awareness and synthetic phonics method (nonword reading, text comprehension, spelling).
DISCUSSION Because no studies of writing intervention met this EBSR’s eligibility criteria, the discussion focuses on findings relevant to the first clinical question only. Overall, a variety of reading interventions (e.g., phonics-based method, whole-word method, a combined phonics-based and whole-word method)—in particular, phonics-based interventions—were found to improve reading-related achievement outcomes. These findings are consistent with previous research that reported achievement findings from populations of children with language-based disorders (see, e.g., NICHD,
ASHA’s National Center for Evidence-Based Practice in Communication Disorders • July 2013 17
2000) as well as for other populations of children with disabilities, such as children with autism spectrum disorder (Whalon, Al Otaiba, & Delano, 2009), who received written language interventions. In some cases, positive gains were noted, indicating that not only did the findings of the intervention group surpass those of the control group but the intervention also resulted in a higher growth rate during the treatment period (Blachman et al., 2004). Several reading interventions showed large, statistically significant effects when compared with control group findings. No single reading intervention category was superior to another reading intervention category on all outcomes. General Findings A number of general findings surfaced that have potential implications for interpreting findings from multiple reading intervention categories. One such point regards the consistency of findings from experimental task(s) and standardized test(s) used to measure a particular outcome. Across studies that used both types of outcome measures, either there was no difference in the number of significant findings for a particular outcome (Blachman et al., 2004; Lovett et al., 1988, 1994) or there were substantially more significant findings in the experimental task category (Lovett et al., 1989, 1990 [spelling outcomes only]; O’Shaughnessy & Swanson, 2000). It is not uncommon for experimental tasks to yield higher effect sizes (Swanson, Hoskyn, & Lee, 1999, as cited in Wanzek et al., 2010). Readers are encouraged to evaluate the findings from both types of outcome measures in conjunction with one another (Swanson et al., 1999) because they both serve different purposes. In the case of experimental tasks, researchers can garner information about participants’ ability to recall information covered during treatment
as well as their ability to generalize those skills to novel tasks and situations. Standardized tests, however, provide information about participants’ knowledge and abilities relative to the normative sample used in developing the test norms. As such, participants for whom both forms of outcome measures are used may show considerably more improvement on the measure most aligned with the treatment that they underwent (i.e., experimental task) and seemingly less improvement on the more global assessment of that skill (i.e., standardized test).
Another general finding that arose is that of the variation in instruction received by the control group. In some cases, control group participants did not receive interventions with a written language component (Lovett et al., 1988, 1989, 1990, 1994; O’Shaughnessy & Swanson, 2000), whereas, in others, they received regular classroom instruction along with modified basal reading programs (Oakland et al., 1998) or a variety of remedial programs (Blachman et al., 2004; Shaywitz et al., 2004; Soriano et al., 2011). Because detailed data from the control conditions were not specified, analysis of the potential impact of these data (in isolation or in concert) on reading outcomes cannot be determined; therefore, evaluation of efficacy of reading interventions in studies in which the control participants received reading-related instruction should be considered with this caveat in mind.
The final general finding is that several of the treatment interventions were multicomponent programs wherein more than one reading skill was addressed. There was great variability in the quantity and types of components integrated into treatments in the same reading intervention category as well as the degree of association between components in the treatment. For example, in the synthetic phonics category,
ASHA’s National Center for Evidence-Based Practice in Communication Disorders • July 2013 18
one of the treatments (Blachman et al., 2004; Shaywitz et al., 2004) addressed sound–symbol associations, text reading fluency, oral reading, spelling, and journal writing, whereas another (Lovett et al., 1994) focused heavily on synthetic phonics instruction. An implication of these variations is the uncertainty about the contribution of the effects of other reading domains (e.g., text reading fluency) addressed versus the intervention of interest (e.g., synthetic phonics) on the treatment outcomes. It is not surprising to note that other studies of participants with reading difficulty in which the authors evaluated the impact of multicomponent reading programs (i.e., code-focused and meaning-focused [Whalon et al., 2009]) found that participants who received the multicomponent program outperformed those who received either a code-focused (e.g., phonics) or meaning-focused (e.g., comprehension, vocabulary) program. Synthetic Phonics Because there was substantial variation in treatment components across the synthetic phonics treatments included in this review (see Table 3 and treatment descriptions provided in Table 5), we would expect results to differ across outcome types and across studies. However, as was noted in previous research (see, e.g., NICHD, 2000), despite this variation, efficacy of synthetic phonics was noted for all reading-related achievement outcomes (Blachman et al., 2004; Lovett et al., 1994; Shaywitz et al., 2004; Soriano et al., 2011) with the exception of text comprehension outcomes, which were not statistically different between groups for three of the studies (Lovett et al., 1994; Shaywitz et al., 2004; Soriano et al., 2011). One possible explanation for this finding is that only one of the treatments was designed to directly address text comprehension (Blachman et
al., 2004; Shaywitz, 2004). As indicated previously, Lovett et al. (1994) appeared to focus primarily on phonics-based skills, and Soriano et al. (2011) indicated that although text comprehension was an outcome of interest, they were interested in incidental improvement in text comprehension following instruction in other written language domains (e.g., text reading fluency). These findings suggest that direct instruction in text comprehension is a requisite for improvements in that reading skill. However, that notion is questionable when considering that efficacy was noted for text comprehension in Blachman et al. (2004) but not Shaywitz et al. (2004)—two studies that shared treatment group participants and treatment outcomes data. Perhaps the cause of this discrepancy is linked to variations in the type of instruction provided to the control group; because detailed information about instruction in the control conditions was not provided, further analysis of the relationship between control condition components and efficacy findings is not possible. Another point of interest regards follow-up test findings (Blachman et al., 2004) that were no longer significantly different in favor of the treatment group for word-recognition-in-text and text comprehension outcomes at 1-year follow up. A longer treatment period may have resulted in enduring improvements in those reading skills. Overall, it is evident that synthetic phonics—in particular, the programs that provided direct instruction in other reading areas, such as spelling—positively affected reading-related achievement outcomes in our target population. Although the findings suggest that synthetic phonics interventions have a positive impact on a wide swath of achievement outcomes, the integration of other academic skills into treatment should not be ignored when interpreting the findings.
ASHA’s National Center for Evidence-Based Practice in Communication Disorders • July 2013 19
Analytic Phonics An analysis of the quantity of statistically significant findings in Lovett et al. (1994) and O’Shaughnessy and Swanson (2000) revealed that across standardized and experimental tasks, and across studies, the bulk of word-recognition-in-isolation findings and spelling findings were statistically significant. All statistically significant word-recognition-in-isolation findings were associated with experimental tasks. In contrast, only some of the findings reported for nonword reading (1/3 FTG) and text comprehension (1/2 FTG) were statistically significant. In addition, as expected, the mathematics findings did not favor the treatment group.
Word-recognition-in-isolation and spelling, the two outcomes that were most often statistically significant in this reading intervention category, are seemingly different; however, their underlying processes—decoding/recoding (used in word-recognition-in-isolation) and encoding (used in spelling)—are inverse. Decoding/recoding is the act of mapping phonemes onto segmented graphemes of written words and then recombining them to “read” the word, whereas encoding is the retrieval of graphemes that are associated with specific phonemes from lexical storage—graphemes that readers will use to generate a target word (Crawford & Elliott, 2007). In both Lovett et al. (1994) and O’Shaughnessy and Swanson (2000), attention to onset–rime and use of a set of key words to facilitate reading and spelling were emphasized in the analytic phonics interventions; as such, decoding/recoding and encoding were addressed.
The consistency in treatment efficacy for nonword reading and text comprehension (both of which had mixed findings) suggests the need for interventions that drill down to the phoneme level, such as phonological awareness and synthetic phonics, and direct
instruction in the target reading skill. Other factors that affect text comprehension ability are word recognition speed (i.e., automaticity), text reading fluency, and reading vocabulary (Siegel, 2006; Troia, 2004), all of which are outcomes that were not reported in either Lovett et al. (1994) or O’Shaughnessy and Swanson (2000).
Thus, although analytic phonics instruction had a positive impact on reading ability, sole implementation of this type of reading intervention appears insufficient in completely addressing more complex reading-related academic skills. Whole-Word Method The efficacy of a whole-word method was examined for all seven achievement outcomes across three studies in this EBSR (Lovett et al., 1988, 1989, 1990). All significant differences were in favor of the intervention group. From standardized test data, treatment efficacy was found only for word-recognition-in-isolation. Yet, statistically significant findings from experimental tasks were noted for word-recognition-in-isolation, word recognition speed, text comprehension, and spelling. These findings are contrary to what would be expected for a pure whole-word method program, given that attention to letter–sound correspondences is not emphasized. Further analysis of the programs provided by Lovett et al. (1988, 1989, 1990) revealed multicomponent programs that, in the earlier studies, addressed oral language comprehension, vocabulary instruction, reading, reading comprehension, and written composition. In the later study, instruction of word recognition and spelling of regular and exception words was targeted through the use of a teaching approach that was more aligned with the whole-word method. Treatment efficacy was found for word-recognition-in-isolation, word-recognition-in-text (one study), word recognition speed,
ASHA’s National Center for Evidence-Based Practice in Communication Disorders • July 2013 20
and text comprehension for all studies with the exception of Lovett et al. (1990), which did not provide results for text comprehension. Efficacy for spelling was evaluated in Lovett et al. (1989, 1990); only the whole word method evaluated in Lovett et al. (1990) was found to improve spelling. This finding is not surprising, considering that only the Lovett et al. (1990) study included spelling as a treatment component. Lastly, treatment efficacy for nonword reading was not found for the two studies (Lovett et al., 1989, 1990) that reported on this outcome; this finding is expected, given that neither of the descriptions of the whole-word method interventions indicated inclusion of treatment components that focused on the understanding and manipulation of phonemes. Although efficacy of the whole-word method was realized for several outcomes, the variability in skills addressed across the different interventions should be considered when evaluating the findings. In addition, these findings suggest that explicit emphasis on target skills (i.e., spelling, letter–sound correspondence) is essential for skill acquisition. Integrated Reading Interventions Five studies reported on integrated phonics interventions: Lovett et al. (1988, 1989) and Oakland et al. (1998) reported on synthetic phonics and analytic phonics; Lovett et al. (1990) reported on synthetic phonics and whole-word method; and O’Shaughnessy and Swanson (2000) reported on synthetic phonics and phonological awareness. Across combined interventions, efficacy was noted for word-recognition-in-isolation from either standardized test or experimental task data. Given that each of these interventions includes synthetic phonics and that efficacy was found in the word-recognition-in-isolation outcome category for each
synthetic phonics intervention, this finding is not surprising. All other findings, however, are difficult to interpret because some are linked to interventions that focused primarily on the components for which they were named (e.g., a combined synthetic phonics and phonological awareness method), whereas others included instruction on additional language skills (e.g., morphological analysis, rapid word recognition). The combined effect of the components included in each of the integrated reading interventions likely resulted in efficacy for particular outcomes. On another note, none of the text comprehension findings and only one of three of the nonword reading and word recognition speed findings were statistically significant. These findings suggest that although efficacy was noted for several outcomes, it is evident that treatment emphasis solely on word identification—either via a phonics-based treatment or a whole-word method—is insufficient for habilitating more complex reading skills. Comparative Efficacy of Synthetic and Analytic Phonics Interventions Two studies, Lovett et al. (1994) and O’Shaughnessy and Swanson (2000), reported comparative efficacy findings between an intervention with a synthetic phonics or phonological awareness component and an intervention with an analytic phonics component. Few significant differences were found between the synthetic phonics or phonological awareness interventions and the analytic phonics intervention. Moreover, no intervention type by outcome pattern was noted across statistically significant findings. Given that efficacy for synthetic phonics was found for all reading-related achievement outcomes and efficacy was demonstrated for only a few outcomes associated with analytic phonics, it may seem that synthetic phonics
ASHA’s National Center for Evidence-Based Practice in Communication Disorders • July 2013 21
should have been found to result in more comparative efficacy outcomes than analytic phonics. However, these findings are consistent with previous meta-analysis findings that compared systematic synthetic phonics instruction to systematic analytic phonics instruction outcomes across ability and age categories; a negligible pooled effect size of 0.02 was reported (Torgerson et al., 2006). The lack of distinction between the group findings suggests that although synthetic phonics appears to get at the root cause of the reading deficit, analytic phonics also addresses aspects of the underlying phonological processing weaknesses. A possible explanation for the superior performance of the analytic phonics group over the combined phonological awareness and synthetic phonics group in O’Shaughnessy and Swanson’s (2000) study is that the majority of instruction in the latter group appears to have been spent on phonological awareness, another linguistic construct that is important but not sufficient in the complete remediation of reading difficulty in areas such as word decoding (NICHD, 2000). Comparative Efficacy of Phonics Interventions and Whole-Word Methods For years, controversy has existed over the use of whole language or whole-word methods in lieu of phonics-based treatments. Reasons for concern about whole language or whole-word methods include limited or nonexistent instruction in speech sounds, emphasis on whole-word identification versus letter–sound correspondence, text reading fluency instruction using leveled books instead of decodable books, and little or no pre-teaching of reading vocabulary (Moats, 2007). Considering that children with language-based learning difficulty who present with reading impairments likely have core deficits at the phonemic level, a whole-word method will be either superior
to phonics-based instruction—as it will largely, but not completely, bypass phonological processing deficits (Foorman et al., 2003)—or will be subpar relative to phonics-based treatments, which are designed to enhance phonological processing and phonics skills. Again, findings in this EBSR revealed interventions with a synthetic phonics component to be superior for word-recognition-in-isolation outcomes. The whole-word method group, however, surpassed the phonics intervention group on word-recognition-in-isolation and spelling in one study as well as word-recognition-in-text and text comprehension. Mixed findings were noted for word recognition speed. Although the positive impact of a combined synthetic phonics and analytic phonics intervention on decoding/recoding and encoding skills was not surprising, the superiority of the whole-word method on word-recognition-in-text and text comprehension was contrary to expectations, given the nature of whole-word methods as described above. However, as indicated earlier, spelling via letter-name instruction was a component that, together with the emphasis on other reading skills (e.g., reading regular and exception words in the exception-word way), may have provided more of the necessary elements that participants with reading difficulties need in order to improve word-recognition-in-isolation and spelling. In regard to the whole-word method that was superior in word-recognition-in-text and text comprehension, that intervention included attention to oral and written language skills; the comparison treatment, a combined synthetic phonics and analytic phonics method, was not stated to have addressed as many additional components. Therefore, once again, the synergistic effects of multicomponent programs appear to greatly influence performance on outcomes.
ASHA’s National Center for Evidence-Based Practice in Communication Disorders • July 2013 22
Clinical Implications It is clear that additional research is needed to address the impact of reading interventions on achievement outcomes of the target population of this EBSR. However, there are certain general clinical practices that should be implemented. Educators should provide instruction that addresses a variety of language skills (e.g., word recognition, text reading fluency, language comprehension), including both basic (e.g., letter–sound correspondence) and complex (e.g., reading strategies) literacy skills. In addition, they should use a combination of reading interventions when deemed appropriate.
There are also implications for service delivery. Campbell and Skarakis-Doyle (2007) suggested that the ICF can be applied “as an organizational structure for exploring how commonalities across developmental disabilities [such as SLI] can be used in conjunction with what is known to be distinctive about particular disabilities to create a shared terminology and framework among professionals working in a school setting” (p. 514). The authors expounded upon a service delivery continuum informed by the ICF within which deficits can be treated universally in an inclusive classroom setting, commonly among children with related developmental disabilities, and selectively with the individual child to ensure that his or her services meet specific needs in a comprehensive and cohesive manner. This service delivery model considers the perspective of both the researcher and the clinician in the commonly and selectively context, respectively; therefore, this model holds promise as a mechanism for establishing a unified understanding of the target population and selection of efficacious treatments. Furthermore, co-morbidity among developmental language, motor, and attention problems emphasizes the need for
collaborative service delivery in which these children’s multiple needs are addressed (Campbell & Skarakis-Doyle, 2007). All of these considerations align well with the education concept known as “universal design for learning,” which is promoted as an ecologically valid and intensive approach to intervention that requires the use of a variety of instructional materials and techniques to accommodate the individual learning needs of students through multiple means of representation, engagement, and expression (see www.udlcenter.org). Future Recommendations Efficacy and comparative efficacy of different reading interventions in isolation (e.g., synthetic phonics) and in combination (e.g., synthetic phonics and analytic phonics method) was assessed across several studies. More robust evaluations of these early stages of research could be completed if the active ingredients of interventions were analyzed by systematically evaluating the effects of different components (e.g., component analysis). Findings and associated methodology could then inform the foundation of studies designed to evaluate real-world applications of such reading interventions (i.e., effectiveness) as well as those developed to weigh the costs associated with treatment implementation against outcomes (i.e., cost-effectiveness). Along these lines, studies of longer duration and those that include one or more follow-up periods would also add to the understanding of efficacy and effectiveness of such treatments. Additionally, although multicomponent programs have been found to result in better reading outcomes than their single-component counterparts (Whalon et al., 2009), less is known about whether ideal combinations of reading skills exist for particular reading deficits or participants with specific disabilities. Therefore, the research of multicomponent
ASHA’s National Center for Evidence-Based Practice in Communication Disorders • July 2013 23
studies in which the experimenters control for such factors as severity of reading difficulties and types of reading deficits will provide more clarity on the effects of single- and multicomponent reading interventions.
Definitional variations, such as how students with a reading disability were classified or what constituted text reading fluency, were abundant in the accepted studies. In other words, inconsistencies in definitions of the same terms were noted across studies. Although, overall, similarities in findings were observed within reading intervention categories, enough differences in outcomes were noted to suggest that researchers should explicitly operationalize definitions of the included populations, interventions, and outcomes. One of the many purported uses of the ICF is to develop a shared language for professionals from different fields who work with the same clinical populations (Campbell & Skarakis-Doyle, 2007). Use of a shared language accompanied by clear, operationalized definitions could facilitate more exact insights in secondary analysis of findings in systematic reviews or meta-analyses.
When grading the strength of evidence, three factors should be considered: quantity of studies, quality of studies (e.g., internal and external validity factors), and consistency of findings (Coleman, Talati, & White, 2009; West et al., 2002). As indicated by the findings in Table 5, strength of evidence grades were “unassignable” for several comparisons because of the limited number of studies. In addition, even when the study design implemented was of the highest caliber for determining efficacy and comparative efficacy (i.e., RCT), the quality of the study could not be comprehensively assessed because key indicators were not reported, such as the psychometric
properties of outcome measures (e.g., internal consistency) and the number of participants in each condition. Further, several studies did not provide statistical (i.e., p values) and clinical (i.e., effect sizes and confidence intervals) significance data or data that would have made those statistics calculable. Authors of future studies in this area are encouraged to provide those data to ensure accurate assessment of study quality and reporting of the strength of evidence. Additionally, statistical and clinical significance data are necessary to generate meta-analyses designed to address the questions posed in this EBSR.
The notable connection between reading and writing is evident from a developmental and disorder perspective. Reading and writing have shared variance and are reciprocally related along the developmental trajectory (Catts et al., 2002; Shanahan, 2006). A high co-morbidity exists between dyslexia and dysgraphia (Berninger & O’Malley May, 2011; Handler et al., 2011). These findings suggest that writing instruction should be a core component of reading habilitation (and vice versa) and that the relationship between reading and writing plays a pivotal role in school success. The second clinical question in this EBSR remains unanswered, though, because we found no studies of the efficacy of writing intervention for school-age children that met this EBSR’s classification criteria. Further research—much of which should be analogous to that completed on children with LD—is needed to determine if there are any alternative or additional considerations for the more narrowly defined population of children with spoken and/or written language difficulties in the absence of intellectual disability, psychiatric or emotional condition, frank neurological disorder, and sensory impairment.
ASHA’s National Center for Evidence-Based Practice in Communication Disorders • July 2013 24
Limitations of This EBSR Only peer-reviewed research was accepted in this EBSR so as to ensure that study quality was vetted by experts in the field. However, because there is a tendency for a larger number of studies with significant findings to be published than studies with nonstatistically significant results, the risk of publication bias is high.
Accepted studies were written in English, which limited the scope of the search. As was the case with publication bias, studies on this topic written in other languages may contain results that are largely contrary to the findings in this EBSR and/or could provide another dimension to the understanding of this topic.
Several factors may impact the extent of the generalizability of this EBSR’s findings. For example, although the exclusionary criteria are consistent across accepted studies, the inclusion criteria vary (e.g., “lowest 20% of readers” [Blachman et al., 2004]; “child’s oral reading performance on a screening battery” [Lovett et al., 1988]). Other factors that were variable included participant age, pre-intervention spoken and written linguistic ability, the diagnostic and pre-test battery, and the screening or assessment battery used to determine whether participants were eligible for study inclusion. These factors may have acted as moderating variables that influenced the impact of the target interventions. Further, although several of the studies took place in a real-world setting and were implemented by school staff, multiple aspects of each accepted study were controlled, and the population studied was narrow, which diminishes the external validity of the findings. However, the results of this EBSR are consistent with the results of other EBSRs that faced similar methodological challenges when synthesizing findings
associated with written language interventions for children with disorders such as LD, reading impairment, and autism (NICHD, 2000; Whalon et al., 2009). CONCLUSION More reading intervention research needs to be completed that evaluates the impact of the type and quantity of reading skills addressed as well as the severity of the reading disability on achievement outcomes. Authors of those studies should provide operational definitions of the population, treatments, and outcomes. Also, writing intervention research should be conducted specific to participants with spoken and/or written language learning difficulties in the absence of intellectual disability, psychiatric or emotional condition, frank neurological disorder, and sensory impairment. Although these future research needs must be addressed to make strong assertions about efficacy and comparative efficacy, the current findings, which are generally consistent with previous research, demonstrate the positive impact of a variety of reading intervention categories, especially synthetic phonics interventions as part of multicomponent programs, for participants with language-based learning difficulties such as DLD. ACKNOWLEDGMENTS This EBSR was supported by ASHA’s National Center for Evidence-Based Practice in Communication Disorders (N-CEP). We thank the following individuals for comments on earlier versions of this paper: Linda Lombardino, Tobi Frymark, Tracy Schooling, and Rob Mullen. No author had a paid consultancy or any other conflict of interest with this document. All authors agreed to declare no competing interests.
ASHA’s National Center for Evidence-Based Practice in Communication Disorders • July 2013 25
REFERENCES References marked with an asterisk (*) were included in the systematic review.
Adams, M. J. (1990). Beginning to read: Thinking and learning about print. Cambridge, MA: The MIT Press.
Arvedson, P. J. (2002). Young children with specific language impairment and their numerical cognition. Journal of Speech, Language, and Hearing Research, 45, 970–982.
Baker, S. K., Chard, D. J., Ketterlin-Geller, L. R., Apichatabutra, C., & Doabler, C. (2003). Teaching writing to at-risk students: The quality of evidence of self-regulated strategy development. Exceptional Children, 75, 303–318.
Baker, S., Gersten, R., & Graham, S. (2003). Teaching expressive writing to students with learning disabilities: Research-based applications and examples. Journal of Learning Disabilities, 36, 109–123.
Berninger, V. W., & O’Malley May, M. (2011). Evidence-based diagnosis and treatment for specific learning disabilities involving impairments in written and/or oral language. Journal of Learning Disabilities, 44, 167–183.
Bishop, D. V. M. (2004). Specific language impairment: Diagnostic dilemmas. In L. Verhoeven & H. van Balkom (Eds.), Classification of developmental language disorders: Theoretical issues and clinical implications (pp. 309–326). Mahwah, NJ: Erlbaum.
*Blachman, B. A., Schatschneider, C., Fletcher, J. M., Francis, D. J., Clonan, S. M., Shaywitz, B. A., & Shaywitz, S. E. (2004). Effects of intensive reading remediation for second and third graders and a 1-year follow-up. Journal of Educational Psychology, 96, 444–461.
Cain, K., & Oakhill, J. (2006). Profiles of children with specific reading comprehension difficulties. British Journal of Educational Psychology, 76, 683–696.
Campbell, W. N., & Skarakis-Doyle, E. (2007). School-aged children with SLI: The ICF as a framework for collaborative service delivery. Journal of Communication Disorders, 40, 513–535.
Catts, H. W. (1989). Defining dyslexia as a developmental language disorder. Annals of Dyslexia, 39, 50–64.
Catts, H. W. (1996). Defining dyslexia as a developmental language disorder: An expanded view. Topics in Language Disorders, 16(2), 14–29.
Catts, H. W., Adlof, S. M., Hogan, T. P., & Weismer, S. E. (2005). Are specific language impairment and dyslexia distinct disorders? Journal of Speech, Language, and Hearing Research, 48, 1378–1396.
Catts, H. W., Fey, M. E., Tomblin, J. B., & Zhang, X. (2002). A longitudinal investigation of reading outcomes in children with language impairments. Journal of Speech, Language, and Hearing Research, 45, 1145–1157.
Chall, J. S. (1983). Stages of reading development. New York, NY: McGraw-Hill.
Cherney, L. R., Patterson, J. P., Raymer, A., Frymark, T., & Schooling, T. (2008). Evidence-based systematic review: Effects of intensity of treatment and constraint-induced language therapy for individuals with stroke-induced aphasia. Journal of Speech, Language, and Hearing Research, 51, 1282–1299.
ASHA’s National Center for Evidence-Based Practice in Communication Disorders • July 2013 26
Cincinnati Children’s Hospital. (2011, August). LEGEND: Evidence appraisal of a single study intervention-randomized controlled trial (RCT) and controlled clinical trial (CCT). Retrieved from www.cincinnatichildrens.org/service/j/ anderson-center/evidence-based-care/legend
Cohen, J. (1988). Statistical power analysis for the behavioral sciences (2nd ed.). Hillsdale, NJ: Erlbaum.
Coleman, C. I., Talati, R., & White, M. (2009). A clinician’s perspective on rating the strength of evidence in a systematic review. Pharmacotherapy, 29, 1017–1029.
Conti-Ramsden, G., & Durkin, K. (2008). Language and independence in adolescents with and without a history of specific language impairment (SLI). Journal of Speech, Language, and Hearing Research, 51, 70–83.
Conti-Ramsden, G., & Durkin, K. (2012). Postschool educational and employment experiences of young people with specific language impairment. Language, Speech, and Hearing Services in Schools, 43, 507–520.
Crawford, S., & Elliott, R. T. (2007). Analysis of phonemes, graphemes, onset-rimes, and words with braille-learning children. Journal of Visual Impairment and Blindness, 101, 534–544.
Dempsey, L., & Skarakis-Doyle, E. (2010). Developmental language impairment through the lens of the ICF: An integrated account of children’s functioning. Journal of Communication Disorders, 43, 424–437.
Duff, F. J., & Clarke, P. J. (2010). Practitioner review: Reading disorders: What are the effective interventions and how should they be implemented and evaluated? Journal of Child Psychology and Psychiatry, 52, 3–12.
Ehri, L., & Snowling, M. J. (2004). Development variation in word recognition. In C. A. Stone, E. R. Silliman, B. J. Ehren, & K. Apel (Eds.), Handbook of language and literacy: Development and disorders (pp. 433–460). New York, NY: Guilford.
Fazio, B. B. (1994). The counting abilities of children with specific language impairment: A comparison of oral and gestural tasks. Journal of Speech and Hearing Research, 37, 358–368.
Fazio, B. B. (1996). Mathematical abilities of children with specific language impairment: A 2-year follow-up. Journal of Speech and Hearing Research, 39, 839–849.
Fazio, B. B. (1999). Arithmetic calculation, short-term memory, and language performance in children with specific language impairment: A 5-year follow-up. Journal of Speech, Language, and Hearing Research, 42, 420–431.
Fey, M. E., & Finestack, L. H. (2009). Research and development in child language intervention: A five-phase model. In R. G. Schwartz (Ed.), Handbook of child language disorders (pp. 513–531). New York, NY: Psychology Press.
Foorman, B. R., Breier, J. I., & Fletcher, J. M. (2003). Interventions aimed at improving reading success: An evidence-based approach. Developmental Neuropsychology, 24, 613–639.
ASHA’s National Center for Evidence-Based Practice in Communication Disorders • July 2013 27
Gersten, R., Compton, D., Connor, C. M., Dimino, J., Santoro, L., Linan-Thompson, S., & Tilly, W. D. (2008). Assisting students struggling with reading: Response to intervention and multi-tier intervention for reading in the primary grades: A practice guide (NCEE 2009-4045). Washington, DC: National Center for Education Evaluation and Regional Assistance. Retrieved from http://ies.ed.gov/ncee/wwc/publications/practiceguides/
Graham, S. (2006). Strategy instruction and the teaching of writing: A meta-analysis. In C. A. MacArthur, S. Graham, & J. Fitzgerald (Eds.), Handbook of writing research (pp. 187–207). New York, NY: Guilford.
Graham, S., & Hebert, M. (2010). Writing to read: Evidence for how writing can improve reading. A Carnegie Corporation Time to Act Report. Washington, DC: Alliance for Excellent Education.
Graham, S., & Perin, D. (2007). Writing next: Effective strategies to improve writing of adolescents in middle and high schools. A report to Carnegie Corporation of New York. Washington, DC: Alliance for Excellent Education.
Hall, N. E. (1997). Developmental language disorders. Seminars in Pediatric Neurology, 4(2), 77–85.
Handler, S. M., Fierson, W. M., Section on Ophthalmology and Council on Children with Disabilities, American Academy of Ophthalmology, American Association for Pediatric Ophthalmology and Strabismus, & American Association of Certified Orthoptists. (2011). Joint technical report: Learning disabilities, dyslexia, and vision. Pediatrics, 127, 818–856.
Johnson, C. J., Beitchman, J. H., & Brownlie, E. B. (2010). Twenty-year follow-up of children with and without speech-language impairments: Family, educational, occupation, and quality of life outcomes. American Journal of Speech-Language Pathology, 19, 51–65.
Kamhi, A. G. (1998). Trying to make sense of developmental language disorders. Language, Speech, and Hearing Services in Schools, 29, 35–44.
Kamhi, A. G., & Catts, H. W. (2005). Language and reading: Convergences and divergences. In H. W. Catts & A. G. Kamhi (Eds.), Language and reading disabilities (2nd ed.). Boston, MA: Allyn & Bacon.
Koponen, T., Mononen, R., Rasanen, P., & Ahonen, T. (2006). Basic numeracy in children with specific language impairment: Heteorgeneity and connections to language. Journal of Speech, Language, and Hearing Research, 49, 58–73.
Lahey, M. (1990). Who shall be called language disordered? Some reflections and one perspective. Journal of Speech and Hearing Disorders, 55, 612–620.
Landis, J. R., & Koch, G. G. (1977). The measurement of observer agreement for categorical data. Biometrics, 33, 159–174.
Leonard, L., (2002). Children with specific language impairment. Cambridge, MA: The MIT Press.
*Lovett, M., Ransby, M. J., & Barron, R. W. (1988). Treatment, subtype, and word type effects in dyslexic children’s response to remediation. Brain and Language, 34, 328–349.
ASHA’s National Center for Evidence-Based Practice in Communication Disorders • July 2013 28
*Lovett, M. W., Borden, S. L., DeLuca, T., Lacerenza, L., Benson, N. J., & Bracktstone, D. (1994). Treating core deficits of developmental dyslexia: Evidence of transfer of learning after phonologically- and strategy-based reading training programs. Developmental Psychology, 30, 805–822.
*Lovett, M. W., Ransby, M. J., Hardwick, N., Johns, M. S., & Donaldson, S. A. (1989). Can dyslexia be treated? Treatment-specific and generalized treatment effects in dyslexic children’s response to remediation. Brain and Language, 37, 90–121.
*Lovett, M. W., Warren-Chaplin, P. M., Ransby, M. J., & Borden, S. L. (1990). Training the word recognition skills of reading disabled children: Treatment and transfer effects. Journal of Educational Psychology, 82, 769–780.
Lyon, C. R. (1995). Toward a definition of dyslexia. Annals of Dyslexia, 45, 3–27.
Lyon, C. R., Shaywitz, S. E., & Shaywitz, B. A. (2003). A definition of dyslexia. Annals of Dyslexia, 53, 1–14.
Maughan, B. (1995). Annotation: Long-term outcomes of developmental reading problems. Journal of Child Psychology and Psychiatry, 36, 357–371.
McArthur, G. M., Hogben, J. H., Edwards, V. T., Heath, S. M., & Mengler, E. D. (2000). On the “specifics” of specific reading disability and specific language impairment. Journal of Child Psychology and Psychiatry, 4, 869–874.
Moats, L. (2007). Whole-language high jinks: How to tell when “scientifically-based reading instruction” isn’t. Washington, DC: Thomas B. Fordham Institute.
Morris, R. D. (1988). Classification of learning disabilities: Old problems and new approaches. Journal of Consulting and Clinical Psychology, 56, 789–794.
Mullen, R. (2007). The state of the evidence: ASHA develops levels of evidence for communication sciences and disorders. The ASHA Leader, 12(3), 8–9, 24–25.
National Institute of Child Health and Human Development. (2000). Report of the National Reading Panel. Teaching children to read: An evidence-based assessment of the scientific research literature on reading and its implications for reading instruction (NIH Publication No. 00-4769). Washington, DC: U.S. Government Printing Office.
*Oakland, T., Black, J. L., Stanford, G., Nussbaum, N. L., & Balise, R. R. (1998). An evaluation of the dyslexia training program: A multisensory method for promoting reading in students with reading disabilities. Journal of Learning Disabilities, 31, 140–147.
*O’Shaughnessy, T. E., & Swanson, H. L. (2000). A comparison of two reading interventions for children with reading disabilities. Journal of Learning Disabilities, 33, 257–277.
P.L. 108-446. (2004). The Individuals with Disabilities Education Improvement Act.
Ramos, J. L., & Cuetos, F. (2003). Evaluacion de los procesos lectores PROLEC-SE [Evaluation of the reading processes]. Madrid, Spain: TEA.
Rapin, I. (1996). Practitioner review: Developmental language disorders: A clinical update. Journal of Child Psychology and Psychiatry, 37, 643–655.
ASHA’s National Center for Evidence-Based Practice in Communication Disorders • July 2013 29
Robey, R. R. (2004). A five-phase model for clinical-outcome research. Journal of Communication Disorders, 37, 401-411.
Robey, R. R., & Schultz, M. C. (1998). A model for conducting clinical-outcome research: An adaptation of the standard protocol for use in aphasiology. Aphasiology, 12, 787-810.
Scanlon, D. (2013). Specific learning disability and its newest definition: Which is comprehensive? And which is insufficient? Journal of Learning Disabilities, 46, 26–33.
Shanahan, T. (2006). Relations among oral language, reading, and writing development. In C. MacArthur, S. Graham, & J. Fitzgerald (Eds.), Handbook of writing research (pp. 171–183). New York, NY: Guilford Press.
*Shaywitz, B. A., Shaywitz, S. E., Blachman, B. E., Pugh, K. R., Fulbright, R. K., Skudlarski, P., . . . Gore, J. C. (2004). Development of left occipitotemporal systems for skilled reading in children after a phonologically-based intervention. Biological Psychiatry, 55, 926–933.
Siegel, L. S. (2006). Perspectives on dyslexia. Journal of Pediatric Child Health, 11, 581–587.
*Soriano, M., Miranda, A., Soriano, E., Nievas, F., & Felix, V. (2011). Examining the efficacy of an intervention to improve fluency and reading comprehension in Spanish children with reading disabilities. International Journal of Disability, Development, and Education, 58, 47–59.
Stothard, S. E., Snowling, M. J., Bishop, D. V. M., Chipchase, B. B., & Kaplan, C. A. (1998). Language-impaired preschoolers: A follow-up into adolescence. Journal of Speech, Language, and Hearing Research, 41, 407–418.
Swanson, H. L., Hoskyn, M., & Lee, C. (1999). Interventions for students with learning disabilities: A meta-analysis of treatment outcomes. New York, NY: Guilford.
Tannock, R. (2013). Rethinking ADHD and LD in DSM-5: Proposed changes in diagnostic criteria. Journal of Learning Disabilities, 46, 5–25.
Tomblin, B. (2011). Co-morbidity of autism and SLI: Kinds, kin, and complexity. International Journal of Language and Communication Disorders, 46, 127–137.
Torgerson, C. J., Brooks, G., & Hall, J. (2006). A systematic review of the research literature on the use of phonics in teaching reading and spelling (Report No. 711). Sheffield, United Kingdom: Department for Education and Skills.
Troia, G. A. (2004). Phonological processing and its influence on literacy learning. In C. A. Stone, E. R. Silliman, B. J. Ehren, & K. Apel (Eds.), Handbook of language and literacy: Development and disorders. New York, NY: Guilford.
U.S. Department of Education, Institute of Education Sciences, National Center for Education Evaluation and Regional Assistance, What Works Clearinghouse. (2010). Alphabetic phonics. Washington, DC: Author.
ASHA’s National Center for Evidence-Based Practice in Communication Disorders • July 2013 30
van Kleeck, A., Gillam, R. B., & Hoffman, L. M. (2006). Training in phonological awareness generalizes to phonological working memory: A preliminary investigation. The Journal of Speech-Language Pathology and Applied Behavior Analysis, 1, 58–74.
Verhoeven, L., & van Balkom, H. (2004). Developmental language disorders: Classification, assessment, and intervention. In L. Verhoeven & H. van Balkom (Eds.), Classification of developmental language disorders: Theoretical issues and clinical implications (pp. 3–20). Mahwah, NJ: Erlbaum.
Viswanathan, M., Ansari, M. T., Berkman, N. D., Chang, S., Hartling, L., McPheeters, L. M., . . . Treadwell, J. R. (2012, March 8). Assessing the risk of bias of individual studies in systematic reviews of health care interventions. In Methods Guide for Effectiveness and Comparative Effectiveness Reviews
[Agency for Healthcare Research and Quality (AHRQ) Pub. No. 12-EHC047-EF]. Rockville, MD: AHRQ. Retrieved from www.effectivehealthcare.ahrq.gov
Wanzek, J., Wexler, J., Vaughn, S., & Ciullo, S. (2010). Reading intervention for struggling readers in the upper elementary grades: A synthesis of 20 years of research. Reading and Writing: An Interdisciplinary Journal, 23, 889–912.
West, S., King, V., Carey, T. S., Lohr, K. N., McKoy, N., Sutton, S. F., & Lux, L. (April 2002). Systems to rate the strength of scientific evidence [Evidence Report/Technology Assessment No. 47; AHRQ Pub. No. 02-E016]. Rockville, MD: AHRQ.
Whalon, K. J., Al Otaiba, S., & Delano, M. E. (2009). Evidence-based reading instruction for individuals with autism spectrum disorders. Focus on Autism and Other Developmental Disabilities, 24(1), 3–16.
Adequacy of protocol description Ample details about the study procedures are provided, allowing replication of the study protocol.
Blinding of assessors Information about the groups to which participants are assigned is withheld from the assessors.
Description of the sampling process A description of how participants were randomly selected from the population of interest is provided.
Random allocation to condition/sequence A description of the randomization to experimental condition or sequence is reported.
Controlling for order effects For within-subject study designs, randomization or counterbalancing procedures were described adequately.
Reporting of p values Significance levels (p values) relevant to the clinical questions for this evidence-based systematic review are reported or calculable.
Reporting of effect sizes Effect sizes relevant to the clinical questions for this evidence-based systematic review are reported or calculable.
Analysis of intention to treat For randomized controlled trials, the intention-to-treat analysis is described.
Treatment fidelity Authors documented procedures used to ensure that the protocol was delivered as intended.
ASHA’s National Center for Evidence-Based Practice in Communication Disorders • July 2013 33
Table 2. Critical appraisal of study quality.
Citation Study design
Adequate description
of study protocol
Assessors blinded
Sampling Randomization to condition/
sequence
Order effects
Treatment fidelity
p value reported or calculable
Effect size (ES) and/or confidence
interval (CI)
Analyzed by ITT
Blachman et al. (2004)
RCT Yes Yes NA Random–ID NA Yes Yes ES reported No
Lovett et al. (1988)
RCT Yes NS Conv. Random–ID NA Yes Yes ES calculateda
NS
Lovett et al. (1989)
RCT Yes NS Conv. Random–ID NA Yes Yes Neither reported nor calculable
NS
Lovett et al. (1990)
RCT Yes NS Conv. Random–ID NA NS Yes Neither reported nor calculable
NS
Lovett et al. (1994)
RCT Yes NS Conv. Random–ID NA NS Yes Neither reported nor calculablea
NS
Oakland et al. (1998)
CT Yes NS NS NS NA No Yes ES calculatedb
NA
O’Shaughnessy & Swanson (2000)
RCT Yes NS Conv. Random–ID NA Yes Yes ES reported NS
Shaywitz et al. (2004)
CT Yes NS NS NS NA Yes Yes ES and CI calculated
NA
Soriano et al. (2011)
CT Yes NS NS Not random NA No Yes ES and CI calculatedc
NA
Note. ITT = intention to treat; RCT = randomized controlled trial; NA = not applicable; Random–ID = randomization with an inadequate description; Conv. = convenience sampling; NS = not stated; CT = controlled trial.
aLovett et al. (1994) only reported combined effect sizes for both treatments (i.e., Cohen’s f) in comparison to the control condition. bEffect sizes were approximated using F statistics and their associated degrees of freedom. cAlthough Soriano et al. (2011) reported partial eta-squared, d-family effect sizes were calculated to maintain consistency in the effect sizes included in this evidence-based systematic review.
ASHA’s National Center for Evidence-Based Practice in Communication Disorders • July 2013 34
Table 3. Intervention characteristics.
Study Study conditions and reading intervention category
Group equivalency at pretest
Service delivery
Blachman et al. (2004)
Treatment group (TG; synthetic phonics)
Control group (CG)
Equivalence established via t test, chi-square, and Fisher’s exact test
Setting: School Frequency: Treatment year: 5 days/week; follow-up year: 3–5 days/week Intensity: Treatment year: 50 min/session; follow-up year: 45 min/session (30–75 min/session) Duration: Treatment year: approximately 8 months; 105 hr (86–115 hr); follow-up year: TG: 93 hr (31–143 hr); CG: 97 hr (36–144 hr) Number of sessions: Treatment year: M = 126 (range: 103–138); follow-up year: TG: 120 (41–144); CG: 127 (72–144) Format: Treatment year: individual tutoring; follow-up year: Small groups; 4 participants per group on average Administration: NR
Lovett et al. (1988)
TGs: Decoding Skills Program (DS) ( synthetic phonics/analytic phonics)
Oral and Written Language Skills(OWLS) program (whole word method)
CG: Classroom Survival Skills (CSS) program
Equivalent in chronological age and estimates of verbal and nonverbal intelligence; not equivalent in oral language development
Setting: Special laboratory classrooms at a pediatric hospital or in satellite laboratory classrooms in local schools Frequency: NR Intensity: NR Duration: 40-hr experimental treatment duration Number of sessions: 40 sessions/program Format: Children were instructed in pairs. Administration: Special education teachers
Lovett et al. (1989)
TGs: Decoding Skills Program (synthetic phonics/analytic phonics)
Oral and Written Language Skills (whole word method)
CG: Classroom Survival Skills program
Equivalent in age, IQ, and achievement measures
Setting: Special laboratory classrooms at a pediatric hospital Frequency: 4 days/week Intensity: 50–60 min/session Duration: 10 weeks Number of sessions: 40 treatment sessions within each program Format: Children were instructed in pairs. Administration: Special education teachers
Lovett et al. (1990)
TGs: Regular (does not equal) Exception group (REG ≠ EXC; synthetic phonics/whole word method)
Regular (equals) Exception group (REG = EXC; whole word method)
CG: Classroom Survival Skills program
NR Setting: Special laboratory classrooms at a pediatric hospital Frequency: 4 days/week Intensity: 60 min/session Duration: Classroom Survival Skills program participants received the same amount of clinic and professional attention as the experimental groups Number of sessions: 35 Format: Children were instructed in pairs. Administration: Special education teachers
ASHA’s National Center for Evidence-Based Practice in Communication Disorders • July 2013 35
Study Study conditions and reading intervention category
Group equivalency at pretest
Service delivery
Lovett et al. (1994)
TGs: Phonological analysis and blending/direct instruction (PHAB-DI) (synthetic phonics)
Word identification strategy training (WIST) (analytic phonics)
CG: Classroom Survival Skills program
NR Setting: Special laboratory classrooms at a pediatric teaching hospital or in satellite laboratory classrooms in local schools Frequency: 4 days/week Intensity: 60 min/session Duration: NR Number of sessions: 35 Format: Children were instructed in pairs. Administration: Special education teachers
Oakland et al. (1998)
TG: Dyslexia Training Program (DTP; synthetic phonics/analytic phonics)
CG
Groups varied on oral language and socioeconomic status (experimental group was lower at pretest); other diagnostic and demographic qualities were comparable.
Setting: School Frequency: 5 days/week Intensity: 60 min/session Duration: 10 months a year for 2 years Number of sessions: NR Format: Students were taught in groups of 4; staggered entry of participants into the experimental group; 12 students received video-directed DTP, and 10 received teacher-directed DTP Administration: NR
O’Shaughnessy & Swanson (2000)
TGs: Phonological awareness training (PAT) (synthetic phonics/phonological awareness)
Word analogy training (WAT) (analytic phonics)
CG: Math
Equivalent in IQ and age; equivalence on pretest measures NR
Setting: Quiet classrooms Frequency: 3 days/week Intensity: 30 min/day (9 hr total) Duration: 6 weeks total Number of sessions: NR Format: Students were taught in groups of 5 Administration: Paraprofessionals
Setting: Delivered to children in their home schools Frequency: EI: Daily; CI: 1–4 days/week Intensity: EI: 50 min/day; CI: 15–50 min Duration: 8 months; M = 105 hr (range: 86–115 hr) Number of sessions: NR Format: Individual tutoring Administration: 12 certified teachers
ASHA’s National Center for Evidence-Based Practice in Communication Disorders • July 2013 36
Study Study conditions and reading intervention category
Group equivalency at pretest
Service delivery
Soriano et al. (2011)
TG: Intervention program (synthetic phonics)
CG: No intervention
Equivalent in IQ, naming speed, working memory, and phonemic awareness; not equivalent in age, so age was used as a covariate in a multivariate analysis of covariance
Setting: School resource room Frequency: 3 days/week Intensity: 45 min/session Duration: NR Number of sessions: 40 training sessions Format: One-to-one intervention Administration: Special needs teachers
Note. NR = TG = treatment group; CG = control group; not reported.
ASHA’s National Center for Evidence-Based Practice in Communication Disorders • July 2013 37
Table 4. Participant characteristics.
Study Diagnosis/disorder description
Number of participants Average age in years (range)
Note. SES = socioeconomic status; TG = treatment group; CG = control group; HISG = higher initial skill group; LISG = lower initial skill group; M = male; F = female; NR = not reported; AD = accuracy disabled; RD = rate disabled; DTP = Dyslexia Training Program; PAT = phonological awareness training; WAT = word analogy training; EI = experimental intervention; CI = community intervention; IP = intervention program; NI = no intervention; SES = socioeconomic status. aThe 37 treatment group participants in Blachman et al. (2004) and Shaywitz et al. (2004) are the same. bThe 112 participants in Lovett et al. (1988) were included in the Lovett et al. (1989) study.
ASHA’s National Center for Evidence-Based Practice in Communication Disorders • July 2013 38
Table 5. Strength of evidence grades by reading intervention and outcome categories.
Reading intervention category
Outcome categories Word recognition
in isolation Word recognition
in text Nonword reading Word recognition
speed Text
comprehension Spelling Mathematics
Synthetic phonics
Blachman et al. (2004): 2a Lovett et al. (1994): 2b Moderate
Blachman et al. (2004): 2a Shaywitz et al. (2004): 3a Soriano et al. (2011): 3b Moderate
Blachman et al. (2004): 2a Lovett et al. (1994): 2b Moderate
Blachman et al. (2004): 2a Shaywitz et al. (2004): 3a Soriano et al. (2011): 3b Moderate
Blachman et al. (2004): 2a Lovett et al. (1994): 2b Shaywitz et al. (2004): 3b Soriano et al. (2011): 3b Moderate
Blachman et al. (2004): 2a Lovett et al. (1994): 2b Moderate
Supplemental Materials Table 4: Reading Intervention Study Outcomes
Supplemental Materials Table 5: Study Condition Descriptions
Supplemental Materials Table 6: Additional Written Language Outcomes
Supplemental Materials Table 7: Spoken Language Study Outcomes
Supplemental Materials Appendix: Search Strategy
ASHA’s National Center for Evidence-Based Practice in Communication Disorders • July 2013 41
Supplemental Materials Table 1. Definition of terms.
Term Definition
Analytic phonics Involves using key words, often taught in a whole word method, to decode portions of new words containing sounds included in one or more of the key words (e.g., determine the pronunciation of rat and cat using knowledge of the pronunciation of bat).
Developmental dysgraphia In language-based dysgraphia, the individual produces barely legible to illegible spontaneously written text, severely abnormal oral spelling or relatively unimpaired word spelling with compromised nonword spelling, and relatively preserved copying of written text and drawing.
Developmental dyslexia Difficulty decoding or identifying words in isolation or text and/or impaired reading comprehension despite exposure to adequate educational instruction in the absence of intellectual disability, sensory deficits, emotional/behavioral disturbance, or frank neurological condition.
Developmental language disorder
Atypical language skills or functions in the absence of hearing loss, mental retardation, autism, gross neurological impairment, social/communicative deprivation, paralysis, malformation of the vocal apparatus, or emotional disturbance.
Mathematics Addition, subtraction, multiplication, division, or any combination of the aforementioned processes to generate numerical solutions.
Nonword reading Decoding of the sounds that comprise a non-real word/pseudoword.
Phonological awareness Knowledge and manipulation of the sound structure in spoken words.
Specific learning disability As indicated in the Individuals with Disabilities Education Improvement Act of 2004, a specific learning disability manifests as a disorder in one or more of the basic psychological processes involved in understanding or using spoken or written language, including conditions such as perceptual disabilities, brain injury, minimal brain dysfunction, dyslexia, and developmental aphasia, that may manifest in an imperfect ability to listen, think, speak, read, write, spell, or compute mathematical calculations, which is not the result of visual, hearing, or motor disabilities; mental retardation; emotional disturbance; or environmental, cultural, or economic disadvantage.
Spelling Application of letter–sound correspondence knowledge to generate verbal or in written graphemic representations of words or nonwords.
Spoken language impairment Significant deficits in spoken language in the absence of sensorimotor deficits, frank neurological disorder, general cognitive impairment, psychiatric diagnosis, and neurological damage.
Synthetic phonics Decoding of written words by first converting graphemes into phonemes and then blending the sounds to form words.
Text comprehension Demonstration of appropriate understanding of a story read or heard as indicated by correctly responding to factual or inferential questions or accurately retelling the story.
Text reading fluency Reading of words accurately and rapidly in connected text.
Whole word method Reading for meaning with no emphasis on decoding words or attending to letter–sound correspondences; the whole word method relies instead on exposure to words in texts and phonological awareness skills as a means for expanding and improving word identification skills during reading.
Word recognition in isolation Decoding of single words in isolation.
Word recognition speed Rapid decoding of words in isolation; a measure of word reading automaticity.
Word recognition in text Decoding of single words in phrases and sentences.
ASHA’s National Center for Evidence-Based Practice in Communication Disorders • July 2013 42
Blachman et al. (2004) • Lowest 20% of readers in first- and second-grade teachers’ classrooms using procedures developed by the school to identify children in need of special services or a specific reading ability rating scale
• SS <90 on the Word Identification or Word Attack subtest of the WRMT–R
• SS <90 on the Basic Skills cluster of the WRMT–R
• WISC–III Verbal IQ <80 • Mental retardation • Left handed • Hearing loss • Severe articulation problems • Severe emotional disturbance • Autism • Neurological problems • English as a second language
Lovett et al. (1988)a Accuracy-disabled group: • Score at least 1.5 years below grade level expectations on at least 4
different measures of word recognition accuracy
Rate-disabled group: • Score close to, at, or above grade level on 4 or more measures of word
recognition accuracy • Score at least 1.5 years below grade level on 4 out of 5 measures of
reading speed
• Below-average intelligence (WISC–R Verbal and Performance SS <85) • English as a second language • Hyperactivity • Hearing impairment • Brain damage • Chronic medical condition • Serious emotional disturbance
Lovett et al. (1989)a Accuracy-disabled group: • Score at least 1.5 years below grade level expectations on at least 4
different measures of word recognition accuracy
Rate-disabled group: • Score close to, at, or above grade level on 4 or more measures of word
recognition accuracy • Score at least 1.5 years below grade level on 4 out of 5 measures of
reading speed
• Below-average intelligence (WISC–R Verbal and Performance SS <85) • English as a second language • Hyperactivity • Hearing impairment • Brain damage • Chronic medical condition • Serious emotional disturbance
Lovett et al. (1990)b Score below the 25th percentile on 4 of the 5 different oral reading performance measures in the screening battery
• Below-average intelligence (WISC–R Verbal and Performance SS <85) • English as a second language • Extreme hyperactivity • Hearing impairment • Brain damage • Chronic medical condition • Serious emotional disturbance
ASHA’s National Center for Evidence-Based Practice in Communication Disorders • July 2013 43
Study Inclusion criteria Exclusion criteria
Lovett et al. (1994)b Score below the 25th percentile on 4 of the 5 different oral reading performance measures in the screening battery
• Below-average intelligence (WISC–R Verbal and Performance <85) • English as a second language • Extreme hyperactivity • Hearing impairment • Brain damage • Chronic medical condition • Serious emotional disturbance
Oakland et al. (1998) • SS <90 word recognition subtest of the WRAT–R • At least a 15-point discrepancy between WISC–R Full Scale IQ and
the Word Recognition subtest of the WRAT–R
• WISC–R Full Scale IQ score below 91 • Abnormal or uncorrected vision • Failed pure-tone hearing screening • Nonnative English speaker • Acquired or congenital focal brain lesions • Major emotional disturbances
O’Shaughnessy & Swanson (2000)
• Score below the 25th percentile on Word Identification, Word Attack, and Passage Comprehension subtests of the WRMT–R and the TOPA
• 1 year below grade level on curriculum-based measures of oral reading fluency
• WISC–III full scale IQ ≤85 • Scores >25th percentile on the WRMT–R Word Attack and Passage
Comprehension subtests • <1 year below grade level on CBM of oral reading fluency • Scores >25th percentile on the TOPA • English as a second language • Extreme hyperactivity • Hearing impairment • Brain damage • Chronic medical condition • Serious emotional disturbance
Shaywitz et al. (2004) • SS <90 on the Word Identification or Word Attack subtests of the Woodcock Reading Achievement Tests and on the average of both subtests
• Verbal IQ SS <80 on the WISC–R • English as a second language • Left handed • Hearing loss • Severe articulation problems • Severe emotional disturbance • Autism • Mental retardation
ASHA’s National Center for Evidence-Based Practice in Communication Disorders • July 2013 44
Soriano et al. (2011) • Poor performance in reading according to a teacher’s rating report • Average achievement in other academic areas (e.g., mathematics) • Reading disability determined by a score corresponding to 25th
percentile or less on the word reading subtest from the PROLEC–SE
• IQ SS <80 as measured by the Culture Fair Intelligence Test • Intellectual disability • Cultural or environmental disadvantages • Average or above-average academic performance in reading (according to a
teacher’s rating report) • Below-average achievement in other academic areas • Neurological damage • Environmental damage • Emotional disturbance • Hearing or vision impairments • Any other handicapping condition
Note. WISC–III = Wechsler Intelligence Scale for Children—Third Edition; WRMT–R = Woodcock Reading Mastery Tests—Revised; WISC–R = Wechsler Intelligence Scale for Children—Revised; SS = standard score; WRAT–R = Wide Range Achievement Test—Revised; TOPA = Test of Phonological Awareness; CBM = curriculum-based measurement; PROLEC–SE = Evaluation of Reading Processes for Secondary Education Students. aTests in the participant selection battery in Lovett et al. (1988, 1989) included the Durrell Analysis of Reading Difficulty Oral Reading, Word Recognition, and Word Analysis subtests; Gates–McKillop Reading Diagnostic Tests (Words Flash, Words Untimed, and Phrases Flash subtests); the Gilmore Oral Reading Test; the Peabody Individual Achievement Test (Reading Recognition subtest); the Slosson Oral Reading Test; the Test of Rapid Reading Responses; sections of the Biemiller Test of Reading Processes; and the WRAT–R Reading subtest. bTests in the participant selection battery in Lovett et al. (1990, 1994) included the Goldman–Fristoe–Woodcock Sound–Symbol Tests (Reading subtest), the Peabody Individual Achievement Test (Reading Recognition subtest); the WRAT–R; and the Woodcock Reading Mastery Tests (Word Attack and Word Identification subtests).
ASHA’s National Center for Evidence-Based Practice in Communication Disorders • July 2013 45
Categories Rated κ Rationale for Calculating Percentage Agreement
Sifting of abstracts and full articles .76; substantial agreement NA
Critical appraisal of study quality Blinding: 1.0; perfect agreement NA
Statistical significance: 1.0; perfect agreement
NA
Sampling: .55; moderate agreement NA
Intention to treat: .44; moderate agreement
NA
Treatment fidelity: .78; substantial agreement
NA
Randomization: .85; almost perfect agreement
NA
Order effects: kappa NC; 100% There were insufficient data to determine the proportion of times raters would agree by chance alone, which is the primary factor that distinguishes percentage agreement from kappa.
Study protocol: 0; 90% The observed agreement and expected agreement were equal; when the two are equal, the adjustment of the observed agreement by the expected agreement is zero.
Let Evidence Guide Every New Decision (LEGEND) grading of body of evidence
Strength of evidence ratings: .41; moderate agreement
NA
Note. NA = not applicable; NC = not calculable.
ASHA’s National Center for Evidence-Based Practice in Communication Disorders • July 2013 46
TG > CG for all statistically significant findings
Standardized tests
Posttest
Overall
WRMT, Word Identification: p = .0001, d = 1.31
Follow-up
Overall
WRMT, Word Identification: p = .0001, d = 1.05
TG > CG for all statistically significant findings
Standardized tests
Posttest
Overall
GORT–3, Accuracy: p = .0041, d = 0.72
Follow-up
Overall
GORT–3, Accuracy: ns; p = .2151, d = 0.30
TG > CG for all statistically significant findings
Standardized tests
Posttest
Overall
WRMT, Word Attack: p = .0006, d = 0.89
Follow-up
Overall
WRMT, Word Attack: p = .0243, d = 0.56
TG > CG for all statistically significant findings
Standardized tests
Posttest
Overall
GORT–3, Rate: p = .0002, d = 0.96
Follow-up
Overall
GORT–3, Rate: p = .0014, d = 0.81
TG > CG for all statistically significant findings
Standardized tests
Posttest
Overall
GORT–3, Comprehension: p = .0275, d = 0.55
Follow-up
Overall
GORT–3, Comprehension: ns; p = .3163, d = 0.24
TG > CG for all statistically significant findings
Standardized tests
Posttest
Overall
WRAT3, Spelling: p = .0001, d = 1.13
Lower initial skill groups
WRAT3, Spelling: p = .0001, d = 1.57
Higher initial skill groups
WRAT3, Spelling: p = .0041, d = 1.04
Follow-up
Overall
WRAT3, Spelling: p = .0015, d = 0.81
Lower initial skill groups
WRAT3, Spelling: p = .0137, d = 0.91
Standardized tests
Posttest
Overall
WJ–R, Calculations: p = .1803, d = −0.33
Overall
WJ–R, Applied Problems: p = .1316, d = −0.37
Follow-up
Overall
WJ–R, Calculations: p = .1289, d = 0.38
Overall
WJ–R, Applied Problems: p = .8760, d = −0.04
The first cohort originally had 15 vs. 20 items on 3 of the phonological awareness measures (had to prorate the scores of the 21 children so they ranged from 0–20).
The treatment and control groups differed significantly at pretest on the nonword repetition test.
Some control children may have received instruction at too high a level.
The treatment group received more hours of remedial reading instruction than the control children.
ASHA’s National Center for Evidence-Based Practice in Communication Disorders • July 2013 47
Study Word recognition in isolation
Word recognition in text
Nonword reading
Word recognition speed
Text comprehension
Spelling Mathematics Study limitations
Experimental tasks
Posttest: Difference between groups
Overall
Word reading task: p = .0002
Posttest: Differential growth rates
Overall
Word reading task: p = .0074
Follow-up: Difference between groups
Overall
Word reading task: p = .0069
Experimental tasks
Posttest: Difference between groups
Overall
TOWREa, Word Reading Efficiency: p < .0001
Posttest: Differential growth rates
Overall
TOWREa, Word Reading Efficiency: p = .0079
Follow-up: Difference between groups
Overall
TOWREa, Word Reading Efficiency: p < .0001
Higher initial skill groups
WRAT3, Spelling: p = .0024, d = 1.13
Experimental tasks
Posttest: Difference between groups
Overall
Spelling dictation: p = .0002
Posttest: Differential growth rates
Overall
Spelling dictation: p = .0110
Follow-up: Difference between groups
Overall
Spelling dictation: p = .0063
ASHA’s National Center for Evidence-Based Practice in Communication Disorders • July 2013 48
Study Word recognition in isolation
Word recognition in text
Nonword reading
Word recognition speed
Text comprehension
Spelling Mathematics Study limitations
Follow-up: Differential growth rates
Overall
Word reading task: ns
Follow-up: Differential growth rates
Overall
TOWREa, Word Reading Efficiency: ns
Follow-up: Differential growth rates
Overall
Spelling dictation: ns
Lovett et al. (1988)
Standardized tests WRAT–R, Reading
DS > CSS: p < .002, d = .63
OWLS > CSS: p < .04, d = 0.41
DS & OWLS: ns
Experimental tasks Regular and Exception Word Test, Word Recognition Accuracy
Experimental tasks (“words recognized in isolation and in different context conditions”)
Word recognition speed
Regular TT
REG ≠ EXC > CSS: p < .001
REG = EXC > CSS: p < .001
REG = EXC &
NA Standardized tests WRAT–R, Spelling
REG ≠ EXC & CSS: ns
REG = EXC & CSS: nsREG = EXC & REG ≠ EXC: ns
Standardized tests WRAT–R, Arithmetic
REG ≠ EXC & CSS: ns
REG = EXC & CSS: ns
REG = EXC & REG ≠EXC: ns
There was no attempt to control for other educational experiences (authors stated that participation in a remedial program appeared randomly distributed).
ASHA’s National Center for Evidence-Based Practice in Communication Disorders • July 2013 52
Study Word recognition in isolation
Word recognition in text
Nonword reading
Word recognition speed
Text comprehension
Spelling Mathematics Study limitations
Experimental tasks Word recognition accuracy
Regular TT
REG ≠ EXC > CSS: p < .001
REG = EXC > CSS: p < .001
REG = EXC & REG ≠ EXC: ns
Regular NTT
REG ≠ EXC & CSS: ns
REG = EXC & CSS: ns
REG = EXC & REG ≠ EXC: ns
Exception TT
REG ≠ EXC > CSS: p < .001
REG = EXC > CSS: p < .001
REG = EXC & REG ≠ EXC: ns
Exception NTT
REG ≠ EXC & CSS: ns
REG = EXC & CSS: ns
REG ≠ EXC: ns
Regular NTT
REG ≠ EXC > CSS: p < .05
REG = EXC & CSS: ns
REG = EXC & REG ≠ EXC: ns
Exception TT
REG ≠ EXC > CSS: p < .001
REG = EXC > CSS: p < .001
REG = EXC & REG ≠ EXC: ns
Exception NTT
REG ≠ EXC > CSS: p < .01
REG = EXC > CSS: p < .05
REG = EXC & REG ≠ EXC: ns
Experimental tasks (“words recognized in isolation and in different context conditions”)
Spelling
Regular TT
REG ≠ EXC > CSS: p < .001
REG = EXC > CSS: p < .001
REG = EXC & REG ≠ EXC: ns
Regular NTT
REG ≠ EXC & CSS: ns
REG = EXC > CSS: p < .001
REG = EXC > REG ≠ EXC: p < .01
Exception TT
REG ≠ EXC > CSS: p < .001
REG = EXC > CSS: p < .001
REG = EXC & REG ≠ EXC: ns
ASHA’s National Center for Evidence-Based Practice in Communication Disorders • July 2013 53
Study Word recognition in isolation
Word recognition in text
Nonword reading
Word recognition speed
Text comprehension
Spelling Mathematics Study limitations
REG = EXC & REG ≠ EXC: ns
Test of Transfer
Regular TT
REG ≠ EXC & CSS: ns
REG = EXC & CSS: ns
REG = EXC & REG ≠ EXC: ns
Regular NTT
REG ≠ EXC & CSS: ns
REG = EXC & CSS: ns
REG = EXC & REG ≠ EXC: ns
Exception NTT
REG ≠ EXC > CSS: p < .001
REG = EXC > CSS: p < .001
REG = EXC & REG ≠ EXC: ns
Lovett et al. (1994)
Standardized tests WRAT–R, Reading
WIST & CSS: ns
PHAB/DI > CSS: p < .001
PHAB/DI > WIST: p < .03
WRMT–R, Word Identification
WIST & CSS: ns
NA Standardized tests Transfer-of-learning measures
Transfer to nonwords
GFW, Reading of Symbols
WIST & CSS: ns
PHAB/DI > CSS: p < .01
PHAB/DI > WIST: p < .05
WRMT–R, Word Attack
NA Standardized tests WRMT–R, Passage Comprehension
WIST & CSS: ns
PHAB/DI & CSS: ns
WIST & PHAB/DI: ns
Standardized tests WRAT–R, Spelling
WIST & CSS: ns
PHAB/DI & CSS: ns
WIST & PHAB/DI: ns
PIAT–R, Spelling
WIST > CSS: p < .04
NA There was no attempt to control for other educational experiences (authors stated that participation in a remedial program appeared randomly distributed).
ASHA’s National Center for Evidence-Based Practice in Communication Disorders • July 2013 54
Study Word recognition in isolation
Word recognition in text
Nonword reading
Word recognition speed
Text comprehension
Spelling Mathematics Study limitations
PHAB/DI & CSS: ns
WIST & PHAB/DI: ns
Experimental tasks
Measures of trained content
Key words
WIST > CSS: p < .001
PHAB/DI > CSS: p < .001
WIST & PHAB/DI: ns
Transfer-of-learning measures
Transfer to real words
Test-of-transfer words
WIST > CSS: p < .001
PHAB/DI > CSS: p < .001
WIST & PHAB/DI: ns
Challenge words WIST > CSS: p < .001 PHAB/DI > CSS: p < .01
WIST & CSS: ns PHAB/DI > CSS: p < .001
PHAB/D I> WIST: p < .01
PHAB/DI & CSS: ns
WIST & PHAB/DI: ns
GFW, Spelling of Sounds
WIST > CSS: p < .04
PHAB-DI > CSS: p < .001
WIST & PHAB/DI: ns
ASHA’s National Center for Evidence-Based Practice in Communication Disorders • July 2013 55
Study Word recognition in isolation
Word recognition in text
Nonword reading
Word recognition speed
Text comprehension
Spelling Mathematics Study limitations
WIST & PHAB/DI: ns
Regular word inventory
WIST > CSS: p < .01
PHAB/DI > CSS: p < .001
WIST & PHAB/DI: ns
Exception word inventory
WIST > CSS: p < .04
PHAB/DI & CSS: ns
WIST & PHAB/DI: ns
Oakland et al. (1998)
Standardized tests WRAT–R, Word Recognition
DTP & CG: ns; p > .05, d = 0.06
NA Standardized tests Decoding Skills Test, Monosyllabic Phonological Decoding
NA Standardized tests GMRT–3, Reading Comprehension
DTP & CG: ns; p > .05, d = 0.33
Standardized tests WRAT–R, Spelling
DTP & CG: ns; p > .05, d = 0
NA The sample size was small, groups varied in oral language skills and socioeconomic status, and there was no control for supplementary reading instruction.
ASHA’s National Center for Evidence-Based Practice in Communication Disorders • July 2013 56
Study Word recognition in isolation
Word recognition in text
Nonword reading
Word recognition speed
Text comprehension
Spelling Mathematics Study limitations
O’Shaughnessy & Swanson (2000)
Standardized tests Transfer of learning
WRMT–R, Word Identification
PAT & Math: ns
WAT & Math: ns
PAT & WAT: ns
Experimental tasks
Trained content
PAT, Word List
PAT & WAT > Math: p < .001
PAT Math: p NR, d = 1.61
WAT > Math: p NR/C, d = 1.42
PAT & WAT: ns; d = 0.07
WAT, Word List
WAT > PAT > Math: p < .01
PAT > Math: p NR, d = 1.07
NA Standardized tests Transfer of learning
WRMT–R, Word Attack
PAT > Math: p < .01, d = 0.45
WAT > Math: p < .05, d = 0.47
PAT & WAT: ns; d = 0.01
NA Standardized tests Transfer of learning
WRMT–R: Passage Comprehension
PAT &Math: ns; d = 0.36
WAT > Math: p < .05, d = 0.65
PAT & WAT: ns; d = 0.18
Standardized tests Transfer of learning PIAT–R Spelling PAT & Math: ns; d = 0.42 WAT > Math: p < .05, d = 0.65 PAT & WAT: ns; d = 0.29
Standardized tests WIAT, Numerical Operations
Math > PAT & WAT, p < .05
Math > PAT: d = −0.77
Math > WAT: d = −0.86
PAT & WAT: p NR, d = 0.17
WIAT, Mathematical Reasoning
PAT & Math: ns; p > .05
WAT & Math: ns; p > .05
PAT & WAT: ns; p > .05
The sample size was small, and there was no attempt to control for other educational experiences.
ASHA’s National Center for Evidence-Based Practice in Communication Disorders • July 2013 57
Study Word recognition in isolation
Word recognition in text
Nonword reading
Word recognition speed
Text comprehension
Spelling Mathematics Study limitations
WAT > Math: d = 1.85
WAT > PAT: p < .01, d = 1.09
Shaywitz et al. (2004)
NA Standardized tests GORT–3, Accuracy
Immediately postintervention
EI > CI: p = .0023, d = 1.07 (0.37, 1.74)
NA Standardized tests GORT–3, Rate
Immediately postintervention
EI > CI: p = .0276, d = 0.76 (0.08, 1.41)
GORT–3, Passageb
Immediately postintervention: EI > CI: p = .0072, d = 0.93 (0.24, 1.60)
Standardized tests GORT–3, Comprehension
Immediately postintervention
CI & EI: p = .1784, d = 0.45 (−0.21, 1.10)
NA NA The sample sizes were unequal (CI < EI), and differences in service delivery were noted between the CI and EI group.
There was no follow-up assessment with the CI group.
Soriano et al. (2011)
NA Standardized tests TALE–2000 Reading Battery, Text Reading Accuracy
IG > NI: Difference between groups at posttest: p = .001, d = 2.02 (0.93, 2.96)
Gain score difference: p = .002, d = 1.53
NA Standardized tests PROLEC–SE, Word Reading Fluency: Intervention
IG > NI: Difference between groups at posttest: p < .0001, d = 2.70 (1.46, 3.73)
Gain score difference: p = .002, d = 1.61
Standardized tests PROLEC–SE, Text Comprehension
IG & NI: Difference between groups at posttest: ns; p = .7715, d = −0.13 (−0.96, 0.72)
Gain score difference: ns; p = .507, d = 0.30
NA NA The sample size was small. The greater number of male participants (decreases generalizability).
The individual vs. group instruction is a more costly human resource and an unlikely instructional format.
The interventions were administered in the resource
ASHA’s National Center for Evidence-Based Practice in Communication Disorders • July 2013 58
Study Word recognition in isolation
Word recognition in text
Nonword reading
Word recognition speed
Text comprehension
Spelling Mathematics Study limitations
PROLEC–SE, Pseudoword Reading Fluency
IG > NI: Difference between groups at posttest: p < .0001, d = 2.91 (1.62, 3.98)
Gain score difference: p = .001, d = 1.74
TALE–2000 Reading Batteryb, Text Reading Speed
IG > NI: Difference between groups at posttest: p < .0001, d = 2.74 (1.49, 3.78)
Gain score difference: p = .001, d = 2.14
room via the special education teacher vs. being generalized and administered by the classroom teacher. There was a lack of information about the students and the teachers which, if available, could have fostered social validity. A longitudinal design would have better determined treatment effects on reading comprehension.
Note. TG = treatment group; CG = control group; WJ–R = Woodcock–Johnson—Revised; WRMT = Woodcock Reading Mastery Test; GORT–3 = Gray Oral Reading Test, Third Edition; WRAT = Wide Range Achievement Test; TOWRE = Test of Word Reading Efficiency; NA = not applicable; wpm = words per minute; DS = decoding skills; CSS = Classroom Survival Skills program; OWLS = Oral and Written Language Skills program; SORT = Slosson Oral Reading Test; GFW = Goldman–Fristoe–Woodcock; PIAT = Peabody Individual Achievement Test; REG ≠ EXC = regular words taught by training letter–sound mappings; REG = EXC = regular and exception words taught the “exception word” way; NR = not reported; TT = taught to; NTT = not taught to; WIST = word identification strategy training; PHAB/DI = phonological analysis and blending/direct instruction; GMRT–3 = Gates–MacGinitie Reading Test—3; DTP = Dyslexia Training Program; WIAT = Wechsler Individual Achievement Test; PAT = phonological awareness training; WAT = word analogy training; NR/C = not reported/calculable; EI = experimental intervention; CI = community intervention; TALE–2000 = Test de Análisis de la Lecto Escritura; PROLEC–SE = Evaluation of Reading Processes for Secondary Education Students; IG = intervention group; NI = no intervention. aThis is the prepublication version of this standardized test. b These are considered measures of reading fluency.
ASHA’s National Center for Evidence-Based Practice in Communication Disorders • July 2013 59
Supplemental Materials Table 5. Study condition descriptions.
Study Treatment(s) Control
Blachman et al. (2004) Treatment group: Treatment year This was a nonscripted, explicit, and systematic instructional program designed to enhance understanding of the phonologic and orthographic connections in words taught to participants.
Follow-up year Regular classroom instruction was provided to all. More than 50% of participants received remedial reading instruction.
Control group: Treatment year Remedial instruction was provided in addition to the regular classroom reading instruction.
Follow-up year Regular classroom instruction was provided to all. More than 60% of participants received remedial reading instruction.
Lovett et al. (1988) Decoding Skills Program (DS) : Instruction focused on the acquisition of word recognition and spelling skills
Oral and Written Language Skills (OWLS) program: Children were taught an integrated program of language stimulation and instruction to remediate oral and written language deficits.
Classroom Survival Skills program (CSS): Training focused on social skills, classroom etiquette, life skills, organizational strategies, academic problem solving, and self-help techniques.
Lovett et al. (1989) Decoding Skills Program: Instruction focused on the acquisition of word recognition and spelling skills.
Oral and Written Language Skills program: Spoken and printed language were simultaneously addressed through instruction on semantic and syntactic linguistic functions.
CSS: Training focused on social skills, classroom etiquette, life skills, organizational strategies, academic problem solving, and self-help techniques.
Lovett et al. (1990) Regular (does not equal) Exception group (REG ≠ EXC): Regular words were taught by training the constituent letter–sound mappings. Exception words were introduced and rehearsed by whole-word methods alone. Word recognition and spelling skills were taught in an intensive and systematic instruction manner.
Regular (equals) Exception group (REG = EXC): Regular and exception words were introduced by whole-word methods only. Word recognition and spelling skills were taught in an intensive and systematic instruction manner.
CSS: Training focused on social skills, classroom etiquette, life skills, organizational strategies, academic problem solving, and self-help techniques.
Lovett et al. (1994) Phonological analysis and blending/direct instruction (PHAB/DI): Children received training in phonological analysis and blending. All training was done in the context of printed word presentations and direct instruction of letter correspondences.
Word identification strategy training (WIST): Training was provided on the acquisition, use, and monitoring of effective word identification strategies.
CSS: Training focused on social skills, classroom etiquette, life skills, organizational strategies, academic problem solving, and self-help techniques.
ASHA’s National Center for Evidence-Based Practice in Communication Disorders • July 2013 60
Study Treatment(s) Control
Oakland et al. (1998) Dyslexia Training Program (DTP): An adaptation of the alphabet phonics curriculum that initially addressed basic literacy skills, such as letter production, and then progressed into more sophisticated levels of linguistic knowledge, such as syllabicating. Vocabulary and reading comprehension training were other key components of the program.
Control group: Children received reading instruction as normally provided in their school. “Most received modified reading basal programs” (pp. 142–143).
O’Shaughnessy & Swanson (2000)
Phonological awareness training (PAT): Children received isolated skill instruction on phonemes to enhance oral language skills via phonological awareness, phonics, and both reading and spelling games.
Word analogy training (WAT): Children received contextualized skill instruction on whole words and onset-rime to enhance written language skills via whole word identification, spelling, and word decoding strategies.
Math: Children received the same amount of instructional time as did those in the two experimental reading programs; however, instead of reading instruction, the control group received mathematics training.
Shaywitz et al. (2004) Experimental intervention (EI): Explicit and systematic tutoring addressed the alphabetic principle. The six syllable types of English were taught to increase reading accuracy and fluency.
Community intervention (CI): Children received a variety of interventions provided within the school (i.e., remedial reading, resource room, special education, modified classroom, speech and language, remedial supportive, and tutoring). They did not receive the intervention protocol or similar explicit, phonologically based remediation.
Soriano et al. (2011) Intervention program (IP): In each session, one specific phoneme or blend in isolation, syllable, word, sentence, or passage context was addressed. Instructional components included repeated readings, phonological awareness training, and grapheme–phoneme decoding.
No intervention (NI): No special instruction was provided by the research staff. Children continued to receive typical reading instruction in the special education classroom that focused on general academic content and less on reading than the intervention program.
ASHA’s National Center for Evidence-Based Practice in Communication Disorders • July 2013 61
Supplemental Materials Table 6. Additional written language outcomes.
Skill Outcomes
Letter sound and sound combination
Lovett et al. (1994) assessed participants’ ability to pronounce a set of 37 letter–sound combinations and 120 regular words with high-frequency spelling patterns that were introduced to participants who received interventions during the treatment phase of the study. Participants in both treatment groups obtained higher scores than the control group, which were considered statistically significant: letter–sound pronunciations (WIST > CSS: p < .001, PHAB/DI > CSS: p < .001) and word identification (WIST > CSS: p < .001, PHAB/DI > CSS: p < .001). No significant differences in scores from those two measures were found between the two treatment groups.
Basic Skills Cluster
Only Blachman et al. (2004) included results from the Basic Skills Cluster, a subtest of the Woodcock Reading Mastery Test, which provides an aggregate score for two subtests: (a) Word Identification and (b) Word Attack (a nonword decoding task). Blachman et al. administered this test to all participants and provided overall results as well as findings by initial skill group placement (i.e., higher vs. lower). Across treatment groups at both posttest and follow-up, the treatment participants outperformed the control participants; large effect sizes were also reported: posttest overall (p = .001, d = 1.69), follow-up overall (p = .0001, d = .97), posttest lower initial skill group (p = .0001, d = 1.71), follow-up lower initial skill group (p = .004, d = 1.07), posttest higher initial skill group (p = .001, d = 1.25), and follow-up higher initial skill group (p = .0129, d = .90).
Word Decoding Strategy Test
As part of their evaluation of transfer of learning effects, Lovett et al. (1994) assessed participants’ use of strategies during particular points in the word decoding process (i.e., selection of strategies, application of strategies, self-monitoring of use of strategies, and word identification success when strategies were applied) and then reported the results by group comparisons. For the selection of strategies, both treatment groups’ performance was significantly different from the control group (WIST > CSS: p < .01, PHAB/DI > CSS: p < .001), whereas no difference was found between the two treatment groups. Findings similar to those reported for selection of strategies emerged for the application of strategies: WIST > CSS: p < .001, PHAB/DI > CSS: p < .001, WIST & PHAB/DI: no significant difference. Only the WIST group’s performance was significantly different from the other two groups for monitoring the success of strategy application (WIST > CSS: p < .001, PHAB/DI & CSS: no significant difference, WIST > PHAB/DI: p < .001). The WIST group once again outperformed the other two groups on success in applying strategies to word identification (WIST > CSS: p < .001, WIST > PHAB/DI: p < .05), yet a significant difference in performance was also noted between the PHAB/DI and CSS group (PHAB/DI > CSS: p < .05).
Gray Oral Reading Test (GORT) Quotient
The GORT Quotient, a composite of the GORT Accuracy, Rate, and Comprehension subtests, was computed in only one study, Blachman et al. (2004). All participants completed the aforementioned subtests, and the GORT Quotient results were reported for the overall group, lower initial skill group, and higher initial skill group treatment and control conditions. At posttest and follow-up, a significant difference, along with medium to large effect sizes in favor of the treatment group, were found for the overall group as well as for the lower initial skill group: posttest overall (p = .0021, d = 0.78), follow-up overall (p = .0218, d = 0.57), posttest lower initial skill group (p = .0032, d = 1.04), and follow-up lower initial skill group (p = .0229, d = 0.78). Although statistical significance was not achieved for the higher initial skill treatment group at posttest (p = .1000, d = 0.58) and follow-up (p = .3497, d = 0.33), the treatment effect was medium and small for the posttest and follow-up tests, respectively. However, because confidence intervals for the effect sizes were not reported or calculable, the significance of the treatment effect is indeterminate.
Note. WIST = word identification strategy training; CSS = Classroom Survival Skills program; PHAB/DI = phonological analysis and blending/direct instruction.
ASHA’s National Center for Evidence-Based Practice in Communication Disorders • July 2013 62
Supplemental Materials Table 7. Spoken language outcomes.
Study Phonological awareness
Rapid naming Nonword repetition
Morphology Syntax Semantics Pragmatics
Blachman et al. (2004)
TG > CG for all findings
Standardized tests
Posttest: Difference between groups Overall CTOPPa, Phonological Awareness: p = .0268
Follow-up: Difference between groups Overall CTOPPa, Phonological Awareness: ns
Follow-up: Differential growth rates Overall
CTOPPa: Phonological Awareness: ns
TG > CG for all findings
Standardized tests
Posttest: Difference between groups Overall CTOPPa, Rapid Naming of Letters: p = .0322 Posttest: Difference between groups Overall CTOPPa, Rapid Naming of Letters: ns
Follow-up: Difference between groups Overall CTOPPa, Rapid Naming of Letters: p = .02
Follow-up: Differential growth rates
Overall
CTOPPa, Rapid Naming of Letters: ns
TG> CG for all findings
Standardized tests
Posttest: Difference between groups Overall CTOPPa, Nonword Repetition: ns
Posttest: Difference between groups Overall CTOPPa, Nonword Repetition: ns Follow-up: Difference between groups Overall CTOPPa, Nonword Repetition: ns Follow-up: Differential growth rates
Overall
CTOPPa, Nonword Repetition: ns
NA NA NA NA
ASHA’s National Center for Evidence-Based Practice in Communication Disorders • July 2013 63
Study Phonological awareness
Rapid naming Nonword repetition
Morphology Syntax Semantics Pragmatics
Lovett et al. (1988)
NA NA NA Standardized tests ITPA, Grammatic Closure
NA NA NA NA NA Social Skills Rating System Teachers did not report a significant difference in pre- and posttest training observations in relation to academic performance.
ASHA’s National Center for Evidence-Based Practice in Communication Disorders • July 2013 67
Study Phonological awareness
Rapid naming Nonword repetition
Morphology Syntax Semantics Pragmatics
PAT > WAT: d = 0.43
Phonological working memory: Sentence span
PAT & WAT > Math: p < .0001
PAT > Math: d = 0.98
WAT > Math: d = 0.66
PAT > WAT: d = 0.32
Note. TG = treatment group; CG = control group; NA = not applicable; CTOPP = Comprehensive Test of Phonological Processing; ITPA = Illinois Test of Psycholinguistic Abilities; DTLA = Detroit Test of Learning Aptitude; DS = Decoding Skills Program; CSS = Classroom Survival Skills program; OWLS = Oral and Written Language Skills program; GFW = Goldman–Fristoe–Woodcock; RAN = rapid automatized naming; REG ≠ EXC = regular words taught by training letter–sound mappings; REG = EXC = regular and exception words taught the “exception word” way; NR = not reported; WIST = word identification strategy training; PHAB/DI = phonological analysis and blending/direct instruction; TOPA = Test of Phonological Awareness; PAT = phonological awareness training; WAT = word analogy training. aThis is the prepublication version of this standardized test. bThe test was normed but not standardized.
ASHA’s National Center for Evidence-Based Practice in Communication Disorders • July 2013 68
Supplemental Materials Appendix. Search strategy.
Databases
The following databases were searched within the following date range: August 2010 through August 2011:
Centre for Reviews and Dissemination Database, Cochrane Library (Wiley), ComDisDome (ProQuest), Communication & Mass Media Complete (EBSCO Information Services [hereafter EBSCO]), Cumulative Index to Nursing and Allied Health Literature - CINAHL (EBSCO), Education Research Complete (EBSCO), Education Resources Information Center - ERIC (CSA), GoogleScholar, Health Information Resources formerly National Library for Health, Health Source: Nursing/Academic Edition (EBSCO), HighWire Press, Latin American and Caribbean Center on Health Sciences Information - LILACS, Linguistics Language Behaviour Abstracts - LLBA (ProQuest), National Institute for Direct Instruction—Direct Instruction Research Database, National Rehabilitation Information Center—REHABDATA, OTseeker, Psychology and Behavioral Sciences Collection (EBSCO), PsycINFO (EBSCO), PubMed, Science Citation Index Expanded (ISI Web of Science), ScienceDirect, Social Sciences Citation Index (ISI Web of Science), Social Services Abstracts (ProQuest), speechBITE, SUMSearch 2, Teacher Reference Center (EBSCO), TRIPDatabase, and What Works Clearinghouse
Search Terms
Controlled vocabulary, such as Medical Subject Headings (MeSH), were used as available.
Search terms used in isolation or in combination in one or more databases included the following:
agraphia, developmental language disorder, dysgraphia, dyslexia, expressive language, language disabled, language disorder, language learning disability, learning disabled, mixed expressive receptive language, phonemic awareness, phonics, phonological awareness, prewriting, reading, receptive language, rewriting, specific language impairment, spelling, spoken language disorder, story grammar, syntax, vocabulary, writing
The following reading and writing interventions were also searched:
Auditory Discrimination in Depth; Concept Oriented Reading Instruction (CORI); Cooperative Strategic Reading (CSR); Earobics;, Edmark Reading Program; EmPOWER; Fast ForWord; Great Leaps Reading Program; Kurzweil 3000; Lindamood Bell; Lindamood Phoneme Sequencing (LiPS); Naturally Dragon Dictate; Orton–Gillingham; Peer Assisted Learning Strategies (PALS); POWER writing; Read and Write Gold; Read Naturally; Reading First; Reading Recovery; Reading Reflex; Read, Write, and Type; Retrieval, Automaticity, Vocabulary, Engagement with Language–Orthography (RAVE-O); Road to the Code; Seeing Stars; Self-Regulated Strategy Development (SRSD); Step-Up to Writing; Success for All; Spalding Method; Visualizing and Verbalizing; Wilson Reading System
All search terms were truncated or expanded as necessary.
Limits
Limits varied by database and included the following as available:
Humans, English, peer-reviewed publications, ages 6–18, publication year 1980–2011
Forward Search
All accepted articles were forward searched in Google Scholar and ISI Web of Science.
Reference Checking
The reference lists of all relevant articles identified were scanned for other possible studies.
ASHA’s National Center for Evidence-Based Practice in Communication Disorders • July 2013 69
Prolific Author Search
All publications by the following prolific authors were searched:
Marilyn Jager Adams, Kenn Apel, Christine Bahr, Anthony Bashir, Virginia Berninger, Dorothy Bishop, Benita Blachman, Robert Calfee, Lucy Calkins, Hugh Catts, Jeanne Chall, Colette Daiute, Curt Dudley-Marling, Barbara Ehren, Linnea Ehri, Barbara Foorman, Ronald Gillam, Steve Graham, Donald Hammill, Karen Harris, Stephen Isaacson, Edward Kame’enui, Alan Kamhi, Michael Kamil, Laurence Leonard, Linda Lombardino, G. Reid Lyon, Charles MacArthur, James McClelland, Louisa Moats, Nickola Nelson, Rhea Paul, Carol Rashotte, Timothy Rasinski, Mabel Rice, Froma Roth, Hollis Scarborough, Cheryl Scott, Mark Seidenberg, Sally Shaywitz, Elaine Silliman, Bonnie Singer, Catherine Snow, Margaret Snowling, C. Addison Stone, Bruce Tomblin, Gail E. Tompkins, Joseph Torgesen, Rebecca Treiman, Gary Troia, Steve Warren, Richard Wagner, Carol Westby, Bernice Wong, Paul Yoder, Xuyang Zhan


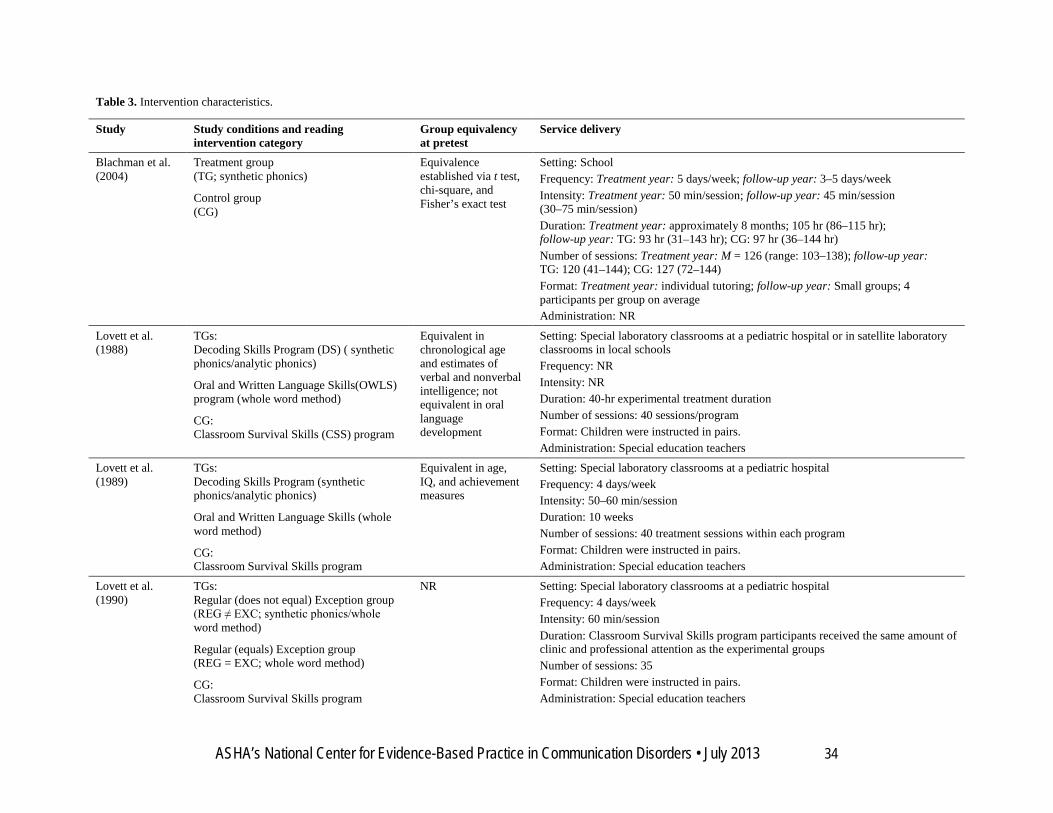

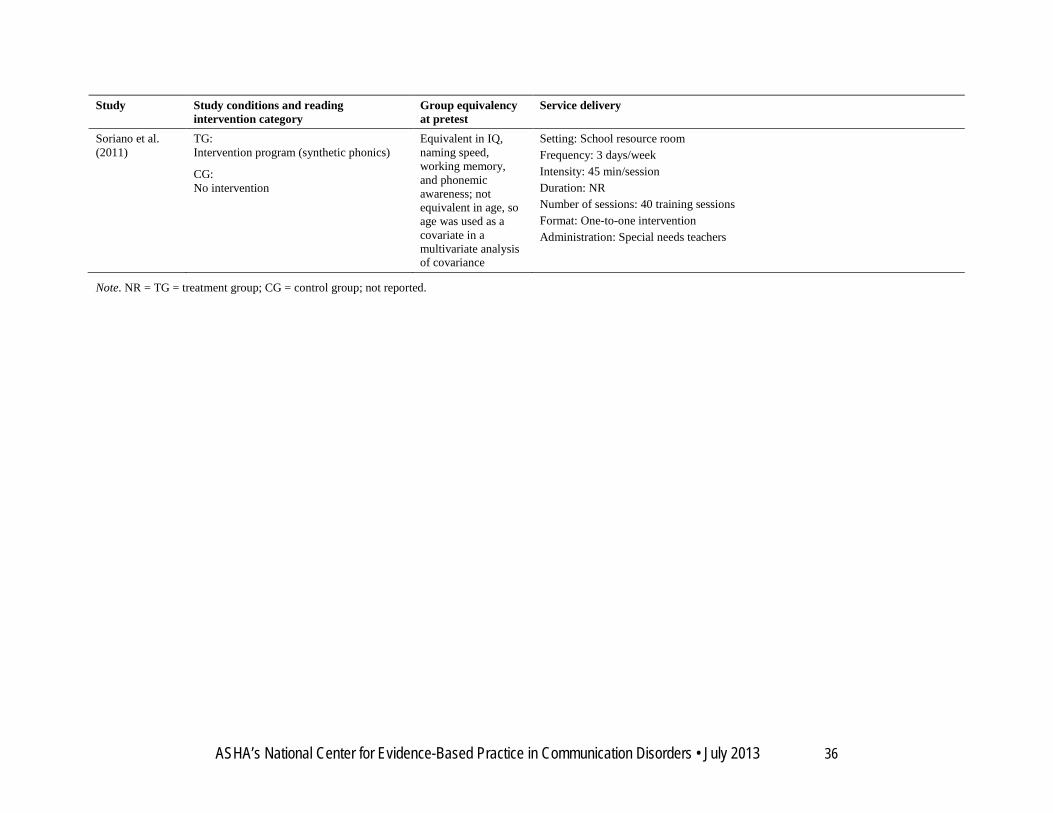
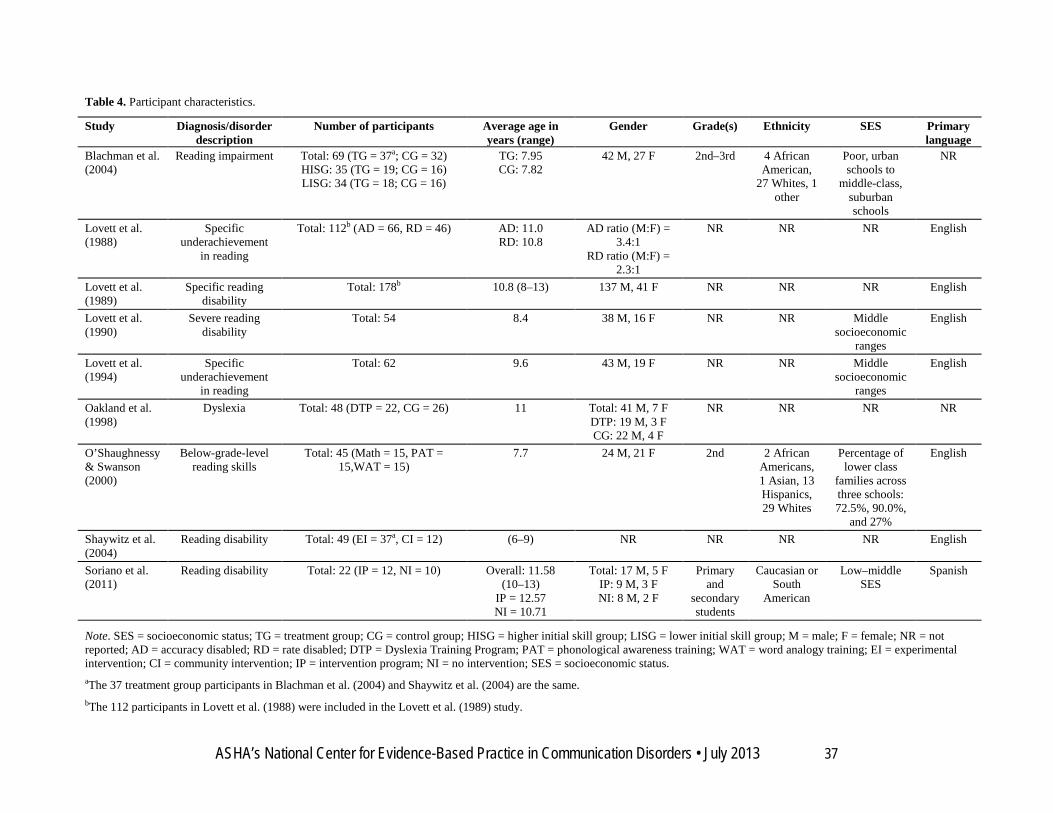

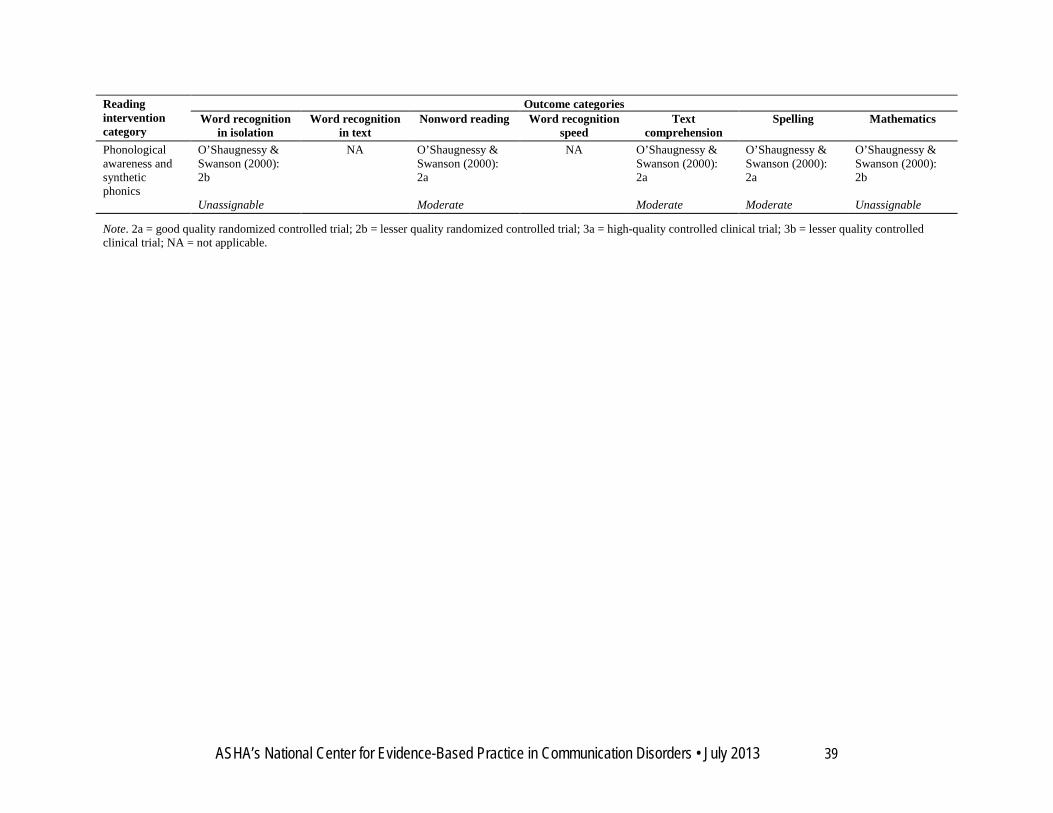

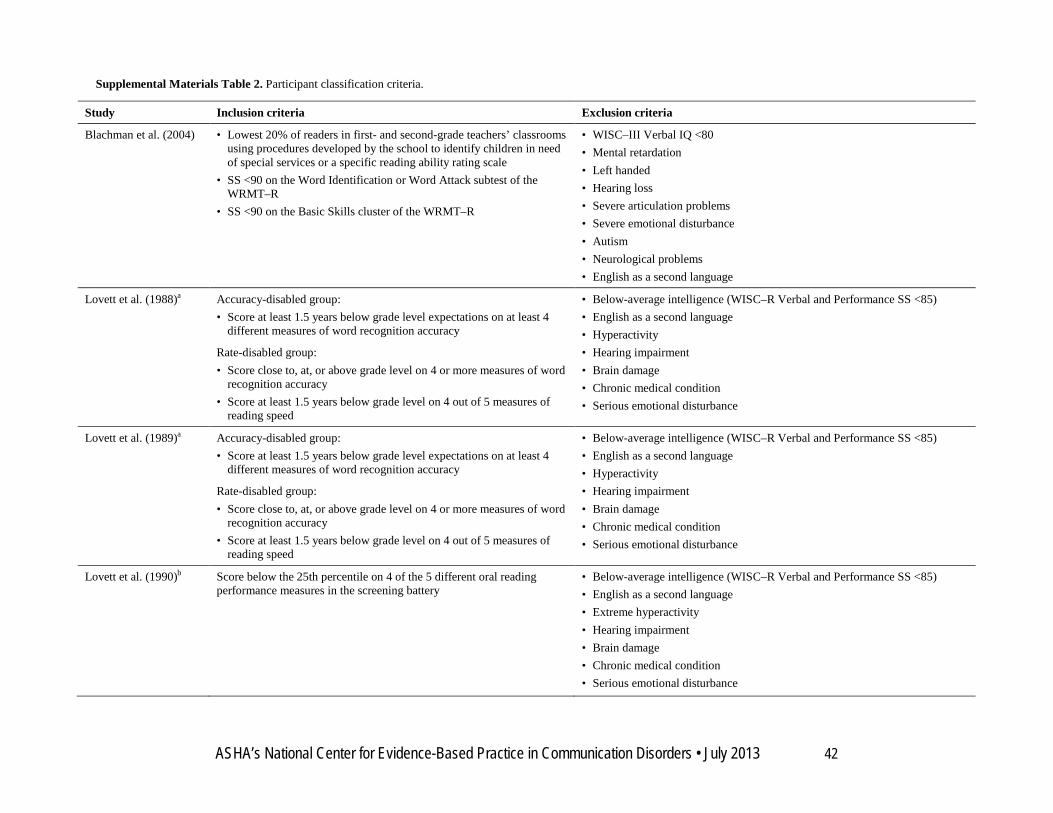
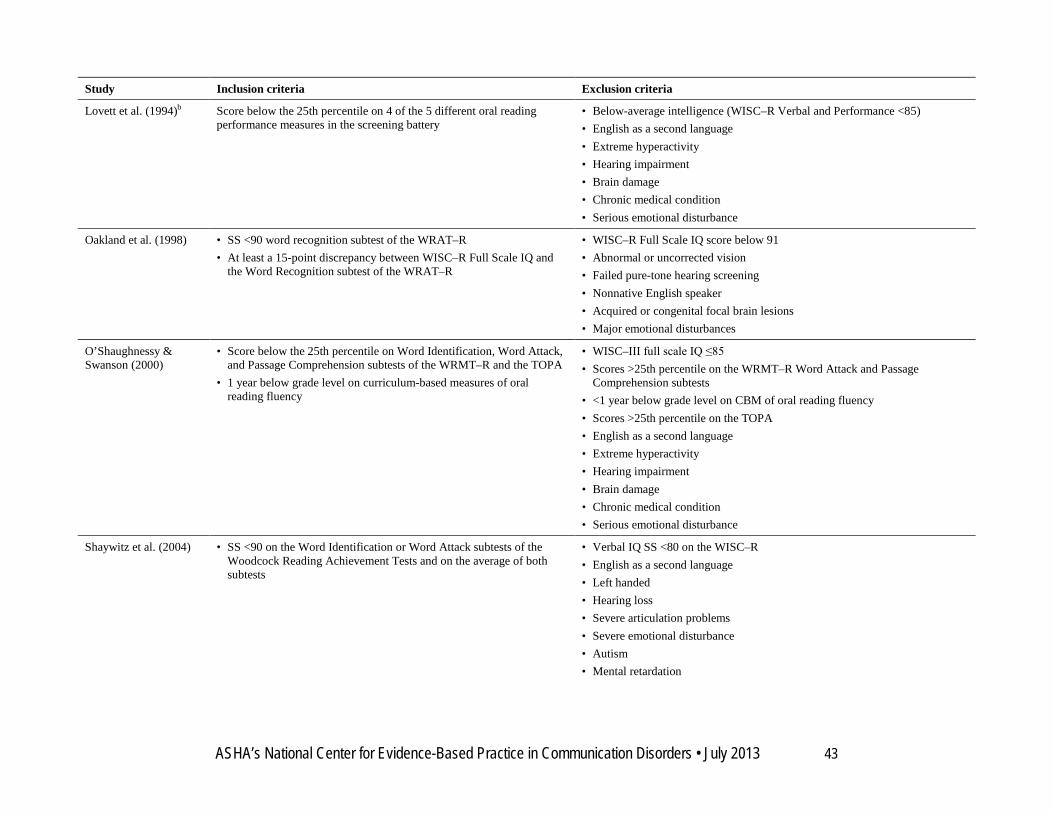
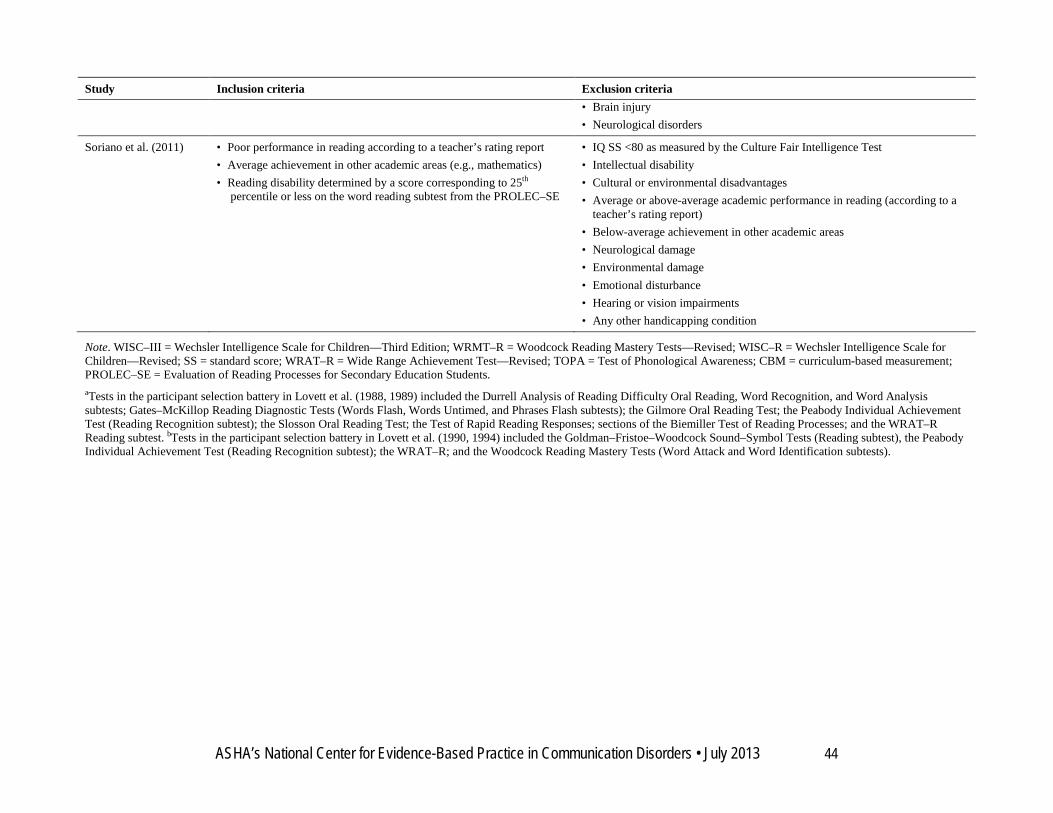
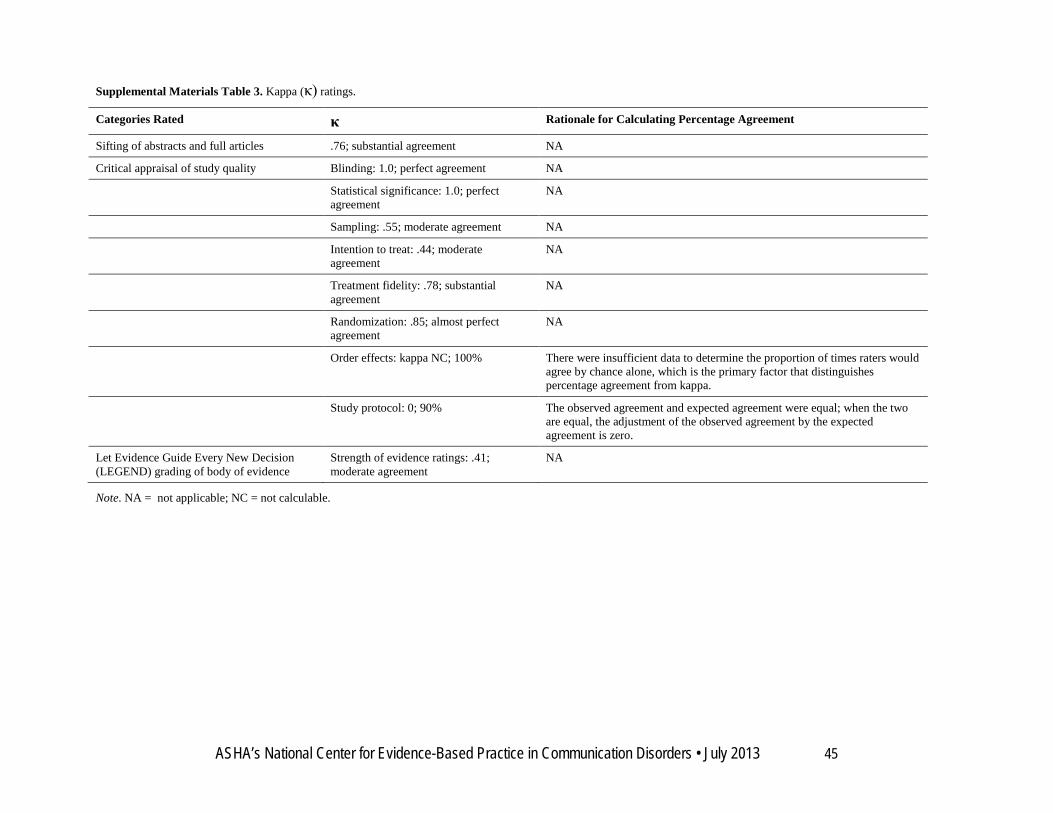
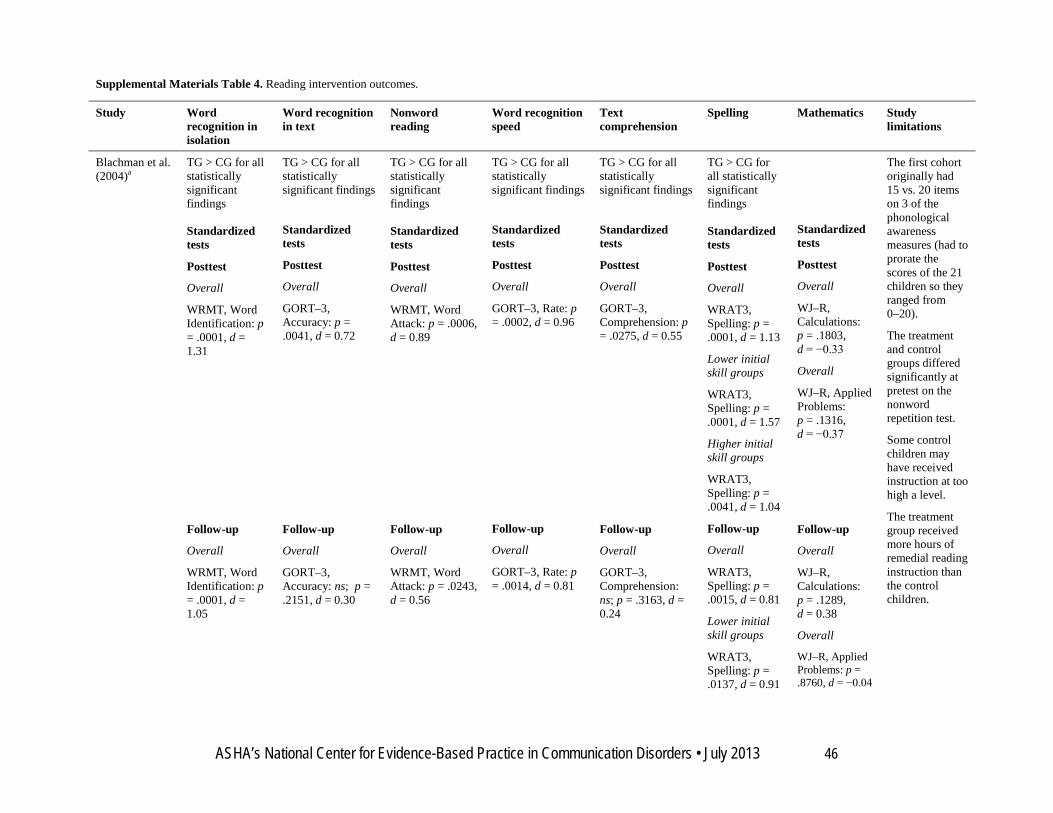
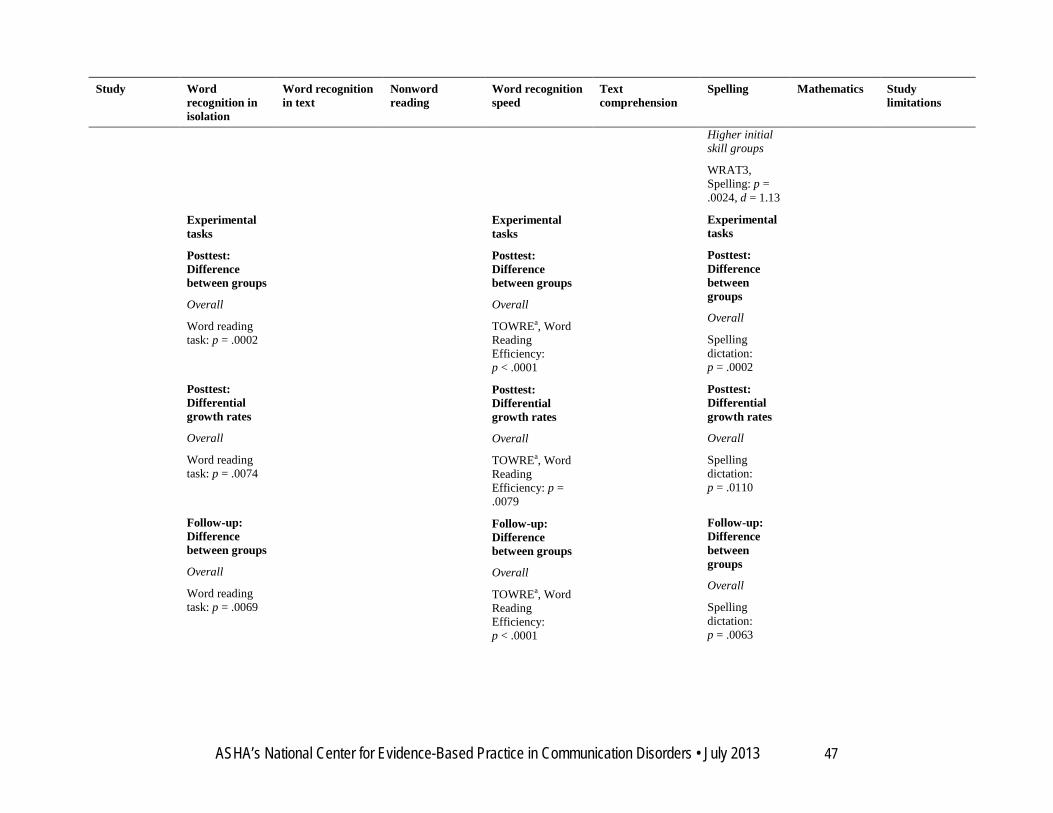


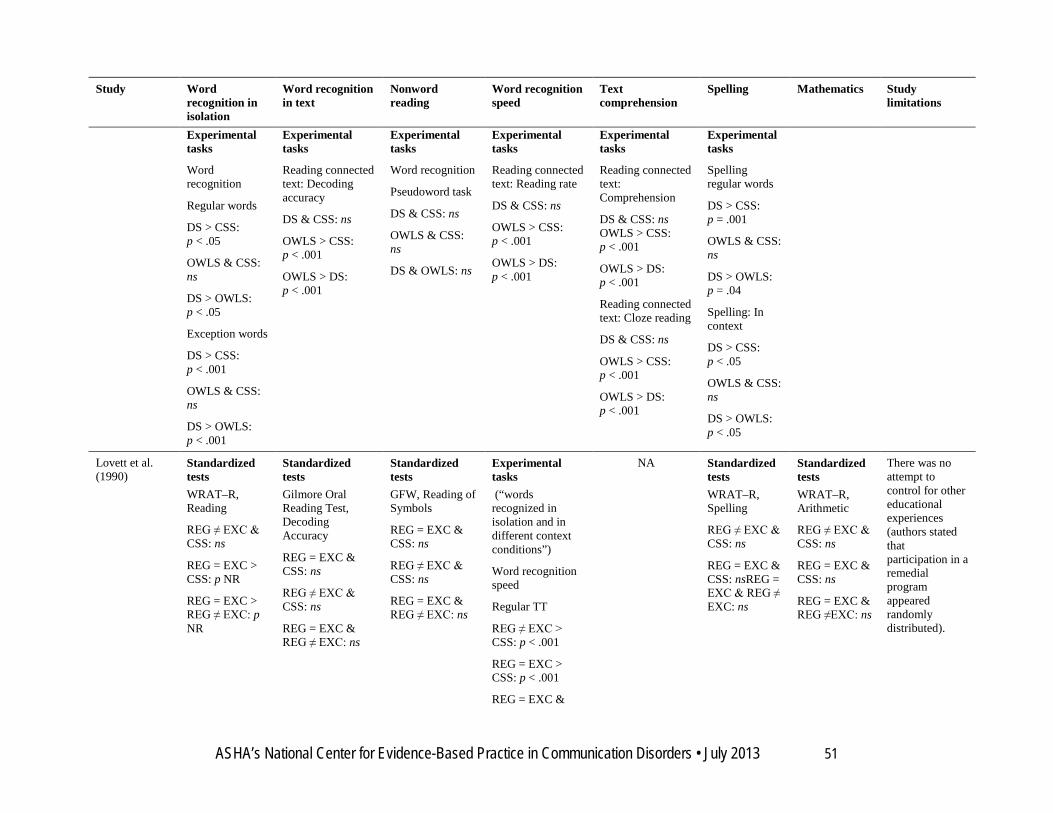

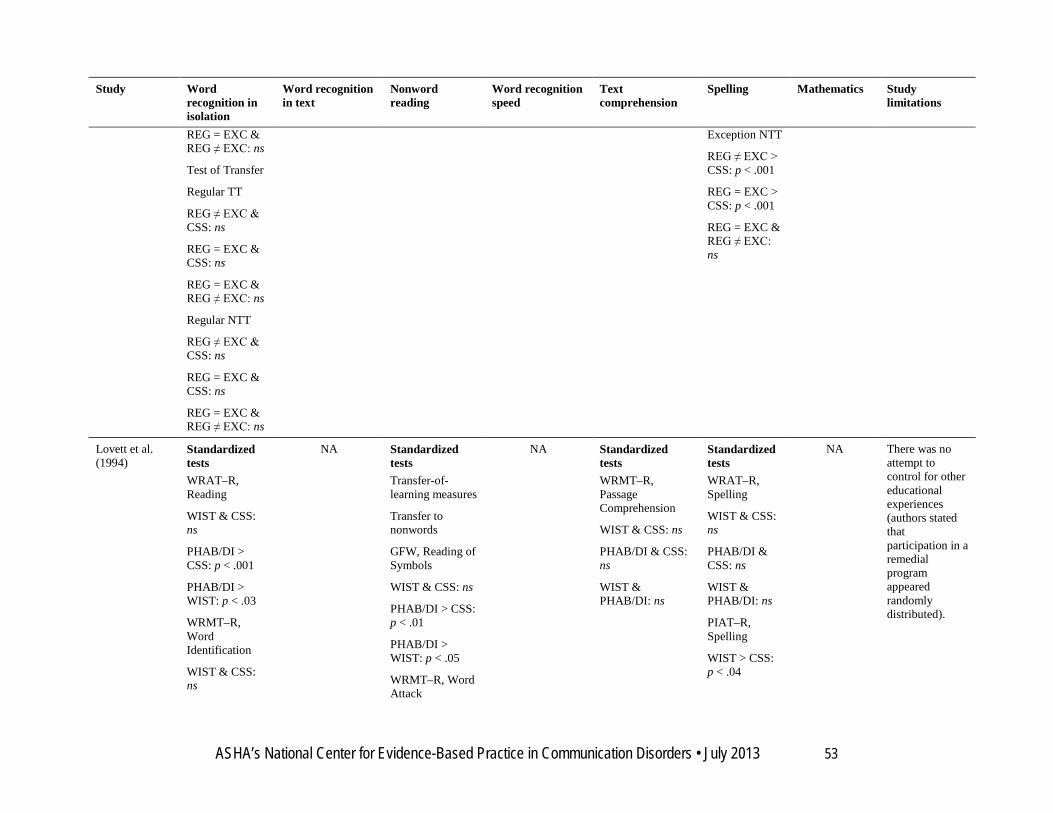


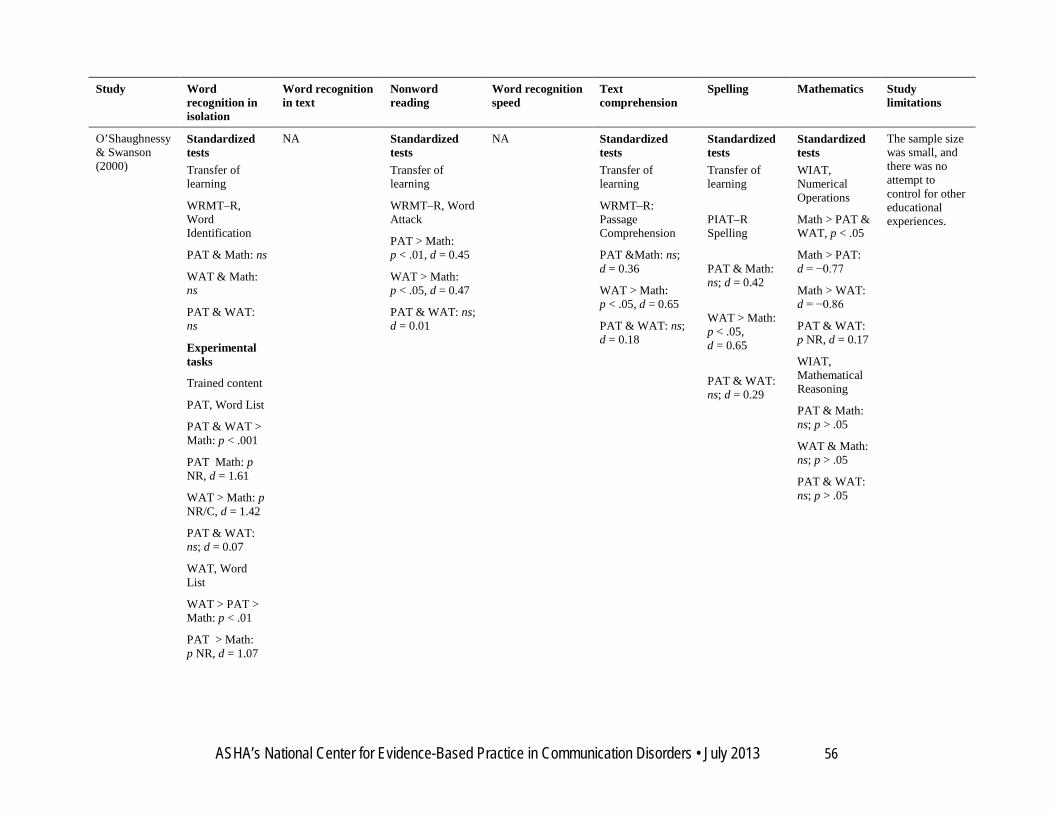
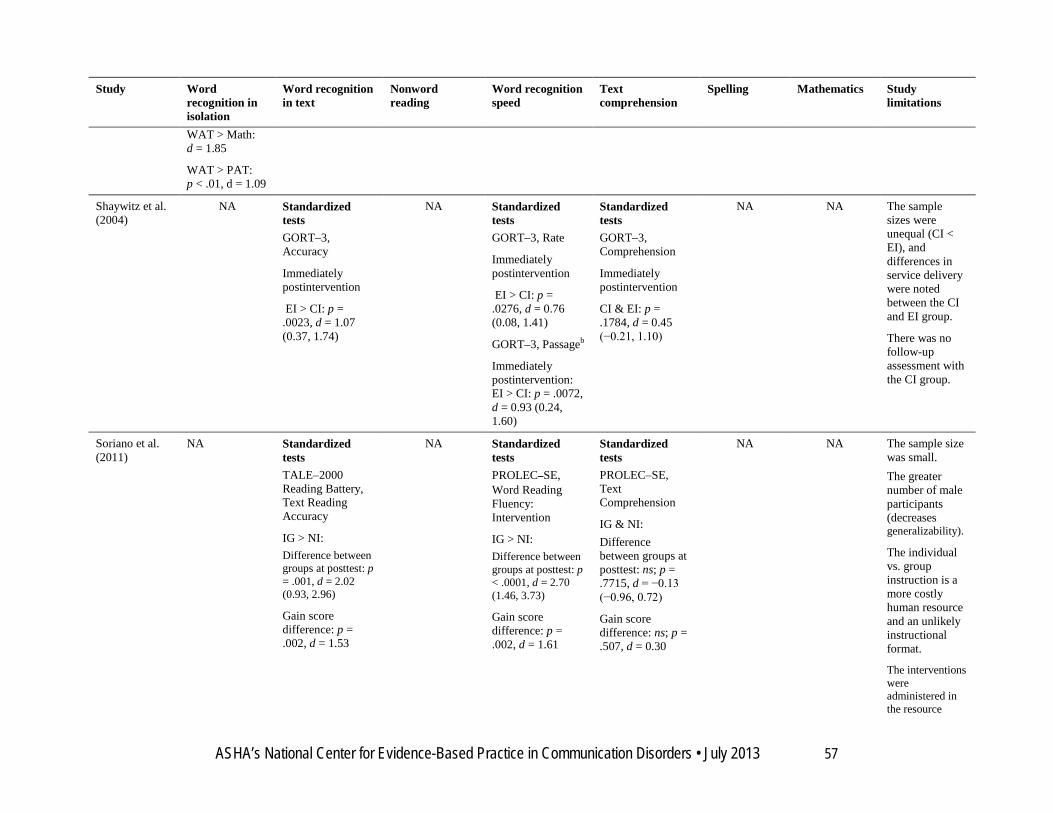


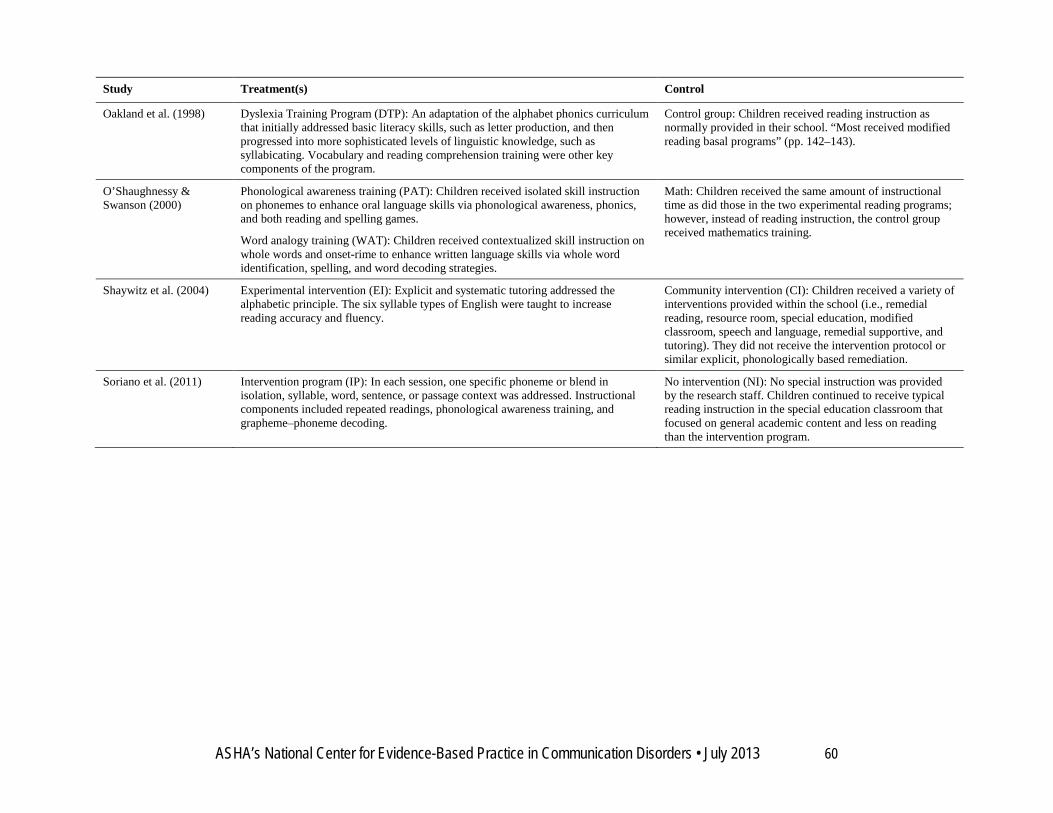
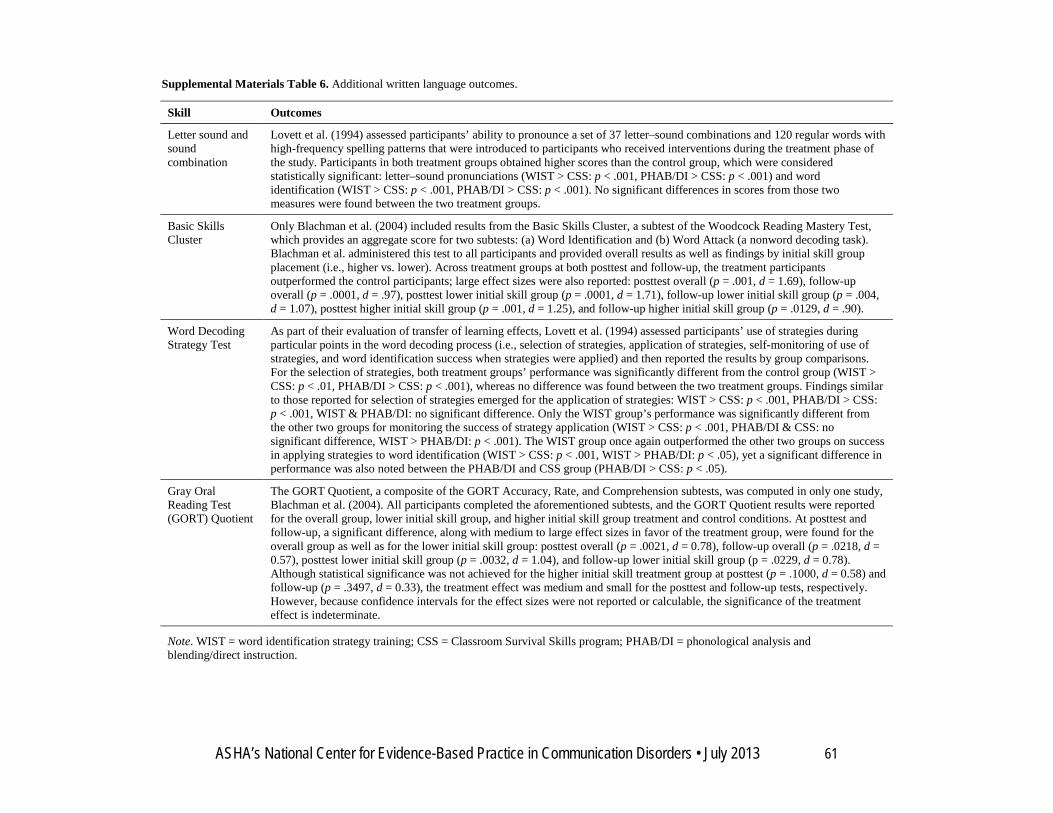
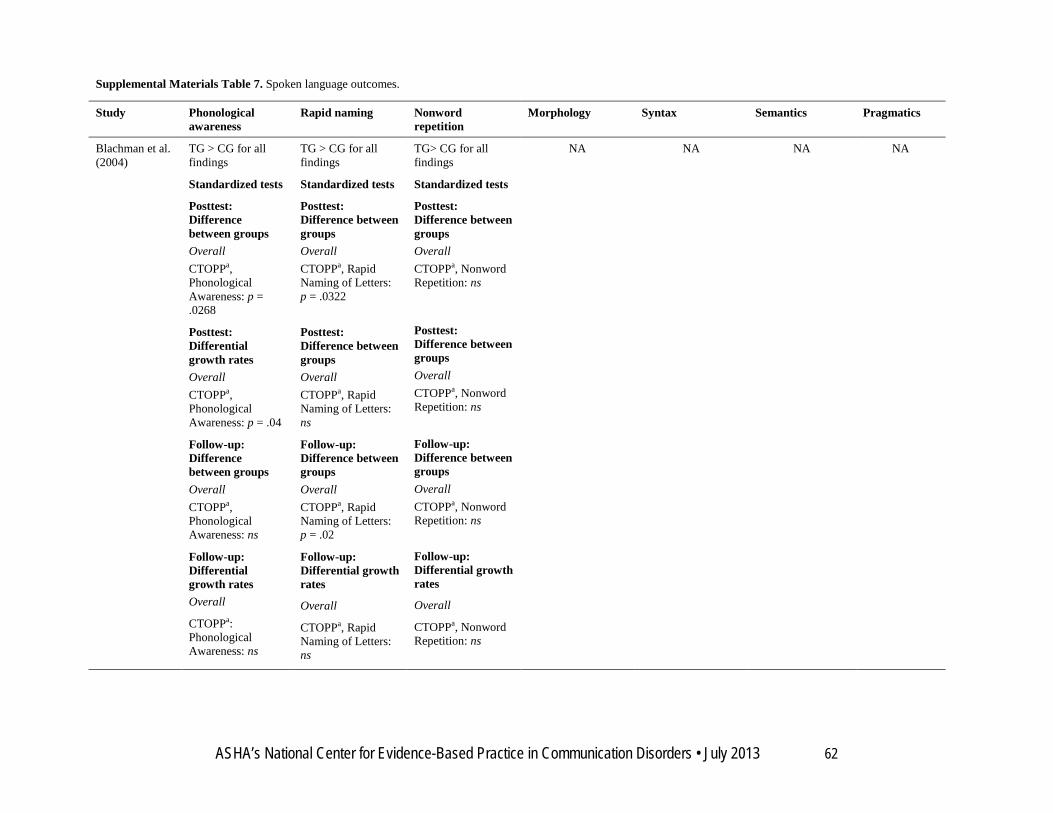
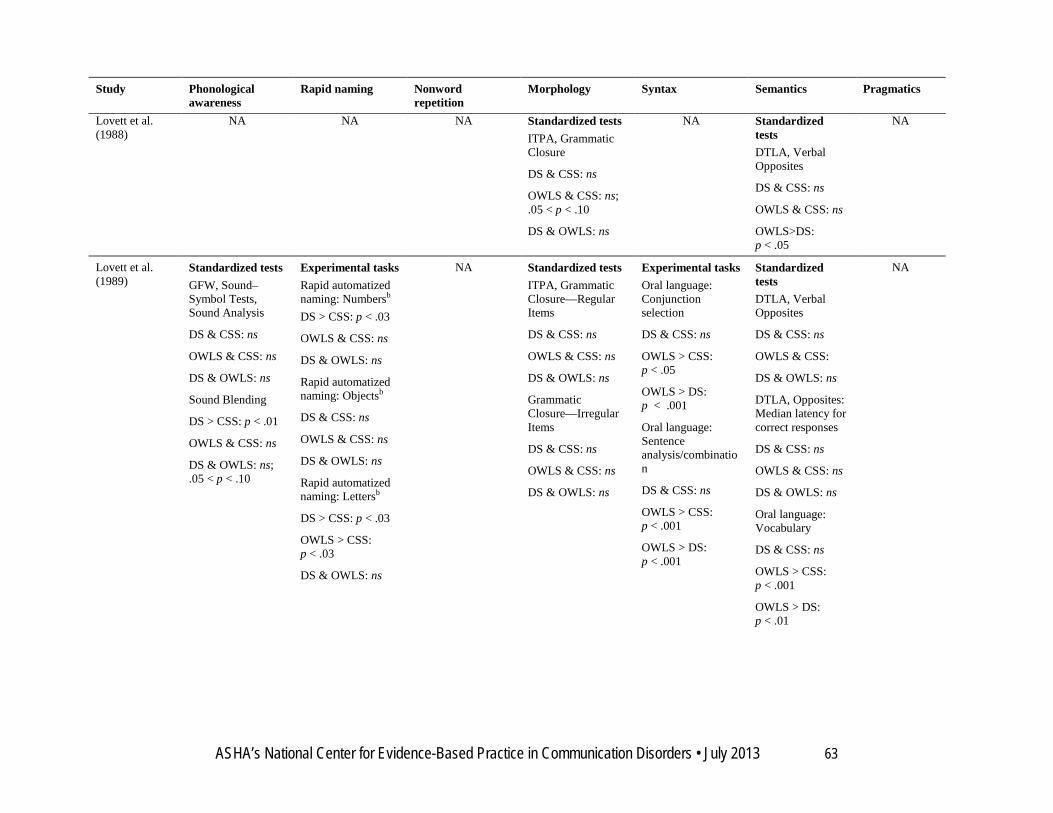


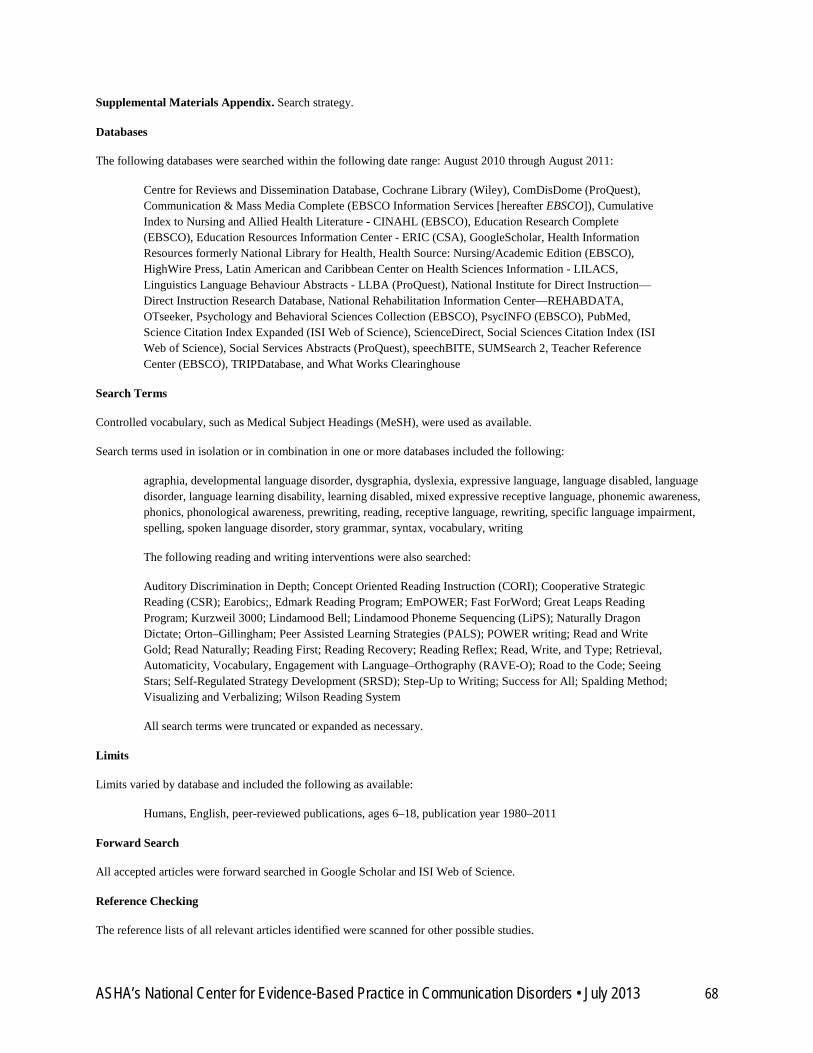


![Developmental Dynamics of Interrelation between Intelligence and Achievement Motivation … · achievement motivation intensity [17]. Test-questionnaire to measure achievement motivation](https://static.documents.pub/doc/80x56/603095df40015c76e9559c86/developmental-dynamics-of-interrelation-between-intelligence-and-achievement-motivation.jpg)


