Page 1
ISSN: 2349-5677
Volume 1, Issue 6, November 2014
71
Impact Of Macroeconomic Variables On Stock Market
Performance In India: An Empirical Analysis
Dr.Venkatraja.B
Assistant Professor-Economics
SDM Institute for Management Development, Mysore, India.
Email:[email protected]
Abstract
The study investigates the relationship between the Indian stock market performance (BSE
Sensex) and five macroeconomic variables, namely, index of industrial production, wholesale
price index, gold price, foreign institutional investment and real effective exchange rate over
the period April 2010- June 2014 using monthly data.Necessary data are collected from
secondary sources. The main objective of this paper is to study the impact of selected
macroeconomic fundamentals on the performance of BSE Sensex. Multiple regression
technique is employed for this purpose. To begin with the formal statistical investigation,
Durbin-Watson test is applied and no evidence of auto correlation between the independent
variables is foundand the data set is made available for further testing. The regression model
summary endorses a very strong combined influence of independent variables on the Sensex.
From the results, it appears that 82 per cent of variation in Sensex is explained by the five
selected macroeconomic factors. Wholesale price index, index of industrial production,
foreign institutional investment and real effective exchange rate have high degree of positive
influence on Sensex. It is also found that Sensex is inversely influenced by changes in gold
price. Further, of the five variables, the coefficients of all the variables except index of
industrial production are statistically significant. This leads to the conclusion that inflation,
inflow of foreign institutional investment, exchange rate and gold price significantly impact
the Indian stock market performance.
Key words: Macroeconomic variables, Sensex, Stock market
JEL Code Classification: G, E1, C10
Page 2
ISSN: 2349-5677
Volume 1, Issue 6, November 2014
72
1. Introduction
Stock markets play a vital role in the financial sector of every economy. An efficient capital
market drives the economic growth by stabilising the financial sector. In an efficient capital
market, stock prices adjust swiftly according to the new information available. The stock
prices reflect all information about the stocks and also the expectations of the future
performances of corporate houses. As a result, if stock prices reflect these assumptions in
real, then it should be used as a major indicator for the economic activities (Ray, 2102).
Hence the dynamic relationship between stock prices and macroeconomic variables contains
academic interest as well as policy implications.
With the waves of economic reforms since 1991 in Indian economy, Indian capital market
has undergone a series of radical changes. This resulted in remarkable improvement in Indian
stock market in terms of its size and depth. The process of development of domestic stock
market has been further accelerated owing to a voluminous inflow of foreign institutional
investment. However, unlike mature stock markets of advanced economies, the stock markets
of emerging economies like India are characterised as the most volatile stock markets.
Moreover, the stock markets of emerging economies including India are likely to be sensitive
to factors such as changes in the level of economic activities, changes in political and
international economic environment and also related to the changes in other macroeconomic
factors (Naik&Padhi, 2012). In this view an empirical question to be answered is does and at
what extent the Indian stock market responds to the changes in macroeconomic variables.
2. Review of Literature
In the past two decades, many researchers, financial analysts and practitioners have attempted
to predict the relationship between stock market movement and macroeconomic variables.
They have conducted empirical studies to examine the effect of stock price on
macroeconomic variables or vice-versa. This section of the paper has discussed some such
previous research works and their empirical conclusions that are related to our sector
analysis.
Chen et al. (1986) have examined equity returns relative to a set of macroeconomic variables
for developed countries and found that the set of macroeconomic variables which can
significantly explain stock returns includes growth in industrial production, changes in the
risk premium, twists in the yield curve, measures of unanticipated inflation and changes in
expected inflation during periods of volatile inflation. Later, Ratanapakorn and Sharma
(2007) have examined the relationship between the US stock price index and macroeconomic
variables using quarterly data for the period of 1975 to 1999. Employing Johansen’s co-
Page 3
ISSN: 2349-5677
Volume 1, Issue 6, November 2014
73
integration technique and vector error correction model (VECM) they found that the stock
prices positively relates to industrial production, inflation, money supply, short term interest
rate and also with the exchange rate, but, negatively related to long term interest rate. Their
causality analysis revealed that every macroeconomic variable considered caused the stock
price in the long run.
Many researches over the period of time have focused on the impact of macroeconomic
variables on stock price movements in developing economies. In their study, Muhammad and
Rasheed (2002) have examined the exchange rates and stock price relationships for Pakistan,
India, Bangladesh and Sri Lanka using monthly data from 1994 to 2000. The results show
that there is a bi-directional long-run causality between these variables for only Bangladesh
and Sri Lanka. No associations between exchange rates and stock prices are found for
Pakistan and India.
Wongbampo and Sharma (2002) explored the relationship between stock returns and five
macroeconomic variables such as GNP, inflation, money supply, interest rate, and exchange
rate in five Asian countries viz. Malaysia, Indonesia, Philippines, Singapore and Thailand.
Their study used monthly data for the period of 1985 to 1996, and it was found that, in the
long run stock price indices of all the five countries were positively related to growth in
output and negatively related to the aggregate price level. However, they found a negative
relationship between stock prices and interest rate for Philippines, Singapore and Thailand,
but positive relationship for Indonesia and Malaysia.
Maysami et al. (2004) also examined the relationship among the macroeconomic variables
and sector wise stock indices in Singapore using monthly data from January 1989 to
December 2001. They employed the Johansen co-integration and VECM approaches and
found a significant long-run equilibrium relationship between the Singapore stock market and
the macroeconomic variable tested.
Ahmed & Osman (2007) have investigated the long run equilibrium and short term dynamics
between DSE stock index and a set of macroeconomic variables like money supply, 91 day
T-bill rate, interest rate GDP and industrial production index. The cointegration test suggests
that there exist two co integrating vectors one is statistically significant. In the VECM test,
they found that the lagged stock index was adjusted to long run equilibrium by 43.82 percent
by the combined lagged influence of all the selected macroeconomic variables. Granger
causality test provides only one unidirectional causality from interest rate change to stock
market return.
Similarly, even Ali (2011) could not establish relationship between macroeconomic variables
and stock prices in Dhaka Stock Exchange (DSE). A Multivariate Regression Model has been
Page 4
ISSN: 2349-5677
Volume 1, Issue 6, November 2014
74
used to estimate the relationship. Regression results reveal that inflation and foreign
remittance have negative influence and industrial production index; market P/Es and monthly
percent average growth in market capitalization have positive influence on stock returns. No
unidirectional Granger Causality is found between stock prices and all the predictor variables
except one unidirectional causal relation from stock price and market P/Es. Finally, lack of
Granger causality between stock price and selected micro and macro variables ultimately
reveals the evidence of informationally inefficient market.
Robert (2008) has investigated the effect of two macroeconomic variables (exchange rate and
oil price) on stock market returns for four emerging BRIC economies, namely, Brazil, Russia,
India and China using monthly data from March 1999 to June 2006. Results affirmed that
there was no significant relationship between present and past market returns with
macroeconomic variables. Furthermore, no significant relationship was found between
respective exchange rate and oil price on the stock market index of the four countries studied.
Akbar et al. (2012) have studied the relationship between the Karachi stock exchange index
and macroeconomic variables for the period of January 1999 to June 2008. Employing a co-
integration and VECM, they found that there was a long-run equilibrium relationship exists
between the stock market index and the set of macroeconomic variables. Their results
indicated that stock prices were positively related with money supply and short-term interest
rates and negatively related with inflation and foreign exchange reserve.
Empirical studies are also conducted focussing towards the relationship between fundamental
macroeconomic factors and stock market performance in India. Studies of Bhattacharya and
Mukherjee (2002), Nath and Samantha (2002) found the causal relationship between stock
prices and macro-economic factors in India. They applied methodology of Toda and
Yamamoto for the period of 1992-1993 to 2000-2001. It was found that industrial production
affects significantly the stock prices. Similar results are obtained by Chakravarty (2005). In
this study positive relationship between industrial production and stock prices was examined
by using Granger causality test and observed uni-directionality from industrial production to
stock prices in India.
However, the findings of Chowhan et al. (2000) are contradicting the above specified results.
They have tried to fetch reasons for turbulence in stock market in the short run in India taking
into account SENSEX as the main index. As per the results of this paper, even long run
economic factors do not support such a spike in stock prices. Such a trend was noted not just
in Indian stock markets but word wide.
The results of Chowhan et al. (2000) Kumar (2008) are supported by the similar findings of
Sahu&Dhiman (2011). They have tried to explore the causal relationship between stock
Page 5
ISSN: 2349-5677
Volume 1, Issue 6, November 2014
75
market indicator and macroeconomic variables of India by using correlation and Ganger
causality regression techniques. Annual data was used from 1981 to 2006 for all the above
said variables to study the relationship. The findings of the study reveal that there is no
causal relationship between BSE Sensex and real GDP of India. The paper concluded with
the observation that BSE Sensex cannot yet be called as an indicator of India’s growth and
development.
Another study conducted by Sarkar (2005) has examined the relation between growth and
capital accumulation exists in case of India. They have used annual data on various variables
like nominal and real share price, share market turnover ratio, number of listed firms in the
stock market, fixed capital formation and growth of real GDP and industrial output. But
results show no positive relationship exists between real and stock market variables either in
short run or long run during 1950-51 to 2005.
However, the studies of Kanakaraj et al. (2008), Ahmed (2008), Singh (2010), Ray (2012),
Naik&Padhi (2012) and others have found significant relationship between economic
variables and stock returns. Kanakaraj et al. (2008) have tried empirically to explore upon
and answer that if the recent stock market boom can be explained in the terms of
macroeconomic fundamentals and have concluded by recommending a strong relationship
between the two. The study period covered between 1997 and 2007.
Ahmed (2008) employed the Johansen’s approach of co-integration and Toda – Yamamoto
Granger causality test to investigate the relationship between stock prices and the
macroeconomic variables using quarterly data for the period of March, 1995 to March 2007.
The results indicated that there was an existence of a long-run relationship between stock
price and FDI, money supply, & index of industrial production. Causality was found running
from stock price movement to movement in industrial production.
Singh (2010) in his research paper, attempted to explore the causal relation between the BSE
Sensex and three key macroeconomic variables of Indian economy by using correlation, unit
root stationarity tests and Granger causality test. Monthly data was used from April,1995 to
March, 2009 for all the variables, like, BSE Sensex, wholesale price index (WPI), index of
industrial production(IIP) and exchange rate(Rs/$). Results showed that IIP was having
bilateral causal relationship with BSE Sensex, while WPI was found to be related to stock
market unidirectional.
Pal and Mittal (2011) investigated the relationship between the Indian stock market and
macroeconomic variables using quarterly data for the period January 1995 to December 2008
with the Johansen’s co-integration framework. Their analysis revealed that there was a long-
run relationship exists between the stock market index and set of macroeconomic variables.
Page 6
ISSN: 2349-5677
Volume 1, Issue 6, November 2014
76
The results also showed that inflation and exchange rate have a significant impact on BSE
Sensex but interest rate and gross domestic saving (GDS) were insignificant.
Sharma &Mahendru (2010) analyse long term relationship between BSE and macroeconomic
variables, vis-à-vis, change in exchange rate, foreign exchange reserve, inflation rate and gold
price. The study period ranges between January 2008 and January 2009. The multiple
regression model was applied and the results reveal that exchange rate and gold prices highly
effect the stock prices, while FOREX and inflation have limited influence on stock prices.
Sabunwala (2012) attempts to unravel the relationship between the real economic variables
and the capital market in Indian context. The study considers the monthly data of several
economic variables like the national output, fiscal deficit, interest rate, inflation, exchange
rate, foreign institutional investment in Indian markets between 1994 and 2010, and tries to
reveal the relative influence of these variables on the sensitive index of the Bombay stock
exchange (BSE). Linear regression model was applied to identify the relationship between
BSE stock price movement and macro-economic variables. The finding shows that interest
rate, output, money supply, inflation rate and the exchange rate have considerable influence
in the stock market movement in the considered period, while fiscal deficit and foreign
institutional investment have very negligible impact on the stock market.
Ray (2012) explores the impact of different macroeconomic variables on the stock prices in
India using annual data from 1990-91 to 2010-11. A multiple regression model was used to
test the effects of macroeconomic variables on the stock prices and granger causality test is
conducted to examine whether there exist any causal linkage between stock prices and
macroeconomic variables. Results indicate that there is no causal association between stock
price and interest rate, stock price and index of industrial production, but unidirectional
causality exist between stock price and inflation, stock price and foreign direct investment,
stock price and gross domestic product, stock price and exchange rate, stock price and gross
fixed capital formation. However, bi-directional causality exist between stock price and
foreign exchange reserve, stock price and money supply, stock price and crude oil price and
stock price and whole price index. The multiple regression results of the study indicate that
oil price and gold price have a significant negative effect on stock price, while balance of
trade, interest rate, foreign exchange reserve, gross domestic product, industrial production
index and money supply positively influence Indian stock price. On the other hand, inflation
rate, foreign direct investment, exchange rate and wholesale price index do not appear to have
any significant effect on stock price.
Naik&Padhi (2012) have investigated the relationship between the Indian stock market index
(BSE Sensex) and five macroeconomic variables, namely, industrial production index,
wholesale price index, money supply, treasury bills rates and exchange rates over the period
Page 7
ISSN: 2349-5677
Volume 1, Issue 6, November 2014
77
April, 1994–June, 2011. Johansen’s co-integration and vector error correction model were
applied. The analysis reveals that macroeconomic variables and the stock market index are
co-integrated. It was observed that the stock prices positively relate to the money supply and
industrial production but negatively relate to inflation. The exchange rate and the short-term
interest rate were found to be insignificant in determining stock prices. In the Granger
causality test, a bidirectional causality between industrial production and stock prices and
unidirectional causality from money supply to stock price, stock price to inflation and interest
rates to stock prices were found.
Makan et al (2012) have tried to test the influence of macroeconomic variables on BSE stock
prices. The macroeconomic variables are represented by the IIP, CPI, call rate, exchange rate,
gold price, oil price and FII. Monthly data for the duration of April 2005 – March 2012 was
considered. The paper employed Granger causality test, regression analysis and correlation
analysis to examine such relationships. Based on the results it was concluded that three out of
seven variables were relatively more significant and likely to influence Indian stock market.
These factors were exchange rate, FII and call rate. There is a positive relation between FII
and Sensex, call rate and Sensex whereas exchange rate and Sensex shows a negative
relation. In granger causality test call rate was seen affecting BSE.
3. Research Gap
The brief review of the selected literature on the sector of the present analysis shows no
consensus on the impact of macroeconomic variables on stock market. It can be observed
from the review of literature that findings of different studies vary. Different findings in
different studies might be due to different methodologies applied, different set of variables
used for the study and different time periods considered for the study etc. Hence, the
relationship between fundamental macroeconomic variables and stock market movements
needs fresh enquiry.
4. Objectives
To investigate the impact of macroeconomic variables on Indian stock market
performance.
To study the direction and degree of relationship between selected macroeconomic
factors and stock returns.
5. Theoretical Framework
The theoretical linkage between the macroeconomic variables and the stock market
performance can be directly obtained from the Present Value Model (PVM) and the Arbitrage
Page 8
ISSN: 2349-5677
Volume 1, Issue 6, November 2014
78
Pricing Theory (APT). The Present Value Model focuses on the long run relationship
between the stock market movement and the macroeconomic fundamentals. According to
these models, any new information about the fundamental macroeconomic factors such as
real output, inflation, exchange rate, interest rate, foreign investment and so on may influence
the stock price/returns through the impact of expected dividends, the discount rate or both
(Chen et al, 1986, Naik&Padhi, 2012). A simple discount model shows that the fundamental
value of corporate stock equals the present value of expected future dividends. The future
dividends must ultimately reflect real economic activity. If all currently available information
is taken into account, there could be a close relationship between stock prices and expected
future economic activity. As pointed out by Ahmed (2008, quoted in Naik&Padi, 2012), these
relationships can be viewed in two alternative ways; (i) the stock market as the leading
indicator of economic activity or stock market leads economic activity; and (ii) the possible
impact the stock market has on the aggregate demand through the aggregate consumption and
investment suggesting stock market lags economic activity.
6. Research Methodology
6.1. Selection of Variables
Among the many macroeconomic variables, the study is focused on five major variables, viz.
the real economic output, foreign institutional investment, inflation, gold price and exchange
rate. The variables are selected based on their theoretical importance, performance measures
of the economy and also their uses and findings in the existing stock of empirical literature.
The level of real economic activity is regarded as the crucial determinant of stock market
returns. To measure the growth rate in real sector Index of Industrial Production (IIP) is used
as proxy. Theoretically it is said that increase in IIP increases the profit of industries and
corporations. Hence, dividend increases and it results in increase of share prices. Therefore, a
positive relationship is expected to between IIP and stock returns. The common perception is
that Foreign Institutional Investment (FII) is a driving force of Indian stock market. It has
been observed that Sensex increases when there are positive inflows of FII and decreases
when there are negative FII inflows. To test this common perception empirically, FII has
been included as another explanatory macroeconomic variable. Besides, inflation is another
factor which might influence the stock market. When inflation begins to move upward it is
likely that the RBI would resort to tight monetary policies which leads to increase in the
discount rate. Hence, the cost of borrowing increases which in turn leads to reduction in
investment in stock market. So, inflation is inversely related to equity prices. Inflation is
measured, in the present study, by changes in Wholesale Price Index (WPI). Stock market is
also sensitive to fluctuations in Gold Price (GP). Indian investors tend to invest less in stock
as the gold price rises, causing stock prices to fall. Therefore, theoretically, a negative
Page 9
ISSN: 2349-5677
Volume 1, Issue 6, November 2014
79
relationship is expected between gold price and stock price. Exchange rate is another
prominent variable which is predicted to generate positive impact on domestic stock price.
Depreciation of domestic currency against foreign currencies increases the return on foreign
currencies and induce investors to shift fund from Indian stock market to foreign currency
assets, causing a crash in the stock price and vice versa. The study employs the Real Effective
Exchange Rate (REER), which is the weighted average of Indian rupee relative to a basket of
36 other major currencies adjusted for the effects of inflation as foreign exchange rate.
Currently, there are two major stock exchanges in India; the Bombay Stock Exchange (BSE)
and the National Stock Exchange (NSE). The study has used BSE indices to represent the
Indian stock market. The monthly average of BSE Sensitive Index (Sensex) for the base year
of 1978-79 has been compiled and the average is based on daily BSE closing index.
As the present study tries to investigate the relationship between the stock price indices and
five macroeconomics variables, it considers the following model:
𝑋 = 𝑆𝐸𝑁𝑆𝐸𝑋, 𝐼𝐼𝑃,𝐹𝐼𝐼,𝑊𝑃𝐼,𝐺𝑃,𝑅𝐸𝐸𝑅 Where, SENSEX is the BSE sensitive index, IIP is the index of industrial production, WPI is
the wholesale price index, GP is the gold price and REER is the real effective exchange rate
and X is a 6×1 vector of variables.
6.2. Period of the Study and Source of Data
The study uses the monthly data for the period from April 2010 to June 2014 which involves
51 monthly observations. All the necessary data pertaining to the variables under study for
the sample period are obtained fromtheHandbook of Statistics on Indian Economy, published
by the Reserve Bank of India.
6.3. Tools Used for Analysis
To investigate the impact of selected macroeconomic fundamentals on BSE Sensex, the
multiple regression technique has been applied. The regression model for predicting the BSE
Sensex returns is:
Y = a + β1 X1 + β2X2+ β3X3+ β4X4+ β5X5
Where,
Y= BSE Sensex a= Intercept of Y which is constant
β1, β2, β3, β4andβ5=Beta coefficients ofX1, X2, X3, X4andX5respectively
X1 = Wholesale Price Index X2 = Index of
Industrial Production X3=Gold Price
Page 10
ISSN: 2349-5677
Volume 1, Issue 6, November 2014
80
X4 = Inflow of Foreign Institutional
Investment X5=Real Effective Exchange Rate
7. Hypotheses
The following hypotheses are developed for testing the relationship between Sensex and
macroeconomic variables in India.
H1: WPI has no significant impact on BSE Sensex H2: IIP has
no significant impact on BSE Sensex H3: GP
has no significant impact on BSE Sensex H4:
FII has no significant impact on BSE Sensex
H5: REER has no significant impact on BSE Sensex
8. Results and Discussion
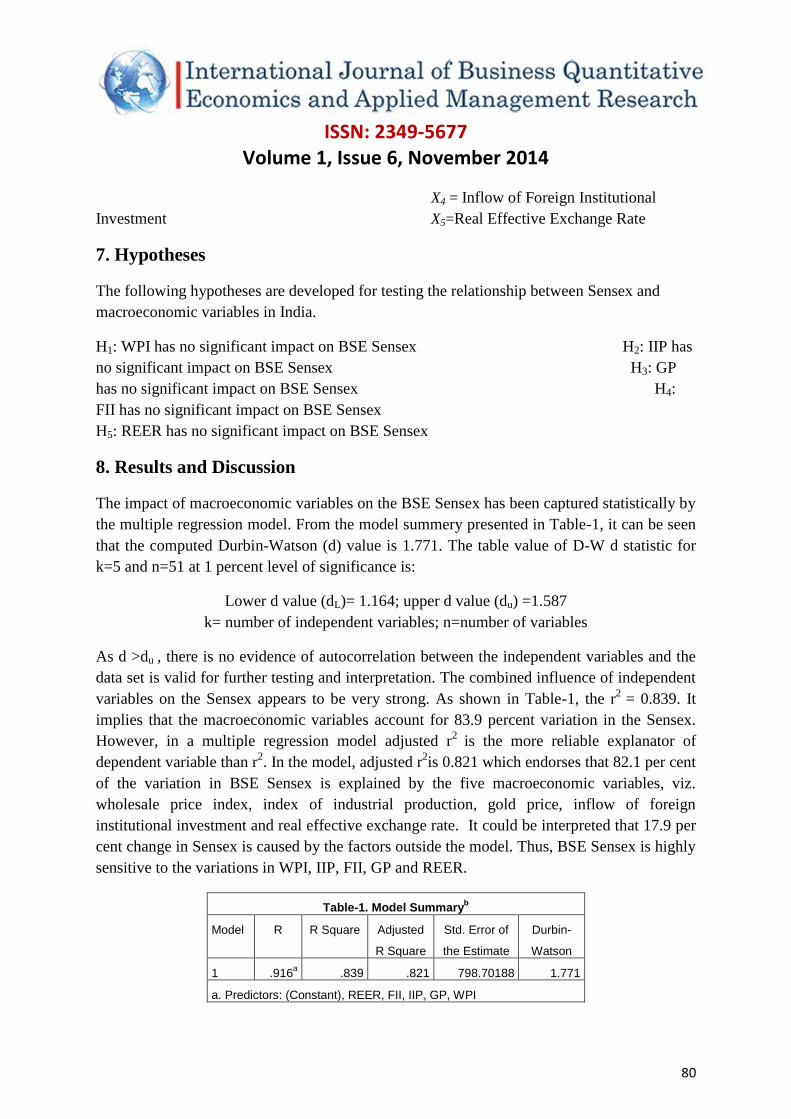
The impact of macroeconomic variables on the BSE Sensex has been captured statistically by
the multiple regression model. From the model summery presented in Table-1, it can be seen
that the computed Durbin-Watson (d) value is 1.771. The table value of D-W d statistic for
k=5 and n=51 at 1 percent level of significance is:
Lower d value (dL)= 1.164; upper d value (du) =1.587
k= number of independent variables; n=number of variables
As d >du , there is no evidence of autocorrelation between the independent variables and the
data set is valid for further testing and interpretation. The combined influence of independent
variables on the Sensex appears to be very strong. As shown in Table-1, the r2
= 0.839. It
implies that the macroeconomic variables account for 83.9 percent variation in the Sensex.
However, in a multiple regression model adjusted r2
is the more reliable explanator of
dependent variable than r2. In the model, adjusted r
2is 0.821 which endorses that 82.1 per cent
of the variation in BSE Sensex is explained by the five macroeconomic variables, viz.
wholesale price index, index of industrial production, gold price, inflow of foreign
institutional investment and real effective exchange rate. It could be interpreted that 17.9 per
cent change in Sensex is caused by the factors outside the model. Thus, BSE Sensex is highly
sensitive to the variations in WPI, IIP, FII, GP and REER.
Table-1. Model Summaryb
Model R R Square Adjusted
R Square
Std. Error of
the Estimate
Durbin-
Watson
1 .916a .839 .821 798.70188 1.771
a. Predictors: (Constant), REER, FII, IIP, GP, WPI
Page 11
ISSN: 2349-5677
Volume 1, Issue 6, November 2014
81
b. Dependent Variable: Sensex
Table-2. ANOVAa
Model Sum of Squares df Mean Square F Sig.
1
Regression 149681175.828 5 29936235.166 46.928 .000b
Residual 28706611.143 45 637924.692
Total 178387786.971 50
a. Dependent Variable: Sensex
b. Predictors: (Constant), REER, FII, IIP, GP, WPI
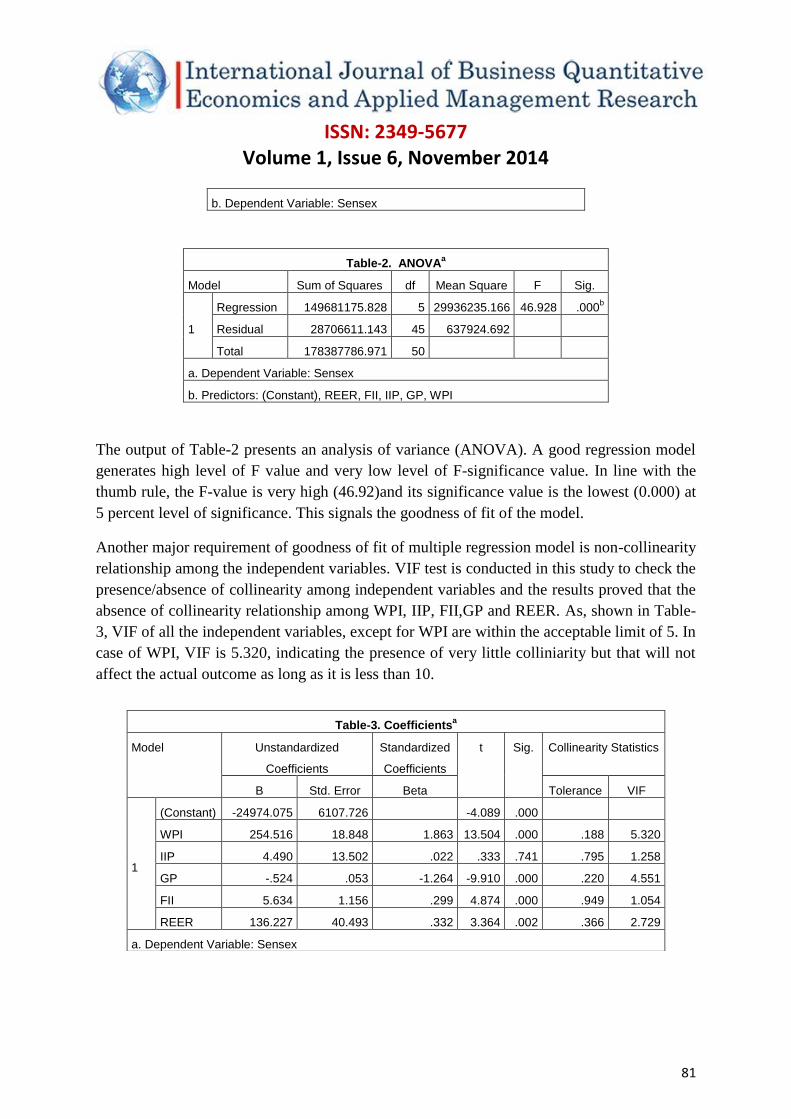
The output of Table-2 presents an analysis of variance (ANOVA). A good regression model
generates high level of F value and very low level of F-significance value. In line with the
thumb rule, the F-value is very high (46.92)and its significance value is the lowest (0.000) at
5 percent level of significance. This signals the goodness of fit of the model.
Another major requirement of goodness of fit of multiple regression model is non-collinearity
relationship among the independent variables. VIF test is conducted in this study to check the
presence/absence of collinearity among independent variables and the results proved that the
absence of collinearity relationship among WPI, IIP, FII,GP and REER. As, shown in Table-
3, VIF of all the independent variables, except for WPI are within the acceptable limit of 5. In
case of WPI, VIF is 5.320, indicating the presence of very little colliniarity but that will not
affect the actual outcome as long as it is less than 10.
Table-3. Coefficientsa
Model Unstandardized
Coefficients
Standardized
Coefficients
t Sig. Collinearity Statistics
B Std. Error Beta Tolerance VIF
1
(Constant) -24974.075 6107.726 -4.089 .000
WPI 254.516 18.848 1.863 13.504 .000 .188 5.320
IIP 4.490 13.502 .022 .333 .741 .795 1.258
GP -.524 .053 -1.264 -9.910 .000 .220 4.551
FII 5.634 1.156 .299 4.874 .000 .949 1.054
REER 136.227 40.493 .332 3.364 .002 .366 2.729
a. Dependent Variable: Sensex
Page 12
ISSN: 2349-5677
Volume 1, Issue 6, November 2014
82
The estimated regression coefficients for predicting the BSE Sensex can be derived from
Table-3 and is presented in a regression model as follows:
Sensex = (254.516)WPI + (4.490)IIP + (-0.524)GP + (5.634)FII + (136.227)REER- 24974.075
These coefficients indicate the direction of relationship between independent and dependent
variables. These coefficients also tell us to what degree each predictor affects the outcome
when the effects of all other predictors are held constant. The signs of coefficients of all the
independent variables except WPI are as per theoretical predictions. Among the five
independent macroeconomic variables WPI and REER appears to have very high influence
on BSE Sensex. As the WPI increases by 1 unit, the Sensex increases by 254.5 units. This
positive relationship appears to be unusual. The impact of change in REER is positive on
BSE Sensex. If REER changes by 1 unit, Sensex changes by 136.2 units in the same
direction. India being import dominant country, appreciation of rupee against foreign
currencies reduces the import bill which in turn causes higher cash flows, more profit and
better stock price of the domestic firms.
Even IIP and FII have positive impact on Sensex. If the index of industrial production
increases by 1 unit, Sensex increases by 4.49 units, provided effect of other predictors is held
constant. This implies the theoretical belief that increase in industrial production index
increases the corporate earnings which enhance the value of the firms and hence the stock
prices increase. It is also observed from the results that Sensex increases by 5.634 units for 1
unit increase in the inflow of FII. A positively high degree of coefficient of FII complements
the theoretical underlining which says that increasing inflow of foreign institutional
investment would drive the stock market positively, while, their withdrawal from stock
market would negatively affect the stock returns.
Unlike other predictors, gold price is found influencing Sensex negatively. As the gold price
increases by 1 unit, the Sensex decreases by 0.524 units or vice versa. This implies that as the
gold price rises, Indian investors tend to invest less in stocks, causing stock prices to fall and
vice versa.
9. Testing of Hypotheses
The value of t-statistic for coefficient of different variables of this model can be seen from
Table-3. From the results, it appears that significance values of t-statistic of coefficient of
WPI,GP,FII and REER are less than 0.01. This implies that WPI, GP, FII and REER have
significant impact on BSE Sensex at 1 per cent level of significance. This leads to the
rejection of the null hypotheses H1, H3, H4 and H5 - which say that WPI, GP, FII and REER
do not have significant impact on Sensex. However, IIP does not have significant
Page 13
ISSN: 2349-5677
Volume 1, Issue 6, November 2014
83
contribution to Sensex either at 1 percent or 5 percent level of significance. Hence, the null
hypothesis H2-IIP does not have significant impact on Sensex is accepted.
10. Conclusion
The aim of this paper is to study the impact of macroeconomic variables on Indian stock
market. From the study it appears that the combined influence of WPI, IIP, FII, GP and
REER on BSE Sensex is very strong. It is also noted that any variation in the value of
WPI,IIP,FII and REER has strong positive influence on the BSE stock market performance.
While, an increase in gold price is found causing crash in stock market and vice versa.
Further, of the five variables, the coefficients of all the variables except IIP are statistically
significant. This leads to the conclusion that inflation, inflow of foreign institutional
investment, exchange rate and gold price impact the Indian stock market performance
significantly.
References
1. Ahmed, S. (2008), Aggregate Economic Variables and Stock Market in India,
International Research Journal of Finance and Economics, Vol.14, pp. 14-64.
2. Ahmed. M. N. and Imam M. Osman, (2007), Macroeconomic Factors and Bangladesh
Stock Market, International Review of Business Research Paper, vol.3 (5), pp.21-35.
3. Akbar, M., Ali, S., and Khan, M. F. (2012), The Relationship of Stock Prices and
Macroeconomic Variables revisited: Evidence from Karachi Stock Exchange, African
Journal of Business Management, Vol. 6 (4), pp.1315-1322.
4. Ali M.B., (2011) Impact of Micro and Macroeconomic Variables on Emerging Stock
Return: A Case on Dhaka Stock Exchange (DSE), Interdisciplinary Journal of
Research in Business, vol.1(5),pp. 8-16.
5. Bhattacharya B and Mukherjee J. (2002), Causal relationship between stock market
and exchange rate, foreign exchange reserves and value of trade balance: A case study
for India, www.igidr.ac.in.
6. Charkravarty S (2005), Stock market and macroeconomic behaviour in India, Institute
of Economic Growth, Delhi.
7. Chen, Nai-Fu, Roll, Richard and Ross, A. Stephen (1986), Economic Forces and the
Stock Market, Journal of Business, vol.59 (3), pp. 383-403.
8. Chowan. P.K., et al. (2000), Volatility in Indian Stock Markets, Xavier Institute of
Managemnt.
9. Dickey, D.A and W.A.Fuller (1979), Distribution of estimators of Autoregressive
Time series with a Unit Root, Journal of the American Statistical Association, vol.74,
pp.427-31.
Page 14
ISSN: 2349-5677
Volume 1, Issue 6, November 2014
84
10. Granger C.W.J. (1969), Investigating causal relations by econometric models and
cross spectral methods, Econometrica ,Vol.37.
11. Granger, C., W., J. (1988) Some recent developments in the concept of causality,
Journal of Econometrics, Vol.39, No.1, pp.199-211 retrieved from:
http://dx.doi.org/10.1017/ CCOL052179207X.002.
12. Gujrati, N.Damodar&Sangeetha (2007) Basic Econometrics, Tata McGraw-Hill
Publishing Company Limited, New Delhi, 4th ed.
13. Johansen, S. (1991), Estimation and Hypothesis testing of Cointegration Vector in
Gaussian Vector Autoregressive Models, Econometrica, Vol. 59, pp. 1551-1581.
14. Johansen, S. and Juselius, K. (1990), Maximum Likelihood Estimation and inference
on Cointegration with application to the Demand for Money, Oxford Bulletin of
Economics and Statistics, Vol. 52 (2), pp.169-210.
15. Kanakaraj, A., Singh, B.K. and Alex, D. (2008), Stock Prices, Micro Reasons and
Macro Economy in India: What do data say between 1997-2007. Fox Working Paper
3. Pp. 1-17.
16. Makan,Chandni and Ahuja, AvneetKaur and Chauhan, Saakshi (2012), A Study of the
Effect of Macroeconomic Variables on Stock Market: Indian Perspective, Online at
http://mpra.ub.uni-muenchen.de/43313/, MPRA Paper No. 43313, posted 18.
December 2012 13:11 UTCManagement.
17. Maysami, R.C., Howe, L.C. and Hamaz, M.A. (2004), Relationship between
Macroeconomic Variables and Stock Market Indices: Cointegration Evidence from
Stock Exchange of Singapore’s All-S Sector Indices, Journal Penguruson, Vol.24,
pp. 47-77.
18. Muhammad, Naeem and Rasheed, Abdul, (2002), Stock Prices and Exchange Rates:
Are They Related? Evidence from South Asian Countries. The Pakistan Development
Review, Vol. 41(4), pp.535-550.
19. Naik, Pramod Kumar and Padhi, Puja (2012), The Impact of Macroeconomic
Fundamentals on Stock Prices Revisited: Evidence from Indian Data, Eurasian
Journal of Business and Economics, Vol.5 (10), pp.25-44.
20. Nath, G. C., Samantha, G. P. (2002), Dynamic Relation between Exchange Rate and
Stock Prices: a Case for India, available at:
http://www.nseindia.com/content/press/feb2003c.pdf (12.06.2010).
21. Pal, K. and Mittal, R. (2011), Impact of Macroeconomic Indicators on Indian Capital
Markets, Journal of Risk Finance, Vol. 12 (2), pp. 84-97.
22. Ratanapakorn, O. and Sharma, S. C. (2007), Dynamic analysis between the US stock
returns and the macroeconomic variables, Applied Financial Economics, vol.17 (5),
pp.369-377.
Page 15
ISSN: 2349-5677
Volume 1, Issue 6, November 2014
85
23. Ray, Sarbapriya (2012), Testing Granger Causal Relationship between
Macroeconomic Variables and Stock Price Behaviour: Evidence from India,
Advances in Applied Economics and Finance, Vol. 3 (1), pp. 470-481.
24. Reserve Bank of India (2014) Handbook of Statistics on Indian Economy, Retrieved
from:
http://www.rbi.org.in/scripts/AnnualPublications.aspx?head=Handbook%20of%20Sta
tistics%20on%20Indian%20Economy
25. Robert, D.G. (2008), Effect of Macroeconomic Variables on Stock Market Returns
for four Emerging Economies: Brazil, Russia, India and China, International
Business & Economics Research Journal, Vol.7 (3), pp. 1-8.
26. Sabunwala, ZoraZabeen (2012) A Study of the Impact of macroeconomic Variables
on Stock Price Movements, International Journal of Research in Commerce,
Economics and Management, Vol.2, No.6 pp107-111.
27. Sahu, Naresh Chandra &Dhiman, H. Deepinder (2011), Correlation and Causality
between Stock Market and Macro Economic Variables in India: An Empirical Study,
2010 International Conference on E-business, Management and Economics, IPEDR
vol.3 (2011), IACSIT Press, Hong Kong.
28. Sarkar, P. (2005), Stock Market, Capital Accumulation and Growth in India since
1950, SSRN.
29. Sharma, Gagan Deep &Mahendru, Mandeep (2010) Impact of Macroeconomic
Variables on Stock Prices in India, Global Journal of Management and Business
Research, Vol.10, No,7, pp.19-26.
30. Singh, Dharmendra (2010), Causal Relationship Between Macro-Economic Variables
and Stock Market: A Case Study for India, Pakistan Journal of Social Sciences, Vol.
3(2), pp. 263-274.
31. Wongbampo, P. and Sharma, S.C. (2002), Stock Market and Macroeconomic
Fundamental Dynamic Interactions: ASEAN-5 Countries, Journal of Asian
Economics, Vol. 13, pp. 27-51.