electronics Article Impact of Meteorological Attenuation on Channel Characterization at 300 GHz Zhengrong Lai 1 , Haofan Yi 2,3, * , Ke Guan 2,3, * , Bo Ai 2,3 , Wuning Zhong 1 , Jianwu Dou 4 , Yi Zeng 1 and Zhangdui Zhong 2,3 1 Guangdong Communications & Networks Institute, Guangzhou 510670, China; [email protected] (Z.L.); [email protected] (W.Z.); [email protected] (Y.Z.) 2 State Key Laboratory of Rail Traffic Control and Safety, Beijing Jiaotong University, Beijing 100044, China; [email protected] (B.A.); [email protected] (Z.Z.) 3 Beijing Engineering Research Center of High-speed Railway Broadband Mobile Communications, Beijing 100044, China 4 Wireless Algorithm Department, Product R&D System, ZTE Corporation, Shenzhen 518055, China; [email protected]* Correspondence: [email protected] (H.Y.); [email protected] (K.G.) Received: 24 May 2020; Accepted: 6 July 2020; Published: 9 July 2020 Abstract: Terahertz (THz) communication is a key candidate for the upcoming age of beyond-fifth- generation mobile networks (B5G) or sixth-generation mobile networks (6G) in the next decade and can achieve ultra-high data rates of dozens of gigabits or even terabits per second. As the carrier frequency increases from radio frequency (RF) to the THz band, the impact of meteorological factors on the wireless link is expected to become more pronounced. In this work, we first provide an overview of the attenuation caused by atmospheric gases, fog, and rain on terrestrial THz wireless communications using the recommendations of the International Telecommunication Union-Radiocommunication (ITU-R). Measured data from the literature are used to predict the attenuation caused by snow. Because unfavorable weather conditions may harm sensitive measurement equipment, ray-tracing (RT) simulations are sometimes used as an alternative to extend sparse empirical data. In this study, the terrestrial channel in an urban scenario at 300 GHz, with a bandwidth of 8 GHz, is characterized using RT simulations under different meteorological factors. The key performance parameters are explored, including path loss (PL), Rician K-factor (KF), root-mean-square (RMS) delay spread (DS), and four angular spreads. The channel characteristics under different meteorological conditions studied in this work are expected to aid the design of future outdoor terrestrial THz communications. Keywords: channel characterization; meteorological attenuation; meteorological factors; ray-tracing; terrestrial channel; terahertz communications; wave propagation 1. Introduction In recent years, data traffic has exploded with the accelerated development of multimedia services. Future communication systems need to meet the demands of ultra-high-speed access in various complex environments. As terahertz (THz) communications can achieve high data rates of dozens of gigabits or even terabits per second without any efficiency enhancement techniques, it is considered one of the leading candidates for the upcoming age of beyond-fifth-generation mobile networks (B5G) or sixth-generation mobile networks (6G) in the next decade. The deployment scenarios for THz communications are considerably diverse, including wireless personal area networks (WPANs) [1], wireless local area networks (WLANs), kiosk downloading [2], chip-to-chip communications [3], wireless fronthaul/backhaul, and vehicular communications [4]. Electronics 2020, 9, 1115; doi:10.3390/electronics9071115 www.mdpi.com/journal/electronics
Transcript
electronics
Article
Impact of Meteorological Attenuation on ChannelCharacterization at 300 GHz
Zhengrong Lai 1, Haofan Yi 2,3,* , Ke Guan 2,3,* , Bo Ai 2,3 , Wuning Zhong 1,Jianwu Dou 4 , Yi Zeng 1 and Zhangdui Zhong 2,3
Received: 24 May 2020; Accepted: 6 July 2020; Published: 9 July 2020�����������������
Abstract: Terahertz (THz) communication is a key candidate for the upcoming age of beyond-fifth-generation mobile networks (B5G) or sixth-generation mobile networks (6G) in the next decadeand can achieve ultra-high data rates of dozens of gigabits or even terabits per second. As thecarrier frequency increases from radio frequency (RF) to the THz band, the impact of meteorologicalfactors on the wireless link is expected to become more pronounced. In this work, we first providean overview of the attenuation caused by atmospheric gases, fog, and rain on terrestrial THzwireless communications using the recommendations of the International TelecommunicationUnion-Radiocommunication (ITU-R). Measured data from the literature are used to predictthe attenuation caused by snow. Because unfavorable weather conditions may harm sensitivemeasurement equipment, ray-tracing (RT) simulations are sometimes used as an alternative toextend sparse empirical data. In this study, the terrestrial channel in an urban scenario at 300 GHz,with a bandwidth of 8 GHz, is characterized using RT simulations under different meteorologicalfactors. The key performance parameters are explored, including path loss (PL), Rician K-factor (KF),root-mean-square (RMS) delay spread (DS), and four angular spreads. The channel characteristicsunder different meteorological conditions studied in this work are expected to aid the design offuture outdoor terrestrial THz communications.
In recent years, data traffic has exploded with the accelerated development of multimedia services.Future communication systems need to meet the demands of ultra-high-speed access in variouscomplex environments. As terahertz (THz) communications can achieve high data rates of dozens ofgigabits or even terabits per second without any efficiency enhancement techniques, it is consideredone of the leading candidates for the upcoming age of beyond-fifth-generation mobile networks (B5G)or sixth-generation mobile networks (6G) in the next decade. The deployment scenarios for THzcommunications are considerably diverse, including wireless personal area networks (WPANs) [1],wireless local area networks (WLANs), kiosk downloading [2], chip-to-chip communications [3],wireless fronthaul/backhaul, and vehicular communications [4].
From a technological point of view, the implementation of THz communication systems still posesa series of challenges, such as transceiver systems and ultra-high-gain antennas. Emerging hardwaretechnologies have been formulated to address the challenges of THz communications; in particular,very dense ultra-massive multiple-input multiple-output (UM-MIMO) antenna arrays [5] havebeen proposed to provide extremely high directive gain to solve the high path loss (PL) problem.The reconfigurable intelligent surfaces (RISs) proposed in [6] deploy reflector units to achievenon-line-of-sight (NLOS) connections with relatively low losses. Moreover, in [7,8], the authorsconducted surveys on the extensive hardware problems. Aside from these hardware issues, as thecarrier frequency increases from the radio frequency (RF) range to millimeter waves (mmWave) to theTHz band, the impacts of meteorological factors on the wireless links are expected to become morepronounced. Typically, atmospheric gases, fog, rain, and snow are the main factors of interest.
When electromagnetic (EM) waves pass through the atmosphere, the absorption of wave energyby atmospheric molecules causes attenuation. Water vapor and oxygen molecules are notably the maincontributors to atmospheric attenuation by gases. The authors of [9] used a Fourier transform infrared(FTIR) spectrometer to measure the atmospheric amplitude transmission spectrum for horizontalbeam propagation in the range of 150–510 GHz. In response to the need of the communicationsfield to model the attenuation due to atmospheric gases, the International TelecommunicationUnion-Radiocommunication (ITU-R) provided an accurate methodology to calculate the atmosphericattenuation in the frequency range from 1 GHz to 1000 GHz in the standard ITU-R P.676-11 [10].
The attenuation caused by fog largely depends on the density of the liquid water within thefog through which the EM wave propagates. In contrast to the large optical power loss in infrared(IR) communication, the attenuation levels due to fog for THz waves are typically much lower.As recommended by the ITU-R P.840-7 [11], the Rayleigh approximation is a valid method to describethe specific attenuation due to fog.
Although the specific attenuation caused by rain can be ignored at the sub-6-GHz frequency band,it must be considered at higher frequencies, where its importance increases rapidly. Mie scatteringoccurs when the scatterer’s size is nearly equal to that of the wavelength of the incident rays.As raindrop particle sizes and THz wavelengths are of similar scales, studying the effects of rainfall onTHz band communications is considered significant. The impacts of rainfall on EM wave propagationhave been widely studied for the infrared, microwave, and mmWave bands [12]. Studies haveconcluded that rainfall can cause attenuation of the received power and even interrupt the wirelessconnection in serious cases. In [13], the authors concluded that attenuation due to rain increases withincreasing rainfall intensity, whereas the temperature had little effect on such attenuation. In the THzrange, Ishii [14] calculated the attenuations due to rain at 313 GHz and 355 GHz using four raindropsize distributions. They are the Marshall–Palmer, Best, Polyakova–Shifrin, Weibull raindrop-sizedistributions, and with a specific attenuation model using the prediction method recommended bythe ITU-R P.838-3 [15]; it was shown that these propagation experiment results were in line with thespecific attenuation prediction model of the ITU-R.
Snowflakes are known to have various shapes and surface configurations, and the typicalstructures are columnar, needle-like, and dendritic crystals. Snowflakes are mainly composed ofair, liquid water, and ice. Since the size of a snowflake is comparable to wavelengths in the THz band,such as 100 GHz with a wavelength of 3 mm, the influence of snow on attenuation is expected to bemore significant. In [16], the measurement results implied that wet snow might cause three timesgreater attenuation compared to rainfall at the same rate. In [17], the authors divided snow into wetand dry snowfall; their measured data indicated that wet snowfall might cause greater attenuationcompared to dry snowfall. However, until now, there are too few reported experimental works on theinfluence of snow on attenuation to model these effects at THz frequencies.
However, a few experimental studies have been reported in the THz frequency range, particularlyfor terrestrial measurements under different unfavorable weather conditions that may harm thesensitive measurement equipment. Therefore, in order to extend the channel measurements to more
Electronics 2020, 9, 1115 3 of 17
general cases, the ray-tracing (RT) simulator is employed as an alternative to extend the sparseempirical data. With the help of the measurement-calibrated RT simulator, the wireless channelcan be characterized and analyzed for different meteorological conditions. As the impact of suchmeteorological criteria on wave propagation is undoubtedly a factor limiting the availability of wirelesslinks, we intend to systematically and quantitatively discuss the influence of different meteorologicalfactors on outdoor terrestrial wireless channel communications.
In this work, we investigated the fundamental impacts of several meteorological factors on THzpropagation, and the following contributions are made:
• We provide an overview of the prediction methods for attenuations caused by differentmeteorological factors on THz communications, including atmospheric gases, fog, rain, and snow.
• We reconstruct a typical urban scenario and conduct simulations using the measurement-validatedRT simulator at 300 GHz for a bandwidth of 8 GHz. The transmitter (Tx) is fixed to a traffic light ata height of 5 m. The receiver (Rx) is placed on a moving bus. Since the above-mentionedmeteorological factors have considerable influence on the THz wireless channel, we addattenuations caused by atmospheric gases, fog, rain, and snow to each ray simulated in theurban scenario.
• Based on extensive simulation results, the terrestrial channel in the urban scenario is characterizedin terms of PL, shadow fading (SF), Rician K-factor (KF), root-mean-square (RMS) delay spread,and four angular spreads (azimuth angular spread of arrival (ASA), azimuth angular spreadof departure (ASD), elevation angular spread of arrival (ESA), and elevation angular spread ofdeparture (ESD)). These parameters are expected to provide the fundamental data for designingTHz communication systems in similar scenarios under different meteorological situations.
The remainder of this paper is organized as follows. In Section 2, we provide a brief summary ofthe prediction methods for meteorological attenuations, including those by atmospheric gases, rain,fog, and snow. In addition, the processing steps to add the corresponding attenuations to a widebandchannel with multi-frequency points are furnished. Section 3 introduces the simulation scenarios andsimulation configurations. In Section 4, all the channel parameters are characterized for the variousmeteorological factors. Finally, the conclusions and future work are presented in Section 5.
2. Attenuation Due to Different Meteorological Factors
In this section, we present the prediction methods suggested by ITU-R and the representativemeasurements for attenuations caused by atmospheric gases, fog, rain, and snow. Thereafter,since the RT simulator calculates the propagation loss from the classic propagation mechanisms,including line-of-sight (LOS), reflection, diffraction, penetration, and scattering, we provide theprocessing steps to add the attenuations caused by these meteorological factors for the RTsimulation results.
2.1. Attenuation Due to Atmospheric Gases
The oxygen molecule has a magnetic dipole moment, and the water molecule has a residualelectric dipole moment. Under the action of an electromagnetic field, when the frequency of theincident electromagnetic wave is similar to that of the molecular rotational energy level, the moleculeabsorbs the energy of the electromagnetic wave, and its rotational energy level transits from low tohigh via resonance absorption. As the reflected or scattered rays travel farther than the direct ray,they will suffer more attenuation. Thus, the specific attenuation due to atmospheric gases for a traveldistance of d (km) for each ray can be calculated as follows:
AttGases = γGasesd (dB) (1)
Electronics 2020, 9, 1115 4 of 17
The specific attenuation γGases (dB/km) can be obtained from the ITU-R P.676-11recommendation [10]. Figure 1 shows the specific atmospheric attenuation using the predictionmethod, which can be used in the range of 0–1000 GHz at intervals of 1 GHz, for a pressure of1013.25 hPa, temperature of 15 ◦C, water vapor density of 7.5 g/m3 (standard atmosphere, red curve),and dry atmosphere (cyan curve).
Figure 1. Attenuation caused by the typical standard atmosphere, comprising the individual influencesof oxygen molecules (cyan curve) and water vapor (blue curve).
2.2. Attenuation Due to Fog
With their similar microphysical structures, cloud and fog are characterized by their liquid waterdensities, optical visibilities, and droplet size distributions. The typical values of liquid water densityare 0.05 g/m3 for medium fog (visibility of the order of 300 m) and 0.5 g/m3 for thick fog (visibility ofthe order of 50 m). For terrestrial links, it can be assumed that a wireless link is operated below cloudheight. However, the attenuation due to fog may be of interest for urban scenarios. As recommendedby the ITU-R P.840-7 [11], the Rayleigh approximation is a valid method to describe the specificattenuation caused by fog as follows:
γ f og ( f , T) = Kl ( f , T) M (dB/km) (2)
where γ f og (dB/km) is the specific attenuation from fog, Kl ( f , T) is the liquid water specific attenuationcoefficient, M is liquid water density (g/m3), f is the operating frequency in GHz, and T is the liquidwater temperature in (K); Kl ( f , T) is given as follows:
Kl ( f , T) =0.819 f
ε′′ (1 + η2)((dB/km)/(g/m3)) (3)
where
η =2 + ε′
ε′′(4)
Electronics 2020, 9, 1115 5 of 17
where ε′ and ε′′ are the complex dielectric permittivities of water which can be calculated as follows:
ε′ ( f ) =ε0 − ε1
1 +(
ffp
)2 +ε1 − ε2
1 +(
ffs
)2 + ε2 (5)
ε′′ ( f ) =f (ε0 − ε1)
fp
[1 +
(ffp
)2] +
f (ε1 − ε2)
fs
[1 +
(ffs
)2] (6)
Here, fp is the principal relaxation frequency and fs is the secondary relaxation frequency,which are equal to
fp = 20.20− 146 (θ − 1) + 316 (θ − 1)2 (GHz) (7)
fs = 39.8 f p (GHz) (8)
The other related coefficients are as follows:
θ =300T
(9)
ε0 = 77.66 + 103.3 (θ − 1) (10)
ε1 = 0.0671ε0 (11)
ε2 = 3.52 (12)
Finally, the attenuation due to fog based on the travel distance d (km) of each ray can be calculatedas follows:
AttFog = γ f og ( f , T) · d (dB) (13)
2.3. Attenuation Due to Rain
In the ITU-R P.838-3 standard [15], the specific rain attenuation γRain (dB/km) is predicted for agiven rainfall rate R in mm/h, which increases exponentially up to the critical frequency, both for lightand heavy rain. This attenuation can be calculated according to the following relationship:
γRain = k (R)α (dB/km) (14)
where k and α are the functions of the operating frequency f in the range from 1 GHz to 1 THzas well as other parameters, such as temperature, polarization direction (horizontal and vertical),altitude, and other factors. For linear and circular polarizations and all path geometries, k and α can becalculated as follows:
k =
[kH + kV + (kH − kV) cos2 θcos2τ
]2
(15)
α =
[kHαH + kVαV + (kHαH − kVαV) cos2 θcos2τ
]2k
(16)
where θ is the path elevation angle and τ is the polarization angle relative to the horizontal.The frequency-dependent values kH , kV , αH , and αV can be obtained from [15].
In addition, the rainfall rate R0.01 in the ITU-R P.837-7 [18] represents the annual rainfall rate thatis exceeded for only 0.01% of the time in the target region. The value of the rainfall rate is provided bya digital map and the corresponding latitude and longitude information. If the geographical positionof the desired region is not on the grid point provided by the digital map, the value of the nearest gridpoint position is considered. Then, an estimation of a given path attenuation that is exceeded for 0.01%of the time is given by the ITU-R P.530-17 [19] as follows:
AttRain = γRain · de f f = γRain · d · r (dB) (17)
Electronics 2020, 9, 1115 6 of 17
where de f f is the effective path length obtained by multiplying the actual travel length d (km) and adistance factor r, which is estimated as follows:
r =1
0.477d0.633·R0.073·α0.01 · f 0.123 − 10.579
(1− e−0.024·d) (18)
where f (GHz) is the carrier frequency and α is the exponent in the specific attenuation modeled usingEquation (16). Specifically, the maximum recommended r is 2.5. Thus, if the calculated value is greaterthan 2.5, r is directly equated to 2.5.
2.4. Attenuation Due to Snow
Because of the existence of a few studies on the attenuation caused by snow, the ITU-R doesnot provide a computational method for prediction of such attenuation. In our work, we use themeasurement data from [20]. As shown in Figure 2a, the 8-m LOS path was measured under asignificant snowstorm condition. The Tx was located under an overhanging roof, and the wave directlypropagated through the snow to the Rx. The attenuation magnitude was measured in the frequencyrange of 50–300 GHz, as shown in Figure 2b. The measurement data shown in Figure 2b can beconverted in terms of the unit (dB/km). For instance, the attenuation caused by snow at 300 GHz is2.8 dB/8 m or 350 dB/km. Thus, the Attsnow for each ray and each frequency point can be calculatedwith the corresponding travel distance d of each ray as follows:
Attsnow = γsnow · d (dB) (19)
Tx Rx8-m LOS link
(a)
50 100 250 300150 200 Frequency (GHz)
1.8
2
2.2
2.4
2.6
2.8
3
Atte
nuat
ion
(dB
)
Measurement result
(b)
Figure 2. Attenuation caused by snow. (a) schematic of measurement campaign; (b) measuredattenuation caused by snow from [20].
2.5. Processing Steps to Add the Attenuations Caused by the Different Meteorological Factors
Because the attenuations caused by the meteorological factors are frequency dependent, thecalculation of each attenuation at different sub-bands is necessary in THz systems with ultra-widebandwidth. Moreover, the above-mentioned attenuations mostly apply to the attenuation of the signalpower. In our study, we assume a Gaussian random phase of the electric field in (−π,π) for each rayafter transmitting through atmospheric gases, rain, fog, and snow.
The focused total attenuation due to these meteorological factors for the mth ray at the nthfrequency point is as follows:
The power of the mth ray at the nth frequency point from RT simulation results withoutattenuation caused by the meteorological factors can be calculated as:
Pm,n = 20log10
∣∣∣Em,nejϕm,n∣∣∣ (21)
where Em,n and ϕm,n denote the corresponding electric field amplitude and phase, respectively.Then, the power of the mth ray at the nh frequency point after attenuation due to the different
meteorological factors can be obtained as follows:
PAtt,m,n = Pm,n − Attm,n (22)
Lastly, the electric field vector after attenuation due to different meteorological factors can beprocessed as follows:
−−−−→EAtt,m,n = EAtt,m,n · ej(ϕm,n+ϕm
0 ) = 10PAtt,m,n/20 · ej(ϕm,n+ϕm0 ) (23)
where a random phase ϕm0 follows the Gaussian distribution in (−π,π) for the mth ray.
Then, the channel transfer function (CTF) for a certain snapshot is calculated as
H ( f ) =N f
∑n=1
NRay
∑m=1
EAtt,m,n · ej(ϕm,n+ϕm0 )
· δ ( f − fn) (24)
where N f and NRay are the numbers of frequency points and rays, respectively, and fn is the nthfrequency point. The average channel impulse response (CIR) for the wideband channel in a givensnapshot is obtained as:
h (t) =
1N f
N f
∑q=1
EAtt,m,n
· ej(ϕm,nc+ϕm0 ) · δ (t− tm) (25)
where ϕm,nc is the phase at the central frequency point of the mth ray, and tm is the time of arrival ofthe mth ray. Thus, the power delay profile (PDP) after attenuation can be calculated as follows:
PDP = 20 · log10 |h (t)| = 20 · log10
1N f
N f
∑n=1
EAtt,m,n
· δ (t− tm) (26)
Here, PDP is independent of the phase of the central frequency but is related only to the averageamplitude of the electric field of each ray after attenuation.
2.6. Validation of RT with the Attenuations Caused by the Meteorological Factors
In order to validate the RT engine and the processing steps to add the attenuation to the RT results,we reproduce the measurement data for the attenuation by snow. First, we simulate an 8-m LOSpath in the frequency range between 50 GHz and 300 GHz and add the attenuation caused by snow.As shown in Figure 3a, the red curve is the RT simulation result without considering the attenuationby any meteorological factor. The blue curve is the post-processed RT result with attenuation dueto snow. The difference between these two curves is the attenuation caused by snow. As shown inFigure 3b, it is seen that the post-processing steps can accurately reproduce the measurement results.
Electronics 2020, 9, 1115 8 of 17
50 100 250 300150 200 Frequency (GHz)
-105
-100
-95
-90
-85
-80R
ecei
ved
pow
er (d
Bm
)RT without attenuation due to snowRT with attenuation due to snow
(a)
50 100 250 300150 200 Frequency(GHz)
1.8
2
2.2
2.4
2.6
2.8
3
Atte
nuat
ion (d
B)
Code implementedMeasurement result
(b)
Figure 3. Validation of ray-tracing (RT) with attenuation caused by snow. (a) RT result vs. RT resultwith the attenuation caused by snow; (b) comparison between the measured attenuation magnitude(red dot curve) and post-processed RT results (blue curve).
Then, we simulate a 1-m LOS path in the frequency range between 300 GHz and 1500 GHz with asub-frequency wideband of 5 GHz (totally 241 frequency points), and add the attenuation caused bywater vapor with 70.84% relative humidity. The water vapor absorption is calculated using parametersfrom HITRAN. We refer to the prediction method from [21] to post-process the RT result. As can beseen from Figure 4a, the red curve is directly calculated with free space path loss by RT simulatorand the blue curve is the post-processed RT result with the attenuation caused by water vapor with70.84% relative humidity. In order to observe the change of attenuation value due to water vapor itselfwith frequency, we removed the free space path loss in the simulation results, as shown in Figure 4b.Moreover, in order to compare with the measured data more clearly, we change the natural coordinateinto the semilog coordinate. The mean absolute error between measurement data and simulation dataof 241 frequency points is 0.403 dB. This means that the predicted method of the attenuation caused bywater vapor can adequately reproduce the measured results. Therefore, the RT engine, as well as theprocessing steps to add the attenuations, can adequately reproduce the channel measurements underthe specified meteorological conditions.
400 600 800 1000 1200 1400Frequency (GHz)
80
85
90
95
100
105
110
115
Path
loss
(dB)
RT without attenuation due to water vaporRT with attenuation due to water vapor
(a)
400 600 800 1000 1200 1400Frequency (GHz)
10-3
10-2
10-1
100
101
Atte
nuat
ion (d
B/m)
Measured dataPredicted data
(b)
Figure 4. Validation of RT with attenuation for 70.84% relative humidity. (a) RT result vs. RT resultwith the attenuation for 70.84% relative humidity; (b) comparison between the measured (red) andpredicted (blue) attenuation for 70.84% relative humidity.
Electronics 2020, 9, 1115 9 of 17
3. RT Simulation in an Urban Scenario at 300 GHz
The cloud-based RT simulator (CloudRT) used in this work was developed at Beijing JiaotongUniversity. The hardware for our RT simulator comprises a high-performance computing (HPC)cluster, which contains 1600 CPUs and 10 GPUs. Parallel processing can be realized by the computingnodes and supervised by the managing nodes. The first prerequisite for accurate RT simulation is adetailed and accurate description of the environment. The finer the modeled environment, the higheris the corresponding prediction accuracy and the longer is the calculation time. The binary spacepartitioning (BSP) algorithm [22] was applied to accelerate the “image method” based RT simulation.Thus, owing to the parallel processing and the acceleration technique, the running time of the RTsimulation tasks were greatly shortened.
Based on image theory, CloudRT can output more than 10 properties of each ray, includingthe type of ray, reflection order, time of arrival, complex amplitude, azimuth angle of arrival (AoA),azimuth angle of departure (AoD), elevation angle of arrival (EoA), and elevation angle of departure(EoD), among others. More information about CloudRT can be found in the tutorial [23] as well ashttp://www.raytracer.cloud.
Simulation Scenario and Configurations
In this study, the RT simulation is based on the reconstructed three-dimensional (3D) scenariomodel with calibrated EM parameters at 300 GHz. The EM parameters of the relevant materials werecalibrated in our previous work [24,25] and are summarized in Table 1. In the table, ε′r and ε′′r are thereal and imaginary parts of the relative permittivity, respectively; S and α are the scattering coefficientand exponent for the directive scattering model. As shown in Figure 5, the 3D urban scenario wasreconstructed using SketchUp and based on OpenStreetMap (OSM). The Tx is located at the end ofthe target urban street at a height of 5 m, whereas the Rx antenna is placed on a moving bus at aheight of 3 m, as shown in Figure 6. In this study, the Tx and Rx were both omnidirectional verticallypolarized antennas with antenna gain of 0 dBi and transmitted power of 0 dBm. The configuration ofthe antenna was aimed at simulating a pure propagation channel and ignoring the influence of theantenna patterns. Based on the pure propagation channel, various antenna patterns and beamformingapproaches can be coupled with similar scenarios. The simulated city was Seoul, with a longitude of127.05 E and latitude of 37.583 N. The rainfall rate exceeded 0.01% of a year on average (R0.01) and wasdetermined as 60.72 mm/h.
In addition, the order of reflection determines the accuracy and computational complexity of theRT simulation. Consequently, appropriate reflection orders should be selected for different scenarios tobalance the computational time and accuracy. An exploratory simulation was conducted to decide thehighest valid reflection order in this urban scenario. As shown in Figure 7, the LOS ray and reflectionrays up to the 2nd order contribute almost all of the total channel gain. The running time for eachsnapshot is 10.9 s. Compared with the channel gain of the LOS ray and up to 3rd order reflection rays,the difference is very slight. However, the running time for each snapshot is much longer (918.2 s).Therefore, reflection rays up to the 2nd order alone are adequate to study the propagation channel inthis urban scenario. The simulation configurations are summarized in Table 2. More details can befound in [26].
Table 1. EM (electromagnetic) parameters in RT (ray-tracing) simulations.
Figure 6. Reconstructed bus and receiver (Rx) location.
LOS+Ref~1st Ord
LOS+Ref~2nd Ord
LOS+Ref~3rd Ord
LOS
Channel gain (dB)
Figure 7. Channel gain of different combinations of ray.
Electronics 2020, 9, 1115 11 of 17
Table 2. Simulation configuration.
Parameters Values
Frequency range 300–308 GHzFrequency point 3201
Line of sight (LOS) XReflection order 2Scattering model Directive model
Antenna gain 0 dBiTx power 0 dBmAntenna type Omni-directional antennaPolarization Vertical-vertical polarizationPower threshold 50 dB
4. Channel Characterization in an Urban Scenario under Different Meteorological Factors
Based on extensive RT simulation results and processing steps to add the attenuations causedby the different meteorological factors noted herein, we first characterized the terrestrial channelunder the different conditions. The attenuations caused by atmospheric gases, fog, rain, and snow areapproximately 5.2 dB/km, 7.26 dB/km, 21.42 dB/km, and 350 dB/km, respectively. The key channelparameters include path loss, shadow fading, Rician K-factor, RMS delay spread, and four angularspreads (i.e., ASA, ASD, ESA, and ESD). All these channel parameters are then fitted with normaldistributions with mean µ and standard deviation σ. Most of the previous studies have only consideredthe received power under different meteorological factors. However, in our study, we highlight theimpacts of different meteorological factors on each channel parameter. The RT simulation resultswith attenuations due to atmospheric gases, fog, rain, and snow are analyzed, and all the extractedparameters are summarized in Table 3. The simulations presented here provide one of the firstinvestigations into how different weather conditions impact the performance of the terrestrial THzchannels. The details of the channel characterizations and analyses are as follows.
Table 3. Channel parameters by different meteorological attenuation.
In this work, the path loss is fitted by the “A-B” model as follows:
PL = A log10(d) + B + Xσ (27)
Electronics 2020, 9, 1115 12 of 17
where d is the distance between the transceivers; A and B are the slope and intercept, respectively.Xσ denotes the shadow fading, which follows a Gaussian variable with N (0,σSF). As shown inFigure 8, there is a clear trend of increasing path loss with increasing distance between the Tx andRx for the different meteorological factors. As expected, the attenuation due to snow amounts tothe greatest path loss. It is noted that, under snowy conditions, the fitted value of A is very large,while B is a negative number; this indicates that, in the case of snowy conditions, the propagationdistance is indeed very limited. Thus, to ensure connection of the wireless link in the urban scenario,ultra-high-gain directional antennas are highly suggested in THz communications.
100 200 300 400 500
120
140
160
180
200
Path
loss
(dB)
RT without Attenuation by MF Fit-RT without Attenuation by MF FSPLRT with Attenuation by Gases Fit-RT with Attenuation by Gases
Tx-Rx distance (m)
(a)
100 200 300 400 500
120
140
160
180
200
Path
loss
(dB)
RT without Attenuation by MF Fit-RT without Attenuation by MF FSPLRT with Attenuation by Fog Fit-RT with Attenuation by Fog
Tx-Rx distance (m)
(b)
100 200 300 400 500Tx-Rx distance (m)
120
140
160
180
200
Path
loss
(dB)
RT without Attenuation by MFFit-RT without Attenuation by MFFSPLRT with Attenuation by RainFit-RT with Attenuation by Rain
(c)
100 200 300 400 500100
150
200
250
300
350
Path
loss
(dB)
RT without Attenuation by MF Fit-RT without Attenuation by MF FSPLRT with Attenuation by Snow Fit-RT with Attenuation by Snow
Tx-Rx distance (m)
(d)
Figure 8. Path loss, (a) by Gases; (b) by Fog; (c) by Rain; (d) by Snow.
4.2. Rician K-Factor
Because the RT simulator is not bandwidth limited, the Rician K-factor can be directly obtainedusing its definition: the ratio of the power of the strongest ray to the sum of power values of theremaining rays. Thus, it can be calculated as follows:
KF = 10 log10
∣∣E1ejϕ1∣∣2∣∣∣∑NRay
m=1 Emejϕm − E1ejϕ1
∣∣∣2 (28)
where KF represents the Rician K-factor, and Em and ϕm represent the electric field amplitude and phaseof the mth ray, respectively; NRay denotes the number of rays, and E1ejϕ1 is the electric field vector of thestrongest ray. Figure 9 shows the K-factors and fitting results of all the attenuation factors. The meanvalue of the K-factor for the RT results without considering the meteorological factors is 5.25 dB,which indicates effective multipath components (MPCs) reflected and scattered from the surroundinginfrastructures, buildings, and ground. Compared with the realistic scenario in Seoul, in most cases,
Electronics 2020, 9, 1115 13 of 17
office buildings in a city have smooth glass facades. Therefore, strong reflections will occur at theseglass surfaces, and the RT simulation results substantiate this point well. When considering thedifferent meteorological factors in the order of atmospheric gases, fog, rain, and snow, the mean valuesof the Rician K-factors increase correspondingly. These results are consistent with the findings thatthe reflected or scattered rays travel farther than the direct rays under LOS condition and suffer moreattenuation as well. Therefore, the values of the K-factor become larger.
-10 0 10 20 30 40Rician K-factor [dB]
0
0.2
0.4
0.6
0.8
1
CD
F
Fit-RT with Attenuation by GasesRT with attenuation by Gases
(a)
-10 0 10 20 30 40Rician K-factor [dB]
0
0.2
0.4
0.6
0.8
1C
DF
RT with attenuation by FogFit-RT with Attenuation by Fog
(b)
-10 0 10 20 30 40Rician K-factor [dB]
0
0.2
0.4
0.6
0.8
1
CD
F
RT with attenuation by RainFit-RT with Attenuation by Rain
(c)
-10 0 10 20 30 40 50Rician K-factor [dB]
0
0.2
0.4
0.6
0.8
1
CD
F
RT with attenuation by SnowFit-RT with Attenuation by Snow
(d)
Figure 9. Rician K-factor, (a) by Gases; (b) by Fog; (c) by Rain; (d) by Snow.
4.3. RMS Delay Spread
The RMS delay spread is computed as the square root of the second central moment of the PDP,as given by the following equation:
στ =
√√√√√∑NRaym = 1 τm2 · Pm
∑NRaym = 1 Pm
−
∑NRaym = 1 τm · Pm
∑NRaym = 1 Pm
2
(29)
where στ is the RMS delay spread, and Pm and τm are the power and time delay of the mth ray,respectively. Under the consideration of different meteorological situations, the mean values of theRMS delay spreads are 9.57 ns, 9.44 ns, 9.08 ns, and 5.96 ns for atmospheric gases, fog, rain, and snow,respectively. The snowy condition has the smallest mean value (5.96 ns), which is in line with thehighest attenuation caused by snowflakes. As shown in Figure 10, the influences of attenuationscaused by atmospheric gases, fog, and rain can almost be neglected.
0 10020 40 60 80 RMS delay spread (ns)
0
0.2
0.4
0.6
0.8
1
CD
F
RT with Attenuation by Gases Fit-RT with Attenuation by Gases
(a)
0 10020 40 60 80 RMS delay spread (ns)
0
0.2
0.4
0.6
0.8
1
CD
F
RT with Attenuation by Fog Fit-RT with Attenuation by Fog
(b)
0 10020 40 60 80 RMS delay spread (ns)
0
0.2
0.4
0.6
0.8
1
CD
F
RT with Attenuation by Rain Fit-RT with Attenuation by Rain
(c)
0 10020 40 60 80 RMS delay spread (ns)
0
0.2
0.4
0.6
0.8
1
CD
F
RT with Attenuation by Snow Fit-RT with Attenuation by Snow
(d)
Figure 10. RMS (root-mean-square) delay spread, (a) by Gases; (b) by Fog; (c) by Rain; (d) by Snow.
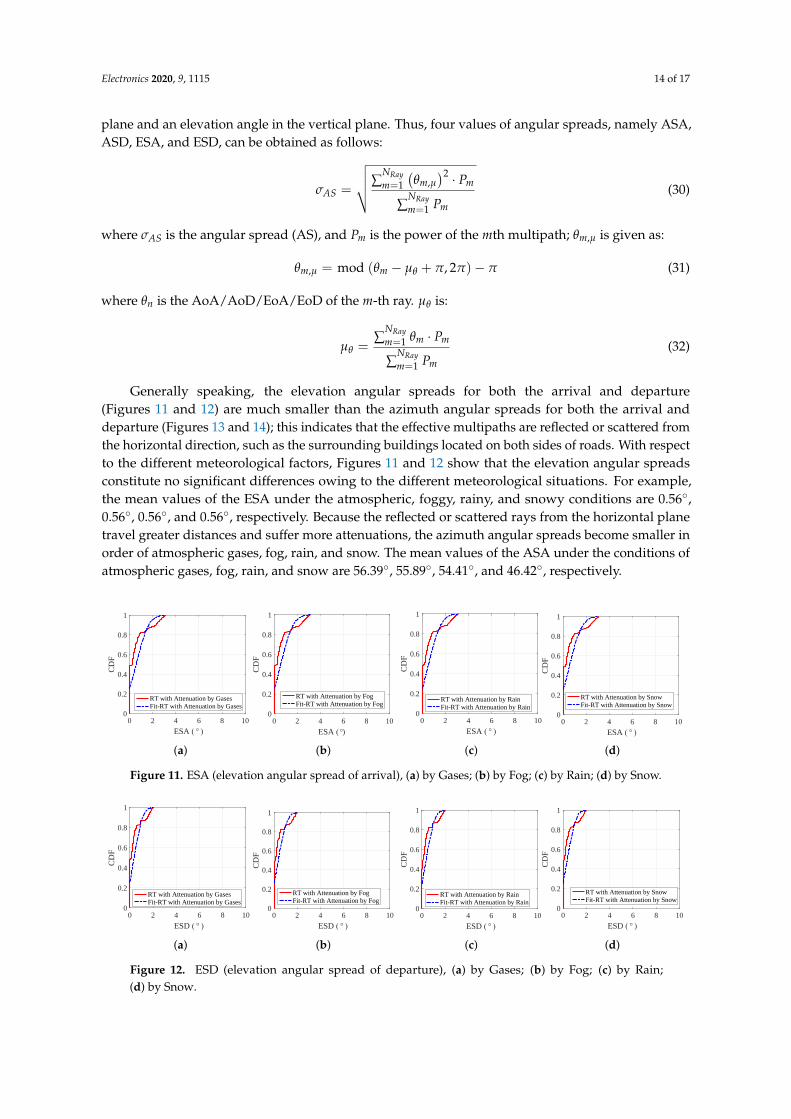
4.4. Angular Spreads
The angular spread indicates the distribution of the arrival and departure angles of each ray in the3D scenario for the transceivers. Each ray will be characterized by an azimuth angle in the horizontal
Electronics 2020, 9, 1115 14 of 17
plane and an elevation angle in the vertical plane. Thus, four values of angular spreads, namely ASA,ASD, ESA, and ESD, can be obtained as follows:
σAS =
√√√√∑NRaym=1
(θm,µ
)2 · Pm
∑NRaym=1 Pm
(30)
where σAS is the angular spread (AS), and Pm is the power of the mth multipath; θm,µ is given as:
θm,µ = mod (θm − µθ + π, 2π)− π (31)
where θn is the AoA/AoD/EoA/EoD of the m-th ray. µθ is:
µθ =∑
NRaym=1 θm · Pm
∑NRaym=1 Pm
(32)
Generally speaking, the elevation angular spreads for both the arrival and departure(Figures 11 and 12) are much smaller than the azimuth angular spreads for both the arrival anddeparture (Figures 13 and 14); this indicates that the effective multipaths are reflected or scattered fromthe horizontal direction, such as the surrounding buildings located on both sides of roads. With respectto the different meteorological factors, Figures 11 and 12 show that the elevation angular spreadsconstitute no significant differences owing to the different meteorological situations. For example,the mean values of the ESA under the atmospheric, foggy, rainy, and snowy conditions are 0.56◦,0.56◦, 0.56◦, and 0.56◦, respectively. Because the reflected or scattered rays from the horizontal planetravel greater distances and suffer more attenuations, the azimuth angular spreads become smaller inorder of atmospheric gases, fog, rain, and snow. The mean values of the ASA under the conditions ofatmospheric gases, fog, rain, and snow are 56.39◦, 55.89◦, 54.41◦, and 46.42◦, respectively.
0 2 4 6 8 10
ESA ( ° )
0
0.2
0.4
0.6
0.8
1
CD
F
RT with Attenuation by GasesFit-RT with Attenuation by Gases
(a)
0 2 4 6 8 10
ESA (°)
0
0.2
0.4
0.6
0.8
1
CD
F
RT with Attenuation by FogFit-RT with Attenuation by Fog
(b)
0 2 4 6 8 10
ESA ( ° )
0
0.2
0.4
0.6
0.8
1
CD
F
RT with Attenuation by RainFit-RT with Attenuation by Rain
(c)
0 2 4 6 8 10
ESA ( ° )
0
0.2
0.4
0.6
0.8
1
CD
F
RT with Attenuation by SnowFit-RT with Attenuation by Snow
(d)
Figure 11. ESA (elevation angular spread of arrival), (a) by Gases; (b) by Fog; (c) by Rain; (d) by Snow.
0 2 4 6 8 10
ESD ( ° )
0
0.2
0.4
0.6
0.8
1
CD
F
RT with Attenuation by GasesFit-RT with Attenuation by Gases
(a)
0 2 4 6 8 10
ESD ( ° )
0
0.2
0.4
0.6
0.8
1
CD
F
RT with Attenuation by FogFit-RT with Attenuation by Fog
(b)
0 2 4 6 8 10
ESD ( ° )
0
0.2
0.4
0.6
0.8
1
CD
F
RT with Attenuation by RainFit-RT with Attenuation by Rain
(c)
0 2 4 6 8 10
ESD ( ° )
0
0.2
0.4
0.6
0.8
1
CD
F
RT with Attenuation by SnowFit-RT with Attenuation by Snow
(d)
Figure 12. ESD (elevation angular spread of departure), (a) by Gases; (b) by Fog; (c) by Rain;(d) by Snow.
Electronics 2020, 9, 1115 15 of 17
0 50 100 150 200
ASA ( ° )
0
0.2
0.4
0.6
0.8
1
CD
F
RT with Attenuation by GasesFit-RT with Attenuation by Gases
(a)
0 50 100 150 200
ASA ( ° )
0
0.2
0.4
0.6
0.8
1
CD
F
RT with Attenuation by Fog Fit-RT with Attenuation by Fog
(b)
0 50 100 150 200
ASA ( ° )
0
0.2
0.4
0.6
0.8
1
CD
F
RT with Attenuation by Rain Fit-RT with Attenuation by Rain
(c)
0 50 100 150 200
ASA ( ° )
0
0.2
0.4
0.6
0.8
1
CD
F
RT with Attenuation by SnowFit-RT with Attenuation by Snow
(d)
Figure 13. ASA (azimuth angular spread of arrival), (a) by Gases; (b) by Fog; (c) by Rain; (d) by Snow.
0 50 100 150 200
ASD ( ° )
0
0.2
0.4
0.6
0.8
1
CD
F
RT with Attenuation by GasesFit-RT with Attenuation by Gases
(a)
0 50 100 150 200
ASD ( ° )
0
0.2
0.4
0.6
0.8
1
CD
F
RT with Attenuation by FogFit-RT with Attenuation by Fog
(b)
0 50 100 150 200
ASD ( ° )
0
0.2
0.4
0.6
0.8
1
CD
FRT with Attenuation by RainFit-RT with Attenuation by Rain
(c)
0 50 100 150 200
ASD ( ° )
0
0.2
0.4
0.6
0.8
1
CD
F
RT with Attenuation by SnowFit-RT with Attenuation by Snow
(d)
Figure 14. ASD (azimuth angular spread of departure), (a) by Gases; (b) by Fog; (c) by Rain;(d) by Snow.
5. Conclusions and Future Work
In view of the impacts of meteorological factors on terrestrial THz wireless communications,this study considers the ITU-R prediction methods and representative measurement results for differentmeteorological factors. We systematically discuss and quantitatively calculate the attenuations causedby various types of meteorological factors, namely atmospheric gases, fog, rain, and snow. Based onthe RT simulation results, we analyze how these different meteorological factors influence the keychannel parameters in a typical urban scenario in the 300 GHz frequency band.
The attenuation caused by atmospheric gases in the 300 GHz frequency band is approximately5.2 dB/km with the ITU-R 676-11 [10] prediction method. For the typical urban scenario in Seoul,the rainfall rate R0.01 (which is exceeded for 0.01% of the time in an average year) is 60.724 mm/h,as predicted according to the ITU-R 837-7 [18] standard. The corresponding attenuation caused byrain is approximately 21.4 dB/km according to the ITU-R 838-3 [15]. For thick fog with a liquid waterdensity of 0.5 g/m3 and visibility of 50 m, the attenuation caused is about 7.26 dB/km, as calculatedaccording to the ITU-R P.840-7 [11]. The attenuation due to snow is about 350 dB/km, as calculatedaccording to the measurement method in a representative article [20].
With the help of a self-developed RT simulator, extensive simulations were conducted forterrestrial wireless links in a typical urban environment. Then, the attenuations caused by atmosphericgases, fog, rain, and snow were added to the simulation results. Hence, the attenuations by differentmeteorological factors have the greatest impact on path loss. The influences of such factors on otherchannel parameters are relatively small owing to the sparsity of the THz channel. However, the trendfor each parameter is as expected. With higher attenuation, the Rician K-factor becomes larger,while the RMS delay spreads and angular spreads become smaller. This is because the reflected orscattered rays travel farther than the direct rays and suffer more attenuation.
Future efforts will be made to include the influences of other factors, such as humidity, on thechannel parameters. Then, using actual measurement results, the ray-tracing results can be validatedand channel characteristics can be further analyzed.
Electronics 2020, 9, 1115 16 of 17
Author Contributions: Data curation, Z.L.; Formal analysis, Z.L.; Funding acquisition, Y.Z.; Project administration,J.D. and Z.Z.; Supervision, K.G. and B.A.; Validation, Z.L. and W.Z.; Visualization, H.Y.; Writing—original draft,Z.L.; Writing—review & editing, H.Y. All authors have read and agreed to the published version of the manuscript.
Funding: This work is supported by the National Key Research and Development Program under Grant No.2019B010157001, Fundamental Research Funds for the Central Universities No. 2019JBM074, the State KeyLaboratory of Rail Traffic Control and Safety (Contract No. RCS2020ZZ005), NSFC under Grant Nos. 61771036and 61725101, and the ZTE Corporation.
Conflicts of Interest: The authors declare no conflict of interest.
References
1. IEEE 802.15 Working Group for WPAN. Available online: http://www.ieee802.org/15/ (accessed on1 October 2018).
2. He, D.; Guan, K.; Fricke, A.; Ai, B.; He, R.; Zhong, Z.; Kasamatsu, A.; Hosako, I.; Kürner, T. Stochastic ChannelModeling for Kiosk Applications in the Terahertz Band. IEEE Trans. Terahertz Sci. Technol. 2017, 7, 502–513.[CrossRef]
3. Fu, J.; Juyal, P.; Zajic, A. THz channel characterization of chip-to-chip communication in desktop size metalenclosure. IEEE Trans. Antennas Propag. 2019, 67, 7550–7560. [CrossRef]
4. Mumtaz, S.; Jornet, J.M.; Aulin, J.; Gerstacker, W.H.; Dong, X.; Ai, B. Terahertz communication for vehicularnetworks. IEEE Trans. Veh. Technol. 2017, 66, 5617–5625. [CrossRef]
5. Faisal, A.; Sarieddeen, H.; Dahrouj, H.; Al-Naffouri, T.Y.; Alouini, M.S. Ultra-massive MIMO systems atterahertz bands: Prospects and challenges. arXiv 2019, arXiv:1902.11090.
6. Huang, C.; Zappone, A.; Alexandropoulos, G.C.; Debbah, M.; Yuen, C. Reconfigurable intelligent surfacesfor energy efficiency in wireless communication. IEEE Trans. Wirel. Commun. 2019, 18, 4157–4170. [CrossRef]
7. Chen, Z.; Ma, X.; Zhang, B.; Zhang, Y.; Niu, Z.; Kuang, N.; Chen, W.; Li, L.; Li, S. A survey on terahertzcommunications. China Commun. 2019, 16, 1–35.
8. Rappaport, T.S.; Xing, Y.; Kanhere, O.; Ju, S.; Madanayake, A.; Mandal, S.; Alkhateeb, A.; Trichopoulos, G.C.Wireless communications and applications above 100 GHz: Opportunities and challenges for 6G and beyond.IEEE Access 2019, 7, 78729–78757. [CrossRef]
9. Paine, S.; Blundell, R.; Papa, D.C.; Barrett, J.W.; Radford, S.J. A Fourier transform spectrometer formeasurement of atmospheric transmission at sub-millimeter wavelengths. Publ. Astron. Soc. Pac. 2000,112, 108. [CrossRef]
10. ITU-R. P. 676-11: Attenuation by Atmospheric Gases; Technical Report, ITU Recommendations; 2016. Availableonline: https://www.itu.int/rec/R-REC-P.676/en (accessed on 1 September 2016).
11. ITU-R. P 840-7: Attenuation due to Clouds and Fog; Technical Report, ITU Recommendations; 2017. Availableonline: https://www.itu.int/rec/R-REC-P.840/en (accessed on 1 December 2017).
12. Miller, S.; Arkin, P.; Joyce, R. A combined microwave/infrared rain rate algorithm. Int. J. Remote Sens. 2001,22, 3285–3307. [CrossRef]
13. Luo, Y.; Huang, W.X.; Luo, Z.Y. Attenuation of terahertz transmission through rain. Optoelectron. Lett. 2012,8, 310–313. [CrossRef]
14. Ishii, S.; Kinugawa, M.; Wakiyama, S.; Sayama, S.; Kamei, T. Rain attenuation in the microwave-to-terahertzwaveband. Wirel. Eng. Technol. 2016, 7, 59. [CrossRef]
15. ITU-R. P.838-3: Specific Attenuation Model for Rain for Use in Prediction Methods; Technical Report,ITU Recommendations; 2005. Available online: https://www.itu.int/rec/R-REC-P.838/en (accessedon 1 March 2005).
16. Richard, V.W.; Kammerer, J.E.; Reitz, R.G. 140-GHz Attenuation and Optical Visibility Measurements of Fog, Rainand Snow; Technical Report; Army Ballistic Research Lab Aberdeen Proving Ground MD: 1977. Availableonline: https://apps.dtic.mil/sti/pdfs/ADA051055.pdf (accessed on 1 March 2019).
17. Norouziari, F.; Marchetti, E.; Hoare, E.; Gashinova, M.; Constantinou, C.; Gardner, P.; Cherniakov, M.Low-THz wave snow attenuation. In Proceedings of the 2018 International Conference on Radar (RADAR),Brisbane, QLD, Australia, 27–30 August 2018; IEEE: Piscataway, NJ, USA, 2018; pp. 1–4.
18. ITU-R. P.837-7: Characteristics of Precipitation for Propagation Modelling; Technical Report, ITURecommendations; 2017. Available online: https://www.itu.int/rec/R-REC-P.837/en (accessed on1 June 2017).
19. ITU-R. P.530-17: Propagation Data and Prediction Methods Required for the Design of Terrestrial Line-of-SightSystems; Technical Report, ITU Recommendations; 2017. Available online: https://www.itu.int/rec/R-REC-P.530/en (accessed on 1 December 2017).
20. Ma, J.; Adelberg, J.; Shrestha, R.; Moeller, L.; Mittleman, D.M. The effect of snow on a terahertz wireless datalink. J. Infrared Millim. Terahertz Waves 2018, 39, 505–508. [CrossRef]
21. Slocum, D.M.; Slingerland, E.J.; Giles, R.H.; Goyette, T.M. Atmospheric absorption of terahertz radiationand water vapor continuum effects. J. Quant. Spectrosc. Radiat. Transf. 2013, 127, 49–63. [CrossRef]
22. Deng, Y.; Ni, Y.; Li, Z.; Mu, S.; Zhang, W. Toward real-time ray tracing: A survey on hardware accelerationand microarchitecture techniques. ACM Comput. Surv. (CSUR) 2017, 50, 1–41. [CrossRef]
23. He, D.; Ai, B.; Guan, K.; Wang, L.; Zhong, Z.; Kürner, T. The Design and Applications of High-PerformanceRay-Tracing Simulation Platform for 5G and Beyond Wireless Communications: A Tutorial. IEEE Commun.Surv. Tutorials 2019, 21, 10–27. [CrossRef]
24. Guan, K.; Peng, B.; He, D.; Eckhardt, J.M.; Rey, S.; Ai, B.; Zhong, Z.; Kuerner, T. Channel Characterization forIntra-Wagon Communication at 60 GHz and 300 GHz Bands. IEEE Trans. Veh. Technol. 2019, 68, 5193–5207.[CrossRef]
25. Guan, K.; Peng, B.; He, D.; Eckhardt, J.M.; Rey, S.; Ai, B.; Zhong, Z.; Kürner, T. Measurement, Simulation,and Characterization of Train-to-Infrastructure Inside-Station Channel at the Terahertz Band. IEEE Trans.Terahertz Sci. Technol. 2019, 9, 291–306. [CrossRef]
26. Yi, H.; Guan, K.; He, D.; Ai, B.; Dou, J.; Kim, J. Characterization for the Vehicle-to-Infrastructure Channel inUrban and Highway Scenarios at the Terahertz Band. IEEE Access 2019, 7, 166984–166996. [CrossRef]