ICTSD Series on Trade-Supported Strategies for Sustainable Development By Munir Ahmad Executive Director, International Textiles and Clothing Bureau Impact of Origin Rules for Textiles and Clothing on Developing Countries ICTSD Programme on Competitiveness and Sustainable Development December 2007 Issue Paper No. 3
Transcript
ICTSD Series on Trade-Supported Strategies for Sustainable Development
By Munir Ahmad Executive Director, International Textiles and Clothing Bureau
Impact of Origin Rules for Textiles and Clothing on Developing Countries
www.ictsd.org
ICTSD Programme on Competitiveness and Sustainable DevelopmentDecember 2007
Issue Paper No. 3
Impact of Origin Rules for Textiles and Clothing on Developing Countries
December 2007 l ICTSD Programme on Competitiveness and Sustainable Development
ICTSD
By Munir Ahmad Executive Director, International Textiles and Clothing Bureau
Issue Paper No. 3
ii Munir Ahmad — Impact of Origin Rules for Textiles and Clothing on Developing Countries
Published by
International Centre for Trade and Sustainable Development (ICTSD)International Envrionment House 27 Chemin de Balexert; 1219 Geneva, SwitzerlandTel: +41 22 917 8492 Fax: +41 22 917 8093E-mail: [email protected] Internet: www.ictsd.org
This paper was prepared by Mr. Munir Ahmad, Executive Director, International Textiles and Clothing Bureau (ITCB) at the request of the International Centre for Trade and Sustainable Development (ICTSD). Mr. Ahmad received invaluable assistance from his ITCB colleagues, Ms. Dinora Diaz and Mr. Guan Weigang. The views expressed in the paper do not necessarily represent that of the ITCB or that of its members.
ICTSD is grateful for support for this project, provided by the Dutch Ministry of Foreign Affairs (DGIS) and the UK Department for International Development (DFID).
For more information about ICTSD’s Programme on Competitiveness and Sustainable Development, visit our website at www.ictsd.org
ICTSD welcomes feedback and comments on this document. These can be forwarded to Gloria Carrion at [email protected]
Citation: Ahmad, Munir (2007). Impact of Origin Rules for Textiles and Clothing on Developing Countries, ICTSD Programme on Competitiveness and Sustainable Development, International Centre for Trade and Sustainable Development, Geneva, Switzerland.
Copyright ICTSD, 2007. Readers are encouraged to quote and reproduce this material for educational, non-profit purposes, provided the source is acknowledged.
This work is licensed under the Creative Commons Attribution-Noncommercial-No-Derivative Works 3.0 License. To view a copy of this license, visit http://creativecommons.org/licenses/by-nc-nd/3.0/ or send a letter to Creative Commons, 171 Second Street, Suite 300, San Francisco, California, 94105, USA.
The views expressed in this publication are those of the author(s) and do not necessarily reflect the views of ICTSD or the funding institutions.
ISSN 1995-6932
iiiICTSD Programme on Competitiveness and Sustainable Development
TABLE OF CONTENTS
LIST OF BOXES AND TABLES iv
LIST OF CHARTS v
ABBREVIATIONS/ACRONYMS vi
INTRODUCTION 1
I. THE MAKING OF TEXTILE-RELATED ORIGIN RULES 2
A. NON-PREFERENTIAL ORIGIN RULES 2
B. PREFERENTIAL ORIGIN RULES 5
II. PREFERENTIAL TRADE ARANGEMENTS WITH TEXTILE- SPECIFIC ORIGIN RULES 8
A. PREFERENTIAL TARIFF ARRANGEMENTS 8
B. TYPICAL TEXTILE-SPECIFIC ORIGIN RULES IN PREFERENTIAL ARRANGEMENTS 9
III. THE NEXUS BETWEEN ORIGIN RULES AND TRADE UNDER PREFERENTIAL ARRANGEMENTS 15
A. TEXTILE TRADE HAS BEEN SUBjECT TO PERSISTENT POLICY CHANGES 15
B. RECENT DEVELOPMENTS IN TEXTILE TRADE 16
C. TRADE FLOWS UNDER PREFERENTIAL ARRANGEMENTS 19
D. SOURCING OF RAW MATERIALS BY PREFERENCE- RECEIVING COUNTRIES 20
IV. ORIGIN RULES AND DISTORTIONS IN TEXTILE TRADE 30
A. LITTLE EVIDENCE OF ORIGIN RULES PROMOTING VERTICAL INTEGRATION 30
B. ORIGIN RULES AND SUB-OPTIMAL UTILIzATION OF PREFERENCES 31
C. IMPEDIMENT TO DEVELOPMENT OF SOUTH-SOUTH TRADE 33
D. IMPACT ON NAMA NEGOTIATIONS 39
E. THE NEED TO FIX THE RULES OF ORIGIN CONUNDRUM 39
V. CONCLUDING REMARKS 41
ENDNOTES 43
REFERENCES 46
APPENDIX 47
iv Munir Ahmad — Impact of Origin Rules for Textiles and Clothing on Developing Countries
LIST OF BOXESBox 1. US Textiles and Clothing* Imports from Cbi, Agoa and Andean Countries (US Versus Non-US
Content) 12
Box 2. US/EU-25/Canada Textiles and Clothing Imports from Selected Preferential Partners 19
LIST OF TABLESTable 1. US Imports of Textiles and Clothing from Top 30 and Preferential Suppliers (1990–2006) 17
Table 2. EU-25 Imports of Textiles and Clothing from Top 30 and Preferential Suppliers (1995–2006) 18
Table 3. United States Textile and Clothing Exports – Composition and Main Destinations 22
Table 4. EU-25 Textiles and Clothing Exports – Composition and Main Destinations 23
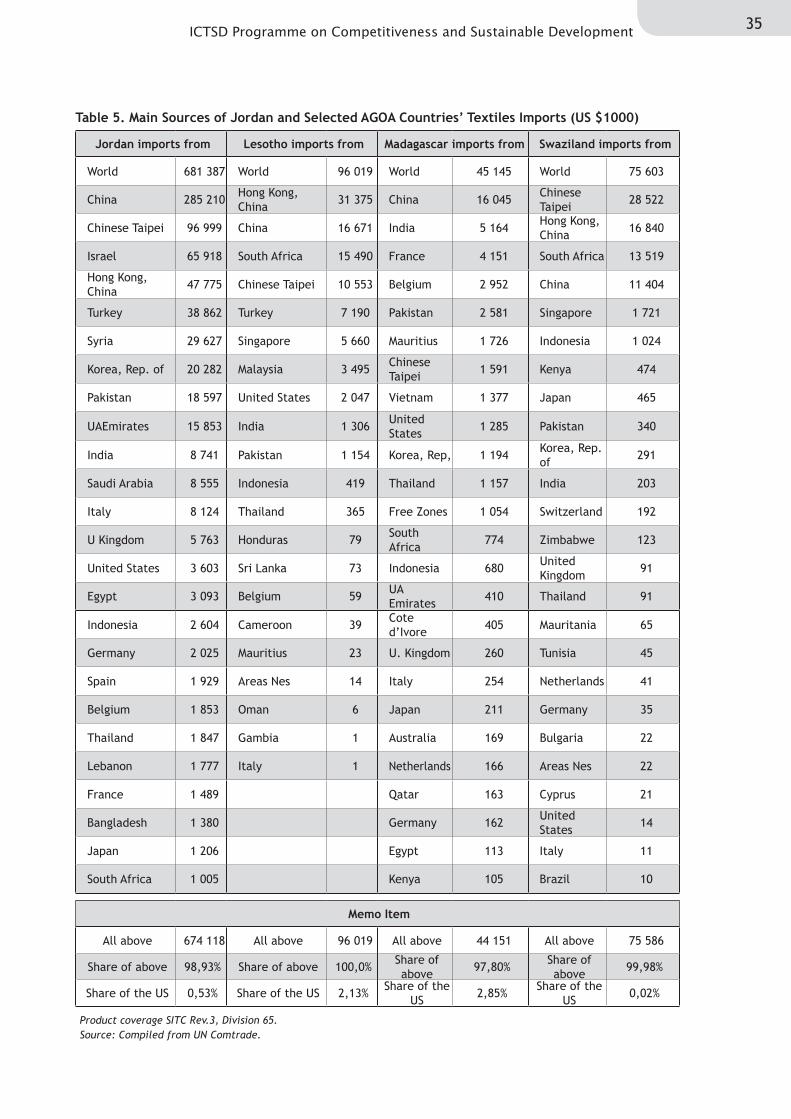
Table 5. Main Sources of Jordan and Selected AGOA Countries’ Textiles Imports (US $1000) 35
Table 6. Main Sources of EU Preferential Partners’ Textiles Imports, 2005 (US $1000) 36
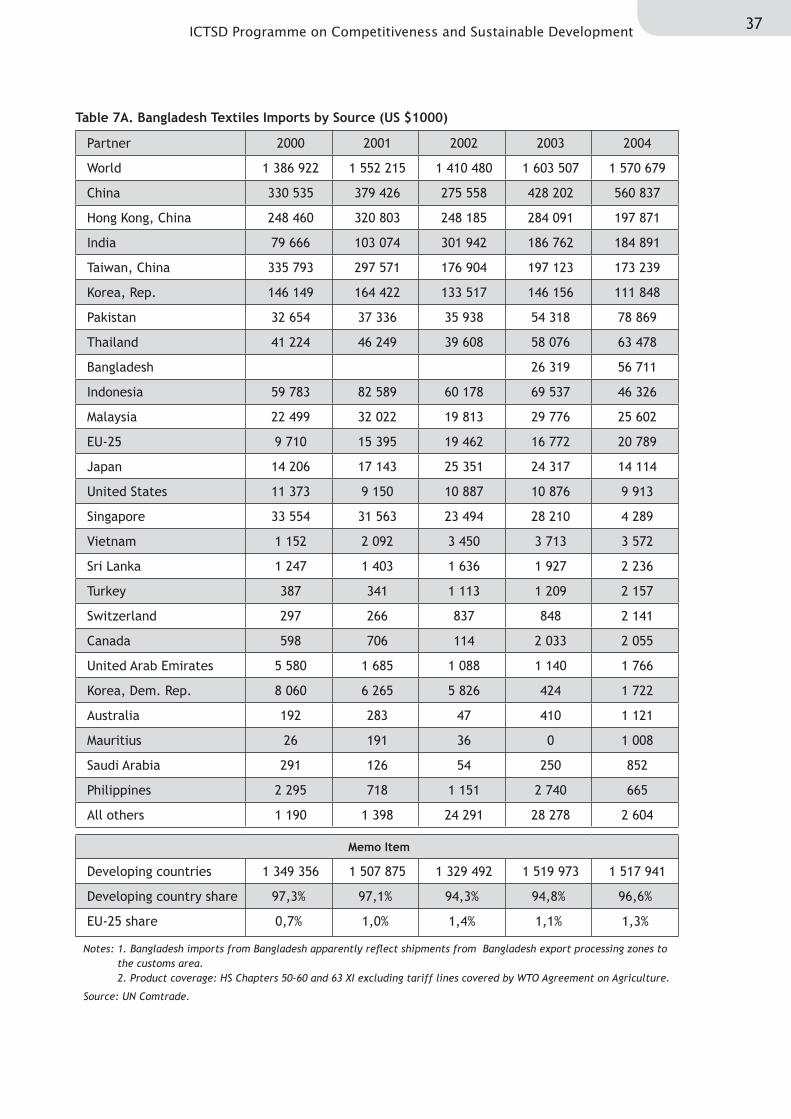
Table 7A. Bangladesh Textiles Imports by Source (US $1000) 37
Table 7B. Cambodia Textiles Imports by Source (US $1000) 38
Appendix Table: Countries covered by non-reciprocal preference schemes 47
vICTSD Programme on Competitiveness and Sustainable Development
LIST OF CHARTSChart 1. US Exports of Textile Mill Products to Mexico and CBI Countries 6
Chart 2. Canada Clothing Imports from Least-Developed Countries 14
Chart 3A. US Exports of Textiles and Clothing to Preferential Partners 21
Chart 3B. EU Exports of Textiles and Clothing to Main Preferential Partners 21
Chart 4. US Imports from Mexico Versus US Exports to Mexico 25
Chart 5. US Imports from CBI Versus US Exports to CBI Countries 25
Chart 7. US Imports from Andean Versus US Exports to Andean Countries 26
Chart 8. EU-25 Imports from Romania Versus EU-25 Exports to Romania 27
Chart 9. EU-25 Imports from Tunisia Versus EU-25 Exports to Tunisia 27
Chart 10. EU-25 Imports from Morocco Versus EU-Exports to Morocco 28
Chart 11. EU-25 Imports from Bulgaria Versus EU-25 Exports to Bulgaria 28
Chart 12. EU-25 Imports from Bangladesh Versus EU-25 Exports to Bangladesh 29
Chart 13. EU-25 Imports from Cambodia Versus EU-25 Exports to Cambodia 29
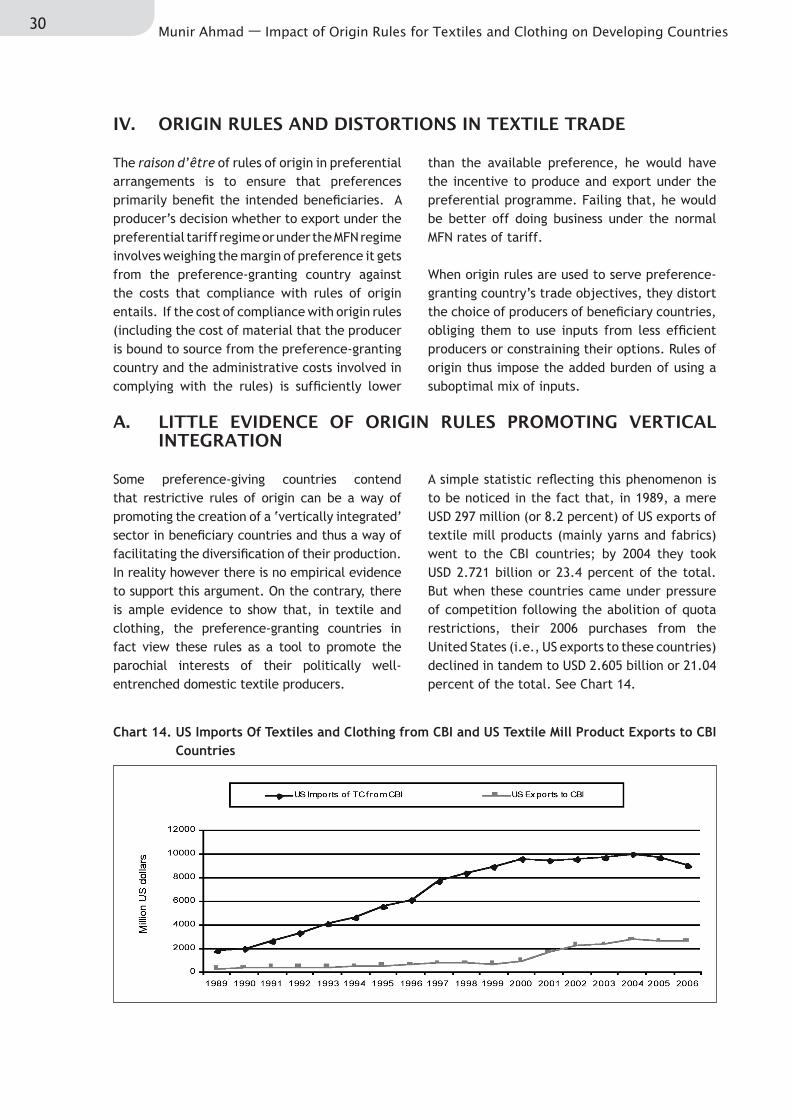
Chart 14. US Imports Of Textiles and Clothing from CBI and US Textile Mill Product Exports to CBI Countries 30
Chart 15. EU GSP Utilization Rates by Bangladesh 31
Chart 16. EU-25 and US Clothing Imports from African Least-Developed Countries 33
Chart 17. US Exports of Textiles and Clothing to Preferential Partners 33
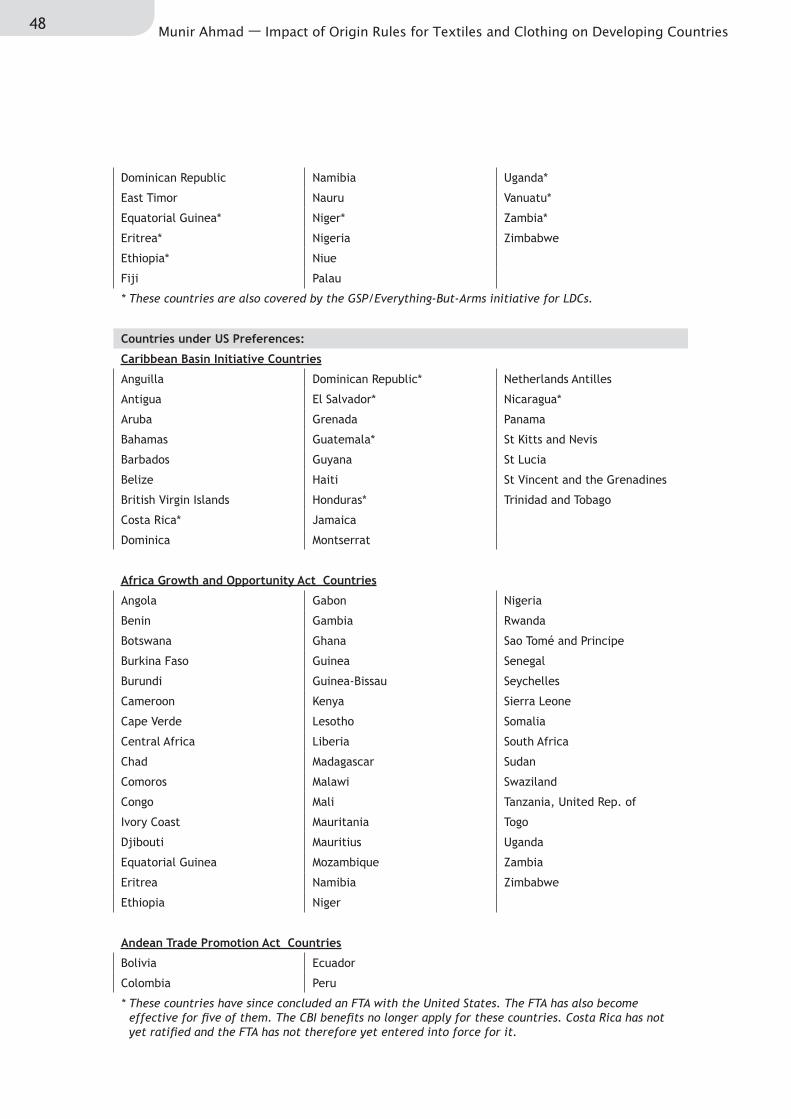
Appendix Chart 1. US Imports from Dominican Republic Versus US Exports to Dominican Republic 49
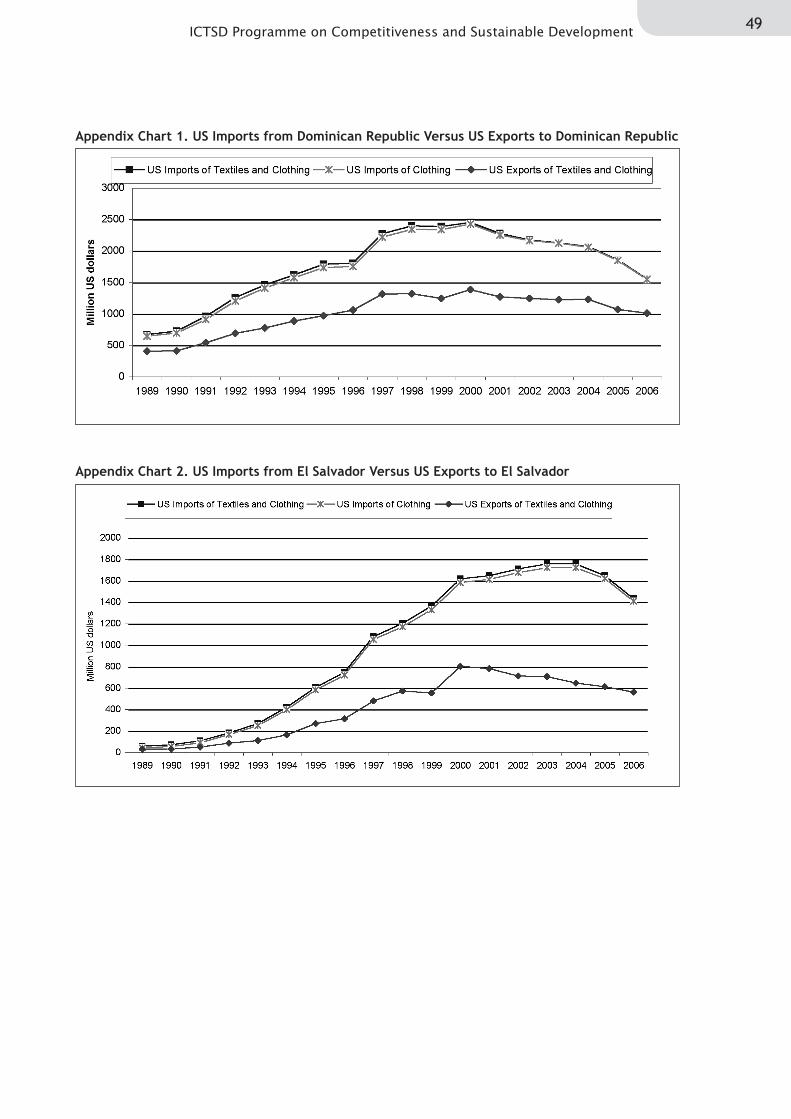
Appendix Chart 2. US Imports from El Salvador Versus US Exports to El Salvador 49
Appendix Chart 3. US Imports from Honduras Versus US Exports to Honduras 50
Appendix Chart 4. US Imports from Jordan Versus US Exports to Jordan 50
vi Munir Ahmad — Impact of Origin Rules for Textiles and Clothing on Developing Countries
ABBREVIATIONS/ACRONYMS
ACP African, Caribbean and Pacific Island group of countries
AGOA Africa Growth and Opportunity Act (of the United States)
ASEAN Association of Southeast Asian Nations
ATC Agreement on Textiles and Clothing
ATPA Andean Trade Preference Act (of the United States)
ATPDEA Andean Trade Promotion and Drug Eradication Act (of the United States)
CBERA Caribbean Basin Economic Recovery Act (trade vehicle under CBI of the United States)
CBI Caribbean Basin Initiative (US programme to assist countries of the Caribbean and Central
America)
CBTPA Caribbean Basin Trade Promotion Act (of the United States in modification of CBERA)
CTG Council for Trade in Goods of the WTO
EBA Everything-But-Arms (initiative of the EU granting quota-free, duty-free treatment to
least-developed countries)
EU European Union
FTA Free Trade Agreement
GALs Guaranteed Access Levels (system establish by the United States providing additional MFA
quotas for CBI countries)
GATT General Agreement on Tariffs and Trade (forerunner of the WTO)
GSP Generalized System of Trade Preferences
HS Harmonized Commodity Description and Coding System (classification system devised by
World Customs Organization)
ICTSD International Centre for Trade and Sustainable Development
ITCB International Textiles and Clothing Bureau
LDCs Least-developed countries
MFA Multi-Fibre Arrangement
MFN Most-Favoured-Nation treatment
NAFTA North American Free Trade Agreement (between Canada, Mexico and the United States
of America)
NAMA Non-Agricultural Market Access (negotiations under Doha Round)
OPT Outward processing trade
QIZ Qualifying Industrial Zones (US programme of duty-free treatment for imports from
Jordan and Egypt)
SAARC South Asian Association for Regional Cooperation
SITC Standard International Trade Classification (classification system devised by the UN)
TPLs Tariff Preference Levels (under US free trade agreements)
TRQ Tariff Rate Quota
US United States of America
WTO World Trade Organization
1ICTSD Programme on Competitiveness and Sustainable Development
INTRODUCTION
Rules of origin are an essential for the conduct of international trade. They are needed to determine the nationality of traded products, which, in turn, is used for a whole variety of commercial policy purposes: to collect trade statistics; to apply import tariffs; to impose countervailing or anti-dumping duties on unfairly traded products; to apply safeguard measures for temporary protection to domestic industries in times of need; to administer requirements with respect to marking of products to help consumers to distinguish between them depending on their source. Origin rules are also required for administering preferential trade agreements to ensure that only the intended countries benefit from those preferences.
Textile and clothing are no exception to these essentials. Over time, however, origin rules in this sector have so evolved as to serve as conditions on access to markets or to provide protection to domestic textile industries. And, in the context of preferential arrangements, these rules have increasingly been designed to provide advantage to textile producers in preference-granting countries. While, on the one hand, this situation limits the possibility for preference-receiving countries to derive full benefit from preference schemes, on the other it has led to the creation of new distortions to trade in the sector. Origin rules are also a major factor behind concerns about the sustainability of many developing countries’ exports following the expiry of quota restrictions.
This paper is intended as an input to policy-makers and other stakeholders. It aims to provide an analysis of the working of various origin schemes in as simple and user-friendly a manner as possible.
To this end, the first section gives a brief background to the making and evolution of present-day origin rules relating to textiles and clothing in some major economies, both in the context of normal most-favoured-nation (MFN) trade and preferential trading arrangements which now account for a large portion of trade in the sector. Section II identifies the main preferential trade arrangements in which textile-related origin rules play a significant role. It also brings out the aspects of these rules that condition the utilization of preferential access by preference-receiving countries to the use of inputs from preference-giving countries. Section III gives a short account of recent developments in textile trade in general and its evolution under preferential trade arrangements in particular. It then maps the binding influence of origin rules on the sourcing of raw materials by various groups of preference-receiving countries. It shows the nexus between origin rules and trade and how preferential origin rules constrain many countries’ trade prospects, contrasting their situation with those countries that are not bound by these rules and have been better able to cope with competition due to the flexibility of their sourcing options. Section IV highlights how restrictive origin rules constitute a source of continuing distortions in textile and clothing trade. Section V offers some concluding reflections.
2 Munir Ahmad — Impact of Origin Rules for Textiles and Clothing on Developing Countries
(i) The context of quota restrictions
Trade in textiles and clothing has long been controversial. For over four decades, markets in developed countries were shielded from imports by a series of international arrangements that authorized developed countries to impose limits on the quantities that could be exported to their markets from particular exporting countries. Beginning with the “Short Term” Arrangement Regarding International Trade in Cotton Textiles in 1961, it evolved into the Arrangement Regarding International Trade in Textiles, usually called the Multi-Fibre Arrangement or MFA, in 1974 until it was replaced by the Uruguay Round Agreement on Textiles and Clothing (ATC) from January 1995.1 The ATC itself expired at the end of 2004 and, with it, came the end of the system of quota restrictions.
Neither these arrangements nor GATT rules set out any specific criteria to determine the origin of imported products. Not surprisingly, exporters and importers would attempt to maximize trade in whatever ways the regime would permit. One way was to ship unfinished or semi-finished products to countries that were not covered by restraints or could not fully use their available quotas. The transformation of unfinished products in the second country would confer origin on the second country and would thus free the final product from quota limits imposed on the first country. Much of this development had to be a natural evolution of production methods in a globalizing world. Notwithstanding, however, it inflamed the textile industries in importing countries which sought the protection of quotas and brought persistent calls for plugging the loopholes.
(ii) The United States
In general, the rule-of-thumb standard for origin determination had long been ‘substantial transformation’, i.e., to deem a product as originating in a place where it had undergone substantial transformation in its making. The
United States law however did not provide for any specific definition of the ‘substantial transformation’ standard. Following court rulings, it was interpreted as a process that created a new and different article of commerce “having a distinctive name, character or use.”
In response to complaints that textiles and clothing were being imported by getting around the applicable quotas, in May 1984 2 President Reagan directed the Secretary of the Treasury to issue new country of origin regulations for textiles and apparel. Pursuant to this, interim regulations were published in August 1984 and final regulations in March 1985.3 They provided that a textile or apparel product will be considered to have undergone a substantial transformation if it had been transformed by means of “substantial manufacturing or processing operations” into a new and different article of commerce.
The concept of substantial manufacturing or processing operations thus came to be added to the interpretation of ‘substantial transformation’. Following these regulations, until the conclusion of the Uruguay Round, US Customs conferred origin to an apparel article on the basis of where its components were cut to shape or, in the case of apparel of knitted fabric, where the knit panels were sewn together. However, as even this standard afforded possibilities of quota utilization by parcelling out the assembly of components to a different location, on the eve of implementation of the Uruguay Round results the US textile industry extracted a concession from the US Administration and succeeded in getting the origin rules relating to textile and clothing products to be significantly changed and formally codified in law. This was accomplished by Section 334 of the US Uruguay Round Agreements Act. The actual implementation of these changes came into effect in July 1996.4
The modifications effected through this law substantially departed from the previous US practice, particularly insofar as the
I. THE MAKING OF TEXTILE-RELATED ORIGIN RULES
A. NON-pREFERENTIAL ORIGIN RULES
3ICTSD Programme on Competitiveness and Sustainable Development
determination of origin of finished fabrics, made-up articles, apparel assembled in different locations, and apparel made from knit-to-shape panels was concerned. It was now provided that such manufacturing operations as dyeing/printing of fabric, a multitude of operations in the making of made-up articles from fabric, cutting to shape of apparel, and sewing together of knit-to-shape panels would no more be deemed to confer origin.
Thus, for example, even if greige fabric imported from developing countries was further processed by dyeing, printing and other finishing operations in, say, a European country and then exported from that European country to the United States, its origin remained the developing country where the greige fabric was originally made. Likewise, flat goods (bed linen, kitchen linen, table line, toilet linen, curtains, bedspreads and other furnishing articles, sacks and bags, tarpaulins, tents, sails, and similar other articles) imported into the United States, say, from a European country (where fabrics imported from quota-restrained developing countries were dyed, printed and subjected to other operations) also came to be treated as originating in the developing country where the fabric was originally made, not the European country where the fabric had been subjected to further processing and making into various flat goods.
This gave rise to disruption of established patterns of trade and to loud protests from a wide cross-section of stakeholders. Under pressure, especially from the European Union, the US relented and enacted an amendment to its Uruguay Round Agreements Act 5 which resulted in further modifications, essentially accommodating the EU concerns. Under these amendments:
(a) For processed fabrics: The origin reverted to the pre-July 1996 rule so that fabrics are now conferred origin of the country where they are both dyed and printed and, in addition, undergo two or more of the following finishing operations: bleaching, shrinking, fulling, napping, decating, permanent stiffening, weighting, permanent embossing or moireing.
However this same rule does not apply to fabrics made of wool. In other words, for fabrics of wool, origin remains where the basic fabric is formed.
(b) For made-up articles: For 16 specified categories of made-up articles, the July 1996 change established the origin as the country where the constituent greige fabric was formed by weaving or knitting, regardless of any further processing such as dyeing and printing of fabric, and subsequent conversion of fabric to made-up articles.
The 2000 changes with respect to some (not all) of these 16 articles resulted in the following:
(i) For non-cotton and non-wool made-up articles (i.e., only those of silk, man-made fibres or other vegetable fibres), the rule now recognizes dyeing and printing as origin conferring. Therefore the origin is the country where the constituent fabric is dyed and printed and undergoes two or more finishing operations.
However, if these same products are made of cotton or wool fabric, the origin continues to be deemed to be the country where the constituent cotton or wool fabric is formed.
(ii) For all made-up articles, contrary to pre-ATC rules, the new rule continues to disregard such processing operations as designing, cutting, hemming, sewing that are necessary to be undertaken on the fabric to convert it to made-up articles.
(c) For apparel products: No modification was effected in 2000. Consequently, origin continues to be determined on the basis of rules as modified and implemented with effect from July 1996, i.e., designing and cutting to shape of apparel is no more deemed to be origin conferring; nor are the sewing together of knit-to-shape panels and a variety of finishing operations that are commonly undertaken for the final product.
4 Munir Ahmad — Impact of Origin Rules for Textiles and Clothing on Developing Countries
(iii) The European Union
In the case of the European Union, the concept of substantial transformation, insofar as textile and clothing products falling under Section XI of the Harmonized Commodity Description and Coding System (HS) are concerned, has been reflected in detailed rules specifying the criteria for each main group of products. This method of determining origin is sometimes also referred to as the ‘list system’.
In general, under this method, origin is conferred to an imported product if it was so transformed by working or processing in the exporting country as to fall under a different tariff heading.6 The relevant EU Regulation provides a listing of the working or processing operations that must be carried out on non-originating materials.
With respect to textiles and clothing, the practical reflection of the above principle is contained in a specific annex to an EU Regulation,7 item by item. Thus, for example, printed or dyed woven fabric, classifiable under chapters 50 to 56 of the HS, qualifies to receive origin status if it was manufactured from yarn, or was printed or dyed from unbleached or pre-bleached fabric and had undergone two preparatory or finishing operations in the exporting country. Thus, printing or dying of fabric by itself is also accepted as origin conferring, provided, however, that it is accompanied by two preparatory or finishing operations. Non-printed or non-dyed fabric is considered as originating in the exporting country only if it was manufactured there from yarn.
Finished or complete apparel of woven fabrics classified under HS Chapter 62 receives origin if it received ‘complete making up’ in the exporting country. Complete making up is, in turn, defined as “all operations following the cutting of the fabric.” However, shawls, scarves, mufflers and veils which are also classified under the same Chapter 62 receive origin only if they were manufactured from yarn. But if these articles are embroidered, they receive origin either if they were manufactured from yarn or were manufactured from unembroidered fabric, provided that the value of the fabric does not
exceed 40 percent of the ex-works price of the final product.
In fact, the annex listing the origin criteria for textile and clothing products is spread over more than five pages. By contrast, the annex pertaining to all other products (including agricultural products) consists of less than four pages. Such has been the attention devoted to origin rules for textiles and clothing!
(iv) Some other jurisdictions
While several other countries including Japan, Norway and Switzerland follow the change-in-tariff-heading method, in some other jurisdictions the origin rules are based on prescribed minimum proportions of value addition. For example, Canadian rules confer origin if at least 50 percent of the cost of imported good was incurred in the exporting country and was finished there in the form in which it is imported into Canada.
(v) Harmonization of non-preferential origin rules
It was in recognition of such diversity of origin criteria (admittedly not just in textiles but other sectors as well) that the WTO Membership reached an interim agreement during the Uruguay Round to harmonize non-preferential origin rules on the basis of the principle that they “should provide for the origin of a particular good to be either the country where the good had been wholly obtained or, when more than one country is concerned in the production of the good, the country where the last substantial transformation had been carried out” (the Agreement on Rules of Origin). The practical reflection of this otherwise simple principle, however, continues to defy resolution and has remained a source of contention in WTO negotiations for over ten years (although, admittedly, not just on textiles but a number of other sectors as well). The work aimed at harmonizing non-preferential origin rules has therefore yet to be finalized.
Although non-preferential origin rules remain important, in particular concerning possible application of any new safeguard actions under
5ICTSD Programme on Competitiveness and Sustainable Development
normal GATT rules and disciplines, countervailing or anti-dumping duties, or marking of the origin of imported products, they do not enjoy the level of significance that they used to have under the MFA or the ATC. Now that quota restrictions have gone, it matters little, for example, if bed linen exported from, say, Indonesia to the United States had only been assembled in Indonesia from fabric imported from Chinese Taipei and gets classified in the United States as originating in Chinese Taipei. Even so, it is to be recognized
that varying origin criteria remain responsible for creating unnecessary confusion in data on textile and clothing trade because, as it happens, some export shipments made to particular countries actually end up being shown in import figures from elsewhere and for something else. Consequently, it is not uncommon to find large differences between export figures of certain countries and the counterpart import data of their partner importing economies.
B. pREFERENTIAL ORIGIN RULES
(i) The quota system loomed large
Like non-preferential origin rules, the evolution of the making of present-day preferential origin rules for textiles and clothing can also be traced to the strong influence of quota restrictions in the sector as brought out in the following sub-sections.
(a) Outward processing trade (OPT)
Outward processing had long been an established feature of trade, especially in Europe. In textile and clothing, given the labour-intensive nature of sewing and other operations required in the making of clothing products, it essentially involved the shipping of fabric and cut or unfinished parts of apparel from high-wage importing countries to neighbouring low-wage developing economies for making up into garments and re-importing the finished garments. The practice initially developed in some EC member states, especially Germany and France, on the one hand, and former Yugoslavia, on the other. With passage of time, it received added significance and was extended to countries of the Mediterranean, especially, Tunisia and Morocco.
To take advantage of the opportunities offered by outward processing trade a provision was included in the Multi-Fibre Arrangement of 1974, even though it effectively involved a further departure from the general GATT rule of non-discrimination. It provided that “Consideration shall be given to special and
differential treatment to re-imports into a participating [importing] country of textile products which that country has exported to another participating country for processing and subsequent re-importation in the light of the special nature of such trade …” 8
On the back of this provision, the EC provided additional quota entitlements for outward processing trade. Although, with the passage of time, the possibility of OPT quotas was offered on a more generalized basis, as a matter of sheer economic logic it was of the greatest significance to some of the EC member states themselves inasmuch as it enabled their yarn and fabric makers to find convenient outlets for their products and also to economize on the cost of labour. It also provided the much-needed export prospects for some exporting countries with surplus pools of available labour. Besides Yugoslavia, the more successful examples were Morocco and Tunisia. As subsequent developments (discussed in the following section) were to show, the system proved to be a boon in creating ready availability of markets for developed countries’ textile producers but could not promote the long-term viability of industries in developing exporting countries.
On the other side of the Atlantic, the United States also established (in 1988) a similar “Special Regime” for most apparel and selected made-up textiles from Mexico whereby a significant portion of Mexico’s quotas was set aside for export of articles assembled from fabrics wholly formed and cut in the United States.9
6 Munir Ahmad — Impact of Origin Rules for Textiles and Clothing on Developing Countries
(b) United States System of Guaranteed Access Levels
The same concept, in essence, had already been adapted by the United States to its Caribbean Basin Initiative (CBI).10 Aimed to assist the development of countries in its neighbouring region, this initiative was first launched from January 1984. It granted duty free treatment to a group of products, which did not, however, include textiles and clothing. This exclusion notwithstanding, some enterprises were taking advantage of a US customs provision which exempted import duties to the extent of the value of US content contained in import products (the so-called 807 trade) and were shipping garments by assembling them from components made in the United States. As the rates of tariff on clothing were quite substantial, there was economic benefit to derive even if the duty saving was only on the value of US content in the exported product.
In 1986, the US launched a “special access programme” for the CBI countries, referred to as 807-A or Super 807. The emphasis of this programme was on providing additional quota access for apparel assembled from fabric produced and cut in the United States. They were invited to enter into bilateral agreements that established guaranteed access levels (GALs), as distinct from normal MFA quotas. These guaranteed access levels could be increased to almost unlimited amounts on request, the oft-trumpeted industry concerns about market
disruption notwithstanding. After all, they ensured the use of US textile materials! The concurrent sweetener of duty concession, albeit as exemption of duty only on the value of US content in the exported product, provided the added bait.
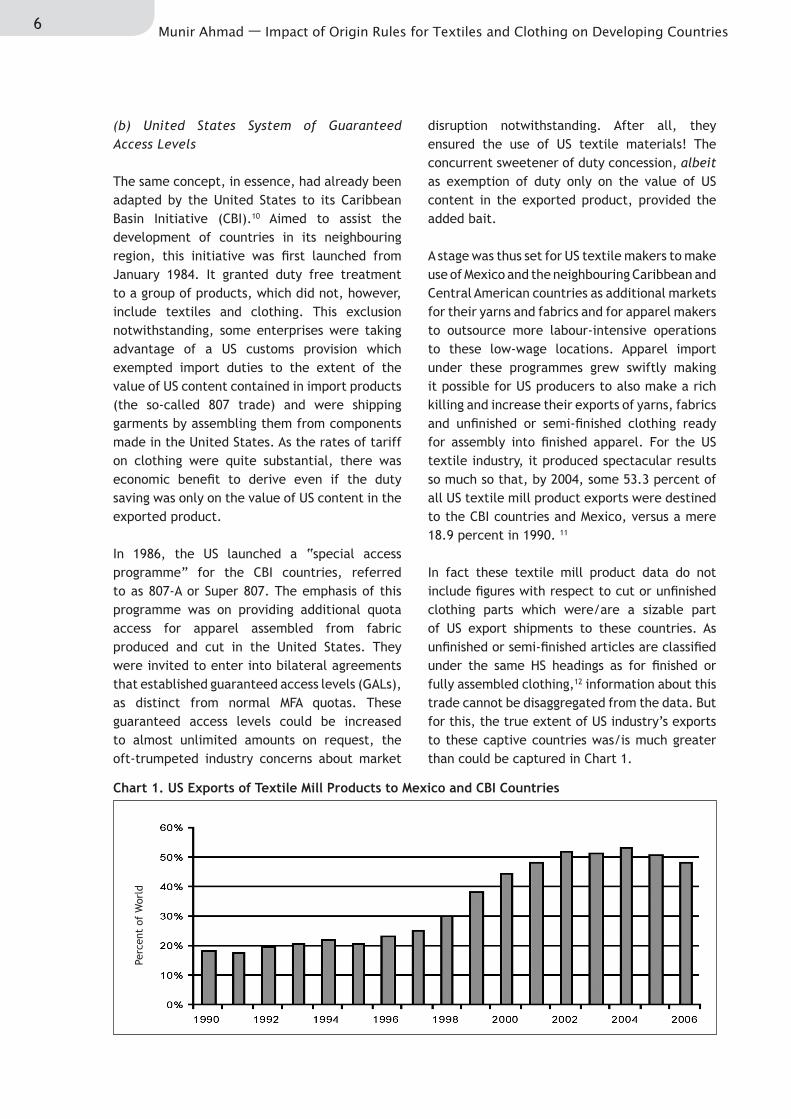
A stage was thus set for US textile makers to make use of Mexico and the neighbouring Caribbean and Central American countries as additional markets for their yarns and fabrics and for apparel makers to outsource more labour-intensive operations to these low-wage locations. Apparel import under these programmes grew swiftly making it possible for US producers to also make a rich killing and increase their exports of yarns, fabrics and unfinished or semi-finished clothing ready for assembly into finished apparel. For the US textile industry, it produced spectacular results so much so that, by 2004, some 53.3 percent of all US textile mill product exports were destined to the CBI countries and Mexico, versus a mere 18.9 percent in 1990. 11
In fact these textile mill product data do not include figures with respect to cut or unfinished clothing parts which were/are a sizable part of US export shipments to these countries. As unfinished or semi-finished articles are classified under the same HS headings as for finished or fully assembled clothing,12 information about this trade cannot be disaggregated from the data. But for this, the true extent of US industry’s exports to these captive countries was/is much greater than could be captured in Chart 1.
Chart 1. US Exports of Textile Mill Products to Mexico and CBI Countries
Perc
ent
of W
orld
7ICTSD Programme on Competitiveness and Sustainable Development
And, during 1984–87, the US-made content averaged 64 percent of the value of apparel imports from these countries versus only 20 percent for all other sectors combined.13 This, because of the high average tariff of over 20 percent on apparel compared to only 3.5 percent for all other product categories.
The attraction held out by this mode of trade had subsequently to become the focus of lobbying efforts by domestic industry groups as the core basis for origin rules in most preferential arrangements, irrespective of whether these were in the context of autonomous non-reciprocal schemes or bilateral or regional free trade
agreements. The phenomenon, euphemistically called the “local content requirement”, has thus become the central plank of US preferential origin rules found today.
As the main purpose of this short paper is not to trace the evolution of the making of origin rules in all its details, in the following Section we turn to the identification of the main preferential trade arrangements in which textile-related origin rules play a significant role. Suffice to say, the origin rules in preferential arrangements have been heavily influenced by the experience of the quota regime.
8 Munir Ahmad — Impact of Origin Rules for Textiles and Clothing on Developing Countries
II. pREFERENTIAL TRADE ARANGEMENTS WITH TEXTILE-SpECIFIC ORIGIN RULES
A. pREFERENTIAL TARIFF ARRANGEMENTS
Presently, all major developed economies provide tariff preferences on import of textiles and apparel from a variety of developing countries. Some of these programmes are autonomous in nature and do not require reciprocal concessions in return. Others are bilateral or regional free trade agreements. In almost all cases, these programmes or agreements provide for specific origin criteria for textile exports to be able to benefit from duty concession or preference.
The principal programmes under which textile and clothing exports from developing economies are provided tariff preference by developed economies are:
(i) The European Union
Non-reciprocal
Generalized System of Preferences • framework for developing and least-developed countries.14 (A list of least-developed countries is provided in the Appendix.)The partnership agreement with African, • Caribbean and Pacific Island countries (ACP) in the framework of the Cotonou (formerly Lome) Convention. (The list of the ACP group of countries is given in the Appendix.)
Reciprocal
EU–Turkey Customs Union.• European Association agreements with • Bulgaria and Romania (These two have since joined the EU as full members and have had large apparel exports to the other EU member states.)Stabilization and Association Agreements • with Western Balkan countries.Euro-Mediterranean Association Agreements • with Algeria, Morocco, Tunisia, Israel, Palestinian Authority, Egypt, Jordan, Lebanon and Syria.
(ii) The United States
Non-reciprocal
Caribbean Basin Initiative (CBI),• 15 the group of Caribbean countries, of whom Haiti is now the largest exporter. (The list of CBI eligible countries is provided in the Appendix table.)Africa Growth and Opportunity Act • (AGOA), under which Botswana, Kenya, Lesotho, Madagascar, Mauritius, Namibia, South Africa and Swaziland are significant exporters of apparel. (The list of all AGOA countries is also provided in the Appendix table.)Andean Countries (ATPA), of whom Colombia • and Peru are significant apparel exporters.Qualifying Industrial Zones (QIZ) schemes: • for Jordan and Egypt.
Reciprocal
North American Free Trade Agreement • (NAFTA), under which Mexico is a substantial exporter of textile and apparel to the US.US/Central American Free Trade Agreement • (CAFTA-DR): Costa Rica, Dominican Republic, El Salvador, Guatemala, Honduras and Nicaragua, all of which have sizeable apparel exports to the US.Other US Free Trade Agreements: with • Australia, Jordan, Israel, Morocco, Bahrain, Chile and Singapore.
(iii) Canada
Generalized System of Preferences (GSP) • (especially duty-free access to least-developed countries in its framework).
9ICTSD Programme on Competitiveness and Sustainable Development
(iv) Japan
Generalized System of Preferences.•
(v) Australia
Duty-free access to least-developed • countries in the framework of Generalized System of Trade Preferences.
B. TYpICAL TEXTILE-SpECIFIC ORIGIN RULES IN pREFERENTIAL ARRANGEMENTS
In the scope of this short paper, it seems unnecessary to provide detailed descriptions of all origin schemes, with all their twists and shades. The following account therefore brings out only the main features with emphasis on those aspects that have a significant impact on developing countries’ trade prospects.
(i) The European Union
EU preferential origin rules are specified in each preferential arrangement or agreement. The basic architecture of these rules is substantially the same irrespective of whether they pertain to non-reciprocal schemes in the framework of the GSP or they relate to reciprocal preferences under free trade area agreements (FTAs). In general, they are based on a scheme of ‘list rules’ which are in turn organized according to the structure of HS classification. The criteria for determining the origin of various products are listed against each product category, setting out the minimum amount of working or processing required on non-originating materials in order for the resulting product to obtain originating status.
Generally, two broad criteria are used to identify origin:
The ‘wholly-obtained or produced’ criterion • applies in cases in which the product is manufactured in the country from inputs that are also wholly obtained within the country; it thereby precludes the use of second-country components.The more complex ‘substantial • transformation’ criterion, which is used in the majority of cases as most products contain varying amounts of imported inputs, defines various levels of requisite working or processing to receive origin status.
Typically the criteria require the final product to undergo particular manufacturing operations expressed as change from a specified tariff heading to a different heading. The change of tariff headings is also defined at various degrees of aggregation.
In general, the EU rules also provide for the possibility of use of materials or components produced in other countries specified in the particular arrangement or with which the EU has free trade arrangements. Known as ‘cumulation’, it allows producers from preference-benefiting countries to import non-originating materials from other beneficiaries without affecting the final product’s originating status and therefore the possibility of benefiting from duty concession.
There are four types of cumulation criteria: bilateral cumulation, diagonal cumulation, regional cumulation and full cumulation.
Bilateral cumulation is the most common form and applies to trade between two partners in a preference scheme. It stipulates that producers in beneficiary country A may use inputs from the preference-giving country B without affecting the final good’s originating status.
Under diagonal cumulation, beneficiary countries included in the same programme can use materials that originate in another beneficiary country – as if the materials were originating in the country where further processing is undertaken. As with bilateral cumulation, only products or materials originating in the parties to these agreements can benefit from diagonal cumulation. Although more than one country can be involved in the manufacture of a product, it will have the origin of the country where the last working or processing operation took place, provided that it was more
10 Munir Ahmad — Impact of Origin Rules for Textiles and Clothing on Developing Countries
than a prescribed minimal operation. Diagonal cumulation operates between the European Community and the countries of the so-called ‘pan-European cumulation zone’.
Regional cumulation: Regional cumulation is a form of diagonal cumulation, which only exists under the GSP and operates between members of a regional group of beneficiary countries (e.g. ASEAN and the South Asian Association for Regional Cooperation/SAARC).
Finally, under full cumulation, all processing or transformation of a product within a set of beneficiary countries can be counted as qualifying content, regardless of whether the processing is sufficient to confer originating status to the materials themselves. Full cumulation is less common than diagonal but is applied by the EU in its agreements with Algeria, Morocco and Tunisia and in the Cotonou Agreements. It allows for greater flexibility in production processes.
Leaving aside the somewhat technical description of origin criteria outlined above, in a nutshell the EU requires that, to be accorded duty concession under its GSP schemes, the product concerned must have undergone ‘double transformation’, i.e., “at least two manufacturing/processing operations” in the country of export. Thus, for example, for a woven shirt to benefit from duty concession, it should have been assembled in the exporting least-developed country from fabric made in that country. Consequently, most least-developed countries are unable to take full advantage of the facility, lacking as they are in textile manufacturing capacity due to the highly capital-intensive nature of this segment of textile and clothing production. Moreover, a significant portion of clothing is made with fabrics of new fibres with technologies patented in the developed world.
Likewise, although the origin criteria under other preference programmes allow relatively more flexibility in the use of components made outside the Union (but from within the wider cumulation areas), yet, effectively, these criteria necessitate the use of EU materials and components by major clothing exporters such as Bulgaria, Morocco,
Romania, Tunisia etc., given that these countries also possess only limited textile manufacturing capacities.
The practical effect of EU origin criteria for preferential arrangements is thus two-fold. In the case of least-developed countries, the actual utilization of preferential access is much less than optimal. In the case of the countries of the Maghreb (Morocco, Tunisia, etc.) and Central and East European countries, by sheer economic logic, their producers and exporters are obliged to import their raw material (yarns and fabrics, etc.) from the EU member states. These phenomena are brought out at some length in Section III of the paper.
(ii) The United States
(a) Free trade agreements
With the exception of US/Jordan and US/Israel FTAs, the main benchmark for textile and clothing origin rules is the so-called ‘yarn forward’ of NAFTA. In fact, although it is generally described as yarn forward, for many products it is actually ‘fibre forward’. Simply expressed, this rule makes duty-free treatment of textiles and clothing imports conditional on the requirement that the imported product is made within the free trade area from yarn (fibre) onward. In other words, for a shirt to benefit from duty concession it must be manufactured with yarn as well as fabric that is produced or sourced in any of the NAFTA member countries, or effectively a triple transformation process. For fabric, it must have been manufactured with yarn that was also produced in the FTA partner concerned.
Typically, the US free-trade agreements contain two main exceptions from the general yarn forward standard. First, they provide for the so-called Tariff Preference Levels (TPLs) that stipulate import of specified maximum quantities at preferential rates of duty even if the products concerned are made with material that does not otherwise qualify under the prescribed origin criteria. Second, they provide for a process for determination of inputs (yarns and fabrics) that may not be available in commercial quantities
11ICTSD Programme on Competitiveness and Sustainable Development
within the United States and may therefore be sourced from non-FTA partners. However, there is no uniformity as to the existence of these exceptions across all FTAs to which the United States is a party.
(b) Non-reciprocal preferential programmes
The criteria in US non-reciprocal preference arrangements under the Caribbean Basin Initiative (CBI), Africa Growth and Opportunity Act (AGOA) and Andean Trade Promotion Act (ATPA) are in, some respects, even stricter. They stipulate duty benefit for apparel imports from these countries mainly if the component inputs are sourced from the United States itself. This
is the so-called local content requirement. As in the case of free trade agreements, there are a few deviations permitted from this general principle, but subject to strict criteria including limits on the maximum quantities that may benefit from duty concession.
Perhaps the simplest way to understand the origin criteria under non-reciprocal preference schemes of the United States is to see the specific conditions under which duty-free access is available under these programmes (Box 1 below). For convenience sake, and to avoid repetition in later sections of the paper, the volumes of imports benefiting from preferential access under various criteria are also indicated.
12 Munir Ahmad — Impact of Origin Rules for Textiles and Clothing on Developing Countries
Box 1. US Textiles and Clothing* Imports from Cbi, Agoa and Andean Countries (US Versus Non-US Content)
CBI COUNTRIES (CARIBBEAN BASIN TRADE pARTNERSHIp ACT) 2005Total Imports (Million US$) 9 661.20Subject to US content Apparel assembled from US cut fabric from US yarn 16.00%Knit apparel from US fabric, yarn and thread 15.90%Knit apparel from regional or US fabric from US yarn (TRQ) 13.40%Apparel cut and assembled from US fabric, yarn & thread 12.70%Articles assembled from any fabric cut in the United States 9.80%Brassieres cut and assembled in the US and/or CBI 3.50%T-shirts made of regional fabric from US yarn (TRQ) 2.10%Apparel assembled from US cut fabric & yarn, further processed 1.60%Apparel assembled with US thread and fabric (mixed cutting) 1.30%Total above 76.40%With no US content or under MFN duty Apparel from fabric or yarn determined as not available in US 1.50%Outside the preference programme (i.e., subject to MFN duty) 22.10%Total above 23.60%
AGOA COUNTRIES (AFRICAN GROWTH AND OppORTUNITY ACT) Total Imports (Million US$) 1 481.90Subject to US content Apparel assembled from US cut fabric & yarn, further processed 0.30%With no US content or under MFN duty Apparel made in a lesser-developed AGOA with non-US fabric 83.40%Apparel from regional fabric from US or African yarn 7.40%Apparel from fabric or yarn determined as not available in US 4.40%Cashmere sweaters, knit-to-shape 0.30%Outside the preference programme (i.e., subject to MFN duty) 4.30%Total above 99.70%
ANDEAN COUNTRIES (ANDEAN TRADE pROMOTION AND DRUG ERADICATION ACT)
Total Imports (Million US$) 1 495.30Subject to US content Apparel assembled from US fabric (finishing in US) 10.60%Brassieres cut and assembled in the US and/or an ATPDEA country 0.20%Total above 10.90%With no US content or under MFN duty Apparel assembled from ANDEAN fabric/yarn 74.90%Apparel, chief value of llama, alpaca, etc. (i.e., Andean components) 1.90%Apparel from fabric or yarn determined as not available in US 0.30%Outside the preference programme (i.e., subject to MFN duty) 12.00%
Total above 89.10%* Product coverage: MFA Source: Compiled from US Department of Commerce data.
13ICTSD Programme on Competitiveness and Sustainable Development
The design of AGOA and Andean preference programme is also essentially the same as that for the CBI, the main difference being that, under AGOA, there is an exception which allows duty-free treatment to apparel made in designated lesser-developed countries16 regardless of the source of fabric or yarn, subject to prescribed annual quantitative limits. Similar to AGOA, the Andean programme permits duty-free entry of apparel assembled in the beneficiary countries from fabric made in the [Andean] region from US or regional yarn. Luckily, for Colombia and Peru, both have had substantial indigenous yarn and fabric production capacities and are therefore able to make do without using US made yarns.
The relative flexibility of origin rules for these programmes can be gleaned from the percentages of imports accounted for by US content or otherwise. The largest share of imports under the CBI programme (over 76 percent) is with US components because they do not have the possibility of enjoying duty benefit unless they use US textile materials. On the other side, the largest shares under AGOA and Andean programmes are against those exceptions that do not require the use of US inputs. Thus little of imports from AGOA countries are made with US content. For Andean countries, too, 89 percent is outside the US-content requirement. Unfortunately, however, those provisions are time-limited 17 and are also subject to prescribed limits as to the maximum annual quantities that could be entered duty-free.
Qualifying Industrial Zones (QIZs)
In 1996 the United States Congress established the Qualifying Industrial Zones (QIZ) initiative to support the peace process in the Middle East.18 These zones are designated industrial parks in Egypt, Israel or Jordan, from which goods can be exported to the United States duty free. The QIZ initiative does not have any expiration date; nor is it required to be renewed by Congress every few years like the Generalized System of Preferences or other trade legislations such as certain provisions of AGOA.
In the case of Jordanian QIZs, the product must be a substantially transformed good, with at least 35 percent of its value added generated in Israel, a Jordanian QIZ or the West Bank/Gaza. Of that 35 percent, a minimum of 11.7 percent must be added in a Jordanian QIZ, 8 percent in Israel, and the remaining 15.3 percent can come from a Jordanian QIZ, Israel or the West Bank/Gaza.19
It is worth noting that the United States also has a free trade agreement with Jordan. The FTA, however, does not supersede or eliminate the QIZ programme. Indeed, currently, the bulk of Jordanian apparel export is under the QIZ programme because it offers immediate tariff and quota-free access to the US market to goods that are produced in the QIZs and meet the specific rules of origin requirements. Under the US–Jordan FTA, on the other hand, tariffs and quotas for many goods are phasing out over time, and rules of origin require 35 percent Jordanian content. Thus for some high-tariff goods, producing in QIZs continues to offer a better advantage. For instance, many apparel goods face US tariffs of up to 30 percent. Under the FTA, tariffs on these goods are to be reduced over ten years, and Jordanian exports would have to meet the 35 percent Jordanian content level. Under the QIZ initiative, those same goods enjoy immediate elimination of tariffs and quotas and require a lower level of Jordanian value-addition.
In the case of the QIZs in Egypt, industrial products, including textiles and apparel, are authorized duty-free entry into the US if these products comply with rules of origin requirements. The required rules state that 35 percent of the commodity’s value must be manufactured in an Egyptian QIZ, with a minimum of 11.7 percent of Israeli inputs.20 The Israeli content requirement is fulfilled if a factory’s cumulative export in each quarter satisfies the agreed-upon ratio.
Furthermore, unlike under some elements in the CBI and AGOA programmes, duty-free access under the QIZ arrangements is not limited by any quotas on quantities that could benefit from duty-free treatment.
14 Munir Ahmad — Impact of Origin Rules for Textiles and Clothing on Developing Countries
(iii) Canada
From 1 January 2003, Canada substantially modified its GSP scheme for least developed countries, extending full duty-free access to imports of textile and clothing products.21 It also significantly relaxed the origin rules pertaining to these imports. Under these rules, apparel products exported from least-developed countries were made eligible for duty-free treatment if they were cut, or knit to shape, and sewn from inputs from any of the 48 eligible LDCs.
More significantly, apparel products were also made eligible for duty-free treatment even when they used inputs from other developing countries, the only condition being that at least 25 per cent of value addition on the apparel product must have taken place in the LDC exporting country. Any Canadian input materials used in the manufacture of apparel exported from the LDCs are also deemed to originate in the LDC concerned.
In other words, the LDC exports to Canada are now duty-free provided they fulfill any of the following origin criteria: (i) the exported apparel are made with inputs from any least-developed country or Canada; (ii) the exported apparel contain at least 25 per cent value-added in the least-developed country concerned even when the inputs are sourced from other developing countries.
This relaxation compares very favourably with 40 percent value-added required for most of the other non-textiles and clothing items and 60 percent under the normal GSP for developing countries. Little wonder that this revised dispensation resulted in major improvements in the rates of utilization and, thereby, exports from several least-developed countries to Canada (see Chart 2 and Box 2).
Chart 2. Canada Clothing Imports from Least-Developed Countries
(iv) Japan
The Japanese GSP regime includes duty-free treatment for covered textile and clothing from least-developed countries and duty concession at different rates for other developing countries. There is a complex system of ceilings beyond which duty concessions do not apply.
(v) Australia
Like Canada, Australia also extended duty-free
treatment to imports from least-developed countries, but with effect from 1 July 2003. Rules of origin require local content to be 50 percent of total factory cost and that the last manufacture take place in the LDC. A fairly broad definition of local content is provided to meet the 50 percent target. An LDC can include input from other LDCs, developing countries, Pacific Island countries and Australia in calculating the 50 percent content. Within this, non-LDC developing country content is, however, subject to a maximum of 25 percent of manufacturing cost.22
15ICTSD Programme on Competitiveness and Sustainable Development
III. THE NEXUS BETWEEN ORIGIN RULES AND TRADE UNDER pREFERENTIAL ARRANGEMENTS
For years, then, trade in textiles and clothing has been subject to the influence of policy intervention through three main policy tools: (i) quota restrictions, (ii) tariff preferences, and (iii) origin rules including, especially those that condition the access to preferences to the sourcing of textile inputs from preference-giving countries.
This section is designed to map the development of trade in textiles and clothing, especially in the context of preferential arrangements and the role of origin rules in linking the sourcing of textile inputs by preference-receiving countries from preference-granting countries.
A. TEXTILE TRADE HAS BEEN SUBjECT TO pERSISTENT pOLICY CHANGES
Interpreting textile and clothing trade data is fraught with complications. It does not lend itself to broad-brushed generalizations. For one thing, all preferential schemes were not launched at the same time. For another, over time, changes have been introduced to the extent and quality of preferences under some preferential programmes. Further still, the origin rules pertaining to various preference schemes have been far from uniform.
The US CBI initiative has been on the go since 1984; NAFTA became effective from 1994; AGOA from late 2000; the US programme of Qualifying Industrial Zones (QIZs) in respect of Jordan and Egypt from 2001 and 2005 respectively; and the Andean preferences from 2002. 23
As to the quality of preference, the Caribbean Basin Economic Recovery Act (which covered the trade elements of the umbrella programme, CBI) did not include textiles and clothing for duty-free treatment. Traders could only take advantage of a US Customs provision that provided duty exemption on the value of US inputs incorporated in the imported products. In 1986, the US established the Special Access Programme for CBI countries, the accent of which was on extending additional (virtually unlimited) quota access for textiles and apparel provided the additional quotas were used in conjunction with US inputs. The Trade Act of 2000 accorded complete duty-free treatment to CBI apparel subject of course to prescribed origin rules requiring, in most cases, that the products are made with US yarns and fabrics. The Andean programme was brought at par with that for the CBI beneficiaries only from 2002.
As noted in the previous section, Mexico was also provided special access quotas from 1988 linking this access to the use of “fabrics wholly formed and cut in the United States”.24 The added advantage of duty concession in the form of remission of duty on the value of US content was also available as in the case of the Caribbean countries. From 1994, Mexico got on to a faster track – complete duty free access – pursuant to NAFTA.
The AGOA included a time-bound exception to the general origin rule so that it provided duty-free access for specified quantities of apparel from designated lesser-developed Sub-Saharan African countries regardless of the source of fabric or yarn.25 This so-called ‘third country fabric’ provision has since been extended through September 2012.26
Origin rules under Jordanian and Egyptian QIZ schemes did not tie the duty-free treatment to the use of US materials.
On the EU side, too, Bulgaria and Romania became entitled to duty exemption from different times. Prior to that, both these countries also used to be subject to MFA/ATC quotas. In the case of the countries of the Maghreb, the preferential treatment had been in effect for much longer.
And Canada and Australia extended duty-free access to least-developed countries with vastly liberal origin rules only from 2003.27
In a nutshell, aside from the implementation of various preferential programmes from different
16 Munir Ahmad — Impact of Origin Rules for Textiles and Clothing on Developing Countries
points in time, significant modifications were made over time to the origin rules relating to particular schemes. And the textile and clothing scene witnessed a fundamental transformation in the competitive landscape with the expiry of
quota restrictions at the end of 2004. All these changes naturally exerted profound influence on the evolution of trade in the sector, as also on the fortunes of many countries.
B. RECENT DEVELOpMENTS IN TEXTILE TRADE
Under strong influence of major developed countries’ trade policy, trade in textiles and clothing has been far from any consistent or level playing field. Even so, the world has never stood still in the sector. With every major change in the policy environment, the sector has a history of responding with agility and pace.
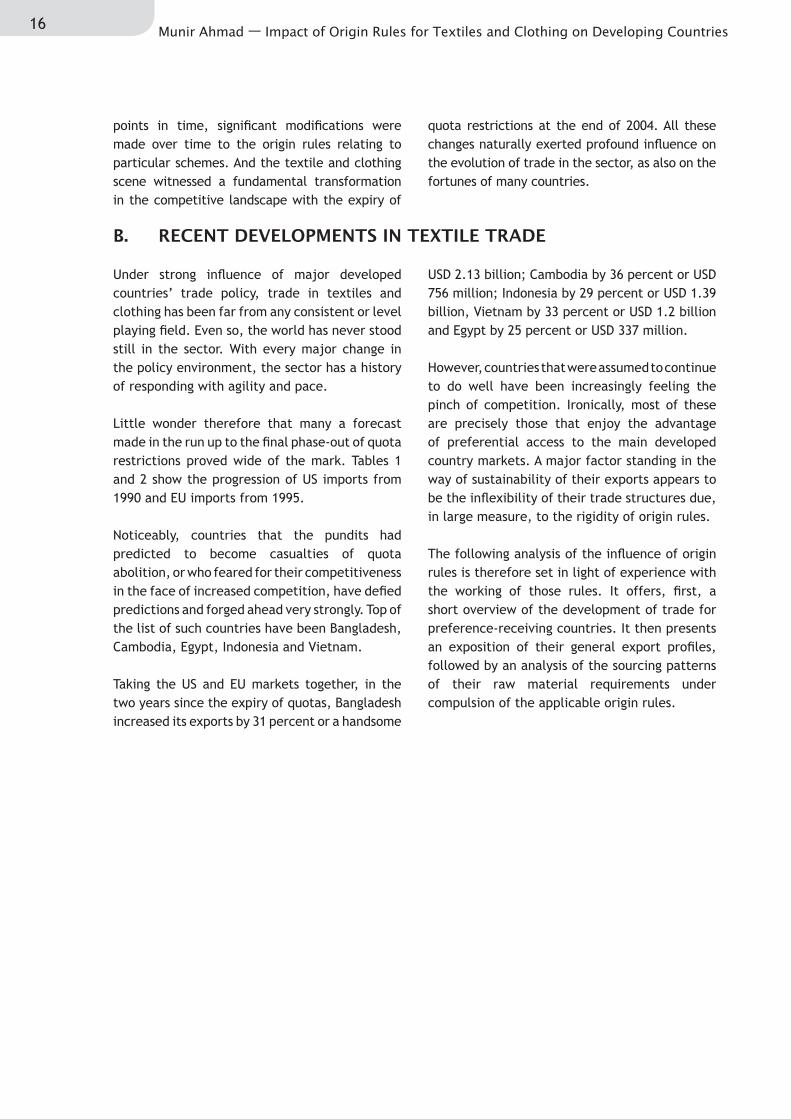
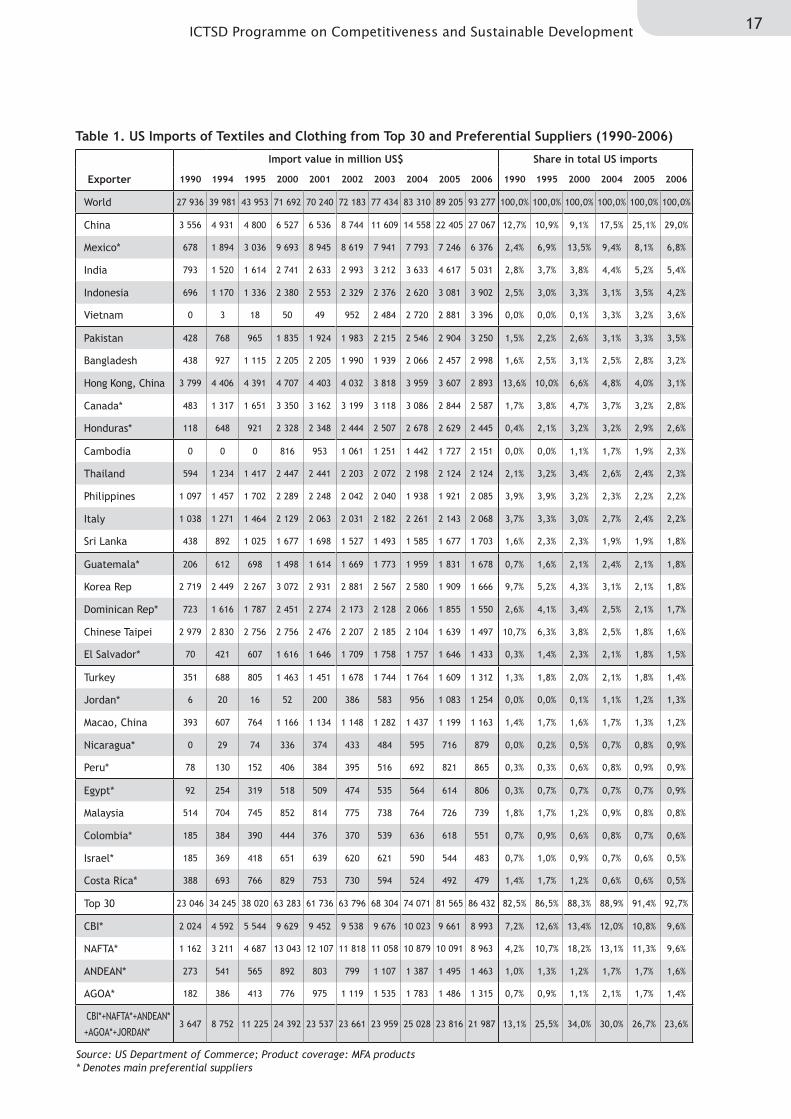
Little wonder therefore that many a forecast made in the run up to the final phase-out of quota restrictions proved wide of the mark. Tables 1 and 2 show the progression of US imports from 1990 and EU imports from 1995.
Noticeably, countries that the pundits had predicted to become casualties of quota abolition, or who feared for their competitiveness in the face of increased competition, have defied predictions and forged ahead very strongly. Top of the list of such countries have been Bangladesh, Cambodia, Egypt, Indonesia and Vietnam.
Taking the US and EU markets together, in the two years since the expiry of quotas, Bangladesh increased its exports by 31 percent or a handsome
USD 2.13 billion; Cambodia by 36 percent or USD 756 million; Indonesia by 29 percent or USD 1.39 billion, Vietnam by 33 percent or USD 1.2 billion and Egypt by 25 percent or USD 337 million.
However, countries that were assumed to continue to do well have been increasingly feeling the pinch of competition. Ironically, most of these are precisely those that enjoy the advantage of preferential access to the main developed country markets. A major factor standing in the way of sustainability of their exports appears to be the inflexibility of their trade structures due, in large measure, to the rigidity of origin rules.
The following analysis of the influence of origin rules is therefore set in light of experience with the working of those rules. It offers, first, a short overview of the development of trade for preference-receiving countries. It then presents an exposition of their general export profiles, followed by an analysis of the sourcing patterns of their raw material requirements under compulsion of the applicable origin rules.
17ICTSD Programme on Competitiveness and Sustainable Development
Table 1. US Imports of Textiles and Clothing from Top 30 and Preferential Suppliers (1990–2006)
Import value in million US$ Share in total US imports
Source: Eurostat; Product coverage: Section XI of HS excluding Agricultural products covered by WTO Agreement on Agriculture * Denotes main preferential suppliers
Table 2. EU-25 Imports of Textiles and Clothing from Top 30 and Preferential Suppliers (1995–2006)
19ICTSD Programme on Competitiveness and Sustainable Development
Source: US Department of Commerce, Eurostat, UN Comtrade. Note: Product coverage for US: MFA; EU and Canada: HS Section XI excluding agricultural products covered by WTO Agreement on Agriculture.
C. TRADE FLOWS UNDER pREFERENTIAL ARRANGEMENTS
The progression of trade from preference-receiving countries is summed up in Box 2 below. For purposes of this analysis preference-receiving countries are taken as those in receipt of both non-reciprocal and reciprocal preferences.
Insofar as the US market is concerned, in • 1990, i.e., before NAFTA, the share of NAFTA partners in US imports of MFA textiles and clothing was only 4.2 percent. By 2000, this share had leapt to 18.2 percent. Mexico’s share alone ballooned from 2.4 percent in 1990 to 13.5 percent in 2000.
The CBI countries likewise advanced from 7.2 percent of total US imports in 1990 to 13.4 percent in 2000.
Between 1990 and 2000 the share of AGOA countries had merely inched forward from 0.7 percent to 1.1 percent. With AGOA preferences becoming available towards the end of 2000, it advanced to 2.1 percent by 2004.
Box 2. US/EU-25/Canada Textiles and Clothing Imports from Selected Preferential Partners
20 Munir Ahmad — Impact of Origin Rules for Textiles and Clothing on Developing Countries
D. SOURCING OF RAW MATERIALS BY pREFERENCE-RECEIVING COUNTRIES
As noted in earlier sections, by virtue of applicable origin rules tariff preferences for most preference-receiving countries are closely linked to the use
of yarn and fabrics from preference-granting countries. In this sub-section we study the actual patterns of sourcing of textile materials
Jordan got on to the fast track by virtue of the duty-free access under US’s QIZ scheme in 2001. It consequently boomed from non-existent exports to capture 1.3 percent of the import market by 2006.
Overall, the combined share of NAFTA, CBI, Andean and AGOA countries and Jordan in US imports of MFA textile and clothing increased from 13.1 percent in 1990 to 34 percent in 2000, before declining to 23.6 percent in 2006.
On the EU market, too, Bulgaria and • Romania became relatively new entrants to the preference league. While Bulgaria increased its share of extra-EU imports from 0.9 percent in 1995 to 1.9 percent in 2004, Romania advanced from 2.8 percent to 6.3 percent in the same period. Under pressure of competition in the wake of expiry of quota restrictions, both these countries’ shares also declined in 2006: to 1.8 percent and 5 percent, respectively.
Morocco and Tunisia have been struggling as much as some established preferential supplier countries to the United States.
Canada granted duty free access with • vastly improved origin rules to least-developed countries from the beginning of 2003. On the back of this concession, LDCs share of Canadian imports increased from 1.9 percent in 2002 to 4.3 percent in 2003, and 5.9 percent in 2004. Of these, Bangladesh alone advanced from 1.3 percent in 2002 to 4.1 percent in 2004.
(i) Preferential suppliers’ export profile:Predominantly apparel and concentration on single markets
Most preference-receiving countries mainly export apparel products, owing largely to their small or, in most cases, non-existent indigenous capacities to produce textile materials (yarns and fabrics). Virtually all US imports from Costa Rica, the Dominican Republic, El Salvador, Guatemala, Haiti, Honduras, Nicaragua28, Jordan and almost all AGOA countries consist of apparel products. Even for Mexico, the share of apparel in its total textile and clothing exports to the US is about 84 percent. Compared to this, the share of clothing in US imports of textiles and clothing from China is 68 percent, India 63 percent, and Pakistan 43 percent.
A similar situation is to be observed on the EU market where 88 percent of Romania’s sector exports are apparel. The comparable percentages of other major preferential suppliers to this market are: Bulgaria 83 percent, Tunisia 91 percent, Bangladesh 95 percent, Morocco 96 percent, and Cambodia 100 percent.
It is also worth noting that exports of a majority of preference-receiving countries are concentrated on either the US or the EU market. Only a few – mainly Asian – countries’ exports are diversified over both these main markets. Thus, for example, in 2006 Mexico shipped USD 6,376 million worth of textile and clothing to the US, but just USD 121 million to EU-25. Similarly, Jordan’s exports to the US amounted to USD 1,254 million, but only USD 12 million to EU-25. On the other side of the Atlantic, Romania exported USD 5,004 million worth to EU-25, just USD 130 million to the US. Likewise, Tunisia’s exports to EU-25 were USD 3,374 million, but to the US only USD 49 million; and Morocco’s USD 3,100 million to the EU, only USD 102 million to the US.
21ICTSD Programme on Competitiveness and Sustainable Development
by various preference-receiving countries to assess the impact that these rules have on their competitiveness.
Ideally this analysis should be based on review of the preference-receiving countries’ own import streams. Unfortunately, however, the quality of available data in respect of these countries leaves much to be desired. In general, there are large gaps in their data sets. In many a case, the trade from export processing zones is not included in their export or import figures. Even a cursory comparison of export numbers found in the nationally-reported figures of many of these countries reveals wide differences from the related numbers in their import partners’ data.
Likewise, imports for their export processing zones are seldom reflected in their import figures.29
We are therefore obliged to turn to counterpart data from the preference-granting countries, unless otherwise stated in particular cases.
(i) Preference-receiving countries as captive markets for US/EU producers
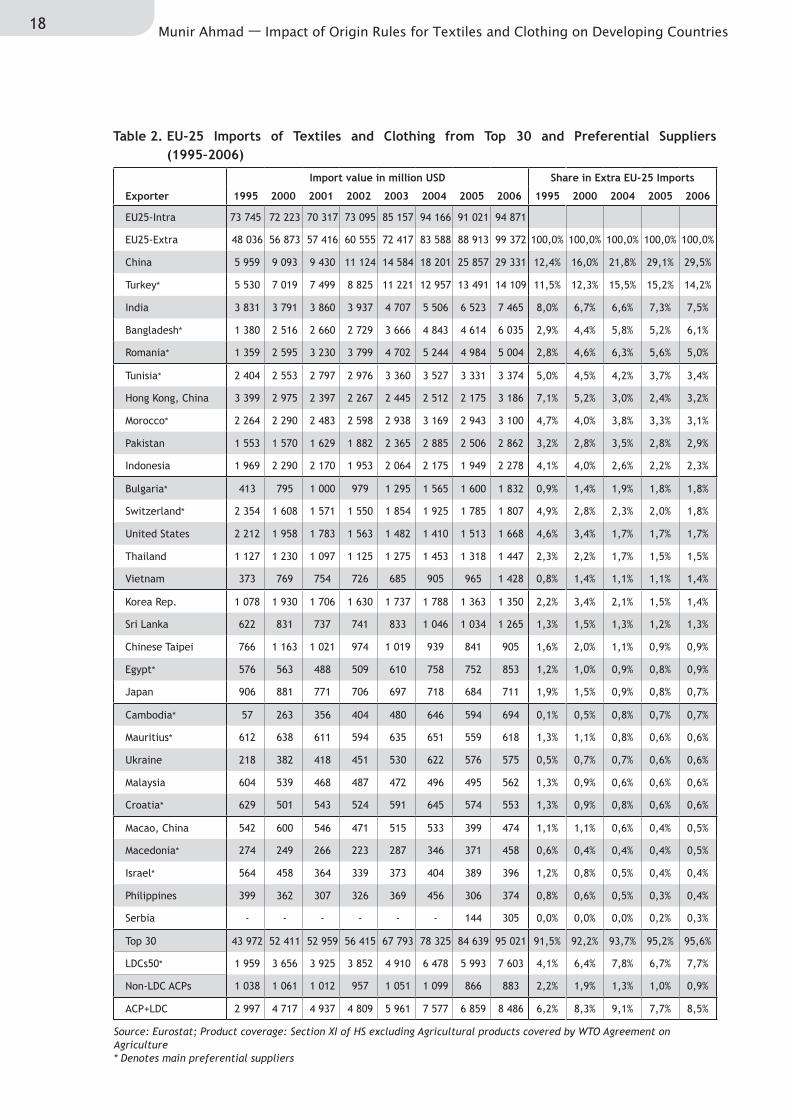
First, it should be instructive to cast a glance on the composition and direction of textile and clothing exports of the United States and the European Union themselves – the two main preference-granting economies. See charts 3A and 3B.
Chart 3A. US Exports of Textiles and Clothing to Preferential Partners
Chart 3B. EU Exports of Textiles and Clothing to Main Preferential Partners
22 Munir Ahmad — Impact of Origin Rules for Textiles and Clothing on Developing Countries
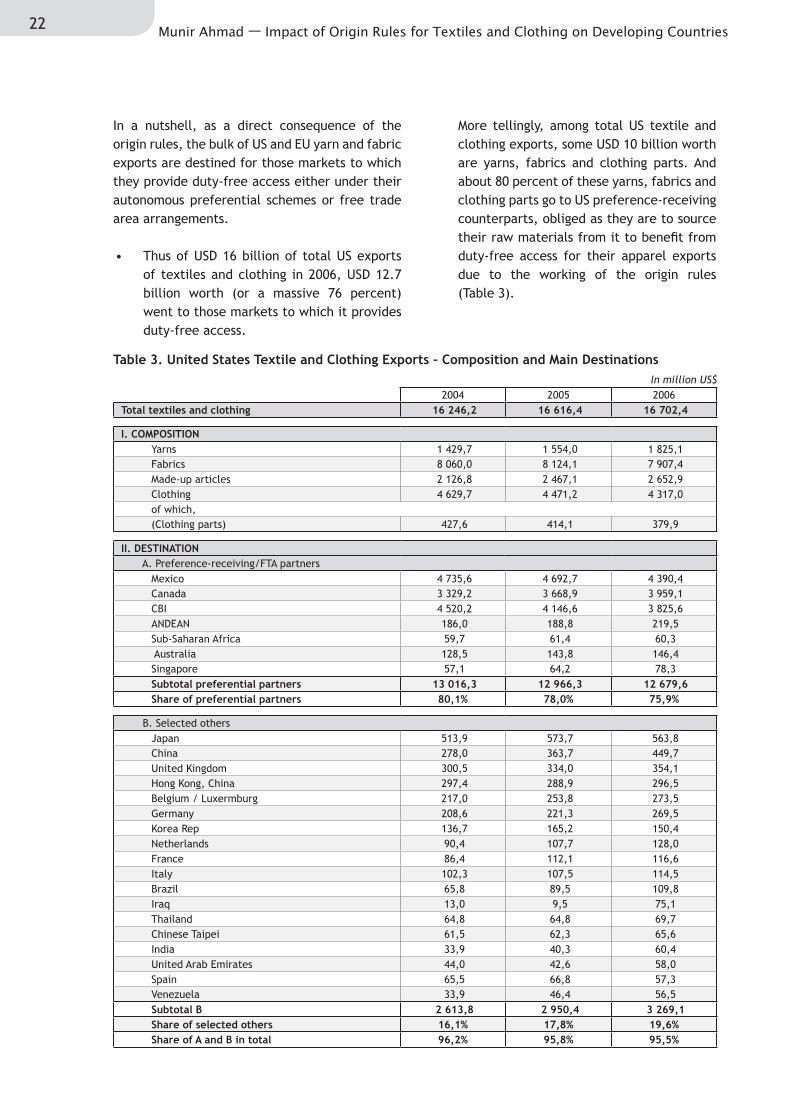
In a nutshell, as a direct consequence of the origin rules, the bulk of US and EU yarn and fabric exports are destined for those markets to which they provide duty-free access either under their autonomous preferential schemes or free trade area arrangements.
Thus of USD 16 billion of total US exports • of textiles and clothing in 2006, USD 12.7 billion worth (or a massive 76 percent) went to those markets to which it provides duty-free access.
More tellingly, among total US textile and clothing exports, some USD 10 billion worth are yarns, fabrics and clothing parts. And about 80 percent of these yarns, fabrics and clothing parts go to US preference-receiving counterparts, obliged as they are to source their raw materials from it to benefit from duty-free access for their apparel exports due to the working of the origin rules (Table 3).
Table 3. United States Textile and Clothing Exports – Composition and Main DestinationsIn million US$
B. others 1 911,9 2 088,3 2 357,5 Share of others 19,3% 20,7% 23,3%
Source: Compiled from US Commerce Department data Note: Clothing parts for this table are only HS lines: 611780, 611790, 6217.
A similar situation is found in the EU, • although the extent of its textile industry’s dependence on captive preference-receiving markets is not as pronounced as it is in the case of the United States. Thus, of the total extra-EU exports of USD 43 billion, well
over 40 percent goes to nine30 of its main preferential markets. More significantly, as in the case of the US, the largest share of its yarns, fabrics and clothing parts (about 55 percent) goes to those same preferential countries (Table 4).
Table 4. EU-25 Textiles and Clothing Exports – Composition and Main Destinations
In million US$
2003 2004 2005
Total textiles and clothing (Extra EU-25) 37 437,5 42 480,2 43 177,1
I. Composition
Yarns 2 484,1 3 260,3 3 090,3
Fabrics 10 782,6 12 108,9 11 477,8
Made-up articles 8 149,6 9 158,2 9 445,9
Clothing 15 740,0 17 585,6 18 454,4
of which,
(Clothing parts) 1 083,4 1 215,0 1 171,5
II. Destination
A. Main preference-receiving/FTA partners
Switzerland 3 919,5 4 358,5 4 453,5
Romania 3 124,3 3 625,2 3 426,8
Tunisia 2 144,8 2 282,6 2 097,8
Turkey 1 671,2 2 192,2 2 023,6
Morocco 1 864,5 1 955,4 1 862,6
Norway 1 183,0 1 276,3 1 315,3
Bulgaria 1 127,4 1 294,0 1 255,0
Croatia 712,5 775,1 758,8
Mexico 521,5 547,9 600,3
Subtotal main preferential partners 16 268,7 18 307,1 17 793,7
Share of main preferential partners 43,5% 43,1% 41,2%
24 Munir Ahmad — Impact of Origin Rules for Textiles and Clothing on Developing Countries
2003 2004 2005
B. Selected others
United States 5 205,3 5 756,2 5 673,6
Russia 1 839,2 2 425,8 3 037,2
Japan 2 211,8 2 288,3 2 282,1
Hong Kong, China 1 540,1 1 787,5 1 854,4
Ukraine 786,8 992,6 1 098,0
China 549,8 683,8 840,4
Korea Rep. 762,1 721,3 738,3
Canada 614,0 692,1 682,0
United Arab Emirates 382,5 633,8 674,8
Saudi Arabia 534,2 570,6 571,2
Australia 413,9 442,1 455,0
Israel 286,0 339,0 341,3
Chinese Taipei 284,2 324,1 333,1
Macedonia 254,4 302,4 313,0
South Africa 182,2 216,2 241,3
Bosnia and Herzegovina 171,4 197,7 240,5
India 177,0 202,4 233,0
Brazil 147,0 187,4 225,7
Lebanon 219,8 222,7 214,7
Belarus 175,4 188,7 211,2
Singapore 191,2 207,8 203,8
Albania 169,9 201,9 202,3
Serbia - - 201,2
Thailand 162,8 193,7 201,1
Subtotal B 17 260,9 19 778,0 21 069,2
Share in total 46,1% 46,6% 48,8%
Share of A and B in total 89,6% 89,7% 90,0%
III. Destination of yarns, fabrics, clothing parts
Total to world 14 350,1 16 584,2 15 739,6
A. Main preference-receiving/FTA partners
Romania 2 199,5 2 556,5 2 371,0
Morocco 1 558,1 1 598,3 1 467,3
Tunisia 1 471,3 1 569,1 1 420,6
Turkey 974,3 1 314,2 1 096,4
Bulgaria 666,6 776,2 760,4
Switzerland 532,2 613,6 595,9
Croatia 273,5 305,7 272,5
Mexico 182,6 185,2 190,3
Norway 118,0 122,8 119,2
Subtotal main preferential partners 7 976,0 9 041,6 8 293,6
Share of main preferential partners 55,6% 54,5% 52,7%
B. Others 6 374,1 7 542,6 7 445,9
Share of others 44,4% 45,5% 47,3%
Note: Clothing parts for this table are only HS lines: 611780, 611790, 6217. Source: Compiled from Eurostat data.
Table 4. continued
25ICTSD Programme on Competitiveness and Sustainable Development
It is important to note that, for purposes of this analysis, clothing parts were defined as only those covered by HS codes/headings 6117.80, 6117.90 and 62.17. As a matter of fact, however, unfinished or semi-finished articles31 of clothing are classified in the same headings as for the finished articles. Therefore taking only the three HS headings (as done here) significantly understates the true extent of US/EU exports of unfinished apparel. As a factual matter, traffic in unfinished apparel represents much larger trade between them and their preference-receiving partners than is captured in the HS codes earmarked for our calculations. Therefore, a better gauge is to look at US and EU total exports of textiles and clothing and compare them to their imports from the partner
preference-receiving countries. Much of the following analysis is on this basis.
(ii) Binding influence of origin rules onpreference-receiving countries’ sourcing of textile materials from preference-granting countries
Charts 4–7 are designed to show the flow of trade between the US and Mexico and CBI group of countries on one side and AGOA and the Andean country groups on the other. Separate charts relating to the Dominican Republic, El Salvador, Honduras and Jordan are provided in the Appendix. These are the main preferential exporters to the United States.
Chart 4. US Imports from Mexico Versus US Exports to Mexico
Chart 5. US Imports from CBI Versus US Exports to CBI Countries
26 Munir Ahmad — Impact of Origin Rules for Textiles and Clothing on Developing Countries
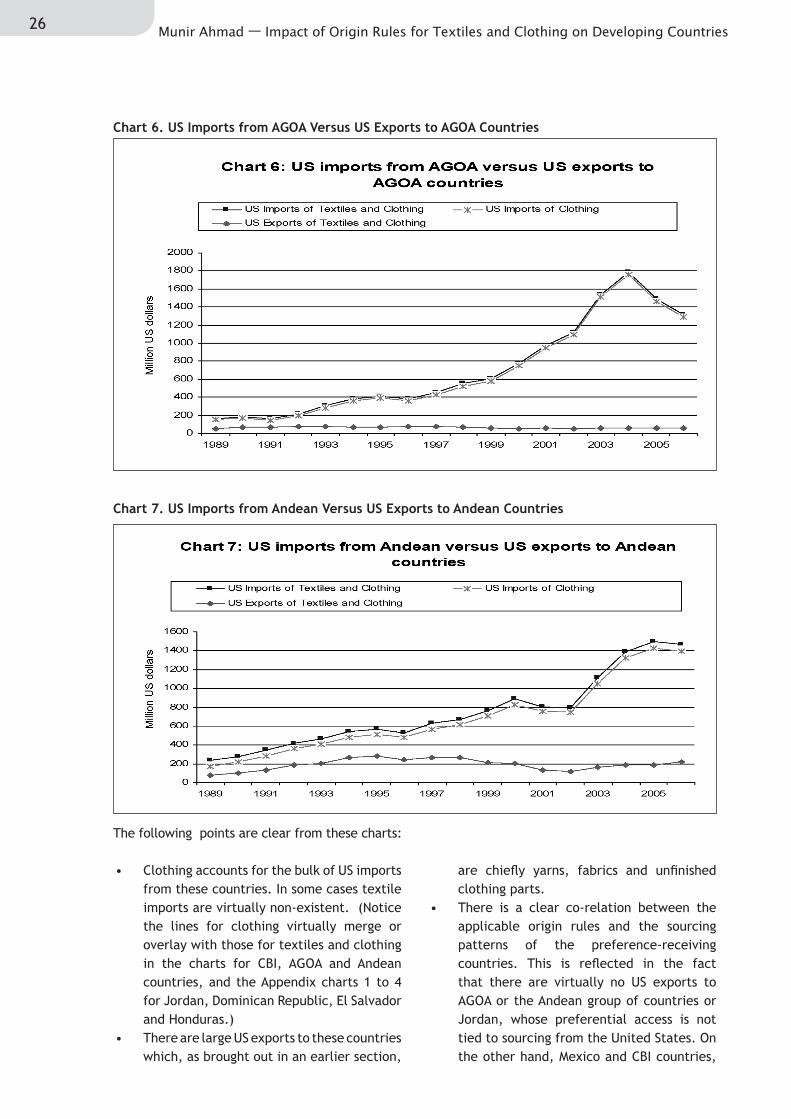
Chart 6. US Imports from AGoA Versus US Exports to AGoA Countries
Chart 7. US Imports from Andean Versus US Exports to Andean Countries
The following points are clear from these charts:
Clothing accounts for the bulk of US imports • from these countries. In some cases textile imports are virtually non-existent. (Notice the lines for clothing virtually merge or overlay with those for textiles and clothing in the charts for CBI, AGOA and Andean countries, and the Appendix charts 1 to 4 for Jordan, Dominican Republic, El Salvador and Honduras.) There are large US exports to these countries • which, as brought out in an earlier section,
are chiefly yarns, fabrics and unfinished clothing parts.There is a clear co-relation between the • applicable origin rules and the sourcing patterns of the preference-receiving countries. This is reflected in the fact that there are virtually no US exports to AGOA or the Andean group of countries or Jordan, whose preferential access is not tied to sourcing from the United States. On the other hand, Mexico and CBI countries,
27ICTSD Programme on Competitiveness and Sustainable Development
Chart 8. EU-25 Imports from romania Versus EU-25 Exports to romania
Chart 9. EU-25 Imports from Tunisia Versus EU-25 Exports to Tunisia
whose privileged access is linked to sourcing from the United States, are large recipients of US exports. While those bound by tight origin rules have • seen their exports either decline or struggle following the expiry of quota restrictions (as Mexico and the CBI), those that are not so obliged appear to be holding their own (notice especially the performance of
Jordan shown in Appendix Chart 4 and of the Andean countries in Chart 7 above!). A similar situation is to be found with respect to the EU’s relationship with Bulgaria, Morocco, Romania and Tunisia, on one hand, and Bangladesh or Cambodia on the other. All these are by far the largest and most representative of the preference-receiving exporters of clothing to the EU. See charts 8–13.
28 Munir Ahmad — Impact of Origin Rules for Textiles and Clothing on Developing Countries
Chart 10. EU-25 Imports from Morocco Versus EU-Exports to Morocco
Chart 11. EU-25 Imports from Bulgaria Versus EU-25 Exports to Bulgaria
29ICTSD Programme on Competitiveness and Sustainable Development
Chart 12. EU-25 Imports from Bangladesh Versus EU-25 Exports to Bangladesh
Chart 13. EU-25 Imports from Cambodia Versus EU-25 Exports to Cambodia
Here again there is a close nexus between EU imports from Bulgaria, Morocco, Romania and Tunisia and EU exports to these countries. They are obliged to source their raw material requirements from EU countries or, at most, from within the larger cumulation area. And, as for Jordan, Andean and AGOA countries in the United States, there are virtually non-existent EU exports to Bangladesh and Cambodia as these do not have to operate under any such bind.
It follows from the analysis presented in this section that rules of origin have closely tied the sustainability of many preference-receiving countries apparel exports to sourcing of textile materials from preference-granting countries with all the added costs that such sourcing entails – by way of the rigidity of production processes and additional administrative costs.
30 Munir Ahmad — Impact of Origin Rules for Textiles and Clothing on Developing Countries
IV. ORIGIN RULES AND DISTORTIONS IN TEXTILE TRADE
The raison d’être of rules of origin in preferential arrangements is to ensure that preferences primarily benefit the intended beneficiaries. A producer’s decision whether to export under the preferential tariff regime or under the MFN regime involves weighing the margin of preference it gets from the preference-granting country against the costs that compliance with rules of origin entails. If the cost of compliance with origin rules (including the cost of material that the producer is bound to source from the preference-granting country and the administrative costs involved in complying with the rules) is sufficiently lower
than the available preference, he would have the incentive to produce and export under the preferential programme. Failing that, he would be better off doing business under the normal MFN rates of tariff.
When origin rules are used to serve preference-granting country’s trade objectives, they distort the choice of producers of beneficiary countries, obliging them to use inputs from less efficient producers or constraining their options. Rules of origin thus impose the added burden of using a suboptimal mix of inputs.
A. LITTLE EVIDENCE OF ORIGIN RULES pROMOTING VERTICAL INTEGRATION
Some preference-giving countries contend that restrictive rules of origin can be a way of promoting the creation of a ‘vertically integrated’ sector in beneficiary countries and thus a way of facilitating the diversification of their production. In reality however there is no empirical evidence to support this argument. On the contrary, there is ample evidence to show that, in textile and clothing, the preference-granting countries in fact view these rules as a tool to promote the parochial interests of their politically well-entrenched domestic textile producers.
A simple statistic reflecting this phenomenon is to be noticed in the fact that, in 1989, a mere USD 297 million (or 8.2 percent) of US exports of textile mill products (mainly yarns and fabrics) went to the CBI countries; by 2004 they took USD 2.721 billion or 23.4 percent of the total. But when these countries came under pressure of competition following the abolition of quota restrictions, their 2006 purchases from the United States (i.e., US exports to these countries) declined in tandem to USD 2.605 billion or 21.04 percent of the total. See Chart 14.
Chart 14. US Imports of Textiles and Clothing from CBI and US Textile Mill Product Exports to CBI Countries
31ICTSD Programme on Competitiveness and Sustainable Development
On the other hand, hardly any preference-receiving countries have succeeded in creating indigenous textile production capacities on sustainable basis. Virtually all of them continue to meet the bulk of their textile requirements from preference-granting countries. The phenomenon is to be observed in the fact, firstly, that they all remain only exporters of apparel and, secondly, that for the preponderant portions of their exports they continue to access the preference-granting countries’ markets against precisely those provisions of the preference programmes that require the use of preference-granting countries’ inputs (see Box 1).
Besides the relative rigidity of their production processes, studies have also estimated that the cost of complying with administrative requirements of the preference programmes adds a further 3 percent to 5 percent to the cost of goods. Indeed, during the process of a study undertaken by the United States International Trade Commission, it reported having been told by US firms that “the benefit of trade preferences is diminished considerably or eliminated by US-content rules because US fabrics reportedly cost as much as 20 to 40 percent more than Asian fabrics”. 33
B. ORIGIN RULES AND SUB-OpTIMAL UTILIzATION OF pREFERENCES
The twin phenomena of the requirement to use sub-optimal mix of production materials and the cost of compliance with origin rules is also to be seen in the rates of utilization of preferences. Given that utilization requires the fulfillment of certain conditions (the most significant being the rules of origin criteria), assessing the extent to which eligible exports actually obtain preferential treatment is of great importance.
Despite the fact that tariffs on apparel products in the United States and the European Union are relatively high34 and therefore offer significant margins of preference, all export shipments from preference-receiving countries fail to fully benefit
from the preference programmes. Substantial portions of a number of countries’ shipments, in fact, entered paying normal MFN duties.
(i) Utilization under EU GSP programme
On the EU side, it is instructive to study the utilization rates of Bangladesh which is by far the most successful of least-developed countries’ exporters of apparel to the European Union and whose situation is generally representative of most countries that benefit from EU’s Everything-But-Arms or so-called GSP+ schemes. See Chart 15.
Chart 15. EU GSP Utilization rates by Bangladesh
32 Munir Ahmad — Impact of Origin Rules for Textiles and Clothing on Developing Countries
As noted before, EU origin rules in the context of its GSP preferences provide that, to benefit from duty concession, the exported product should be wholly produced in the exporting country and that if it is manufactured from inputs from other countries, it should have undergone sufficient working or processing in the exporting country which, in the case of textile and clothing products, is generally defined as manufacturing from yarn onwards, i.e., at least ‘double transformation’. Thus, for woven apparel, the production of fabric as well as the making up of fabric into apparel should have taken place in the country claiming GSP benefit. For knit apparel, the yarn used should also have been produced in the country claiming the benefit.35
Bangladesh (and many other least-developed as well as developing apparel exporting countries)36 lack sufficient textile manufacturing capacity of their own and rely on imports for their fabric and yarn requirements. Few are therefore able to take full advantage of EU’s duty concession. Even in the case of Bangladesh, which has successfully established significant yarn manufacturing capacity, only 60 percent of its apparel exports enter the EU under the duty concession programme.
Notably insofar as the apparel of knitted fabric (HS chapter 61) is concerned its yearly utilization rates have been quite high. However, for woven fabrics (HS chapter 62), which constitute about 45 percent of its total exports of clothing to the EU, Bangladesh’s utilization rate is only 28 percent. Since woven apparel exports are made with fabric imported from third countries, these are unable to fulfil the origin requirement and profit from tariff exemption.
(ii) Utilization under US preference programmes
With respect to the United States market, too, the utilization rates fall well below hundred percent. On average, only 68 percent of US imports from the group of CBI countries entered under the preference programme. For individual CBI countries, 84 percent of imports from the Dominican Republic, 81 percent from Honduras, 73 percent from Costa Rica and 70 percent
from El Salvador actually benefited from the programme in 2005; however, only 42 percent of imports from Guatemala and 36 percent from Nicaragua could take advantage of the duty-free programme. For Mexico, too, only about 83 percent qualified for NAFTA benefits, with the remaining 17 percent entering under MFN tariffs. Such is the impact of restrictive origin rules!
At the other end, liberal origin rules made it possible for much higher percentages of imports from AGOA countries to qualify and profit from the duty benefit. Thus the percentages of their exports entering the US under AGOA duty concession in 2006 were: Botswana 99 percent; Kenya 98 percent; Lesotho 99 percent; Madagascar 96 percent; Malawi 100 percent; Mauritius 93 percent; Namibia 100 percent; South Africa 89 percent and Swaziland 99 percent
(iii) Contrasting experience of preference utilization following origin rules reform
As shown in Section II, Canada extended complete duty-free access to imports of textile and clothing products from least-developed countries with affect from January 2003, with significantly relaxed origin rules with the only condition that at least 25 per cent of value addition on the apparel product must have taken place in the LDC exporting country. These changes saw an immediate spurt in LDC exports to Canada making it possible for them to increase their share of Canadian imports of clothing jump from 1.9 percent in 2002 before the reform of origin rules to 4.3 percent in 2003 and 5.9 percent in 2004 (see Box-2 and Chart 2 above).
Lessons about the importance of origin rules can also be learnt from comparison of the performance of apparel exports under the Everything-But-Arms (EBA) scheme of the European Union and the Africa Growth and Opportunity Act (AGOA) programme of the United States. Chart 16 shows the progression of African LDCs’ exports of clothing to the United States under AGOA and to the EU under GSP/EBA.
33ICTSD Programme on Competitiveness and Sustainable Development
Chart 16. EU-25 and US Clothing Imports from African Least-Developed Countries
AGOA’s relaxed origin rules helped the African LDCs increase their apparel exports to the United States, while their exports to the European market stagnated. It should be recalled in this connection that under the AGOA origin rules, African countries are able to bring in yarn and fabric from the most competitive third countries. And as shown elsewhere, in virtually all success stories of African LDCs’ apparel exports, these textile materials were brought in from other developing countries giving, at the same time,
a push to the growth of South-South trade (discussed in the following sub-section).
Indeed, researchers have also found the positive effects of growth in exports of apparel under AGOA on export growth in sectors other than apparel despite the fact that the margins of preference in other sectors are relatively much lower than in clothing owing to the low overall average tariff of less than 4 percent.
C. IMpEDIMENT TO DEVELOpMENT OF SOUTH-SOUTH TRADE
Analysis in this paper has highlighted how origin rules have been instrumental in shifting the demand for textile materials towards the preference-granting economies. Thus some USD 13 billion of all US textile and clothing
exports are destined towards countries bound to it by its preference programmes. Of this, USD 10 billion in fact consists of yarns, fabrics and clothing parts. (See Chart 17 and also Table 3 above.)
Chart 17. US Exports of Textiles and Clothing to Preferential Partners
34 Munir Ahmad — Impact of Origin Rules for Textiles and Clothing on Developing Countries
On the European side, too, USD 18 billion or so goes to a handful of its main preferential partners, of which USD 8–9 billion worth consists of yarns, fabrics and clothing parts (cf., Table 4 above).
Even at the risk of some repetition, it bears emphasizing that the shares of clothing parts in these figures do not fully capture the trade in unfinished clothing which, in fact, constitutes significant volumes of US/EU exports to their preferential partners. The actual exports of yarns, fabrics, clothing parts and unfinished clothing (ready for assembly into final clothing) from both the United States and the European Union may therefore be significantly higher than USD 10 and USD 8–9 billion.
In this context it should also be recalled from earlier analysis in this paper that where certain preference programmes allow the preference-receiving countries to source their inputs from other countries, virtually all their inputs are imported from developing countries. Thus, for example, under Jordan-US free trade agreement as well as the QIZ schemes, it is not compulsory to use US inputs. AGOA likewise permits the use of third country fabric. In both these cases, virtually all exports under the two programmes are made with non-US yarns and fabrics imported from other developing countries.
Viewing from the preference-receiving countries’ own data, Jordan imported textiles worth USD 681 million in 2005 of which only USD 3.6 million came from the United States, with by far the largest bulk coming from other developing countries. Similarly little textiles were sourced by Lesotho, Madagascar and Swaziland from the United States. These three African nations are among the most prominent success stories of apparel exporters following the enactment of AGOA duty benefits. A country-wise breakdown of these countries’ sourcing of textile imports is shown in Table 5.
On the EU side, most textiles by Morocco, Tunisia and Romania are sourced from EU countries. Thus over 80 percent of their imports of raw materials originated in the EU (Table 6).
By contrast, Bangladesh and Cambodia also enjoy duty-free access to the EU and are dependent on imports of textile materials for processing and export by their clothing industries. Yet, both these source little of their textile requirements from the EU countries.
According to the two countries’ import statistics in UN Comtrade database, Bangladesh imported USD 1.570 billion and Cambodia USD 0.909 billion worth of textiles37 in 2004, the latest year for which data are available. Of Bangladesh’s imports, only USD 20.8 million or 1.3 percent came from 25 member states of the EU and USD 10 million or 0.6 percent from the United States. Likewise, in the case of Cambodia, only USD 7 million or 0.8 percent came from EU-25 and USD 4 million or 0.4 percent from the United States. On the other hand, 97 percent of Bangladesh and 98 percent of Cambodia’s textiles came from developing countries (Table 7).
Finally, when Canada and Australia relaxed their origin criteria for duty-free imports from least-developed countries leading to a handsome spurt in export shipments from Bangladesh and Cambodia, there was little shift in their sourcing of textiles towards Canada or Australia (cf., Table 7).
In short, in virtually all cases in which the origin rules of preference-giving countries do not tie the preference to sourcing of textiles from the preference-giving countries, nearly all sourcing of textile requirements is from developing countries.
It is therefore not unreasonable to infer that, absent the origin rules’ conditionality of using preference-giving countries’ own textiles, most preference-receiving countries’ inputs would also quite likely be sourced from developing countries. Thus the conditionality is in fact impeding the development of trade among developing countries to the tune of as much as USD 20 billion annually.
35ICTSD Programme on Competitiveness and Sustainable Development
Jordan imports from Lesotho imports from Madagascar imports from Swaziland imports from
World 681 387 World 96 019 World 45 145 World 75 603
China 285 210 Hong Kong, China 31 375 China 16 045 Chinese
Taipei 28 522
Chinese Taipei 96 999 China 16 671 India 5 164 Hong Kong, China 16 840
Israel 65 918 South Africa 15 490 France 4 151 South Africa 13 519
Hong Kong, China 47 775 Chinese Taipei 10 553 Belgium 2 952 China 11 404
Developing country share 97,3% 97,4% 98,1% 97,6% 98,3%
EU-25 share 0,4% 0,8% 0,7% 1,0% 0,8%
Note: Product coverage: HS Chapters 50-60 and 63 XI excluding tariff lines covered by WTO Agreement on Agriculture.
Source: UN Comtrade.
39ICTSD Programme on Competitiveness and Sustainable Development
D. IMpACT ON NAMA NEGOTIATIONS
Like in all previous efforts aimed at securing the liberalization of trade, textile and clothing has again emerged as a complex issue in the ongoing Doha Round negotiation. As MFN tariff reductions are certain to erode the margins of tariff preferences currently available to a number of preference-receiving countries, they are understandably concerned about the continued viability of their export sectors. There are calls for a special sectoral dispensation on textiles outside the framework of a general formula approach that has otherwise been accepted as the main modality for effecting reductions in tariffs in the context of non-agricultural market access (NAMA) negotiations.38 Similarly, as a consequence of the competitive difficulties felt by the same group of countries, there is a push for establishing a work programme on textiles under the normal work of the WTO’s Council for Trade in Goods.39
In fact, as shown by the analysis in this paper, the rigidity of origin rules constitutes a serious bottleneck for the viability of apparel exports of many preference-receiving countries. Besides the added costs involved in complying with these rules, their problems are made all the more complex by the fact that certain aspects of the preference programmes, principally relating to specific origin rules, are beset with uncertainty. The so-called ‘third-country fabric’ provision of AGOA is due to expire by 2012 and the passage of the US Andean programme gets bogged down in domestic political dynamics in the United States every now and then. And as if that were not enough, the prospect of every new FTA throws up potentially new competitors leading thereby to added competition among preferential suppliers. In the event, it is of utmost importance that all stakeholders devote urgent attention to mending the origin rules.
E. THE NEED TO FIX THE RULES OF ORIGIN CONUNDRUM
In this context, it is important to clarify a common misconception. Certain quarters argue that the problem of origin rules is linked to the existence of relatively high tariffs in the sector and that after these tariffs are reduced as a result of Doha Round, the origin rules will become inconsequential. Several points are in order to dispel this misconception.
First, even after the cuts resulting from a successful conclusion of Doha negotiations, tariffs on highly traded textile and clothing products will remain a lot higher than average tariffs on industrial products, especially in Canada, the European Union and the United States. It may be recalled in this context that current rates of tariff on such products (mainly apparel) are 17-18 percent in Canada, 12 percent in the EU, and 19-20 percent in the United States (with the US rates on some highly traded items going up to 32 percent). Even the most ambitious tariff-cutting scenario currently under discussion in Doha negotiations would leave tariffs at 6 percent in Canada, 5 percent in the EU, and 6-7 percent in the United States. The tariffs in some
developing countries who may wish to extend duty-free concession, say, to the least-developed countries, may be higher still. Considering that textile and clothing trade is subject to extremely tight and competitive margins of profit, these rates would still offer significant, commercially meaningful, margins of preference.
In this regard, it is important to note the following: After full implementation of Uruguay Round commitments, the normal MFN tariff on apparel in the EU, for example, has been/is 12 percent. However, due to the availability of GSP benefit, which offers a reduction of 20 percent on this rate, most developing countries were/are effectively subject to a tariff of 9.6 percent while the least-developed countries enjoy complete duty-free access by virtue of the EU’s Everything-But-Arms scheme. The margin of preference for least-developed and other countries is therefore 9.6 percentage points. Now consider that, with this margin of preference, Bangladesh was able to increase its share of EU-25 imports of apparel from 3.9 percent in 1995 to 7.7 percent in 2006. On the other hand,
40 Munir Ahmad — Impact of Origin Rules for Textiles and Clothing on Developing Countries
India’s share (which did not enjoy this margin) barely moved; in fact it decreased from 6.5 percent in 1995 to 6.3 percent in 2006.40 That being the case, the question to ponder is whether the reduction in margin of preference from 9.6 percent to 5 percent after full implementation of Doha results would become meaningless for preference-receiving countries like Bangladesh. The answer, self-evidently, has to be ‘no’.
Second, as a practical matter, the implementation of tariff reductions, especially on major traded products, is unlikely to be immediate; it would likely be spread over a period of 7–8 years.
Third, leaving aside the applicable tariffs, diverse origin rules per se create what has come to be referred to as the ‘spaghetti bowl’ effect (not to speak of the well-known trade suppression or trade diversion effects).
Fourth, the design of the origin rules prevalent in textiles and clothing (and brought out at some
length in this paper) are inherently protectionist, tying the availability of preferences to the use of inputs made in preference-granting countries. They render the preference-receiving countries hostage to the use of those inputs whereas, in the fiercely competitive world of textiles, producers need all possible flexibility to stay ahead of the pack. Indeed flexibility will be the key to success in the future, especially after tariffs come down to where they are expected following the full implementation of Doha Round results.
Finally, restrictive origin rules constrain the preference-receiving countries’ prospects for attracting foreign direct investment from sources in Asia that are fast becoming the most efficient textile-producing locations.
Hence the importance of fixing the rules of origin conundrum! Indeed, the fact that Doha results are likely to reduce the margins of preference for a large number of developing countries argues in favour of urgent action in that direction.
41ICTSD Programme on Competitiveness and Sustainable Development
V. CONCLUDING REMARKS
After abolition of the quota system that had long governed international trade in textiles and clothing, there were bound to be adjustment pressures. Developing countries that were expected to do well largely fulfilled those expectations. The predictions of massive disruptions for some others did not however materialize and in fact proved unfounded. It was perhaps hard for econometric models 41 to capture the effect of all the periodic changes that have been the hallmark of major developed countries’ trade policy in this sector.
Several developing countries that were assumed to fall victim to heightened competition have been holding their own or even increasing their share of the pie. Some others that the pundits had forecast to do well have found the goings to be tough. Ironically, most of these are precisely those that continue to enjoy a substantial advantage in the shape of preferential tariff access of as much as 16 percent on average to the US and 12 percent to the EU. In most cases, these countries are also located in close proximity to the main developed country markets, thereby enjoying lower transportation costs. This paper argues that a major obstacle standing in their way is the rigidity of origin rules that ties their apparel sectors to the sourcing of essential textile inputs from their benefactor countries.
The paper traces, first, the overarching influence that the quota regime has had on the making and evolution of origin rules related to the sector. It shows that much of what is found in these rules is a vestige of the quota system and therefore responsible for the continuation of a host of distortions.
For one thing, whether it is in the context of non-preferential or preferential trade, the origin rules are far from uniform. For another, the design of the preferential rules is heavily biased in favour of advantaging the domestic textile producers of preference-granting countries which happen, in the main, to be the major developed economies.
The paper, then, shows how preferential access granted by the United States and the European Union is tied to the use of essential textile inputs of yarns and fabrics produced in the preference-giving countries (together, indeed, with a host of related services). It demonstrates on the basis of concrete evidence how, on the one hand, the countries bound by such rigid criteria are held back in the competitive race while, on the other hand, how in every instance in which origin rules were liberalized the preference-receiving countries were able to make rapid increases in their exports.
The paper highlights the fact that, on the back of origin rules, the preference-granting countries gain access for their yarn and fabric producers to captive markets in preference-receiving countries. And given that in virtually every recent example of relaxation of origin rules the sourcing of these inputs had been entirely from other developing countries, it is not unreasonable to assume that the conditional origin rules are impeding the development of trade among developing countries to the tune of at least USD 20 billion.
All in all, the paper finds that the origin rules relating to the sector are complex, carry deep imprints of the quota regime with many of its distorting effects, are a major factor in sub-optimal utilization of preferential access, constitute an obstacle to the sustainability of many a country’s apparel exports, deprive the developing world of over USD 20 billion worth of South-South trade, and are an impediment to further liberalization of trade.
Yet, beyond academic analysis and discussion, the issue of origin rules has still to rise to the stage of serious consideration or negotiation at the multilateral level. The WTO Ministerial held in Hong Kong in December 2005 did agree to the need for measures to provide effective market access including through simplified rules of origin, however only in the context of exports from least-developed countries42 whereas the problem affects a much wider group of
42 Munir Ahmad — Impact of Origin Rules for Textiles and Clothing on Developing Countries
developing economies. In fact, it extends to the broader issue of development itself.
Fortunately, in relaxing their origin criteria, Canada and Australia have shown the way forward. So has, indeed, the United States through its own scheme for Qualifying Industrial Zones in Jordan and Egypt. The challenge for policy-makers is to see how the elements contained in these rules could be weaved into a broader effort in support of further liberalization of trade and the development of developing countries. In fact the problem of erosion of tariff preferences highlighted by the ACP group of countries in WTO negotiations offers an opportunity to address the issue without waiting for a new multilateral mandate.
The creators of the WTO had long since accepted the need for ensuring that rules of origin do not create unnecessary obstacles to trade. In the preamble to the Uruguay Round Agreement on Rules of Origin they also expressed the consensus “to ensure that origin rules are prepared and applied in an impartial, transparent, consistent and neutral manner.” The time is ripe to pick up the thread and work towards harmonization of preferential origin rules to bring some order to the spaghetti bowl. The task in fact is overdue, given in particular the impending dilution of preferences as a result of Doha Round reductions in tariffs.
43ICTSD Programme on Competitiveness and Sustainable Development
ENDNOTES
For a complete history see Bagchi, S. (2001).1
T.D. 84-171, 18 Cust. B. & Dec. 480 (1984) 2
T.D. 85-38, 19 Cust. B. & Dec. 1 (1985)3
Public Law. 103rd Congress, 8 December 1994: 103-465. 4
Through the Trade Development Act of 2000.5
Council Regulation No. (EEC) 2913/92 dated 12 October 1992.6
Commission Regulation (EEC) No.2454/93 dated 2 July 1993.7
Arrangement Regarding International Trade in Textiles and Clothing, 1974, Paragraph 6 of Article 6.8
Textiles Surveillance Body, General Agreement on Tariffs and Trade (GATT), COM.TEX/SB/1394, 9 US notification of a bilateral agreement between the United States and Mexico under Article 4:4 of the Arrangement Regarding International Trade in Textiles.
The trade vehicle under the CBI was the Caribbean Basin Economic Recovery Act (CBERA), 1983. 10
It should be noted that the 18.9 percentage share in 1990 had itself been reached courtesy of 11 export increases since the launching of these special programmes in 1984.
For instance, parts of a jacket are classifiable in the same HS code 62.03 as the fully 12 finished jacket.
US International Trade Commission (1988). 13
The European GSP for LDCs grants duty-free access to least-developed countries and is also 14 known as “Everything-But-Arms” (EBA) initiative.
The trade vehicle under this programme was by Caribbean Basin Economic Recovery Act. It has 15 since been amended by Caribbean Basin Trade Promotion Act (CBTPA).
Under AGOA, the lesser-developed countries are defined as those with per capita income of 16 1500 USD or less. In addition, US Congress designated Botswana and Namibia as lesser-developed countries and also designated Mauritius as such but only through September 2005.
AGOA’s “third country fabric” provision is through 30 September 2012 and, as currently written, 17 the Andean trade preference benefits’ law runs up to 29 February 2008. (See also note 23.)
US President’s Proclamation No. 6955 dated 14 November 1996 “To provide, pursuant to Section 18 9 of the United States-Israel Free Trade Area Implementation Act 1985, for Duty Free Treatment to the Products of the West Bank and Gaza Strip and Qualifying Industrial Zones” .
www.usembassy-amman.org.jo/QIZ.htm19
44 Munir Ahmad — Impact of Origin Rules for Textiles and Clothing on Developing Countries
www.qizegypt.gov.eg/www/english/index.asp20
See Canada’s notification to the WTO Committee on Trade and Development WT/COMTD/N/15/21 Add.1 dated 13 February 2003.
See Australia’s notification to the WTO Committee on Trade and Development WT/COMTD/N/18 22 dated 21 January 2004.
The Andean Trade Preference Act enacted in December 1991 expired on 4 December 2001. It was 23 renewed retroactively on 6 August 2002 under the Andean Trade Promotion and Drug Eradication Act (ATPDEA). The first Act excluded textiles and clothing from duty-free treatment. The 2002 Act extended for the first time duty free treatment to imports of certain textiles and apparel from Andean countries subject to specified ceilings and origin rules. This Act was due to expire at the end of June 2007. For Colombia and Peru, which have in the meantime concluded FTAs with the United States, the Act contained the possibility of a further six-month extension through 31 December 2007. In view of the impending approval of these FTAs by the United States Congress, the ATPDEA has since been extended through 29 February 2008.
Textiles Surveillance Body, General Agreement on Tariffs and Trade, COM.TEX/SB/1394: US 24 notification of a bilateral agreement between the United Sates and Mexico under Article 4:4 of the Arrangement Regarding International Trade in Textiles
See note 16. 25
African Investment Incentive Act of 2006, enacted as Division D, Title VI of the Tax Relief and 26 Health Care Act of 2006 (Public Law 109-432), See Section 6001 and 6002.
See notes 21-22 supra. 27
These countries have been the main suppliers from amongst the group of beneficiaries under the 28 CBI programme.
For example, Honduras’ national statistics in Anuario Estadístico del Comercio Exterior report 29 textile and clothing exports of merely 36 million USD in 2005 whereas, according to the United States data, it alone imported 2.6 billion USD worth of these products from Honduras. Furthermore, Honduras’ statistics show total imports of 127 million USD in 2005, whereas US data show US exports to Honduras worth 1.4 billion USD. Likewise, Dominican Republic reports 2005 imports of 94 million USD only, but the US data report US exports to the Dominican Republic of 1.1 billion USD. Similar discrepancies run across a number of other countries’ figures as well. They seem to result mainly from the non-inclusion of trade taking place through export processing zones. (The product coverage of textiles and clothing for purposes of these illustrations was taken as HS Section XI ‘Textiles and Textile Articles’. The numbers may not therefore fully tally with figures shown elsewhere in this paper.)
For instance parts of a jacket are classifiable in the same HS code 62.03 as the fully 31 finished jacket.
45ICTSD Programme on Competitiveness and Sustainable Development
See, for example, Francois, Hoekman and Manchin (2005); US International Trade Commission 32 (US-ITC) (2004); UNCTAD (2003).
US-ITC (2004).33
An average of over 19 percent on major traded products in the USA and a uniform 12% in the EU.34
As explained earlier, under special arrangements, countries belonging to prescribed regional 35 groupings are allowed the possibility of using fabric or yarn obtained from other countries of the region, called “cumulation”.
Such as Cambodia, the Philippines and Sri Lanka.36
Textiles defined as HS Chapters 50-60 and 63, however, excluding those agricultural products 37 that are covered by the WTO Agreement on Agriculture, namely, raw silk and silk waste; wool and animal hair; raw cotton, waste and cotton carded or combed; raw flex and raw hemp. These figures are therefore exclusive of the imports of clothing.
See WTO Negotiating Group on Market Access. “Towards NAMA Modalities”. Job(06)/200. 38
See, for example, Turkey’s submissions in WTO documents G/C/W/522, G/C/W/549 and 39 G/C/W/573.
Since the abolition of quota restrictions from the end of 2004, India’s share of EU-25 imports of 40 apparel increased from 5% in 2004 to 6.3% in 2006. The comparable shares for Bangladesh moved from 7.5% in 2004 to 7.7% in 2006, signifying that Bangladesh was not only able to hold its own but also to improve its position a notch, notwithstanding the heightened competition. (These percentages are with respect to apparel, the mainstay of Bangladesh exports, and are therefore different from those in Table 2 and Box 2 which relate to textiles and apparel combined. The tariff preference of 9.6 percent is also on apparel.)
See, for example, Nordas, H.K. (2004); Mlachila, M. and Yang, Y.; Martin, W., et el. (2004). 41
See paragraph 47 and Annex F “Decision on Measures in Favour of Least-Developed Countries” in 42 Hong Kong Ministerial Conference Declaration, WT/MIN(05)/DEC, dated 22 December 2005.
46 Munir Ahmad — Impact of Origin Rules for Textiles and Clothing on Developing Countries
REFERENCES
Bagchi, S. (2001). International Trade Policy in Textiles – Fifty Years of Protectionism. International Textiles and Clothing Bureau (ITCB). Geneva. Switzerland. June 2001.
US International Trade Commission (1988). Imports Under Items 806.30 and 807.00 of the Tariff Schedules of the United States, 1984-87. US ITC Publication 2144. December 1988, Chapter 4.
Francois, j., Hoekman, B. and Manchin, M. (2005). “Preference Erosion and Multilateral Liberalization”. CEPR Discussion Paper 5153.
US International Trade Commission (2004). Textiles and Apparel, Assessment of the Competitiveness of Certain Foreign Suppliers to the US Market. Investigation No. 332-448. January 2004: 3-6.
UNCTAD (2003). Trade Preferences for LDCs: An Early Assessment of Benefits and Possible improvements. United Nations. Geneva. Switzerland.
Nordas, H.K., (2004). The Global Textile and Clothing Industry Post the Agreement on Textiles and Clothing. WTO Discussion Paper No.5.
Mlachila, M. and Yang, Y. (2004). The End of Textiles Quotas: A Case Study of the Impact on Bangladesh. IMF Working Paper 108.
Martin, W., Manole, V. and van den Mensbrugghe, D. (2004). “Dealing with Diversity: Analyzing the Consequences of Textile Quota Abolition”, presented at 7th annual conference on Global Economic Analysis, Washington D.C.
47ICTSD Programme on Competitiveness and Sustainable Development
Appendix Table: Countries covered by non-reciprocal preference schemes
Countries under the EU’s Main Preference Programmes:
Least-Developed Countries (GSP/Everything-But-Arms)
African, Caribbean and Pacific Island States, under the Cotonou Agreement
Angola* Gabon Papua New Guinea
Antigua and Barbuda Gambia, The* Rwanda*
Bahamas Ghana St Kitts and Nevis
Barbados Grenada St Lucia
Belize Guinea* St Vincent and the Grenadines
Benin* Guinea-Bissau* Samoa*
Botswana Guyana Sao Tomé and Principe*
Burkina Faso* Haiti * Senegal*
Burundi* Jamaica Seychelles
Cameroon Kenya Sierra Leone*
Cape Verde* Kiribati* Solomon Islands*
Central African Republic* Lesotho* Somalia*
Chad* Liberia* South Africa
Comoros* Madagascar* Sudan*
Congo, Dem. Rep. of the* Malawi* Suriname
Congo, Republic of the Mali* Swaziland
Cook Islands Marshal Islands Tanzania, United Rep. of *
Cote d’Ivoire Mauritania* Togo*
Cuba Mauritius Tonga
Djibouti* Micronesia Trinidad and Tobago
Dominica Mozambique* Tuvalu*
AppENDIX
48 Munir Ahmad — Impact of Origin Rules for Textiles and Clothing on Developing Countries
Dominican Republic Namibia Uganda*
East Timor Nauru Vanuatu*
Equatorial Guinea* Niger* Zambia*
Eritrea* Nigeria Zimbabwe
Ethiopia* Niue
Fiji Palau
* These countries are also covered by the GSP/Everything-But-Arms initiative for LDCs.
Countries under US Preferences:
Caribbean Basin Initiative Countries
Anguilla Dominican Republic* Netherlands Antilles
Antigua El Salvador* Nicaragua*
Aruba Grenada Panama
Bahamas Guatemala* St Kitts and Nevis
Barbados Guyana St Lucia
Belize Haiti St Vincent and the Grenadines
British Virgin Islands Honduras* Trinidad and Tobago
Costa Rica* Jamaica
Dominica Montserrat
Africa Growth and opportunity Act Countries
Angola Gabon Nigeria
Benin Gambia Rwanda
Botswana Ghana Sao Tomé and Principe
Burkina Faso Guinea Senegal
Burundi Guinea-Bissau Seychelles
Cameroon Kenya Sierra Leone
Cape Verde Lesotho Somalia
Central Africa Liberia South Africa
Chad Madagascar Sudan
Comoros Malawi Swaziland
Congo Mali Tanzania, United Rep. of
Ivory Coast Mauritania Togo
Djibouti Mauritius Uganda
Equatorial Guinea Mozambique Zambia
Eritrea Namibia Zimbabwe
Ethiopia Niger
Andean Trade Promotion Act Countries
Bolivia Ecuador
Colombia Peru
* These countries have since concluded an FTA with the United States. The FTA has also become effectiveforfiveofthem.TheCBIbenefitsnolongerapplyforthesecountries.CostaRicahasnotyetratifiedandtheFTAhasnotthereforeyetenteredintoforceforit.
49ICTSD Programme on Competitiveness and Sustainable Development
Appendix Chart 1. US Imports from Dominican republic Versus US Exports to Dominican republic
Appendix Chart 2. US Imports from El Salvador Versus US Exports to El Salvador
50 Munir Ahmad — Impact of Origin Rules for Textiles and Clothing on Developing Countries
Appendix Chart 3. US Imports from honduras Versus US Exports to honduras
Appendix Chart 4. US Imports from Jordan Versus US Exports to Jordan
SELECTED ICTSD ISSUE PAPERSInternational Trade in Agriculture and Sustainable Development
Implications of Proposed Modalities for the Special Safeguard Mechanism: A Simulation Exercise. Issue Paper No.10 by Raul Montemayor, 2007.
Trade and Sustainable Land Management in Drylands. Selected Issue Briefs, 2007.
A Comparison of the Barriers Faced by Latin American and ACP Countries' Exports of Tropical Products. Issue Paper No. 9 by Jean-Christophe Bureau, Anne-Célia Disdier and Priscila Ramos, 2007.
South–South Trade in Special Products. Issue Paper No. 8 by Christopher Stevens, Jane Kennan and Mareike Meyn, 2007.
The ACP Experience of Preference Erosion in the Banana and Sugar Sectors: Possible Policy Responses to Assist in Adjusting to Trade Changes. Issue Paper No. 7 by Paul Goodison, 2007.
Trade and the Environment
Trade in Environmental Goods and Services and Sustainable Development: Domestic Considerations and Strategies for WTO Negotiations. Policy Discussion Paper, 2007.
Technology Transfer Issues in Environmental Goods and Services: An Illustrative Analysis of Sectors Relevant to Air-pollution and Renewable Energy. Issue Paper No. 6 by Lynn Mytelka, 2007.
Building Supply Capacity for Environmental Services in Asia: The Role of Domestic and Trade Policies. Issue Paper No. 5 by Aparna Sawhney, 2007.
An Overview of Key Markets, Tariffs and Non-tariff Measures on Asian Exports of Selected Environmental Goods. Issue Paper No. 4 by Rokiah Alavi, 2007.
Dispute Settlement and Legal Aspects of International Trade
Compliance and Remedies against Non-Compliance under the WTO System: Towards A More Balanced Regime for All Members. Issue Paper No. 3 by Virachai Plasai, 2007.
Access to Justice in the WTO: The Case for a Small Claims Procedure, A Preliminary Analysis. Issue Paper No. 2 by Håkan Nordström and Gregory Shaffer, 2007.
Appeal Without Remand: A Design Flaw in the WTO Dispute Settlement System. Issue Paper No. 1 by Joost Pauwelyn, 2007.
Trade in Services and Sustainable Development
Opportunities and Risks of Liberalising Trade in Services: Case Study on Bangladesh. Issue Paper No. 3 by Ananya Raihan and Mabroor Mahmood, 2007.
Intellectual Property Rights and Sustainable Development
Intellectual Property and Competition Law: Exploring Some Issues of Relevance to Developing Countries. Issue Paper No. 21 by Carlos M. Correa, 2007.
Intellectual Property Provisions in European Union Trade Agreements: Implications for Developing Countries. Issue Paper No. 20 by Maximiliano Santa Cruz S., 2007.
Maintaining Policy Space for Development: A Case Study on IP Technical Assistance in FTAs. Issue Paper No. 19 by Pedro Roffe and David Vivas with Gina Vea, 2007.
New Trends in Technology Transfer: Implications for National and International Policy. Issue Paper No. 18 by John H. Barton, 2007.
Fisheries, International Trade and Sustainable Development
Fisheries, International Trade and Sustainable Development. Policy Discussion Paper, by ICTSD, 2006.
Aquaculture: Issues and Opportunities for Sustainable Production and Trade. Issue Paper No. 5 by Frank Asche and Fahmida Khatun, 2006.
Market Access and Trade Liberalisation in Fisheries. Issue Paper No. 4 by Mahfuz Ahmed, 2006.
Trade and Marketplace Measures to Promote Sustainable Fishing Practices. Issue Paper No. 3 by Cathy Roheim and Jon G. Sutinen, 2006.
Fisheries Access Agreements: Trade and Development Issues. Issue Paper No. 2 by Stephen Mbithi Mwikya, 2006.
Trade and Sustainable Energy
Intellectual Property and Access to Clean Energy Technologies in Developing Countries: An Analysis of Solar Photovoltaic, Biofuel and Wind Technologies. Issue Paper No. 2 by John H. Barton, 2007.
Climate, Equity, and Global Trade. Selected Issue Briefs No. 2, 2007.
The WTO and Energy: WTO Rules and Agreements of Relevance to the Energy Sector. Issue Paper No. 1 by Julia Selivanova, 2007.
Linking Trade, Climate and Sustainable Energy. Selected Issue Briefs, 2006.
These and other ICTSD resources are available at http://www.ictsd.org/pubs/series.htm.
Other publications from ICTSD’s Programme on Competitiveness and Sustainable Development include:
• Special and Differential Treatment for Small and Vulnerable Countries Based on the Situational Approach. Issue Paper No. 2 by Werner Corrales-Leal, Felipe Baritto, and Sarah A. Mohan, 2007.
• Basic Concepts and Proposals on the use of Policy Spaces in Trade-supported Strategies for Sustainable Development. Issue Paper No. 1 by Werner Corrales-Leal, 2007.
ABOUT ICTSD
Founded in 1996, the International Centre for Trade and Sustainable Development (ICTSD) is an independent non-profit and non-governmental organisation based in Geneva. By empowering stakeholders in trade policy through information, networking, dialogue, well-targeted research and capacity building, the Centre aims to influence the international trade system so that it advances the goal of sustainable development