Impact of Political Risk on FDI Revisited—AnAggregate Firm-Level Analysis
KRISHNA CHAITANYA VADLAMANNATIUniversity of Heidelberg
Unlike previous studies on political risk and foreign direct invest-ment (FDI) that used macro-level FDI data to test micro-leveltheories, I make use of aggregate data on U.S. firms’ invest-ment activities in 101 developing countries during the period1997–2007 to reassess the propositions. Using a multilevel mixed–effects linear instrumental variable approach, I find that lowerpolitical risk is associated with (a) an increase in U.S. firms withequity stake of 51% and above, (b) a higher proportion of fixedassets, and (c) an increase in the return on investments, after con-trolling for a host of relevant factors. Further analysis reveals therelationship is also strong with respect to investments in total assetsand sales. The results are robust to alternative data, instruments,and estimation techniques. These results bring to fore the multiplerisk hedging strategies available for foreign firms operating in highrisk environments.
KEYWORDS operations of firms and political risk, U.S. firms
“Capital is a coward. It doesn’t go where it perceives danger”
–Anonymous investor in Zimbabwe, 10 May 2010
I thank Antu Murshid, University of Wisconsin-Milwaukee, and Elizabeth Asiedu, University of Kansas,for sharing the data on various indicators on capital and current account convertibility from the AnnualReport on Exchange Arrangements and Exchange Restrictions published by IMF. I also thank NathanJansen, Washington University, for the discussion on the U.S. firm level data available at BEA and RonDavies, University College Dublin, for providing some interesting comments. I also thank the editor andseveral anonymous referees for providing extremely valuable comments and suggestions. Replicationdata are available at http://dvn.iq.harvard.edu/dvn/dv/internationalinteractions
Address correspondence to Krishna Chaitanya Vadlamannati, Alfred-Weber-Institutefor Economics, Chair of International Economics and Development Politics, University ofHeidelberg, Campus Bergheim, Bergheimer Strasse 58, D-69115 Heidelberg, Germany. E-mail:[email protected]
111
112 K. C. Vadlamannati
The widely known ownership, localization, and internalization (OLI)paradigm developed by John H. Dunning (1993) identifies ownership, inter-nalization, and location advantages as the main reasons why firms investabroad. Among them, locational advantages have received enormous atten-tion in the current literature regarding foreign direct investment (FDI). Withinthe locational factors, the impact of political risk on FDI, among other stud-ies, has received a lot of attention in the literature (see Aguiar et al. 2006;Biglaiser and DeRouen 2006; Busse and Hefeker 2007; Egger and Winner2005; Henisz 2000; Jensen 2003, 2006; Jun and Singh 1996; Le and Zak 2006;Li and Resnick 2003; Schneider and Frey 1985; Wheeler and Mody 1992).Broadly, political risk can be defined as the risks faced by firms regardingunexpected alternations in legal regulations by the host country governmentguiding FDI policy. A good example of this would be the sudden change inthe FDI policy regime in Zimbabwe on 1st March 2010, which requires busi-nesses whose assets are worth over U.S.$500,000 to be majority-owned byindigenous Zimbabwean citizens (Lowrey 2010). Such changes in FDI pol-icy of the host country, which are anti–multinational corporations (MNCs),significantly deter FDI. It is abundantly clear from this example that politicalrisk is in fact firm specific or even project specific and hence requires amicro level analysis with focus on firm level activities.
Despite this, a common feature of the existing research on this topic isthat it is overwhelmingly dominated by macro-level FDI data, ignoring firmlevel analysis that might explain why some investors seem to be vulnera-ble to political risk. Existing studies use macro-level data to test micro-levelissues, which overlook the flexibility of MNCs production strategies andtheir ability to react to these heightened political risks. Second, even thosewho have addressed these issues do not control for an endogeneity prob-lem. It is quite possible that foreign MNCs operations in the host countryare endogenous to political risk. Higher shares of profits by MNCs, at leastin developed countries with fragile political systems, can put pressure onthe government to expropriate the assets of these firms for political gains.Some noteworthy examples include the current regime in Zimbabwe and thesocialist government in India during 1977–1979. Not taking this endogeneityinto account would induce biased results. This article contributes to the lit-erature by filling these gaps using aggregate firm level data of U.S. MNCsoperating in 101 developing countries during the period 1997–2007, specif-ically analyzing how these firms strategize and direct their operations inthe wake of high political risk. Extending this analysis based on the argu-ments of “obsolescing bargaining” from Vernon (1971), “political hazards”from Henisz (2000) and “political institutions and political risks facing MNCs”from Jensen (2006), I examine how firms tailor their operations in the wakeof heightened political risk, controlling for the possibility of endogeneity.I expect firms to use alternative strategies such as investing less in whollyowned subsidiaries and favoring investment in liquid assets over sunk assets.
Impact of Political Risk on FDI 113
The rest of the article is organized as follows: a brief review of literatureis presented first. Theoretical arguments on the relationship between firmoperations and political risk are offered next. The following section thenintroduces the measures of political risk and investment activities of theU.S. foreign affiliates. The data and model specifications are then presented,followed by the empirical results and the conclusion.
REVIEW OF LITERATURE
I begin by reviewing studies on the effects of various forms of political riskson FDI in particular. Even though this is not my primary focus, such a reviewis useful in order to establish whether or not political risk has a statisticallysignificant impact on FDI and on a country’s attractiveness as a host for FDI.Not surprisingly, empirical studies do not fail to find a clear confirmation.The aforementioned studies have all found that political risk has at leastsome impact on FDI. However, there are also studies which have negativefindings in this regard, see Tuman (2009) for example. Extending this topicfurther, Pinto and Pinto (2006) analyze how FDI reacts to changing politicalconditions in host countries. Their model predicts that the incumbent gov-ernment’s partisanship affects the decision of foreign investors to invest indifferent sectors of OECD countries. Their findings reveal the existence ofsuch partisan cycles in the patterns of FDI across countries and over time atthe industry level.
Turning to the region specific effects, Daude, Mazza, and Morrison(2003) find that political instability is an important determinant of inwardFDI from the U.S. and Japan to 27 countries in Latin America. On theother hand, when examining the political determinants of U.S. FDI in LatinAmerican countries, Tuman and Emmert (2004) found political instability tohave a significant effect on the investment behavior of U.S. multinationalfirms. Moreover, they also find that a poor human rights track record andthe occurrence of military coups d’etat positively influence U.S. FDI flows inthis region. Focusing on 19 Latin American and Asian countries, Al Nasser(2007) finds that besides fundamental factors such as market size and GDPgrowth, sociopolitical stability and efficient legal framework likewise havean effect on FDI inflows. A similar study by Montero (2008) shows thatLatin America is no exception to the aforementioned pattern of the effectsof political instability on FDI. Turning to the effects of a wider range ofpolitical reforms on FDI, Malesky (2008) claims to find that de facto decen-tralization (in the form of autonomous reforms experiments by subnationalleaders in 61 Vietnamese provinces) may attract FDI in subsequent years.In a more recent study, Dreher, Mikosch, and Voigt (2010) maintain that theextent to which membership in international organizations restricts a coun-try from pursuing policies that are harmful to investors, can consequentlysignal lower political risk.
114 K. C. Vadlamannati
As highlighted earlier, my main concern with the analysis of the abovelisted studies is that they ignored firm level analysis, which can be useful inexplaining why some investors seem to be vulnerable toward political riskand the ability MNCs (their production strategies) have in reacting to suchrisks. Finally, unlike my study, they do not tackle potential reverse causalitywith the help of instrumental variable regression analysis, representing afailed opportunity to improve their analyses.
THEORY AND HYPOTHESES
In this section, I present the hypotheses by discussing the impact of variousforms of political risk on U.S. foreign affiliates’ operations. The variables ofinterest are the U.S. majority-owned firms (in which a U.S. personal or U.S.parent company owned more than 50% of equity stake) operating in the hostcountry, investments in fixed and total assets, and return on investments.
Firm-Level Responses to Political Risk in the Host Country
In a research study titled “Why doesn’t capital flow from rich to poorcountries?” Alfaro et al. (2008) highlights political risk as the major factorinfluencing foreign investors. MNCs, according to them, respond to reduc-tions in political risk by increasing their investments. The main reasonwhy MNCs are sensitive to political risk is the fear of direct expropriation,such as nationalization of foreign investment projects. The political risk isnot limited to the threat of expropriation alone, but emanates from hos-tile policies related to undue extraction of rents from MNCs exponentially,known as indirect expropriation (Eaton and Gersowitz 1984; Kobrin 1985).Thus, this study focuses on these two types of expropriations. First, directexpropriation can lead to uncertainty in the minds of potential foreigninvestors1 (Henisz 2000) because FDI, while mobile ex ante, is relativelyilliquid ex post (Vernon 1971). In other words, before the foreign investorcommits to the investment, they have the upper hand vis-à-vis the hostcountry government in terms the bargaining power to extract investmentincentives. But once committed to, the investments become vulnerable asthe bargaining power now shifts to host country government, creating therisk of project obsolescence. The host country government may then extractrents from the foreign investors up to the value of the total sunk costs.2 Theramifications will be even higher for MNCs in the case of capital intensive
1In a series of papers, Henisz (2000, 2002a, 2002b, 2004) has found that MNCs are extremely sensitiveto the changes in institutional constraints placed on the executive. Likewise, regime change risk and itsrelationship to FDI is explored by Resnick (2001) and Li and Resnick (2003).2Of course there are other types of political risk arising out of dissent and uprising, leading to a crisislike in Cuba in 1965. The resulting adverse regime change can also increase contractual hazards.
Impact of Political Risk on FDI 115
projects. This is due to the fact that these huge investments become a “sunkcost,” which is very difficult to plough back, as well as the gestation periodfor returns being longer.3
Second, although direct expropriation is a remote possibility in thecurrent environment (see Kobrin 1984), this is by no means a guaranteethat foreign investors are free from political risk. Governments who com-mit to providing property rights protection may buckle under lobbyingpressure from local firms seeking preferential treatment vis-à-vis the for-eign firms. This means that foreign investors would no longer be equallytreated and protected compared to local firms. This indirect expropriationincludes: altering legal laws and regulations to benefit local firms over for-eign firms; modification of existing FDI laws; caps on repatriation of profitsand dividends to the parent company in the home country; removal of thetax benefits promised by the government under the contract of investment;curbing tax holidays; failure to increase tariffs paid to the investor as agreedin contract; denial of licenses to expand the business; denial of providingland at concession rates as per the contract and backtracking on similarsuch promises regarding infrastructure and finances. Both direct and indi-rect expropriations are a matter of grave concern for foreign investors as itjeopardizes the safety of their operations in the host country.
There are also other possible indirect effects of heightened political risk.The recent studies by Gassebner and Méon (2010) and Coeurdacier, Santis,and Aviat (2009) highlight the impact of political turmoil on the applicationof formal laws providing investor protection such as existing legal rules andprovisions. The basic argument according to Gassebner and Méon (2010)is that heightened political risk can alter or even in some cases abolishthe existing formal laws. Thus, the formal laws, such as creditor protectionlaws, can do little to protect foreign investor if those rules and laws areeasily revoked or not formally applied. In other words, functioning of thoseinstitutions that seek to provide investor protection significantly depend onthe stability and credibility of the political system.
However, this does not mean that MNCs can completely shy away frominvesting in some of the more lucrative markets as suggested by Feinbergand Gupta’s (2009). It is logical to assume that MNCs are driven by thereturns they earn on their investments. If this is the case, then a high returnon the investment plays a key role in the way MNCs react to different typesof political risks in a host country (Fatehi and Safizadeh 1994). Therefore,the extent to which MNCs react significantly depends on a host of factors,most predominantly the returns they expect. Jensen (2006) points out vari-ous means through which MNCs can structure their operations in such a waythat can minimize the risk of potential losses. In fact many U.S. foreign affil-iates have a significant presence in high-risk countries such as Angola and
3Biglaiser and deRouen (2006) find that minimizing expropriation risk is more attractive to U.S. firmswanting to invest in Latin American countries than economic policy reforms necessarily are.
116 K. C. Vadlamannati
Equatorial Guinea, among others. MNCs can resort to several measures, likeinsuring against the political risk involved in operating in a hostile country,for example (Jensen 2006). Likewise, firms can invest in smaller productionfacilities or reduce their proportion of investments in fixed assets, or evenincrease their share of liquid assets over sunk assets. Alternatively, firmscan increase their within-firms sales and trade internalization (Feinberg andGupta 2009). Furthermore, MNCs can outsource some operations to localsubcontractors or enter into joint ventures (JVs) with local firms to hedgeagainst political hazards. Entering into JVs is one of the most preferredoptions, according to Henisz (2002a), because local firms have profoundknowledge about the local market and politics. MNCs therefore seek tomake use of the JVs with domestic firms to circumvent political risk. Thus, Iexpect:
H1: Ceteris paribus, high political risk is associated with a decline in wholly-owned U.S. subsidiaries in the host country.
H2: Ceteris paribus, an increase in political risk is associated with a declinein investments in overall and fixed assets.
H3: Ceteris paribus, a high level of political risk is associated with a declinein the return on investments.
MEASURING POLITICAL RISK AND FOREIGN FIRMS’ OPERATIONS
The main dependent variable is the operations of U.S. foreign affiliates in thedeveloping countries. For the U.S. firms’ operations, I select four variablesdepending upon the availability of the data: (a) number of U.S. majority-owned foreign affiliates operating in the host country; (b) value of the U.S.firms’ fixed assets (logged); (c) value of the U.S. firms’ total assets (logged);and (d) net income generated by U.S. firms (logged).4 Because I do nothave specific data by firm, (like Henisz [2000] and Jensen [2006] on the exactshare of foreign equity held by U.S. firms) or the data on the number ofJVs between U.S. firms and local firms, I make use of the aggregate dataavailable for the U.S. majority-owned foreign affiliates operating in the hostcountry. This is a proxy for the significant presence of U.S. owned firms,which are basically not JVs. By definition, a majority-owned foreign affiliateis a firm in which the combined direct and indirect ownership interest of theU.S. parent firm exceeds 51%.
4I make use of logarithm to control for skewed data. The value of assets and income are in U.S.$ million,evaluated using a historical cost basis approach. Although the number of U.S. majority-owned affiliatesis a count variable, I am not aware of an intrument variable (IV) method for count dependent variable.
Impact of Political Risk on FDI 117
The data on investments in assets (total and fixed) and the net incomegenerated is an aggregate of all the U.S. firms operating in developing coun-tries (non-OECD). This kind of data is collected by Bureau of EconomicAnalysis (BEA) every year through a survey of firms’ activities that meet aminimum threshold level of assets, sales, and net income. The BEA alsoconducts a comprehensive survey of its firms established abroad once everyfive years. Under this scheme, it is mandatory for the U.S. firms stationedabroad to provide detailed information to the BEA. This survey is known tobe of high quality in its standard and is strictly confidential. Usually, the BEAallows selected researchers to work as special unpaid employees, conduct-ing research on various topics using this confidential data within the officepremises of BEA. However, in its reports the BEA publishes the aggregatedata of all U.S. firms operating in major countries in the public domain.I make use of this annual dataset from their website during the period of1997–2007 for 101 developing countries. The data on investments in assetsand net income generated by U.S. firms are reported in U.S.$ million andcomputed using a historical cost basis approach. Occasionally data is miss-ing due to the suppression of the information by firms or BEA authoritiesfor security reasons. Such cases would be deemed as “missing values” andhence unbalanced panel data.
In order to examine the effects of political risk on MNCs operationsin developing countries, I make use of several measures of political risk.First, I follow several studies which argue that democracy is key to attractingMNCs (Jensen 2006), as democratic regimes protect tend to protect propertyrights and are efficient in distributing resources (Biglaiser and Danis 2002,Jakobsen and de Soysa 2006). It is also argued that democratic regimesare more transparent in their policymaking processes, hence making it eas-ier for the MNCs operating in these countries to anticipate adverse policychanges (Rosendorff and Vreeland 2006). However, others expect a negativerelationship between democracy and FDI (Li and Resnick 2003).5 I capturedemocracy using the polity IV political regime index. I subtract the autoc-racy score from the democracy score, as is standard when using the Politydata. The democracy score ranges from +10 (full democracy) to −10 (fullautocracy). For the robustness check, I replace the polity IV index with theFreedom House civil and political liberties index (coded on a 0–7 scale, withthe highest value representing the worst liberties).
Although the effects of democracy on FDI are a much debated topicin the current literature, there is still a consensus regarding the importanceof political constraints on the executive due to the presence of veto playerswho can block adverse FDI policy changes. These various constraints signifi-cantly reduce the risk of manipulating FDI policy or making across-the-boardpolicy changes. Therefore, I believe that MNCs will be more sensitive to the
5For detailed arguments and counterarguments on the effects of democracy on FDI, see Li and Resnick(2003) and a critique of their study by Jakobsen and de Soysa (2006).
118 K. C. Vadlamannati
various forms of political constraints in the system (a proxy for how poweris used by the regime) rather than democracy per se. I use several proxies,safely ignoring subjective indices,6 which broadly capture the constraints onthe executive and political system. Following others (Dreher et al. 2010) Imake use of the Political Constraints Index III and V developed by Henisz(2002a, 2002b). The former captures the veto power of different indepen-dent branches of the government (such as the executive, and lower andupper chambers of the legislative) on government polices. On the otherhand, the latter measure also includes the veto powers of the judiciary andsub-federal institutions over government policies in each country. Thesemeasures are further modified to capture the extent of preference hetero-geneity within each legislative branch. Greater within-branch heterogeneityincreases (decreases) the costs of overturning policy for aligned (opposed)branched. Both the indices are coded on a scale of 0 (most hazardous) to 1(most constrained).
As an alternative measure, I also employ the executive constraints indexfrom the Polity IV database. This index measures the impact of institutional-ized constraints have on the power of the chief executive’s decisionmakingprocess in any particular state. Thus, the index mirrors the checks and bal-ances in the policymaking process. This index is coded on a seven-pointscale ranging from 0 (unlimited authority) to 7 (constrained authority). Foran additional robustness check, I also use the checks and balances mea-sure developed by Beck et al. (2001) and Keefer and Stasavage (2003). Thismeasure focuses on the ability of other agents to restrain the government.The index ranges from one (few veto players) to 17 (high number of vetoplayers). See Appendix 2 for a precise description and the data sources forthese variables.
DATA AND METHODS
I analyze a time-series cross-section dataset (TSCS) across 101 non-OECDcountries, covering the years 1997–2007 (see Appendix 1). I estimate ourregressions employing the Pooled OLS with robust standard errors, specifiedas follows:
MNCOit = φ1 + ψ2 Hit + ψ3 Zit + υt + ωit (1)
MNCOit denotes U.S. firms operations (discussed in the previous section) inthe year t and country i; Hit denotes hypothesis variable(s), namely polity IVand political constraints indices; υ t are time fixed effects; and ωit is the errorterm. Country-fixed effects are not included because some of the variables(including our political risk indicators) remain largely time invariant. Usage
6Such as ICRG’s political risk index and BERI group’s operational risk index.
Impact of Political Risk on FDI 119
of two-way fixed effects will not only be collinear with largely time-invariantregressors, but also generate biased estimates (Beck, 2001). Also note thatthe Hausman test favors this model over the pooled two-way fixed effectsmodel. I return to the issue of two-way fixed effects later.
The vector Zit captures the control variables, including other poten-tial determinants of FDI which are obtained from the existing literature onthe subject. I follow Dunning (1988a, 1993), Wheeler and Mody (1992),Blonigen (2005) and other comprehensive evaluations on determinants ofFDI (Blonigen and Davies 2004). Accordingly, I control for income byincluding per capita GDP (logged) in US$, year 2000 constant prices, rateof growth in per capita GDP, total population (logged) (Dunning 1988b;Scaperlanda and Laurence 1969), and availability of domestic credit/GDPto measure financial development in the host country (World Bank 2008).Following Campos and Kinoshita (2008), I include electricity consumptionin kilowatts (logged) as a proxy for infrastructure. I prefer this variable overothers because it not only captures the availability of electricity, but alsothe cost. I include exchange rates vis-à-vis US$, an important determinant ofFDI (Cushman 1985). I also capture resource wealth using oil and mineralexports as a share of total exports, constructed by using data from the WorldTrade Organization (WTO). Following Asiedu and Lien (2004), I include anindex of FDI policy reforms covering capital account convertibility, currentaccount convertibility, existence of multiple exchange rates from AnnualReport on Exchange Arrangements and Exchange Restrictions published bythe IMF.7 Finally, I include a variable capturing conflicts and their inten-sity by assigning the value of 4 if intensity is high and 0 otherwise. Thedescriptive statistics for both datasets are presented in Appendix 3.
Endogeneity Concerns
It is quite possible that the key explanatory political risk variables areendogenous to MNC operations, that is, it might be the operations of MNCsthat lead to subsequent expropriation risk and not the other way around. Forexample, high profits resulting from expansion in the host country could drawthe attention of domestic firms who then lobby for restricting the operationsof MNCs. Likewise, in a hostile political environment (like in Zimbabwe)the regime can use expropriation of MNCs as a tool to garner further polit-ical support, especially from the poorer sections of society. Not taking thisendogeneity into account would induce bias in my estimates. The normalprocedure would therefore be to utilize an instrumental variable (IV) approachusing two-stage least squares with IV (2SLS – IV henceforth) with time-fixedeffects. Although it is true that inclusion of country dummies may cause biasin the estimation for the reasons illustrated above, it may not be the best
7I thank Antu Murshid and Elizabeth Asiedu for readily sharing this data with me.
120 K. C. Vadlamannati
approach to simply ignore unit heterogeneity. To overcome this problem, Iemploy multilevel mixed-effects linear regression model with endogenouscovariates, which allows me to model heterogeneity as random intercepts atthe country level (Beck and Katz 2007). However, in the case of the dependentvariable with the number of U.S. majority-owned foreign affiliates in opera-tion, I use the negative binomial method due to the count nature of the data.I find the data to be strongly skewed to the right (with an accumulation ofobservations at one) and display significant overdispersion (with the variancebeing greater than the mean), hence the use of negative binomial estimator(Cameron and Trivedi 1998). However, employing instrumental variables inmultilevel mixed-effects linear and negative binomial models may be prob-lematic. Therefore, when conducting the instrumental variable estimations, Imanually program and run the regressions because there is no function inSTATA or other relevant software programs to command instrumental variableregressions for multilevel mixed-effects linear and negative binomial methods.First, following Cho (2010) I regress the respective endogenous variables—thePolity IV, Political Constraints index III, and V variables—on the two instru-ments and the other control variables by using the ordered probit (whichare the first stage regressions). I then predict the values of the respectiveendogenous variables and regress the dependent variables—majority-ownedforeign affiliates in operation, Fixed Assets, Total Assets, and Total Income—byusing multilevel mixed-effects linear models (the second-stage regressions).In addition, the 2SLS-IV estimation with time-fixed effects was employed asa part of the robustness check.
For instruments, I make use of the number of nongovernmental orga-nizations (NGOs) and intergovernmental organizations (IGOs), combinedwith the opposition fractionalization index in parliament coded between0–1. While the data for NGOs and IGOs are drawn from various interna-tional organization databases, the opposition fractionalization index comesfrom Beck et al. (2001). Both the variables are crucial in imposing seriouslosses of reputation on regimes (Jensen 2003) who do not respect propertyrights. The intensity of this loss in reputation is profoundly high when thereis a united political opposition and strong NGO presence, as both groupsexert pressure against such illegitimate moves. The costs associated with“naming and shaming” are important because the median voter will preferthose governments which support capital importation (Bhagwati 1999). Thisis because new MNCs generally offer higher wages than local firms and arethen likely to significantly alter labor market conditions in the long run8
(Brown, Deardorff, and Stern 2003).
8Apart from this, MNCs bring in advanced technologies which then have spillover effects on domesticfirms in terms of wages, productivity, and technical know-how. In addition, MNCs also create new jobsfor locals and mobilize savings (for more, see Dunning 1994; Lipsey 2002). These benefits certainly createa vote bank constituency among the working and middle classes.
Impact of Political Risk on FDI 121
With respect to my alternative estimations, 2SLS-IV, the validity of theselected instruments depends on instrument relevance and the exclusionrestriction. First, it must be correlated with the explanatory variable inquestion—otherwise it has no power. Bound, Jaeger, and Baker (1995) sug-gest examining the F-statistic on the excluded instruments in the first-stageregression. The selected instrument would be relevant when the first-stageregression model’s F-statistic is above 10. However, the F-test has beencriticized in the literature as being insufficient for measuring the degreeof instrument relevance in the presence of multiple endogenous variables(Stock et al. 2002, Hahn and Hausman 2002, 2003). In this case, a morepowerful test is the Cragg-Donald test (Cragg and Donald 1993, Stock et al.2002). A Cragg-Donald (CD) statistic above the critical value (10% maximaltest size) indicates the rejection of weak instruments. Second, the selectedinstrument should not vary systematically with the disturbance term in thesecond-stage equation, that is, [ωit | IVit ] = 0. This assumption would beviolated if the selected IV has an influence on the dependent variable addi-tional to its influence on the explanatory variable. As far as my instrumentsare concerned, I know of no empirical argument linking the mere presenceof NGOs and fractionalized governments effecting firms’ operations directly.Nevertheless, I check the exclusion criteria using the Hansen J-test (Hansen1982) and the null-hypothesis of exogeneity cannot be rejected at a conven-tional level of significance. Alternatively, I also run reduced form regressionssuggested by Angrist and Kruger (2001).
EMPIRICAL RESULTS
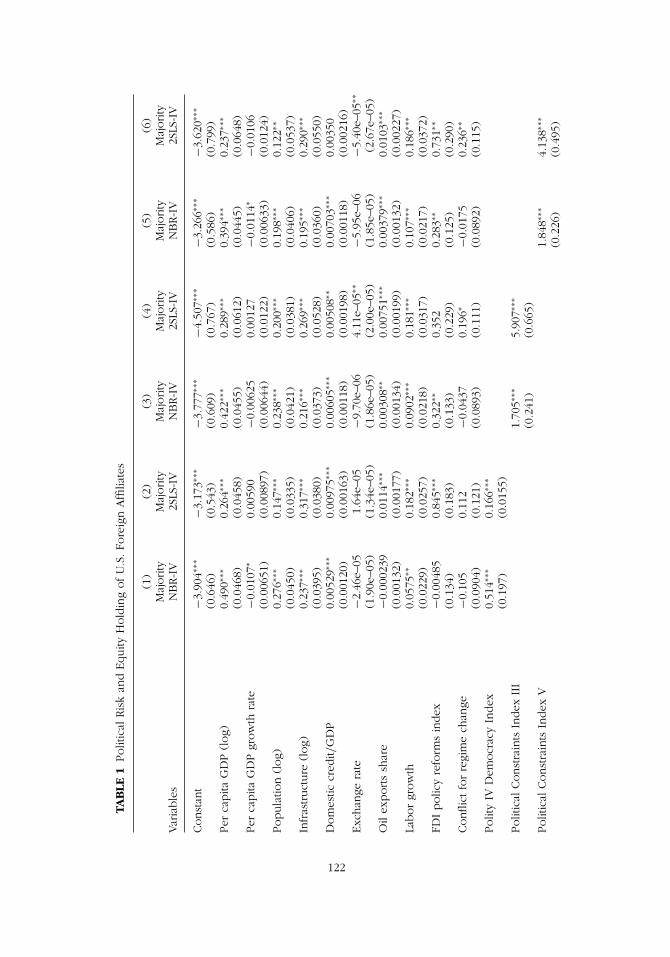
The results of the regression estimates used to assess the impact of politicalrisk on U.S. firms operations are presented in Tables 1–4. While the resultsin Table 1 are estimated using negative binomial-IV and 2SLS-IV methods,results in Tables 2–4 are estimated using multilevel mixed linear-IV and 2SLS-IV methods. Table 1 reports the main findings, capturing the effects of thethree main political risk indicators on the nature of firm ownership. I findthat the polity IV index (of democracy) has a statistically significant positiveimpact on U.S. firms with a majority equity stake. An increase in the standarddeviation of the polity IV index (6.46) would increase the presence of U.S.firms (log) by 1.08 (around 12 firms), which is about 68% of the standarddeviation of the average polity IV index (see column 2). The positive effectsuggests that movement toward a free electoral competitive system increasesthe presence of U.S. firms with a majority equity stake holding. These find-ings are reconfirmed by both the instrumental variable methods (see column1 and 2, Table 1). Not so surprisingly, in the next columns I find that thepositive significant impact of political constraints indices III and V are higherthan the polity IV index. This suggests that how power is acquired (electoral
TAB
LE1
Polit
ical
Ris
kan
dEquity
Hold
ing
ofU
.S.Fo
reig
nA
ffilia
tes
(1)
(2)
(3)
(4)
(5)
(6)
Maj
ority
Maj
ority
Maj
ority
Maj
ority
Maj
ority
Maj
ority
Var
iable
sN
BR-I
V2S
LS-I
VN
BR-I
V2S
LS-I
VN
BR-I
V2S
LS-I
V
Const
ant
−3.9
04∗∗
∗−3
.173
∗∗∗
−3.7
77∗∗
∗−4
.507
∗∗∗
−3.2
66∗∗
∗−3
.620
∗∗∗
(0.6
46)
(0.5
43)
(0.6
09)
(0.7
67)
(0.5
86)
(0.7
99)
Per
capita
GD
P(log)
0.49
0∗∗∗
0.26
4∗∗∗
0.42
2∗∗∗
0.28
9∗∗∗
0.39
4∗∗∗
0.23
7∗∗∗
(0.0
468)
(0.0
458)
(0.0
455)
(0.0
612)
(0.0
445)
(0.0
648)
Per
capita
GD
Pgr
ow
thra
te−0
.010
7∗0.
0059
0−0
.006
250.
0012
7−0
.011
4∗−0
.010
6(0
.006
51)
(0.0
0897
)(0
.006
44)
(0.0
122)
(0.0
0633
)(0
.012
4)Popula
tion
(log)
0.27
6∗∗∗
0.14
7∗∗∗
0.23
8∗∗∗
0.20
0∗∗∗
0.19
8∗∗∗
0.12
2∗∗
(0.0
450)
(0.0
335)
(0.0
421)
(0.0
381)
(0.0
406)
(0.0
537)
Infr
astruct
ure
(log)
0.23
7∗∗∗
0.31
7∗∗∗
0.21
6∗∗∗
0.26
9∗∗∗
0.19
5∗∗∗
0.29
0∗∗∗
(0.0
395)
(0.0
380)
(0.0
373)
(0.0
528)
(0.0
360)
(0.0
550)
Dom
estic
cred
it/G
DP
0.00
529∗∗
∗0.
0097
5∗∗∗
0.00
605∗∗
∗0.
0050
8∗∗0.
0070
3∗∗∗
0.00
350
(0.0
0120
)(0
.001
63)
(0.0
0118
)(0
.001
98)
(0.0
0118
)(0
.002
16)
Exc
han
gera
te−2
.46e
–05
1.64
e–05
−9.7
0e–0
64.
11e–
05∗∗
−5.9
5e–0
6−5
.40e
–05∗∗
(1.9
0e–0
5)(1
.34e
–05)
(1.8
6e–0
5)(2
.00e
–05)
(1.8
5e–0
5)(2
.67e
–05)
Oil
exports
shar
e−0
.000
239
0.01
14∗∗
∗0.
0030
8∗∗0.
0075
1∗∗∗
0.00
379∗∗
∗0.
0103
∗∗∗
(0.0
0132
)(0
.001
77)
(0.0
0134
)(0
.001
99)
(0.0
0132
)(0
.002
27)
Labor
grow
th0.
0575
∗∗0.
182∗∗
∗0.
0902
∗∗∗
0.18
1∗∗∗
0.10
7∗∗∗
0.18
6∗∗∗
(0.0
229)
(0.0
257)
(0.0
218)
(0.0
317)
(0.0
217)
(0.0
372)
FDI
polic
yre
form
sin
dex
−0.0
0485
0.84
5∗∗∗
0.32
2∗∗0.
352
0.28
3∗∗0.
731∗∗
(0.1
34)
(0.1
83)
(0.1
33)
(0.2
29)
(0.1
25)
(0.2
90)
Conflic
tfo
rre
gim
ech
ange
−0.1
050.
112
−0.0
437
0.19
6∗−0
.017
50.
236∗∗
(0.0
904)
(0.1
21)
(0.0
893)
(0.1
11)
(0.0
892)
(0.1
15)
Polit
yIV
Dem
ocr
acy
Index
0.51
4∗∗∗
0.16
6∗∗∗
(0.1
97)
(0.0
155)
Polit
ical
Const
rain
tsIn
dex
III
1.70
5∗∗∗
5.90
7∗∗∗
(0.2
41)
(0.6
65)
Polit
ical
Const
rain
tsIn
dex
V1.
848∗∗
∗4.
138∗∗
∗
(0.2
26)
(0.4
95)
122
Adju
sted
R-s
quar
ed0.
553
0.25
20.
115
Firs
tst
age
FSt
atis
tic81
∗∗∗
73.4
∗∗∗
72.8
2∗∗∗
Ander
son
canon
corr
elat
ion
LRte
st19
2.49
∗∗∗
114.
13∗∗
∗13
0.75
∗∗∗
Cra
gg-D
onal
dst
atis
tic21
6.7∗∗
∗11
2.47
∗∗∗
141.
84∗∗
∗
Han
sen
Jst
atis
tic(p
valu
e)0.
4565
0.52
560.
4054
Pag
an-H
allge
ner
alst
atis
tic(p
valu
e)0.
3729
0.71
770.
4622
Wu-H
ausm
anF
test
33.3
8∗∗∗
95.1
3∗∗∗
155.
19∗∗
∗
Durb
in-W
u-H
ausm
anχ
2te
st32
.89∗∗
∗87
.23∗∗
∗13
3.23
∗∗∗
Pse
udo
R2
0.10
640.
1112
0.11
31LRχ
294
3.2∗∗
∗98
6.2∗∗
∗10
03∗∗
∗
Like
lihood-r
atio
test
ofal
pha=
029
000∗∗
∗28
000∗∗
∗28
000∗∗
∗
No.ofco
untrie
s10
110
110
110
110
110
1N
o.ofobse
rvat
ions
873
828
873
819
873
814
Note
s:Robust
stan
dar
der
rors
inpar
enth
eses
;∗∗
∗ p<
.01,
∗∗p<
.05,
∗ p<
.1.
NBR-IV
=N
egat
ive
bin
om
ialre
gres
sion
with
inst
rum
enta
lva
riab
lem
ethod.
123
TAB
LE2
Polit
ical
Ris
kan
dU
.S.Fo
reig
nA
ffilia
tes’
Inve
stm
ents
inFi
xed
Ass
ets
(1)
(2)
(3)
(4)
(5)
(6)
log
FAlo
gFA
log
FAlo
gFA
log
FAlo
gFA
Var
iable
sM
LE-I
V2S
LS-I
VM
LE-I
V2S
LS-I
VM
LE-I
V2S
LS-I
V
Const
ant
−0.2
55−3
.270
∗∗∗
−0.5
86−4
.506
∗∗∗
−0.5
19−4
.210
∗∗∗
(1.0
43)
(0.8
61)
(1.0
42)
(1.0
40)
(1.0
37)
(1.0
74)
Per
capita
GD
P(log)
0.56
3∗∗∗
0.28
3∗∗∗
0.54
6∗∗∗
0.29
3∗∗∗
0.53
2∗∗∗
0.26
8∗∗∗
(0.1
14)
(0.0
680)
(0.1
13)
(0.0
818)
(0.1
13)
(0.0
855)
Per
capita
GD
Pgr
ow
thra
te0.
0004
780.
0453
∗∗∗
0.00
328
0.04
19∗∗
∗0.
0008
370.
0298
∗∗
(0.0
0386
)(0
.012
1)(0
.003
96)
(0.0
142)
(0.0
0385
)(0
.014
5)Popula
tion
(log)
0.03
250.
343∗∗
∗0.
0459
0.36
6∗∗∗
0.04
090.
334∗∗
∗
(0.0
479)
(0.0
485)
(0.0
477)
(0.0
532)
(0.0
474)
(0.0
649)
Infr
astruct
ure
(log)
0.46
1∗∗∗
0.25
7∗∗∗
0.42
5∗∗∗
0.20
6∗∗∗
0.41
2∗∗∗
0.18
1∗∗
(0.0
850)
(0.0
604)
(0.0
849)
(0.0
722)
(0.0
853)
(0.0
739)
Dom
estic
cred
it/G
DP
0.00
0716
0.00
920∗∗
∗0.
0006
060.
0039
6∗0.
0006
520.
0025
4(0
.001
77)
(0.0
0224
)(0
.001
74)
(0.0
0224
)(0
.001
74)
(0.0
0236
)Exc
han
gera
te8.
52e−
077.
28e−
05∗∗
∗5.
92e−
068.
89e−
05∗∗
∗2.
89e−
06−1
.59e
−05
(5.1
5e−0
5)(2
.36e
−05)
(5.1
2e−0
5)(2
.92e
−05)
(5.1
1e−0
5)(4
.04e
−05)
Oil
exports
shar
e−0
.000
245
0.03
14∗∗
∗0.
0015
90.
0278
∗∗∗
0.00
138
0.02
94∗∗
∗
(0.0
0221
)(0
.003
17)
(0.0
0230
)(0
.003
00)
(0.0
0227
)(0
.003
30)
Labor
grow
th0.
0286
∗∗0.
173∗∗
∗0.
0425
∗∗∗
0.17
8∗∗∗
0.04
69∗∗
∗0.
187∗∗
∗
(0.0
132)
(0.0
305)
(0.0
141)
(0.0
332)
(0.0
147)
(0.0
362)
FDI
polic
yre
form
sin
dex
0.11
00.
938∗∗
∗0.
127
0.44
00.
175
0.64
9∗
(0.2
10)
(0.2
89)
(0.1
88)
(0.3
19)
(0.1
93)
(0.3
54)
Conflic
tfo
rre
gim
ech
ange
−0.0
493
0.17
5−0
.035
30.
139
−0.0
166
0.15
5(0
.049
4)(0
.133
)(0
.049
2)(0
.200
)(0
.049
8)(0
.196
)Polit
yIV
Dem
ocr
acy
Index
0.52
2∗0.
206∗∗
∗
(0.3
06)
(0.0
238)
Polit
ical
Const
rain
tsIn
dex
III
1.06
3∗∗∗
7.12
0∗∗∗
(0.3
30)
(0.8
44)
Polit
ical
Const
rain
tsIn
dex
V1.
218∗∗
∗4.
858∗∗
∗
(0.3
69)
(0.5
90)
124
Adju
sted
R-s
quar
ed0.
352
0.15
00.
064
Firs
tst
age
FSt
atis
tic81
.13∗∗
∗84
.89∗∗
∗93
.67∗∗
∗
Ander
son
canon
corr
elat
ion
LRte
st21
0.29
∗∗∗
139.
05∗∗
∗17
3.17
∗∗∗
Cra
gg-D
onal
dst
atis
tic23
5.50
∗∗∗
149.
92∗∗
∗19
0.34
∗∗∗
Han
sen
Jst
atis
tic(p
valu
e)0.
0203
0.89
790.
6164
Pag
an-H
allge
ner
alst
atis
tic(p
valu
e)0.
5009
0.22
990.
0598
Wu-H
ausm
anF
test
29.1
2∗∗∗
62.6
0∗∗∗
101.
10∗∗
∗
Durb
in-W
u-H
ausm
anχ
2te
st28
.93∗∗
∗60
.05∗∗
∗93
.27∗∗
∗
LRte
stvs
.lin
ear
regr
essi
on
1871
.3∗∗
∗18
31.1
∗∗∗
1826
.1∗∗
∗
Log
rest
rict
ed-lik
elih
ood
−994
.3−9
90.6
−990
.2N
o.ofco
untrie
s95
9595
9595
95N
o.ofobse
rvat
ions
999
946
999
935
999
930
Note
s:Robust
stan
dar
der
rors
inpar
enth
eses
;∗∗
∗ p<
.01,
∗∗p<
.05,
∗ p<
.1;
MLE
-IV
=m
ulti
leve
lm
ixed
linea
res
timat
ions
with
inst
rum
enta
lva
riab
lem
ethod;
Log
FA=
fixe
das
sets
inU
S$m
illio
n(logg
ed).
125
TAB
LE3
Polit
ical
Ris
kan
dU
.S.Fo
reig
nA
ffilia
tes’
inve
stm
ents
inTo
talA
sset
s
(1)
(2)
(3)
(4)
(5)
(6)
log
TAlo
gTA
log
TAlo
gTA
log
TAlo
gTA
Var
iable
sM
LE-I
V2S
LS-I
VM
LE-I
V2S
LS-I
VM
LE-I
V2S
LS-I
V
Const
ant
−1.8
51∗∗
−2.5
01∗∗
∗−1
.978
∗∗−3
.272
∗∗∗
−2.0
37∗∗
−2.9
69∗∗
∗
(0.9
17)
(0.7
60)
(0.9
18)
(0.9
27)
(0.9
07)
(0.9
50)
Per
capita
GD
P(log)
0.88
6∗∗∗
0.46
2∗∗∗
0.87
9∗∗∗
0.43
2∗∗∗
0.84
1∗∗∗
0.41
7∗∗∗
(0.1
03)
(0.0
617)
(0.1
02)
(0.0
733)
(0.1
02)
(0.0
750)
Per
capita
GD
Pgr
ow
thra
te−0
.001
690.
0181
∗0.
0008
250.
0179
−0.0
0132
0.00
885
(0.0
0313
)(0
.011
0)(0
.003
22)
(0.0
133)
(0.0
0311
)(0
.013
6)Popula
tion
(log)
0.11
1∗∗∗
0.28
3∗∗∗
0.11
3∗∗∗
0.31
6∗∗∗
0.11
6∗∗∗
0.28
9∗∗∗
(0.0
397)
(0.0
446)
(0.0
396)
(0.0
490)
(0.0
391)
(0.0
594)
Infr
astruct
ure
(log)
0.27
1∗∗∗
0.25
2∗∗∗
0.23
8∗∗∗
0.24
8∗∗∗
0.21
4∗∗∗
0.23
2∗∗∗
(0.0
772)
(0.0
522)
(0.0
771)
(0.0
639)
(0.0
767)
(0.0
654)
Dom
estic
cred
it/G
DP
0.00
317∗∗
0.01
27∗∗
∗0.
0034
6∗∗0.
0079
2∗∗∗
0.00
330∗∗
0.00
681∗∗
∗
(0.0
0144
)(0
.002
06)
(0.0
0143
)(0
.002
10)
(0.0
0142
)(0
.002
13)
Exc
han
gera
te5.
94e−
054.
46e−
05∗∗
6.21
e−05
5.27
e−05
∗∗5.
93e−
05−2
.70e
−05
(4.3
2e−0
5)(2
.05e
−05)
(4.3
1e−0
5)(2
.62e
−05)
(4.2
8e−0
5)(3
.62e
−05)
Oil
exports
shar
e−0
.001
500.
0258
∗∗∗
−0.0
0030
0.02
33∗∗
∗0.
0002
410.
0242
∗∗∗
(0.0
0184
)(0
.002
87)
(0.0
0191
)(0
.002
80)
(0.0
0187
)(0
.003
02)
Labor
grow
th0.
0166
0.17
3∗∗∗
0.02
62∗∗
0.18
0∗∗∗
0.03
90∗∗
∗0.
184∗∗
∗
(0.0
108)
(0.0
310)
(0.0
115)
(0.0
344)
(0.0
119)
(0.0
367)
FDI
polic
yre
form
sin
dex
0.02
640.
943∗∗
∗−0
.104
0.30
90.
0370
0.42
8(0
.172
)(0
.261
)(0
.154
)(0
.287
)(0
.158
)(0
.319
)Conflic
tfo
rre
gim
ech
ange
−0.0
579
0.02
82−0
.040
20.
0090
2−0
.012
50.
0187
(0.0
399)
(0.1
16)
(0.0
399)
(0.1
70)
(0.0
402)
(0.1
66)
Polit
yIV
Dem
ocr
acy
Index
0.89
0∗∗∗
0.16
2∗∗∗
(0.2
53)
(0.0
215)
Polit
ical
Const
rain
tsIn
dex
III
1.01
7∗∗∗
5.48
1∗∗∗
(0.2
71)
(0.7
63)
Polit
ical
Const
rain
tsIn
dex
V1.
613∗∗
∗3.
631∗∗
∗
(0.3
05)
(0.5
24)
126
Adju
sted
R-s
quar
ed0.
479
0.30
90.
246
Firs
tst
age
FSt
atis
tic78
∗∗∗
81.3
7∗∗∗
90.9
4∗∗∗
Ander
son
canon
corr
elat
ion
LRte
st20
5.5∗∗
∗13
5.58
∗∗∗
169.
96∗∗
∗
Cra
gg-D
onal
dst
atis
tic22
9.75
∗∗∗
146∗∗
∗18
6.64
∗∗∗
Han
sen
Jst
atis
tic(p
valu
e)0.
5936
0.36
440.
1542
Pag
an-H
allge
ner
alst
atis
tic(p
valu
e)0.
8063
0.16
190.
0147
Wu-H
ausm
anF
test
11.4
2∗∗∗
47.4
3∗∗∗
81.9
2∗∗∗
Durb
in-W
u-H
ausm
anχ
2te
st11
.57∗∗
∗46
.21∗∗
∗77
.00∗∗
∗
LRte
stvs
.lin
ear
regr
essi
on
2092
.3∗∗
∗20
67.8
∗∗∗
2074
.4∗∗
∗
Log
rest
rict
ed-lik
elih
ood
−796
.2−7
95.3
−788
.4N
o.ofco
untrie
s95
9595
9595
95N
o.ofobse
rvat
ions
990
938
990
927
990
922
Note
s:Robust
stan
dar
der
rors
inpar
enth
eses
∗∗∗ p<
.01,
∗∗p<
.05,
∗ p<
.1;
MLE
-IV
=m
ulti
leve
lm
ixed
linea
res
timat
ions
with
inst
rum
enta
lva
riab
lem
ethod;
Log
TA=
tota
las
sets
inU
S$m
illio
n(logg
ed).
127
TAB
LE4
Polit
ical
Ris
kan
dU
.S.Fo
reig
nA
ffilia
tes’
Ret
urn
on
Inve
stm
ents
(1)
(2)
(3)
(4)
(5)
(6)
log
inco
me
log
inco
me
log
inco
me
log
inco
me
log
inco
me
log
inco
me
Var
iable
sM
LE-I
V2S
LS-I
VM
LE-I
V2S
LS-I
VM
LE-I
V2S
LS-I
V
Const
ant
−4.1
88∗∗
∗−4
.749
∗∗∗
−4.2
57∗∗
∗−5
.223
∗∗∗
−4.5
38∗∗
∗−5
.052
∗∗∗
(1.4
52)
(0.8
93)
(1.4
61)
(1.0
48)
(1.4
54)
(1.0
47)
Per
capita
GD
P(log)
0.69
8∗∗∗
0.46
5∗∗∗
0.69
8∗∗∗
0.40
7∗∗∗
0.68
2∗∗∗
0.39
0∗∗∗
(0.1
44)
(0.0
708)
(0.1
42)
(0.0
782)
(0.1
43)
(0.0
789)
Per
capita
GD
Pgr
ow
thra
te0.
0180
∗∗∗
0.03
38∗∗
∗0.
0204
∗∗∗
0.03
83∗∗
∗0.
0185
∗∗∗
0.03
43∗∗
∗
(0.0
0603
)(0
.008
38)
(0.0
0621
)(0
.009
15)
(0.0
0602
)(0
.009
07)
Popula
tion
(log)
0.17
6∗∗0.
226∗∗
∗0.
171∗∗
0.27
5∗∗∗
0.17
0∗∗0.
260∗∗
∗
(0.0
750)
(0.0
519)
(0.0
746)
(0.0
553)
(0.0
741)
(0.0
613)
Infr
astruct
ure
(log)
0.25
3∗∗∗
0.23
2∗∗∗
0.24
4∗∗∗
0.24
5∗∗∗
0.19
1∗∗0.
230∗∗
∗
(0.0
929)
(0.0
594)
(0.0
937)
(0.0
707)
(0.0
962)
(0.0
721)
Dom
estic
cred
it/G
DP
−0.0
051∗
0.01
11∗∗
∗−0
.004
500.
0073
1∗∗∗
−0.0
0481
0.00
643∗∗
∗
(0.0
0305
)(0
.002
27)
(0.0
0303
)(0
.002
19)
(0.0
0302
)(0
.002
25)
Exc
han
gera
te5.
22e−
052.
45e−
055.
05e−
053.
01e−
055.
57e−
05−2
.58e
−05
(7.5
2e−0
5)(3
.13e
−05)
(7.4
4e−0
5)(3
.55e
−05)
(7.4
7e−0
5)(4
.10e
−05)
Oil
exports
shar
e0.
0046
40.
0213
∗∗∗
0.00
524
0.01
96∗∗
∗0.
0068
6∗0.
0203
∗∗∗
(0.0
0373
)(0
.003
35)
(0.0
0387
)(0
.002
97)
(0.0
0385
)(0
.003
11)
Labor
grow
th0.
0200
0.17
7∗∗∗
0.02
600.
183∗∗
∗0.
0444
∗0.
186∗∗
∗
(0.0
242)
(0.0
336)
(0.0
258)
(0.0
353)
(0.0
264)
(0.0
364)
FDI
polic
yre
form
sin
dex
0.44
51.
124∗∗
∗0.
261
0.48
20.
432
0.59
2∗
(0.3
51)
(0.2
96)
(0.3
25)
(0.3
04)
(0.3
28)
(0.3
27)
Conflic
tfo
rre
gim
ech
ange
0.04
470.
0658
0.06
760.
0689
0.09
940.
0799
(0.0
921)
(0.1
05)
(0.0
923)
(0.1
23)
(0.0
927)
(0.1
28)
Polit
yIV
Dem
ocr
acy
Index
1.14
2∗∗0.
109∗∗
∗
(0.5
00)
(0.0
257)
Polit
ical
Const
rain
tsIn
dex
III
1.01
7∗3.
791∗∗
∗
(0.5
61)
(0.8
89)
Polit
ical
Const
rain
tsIn
dex
V1.
845∗∗
∗2.
604∗∗
∗
(0.5
93)
(0.6
08)
128
Adju
sted
R-s
quar
ed0.
374
0.30
10.
271
Firs
tst
age
FSt
atis
tic78
.37∗∗
∗75
.04∗∗
∗78
.83∗∗
∗
Ander
son
canon
corr
elat
ion
LRte
st19
9.94
∗∗∗
123.
78∗∗
∗14
7.84
∗∗∗
Cra
gg-D
onal
dst
atis
tic22
2.19
∗∗∗
132.
17∗∗
∗16
0∗∗∗
Han
sen
Jst
atis
tic(p
valu
e)0.
9181
0.46
10.
3147
Pag
an-H
allge
ner
alst
atis
tic(p
valu
e)0.
9629
0.47
140.
4196
Wu-H
ausm
anF
test
4.39
∗∗19
.85∗∗
∗33
.22∗∗
∗
Durb
in-W
u-H
ausm
anχ
2te
st4.
48∗∗
19.9
2∗∗∗
32.8
6∗∗∗
LRte
stvs
.lin
ear
regr
essi
on
977.
9∗∗∗
970.
8∗∗∗
975.
4∗∗∗
Log
rest
rict
ed-lik
elih
ood
−157
0.3
−157
1.1
−156
7.9
No.ofco
untrie
s95
9595
9595
95N
o.ofobse
rvat
ions
1013
964
1013
953
1013
948
Note
s:Robust
stan
dar
der
rors
inpar
enth
eses
∗∗∗ p<
.01,
∗∗p<
.05,
∗ p<
.1;
MLE
-IV
=m
ulti
leve
lm
ixed
linea
res
timat
ions
with
inst
rum
enta
lva
riab
lem
ethod.
129
130 K. C. Vadlamannati
competition) is not of the utmost importance, but rather how power is used(that is, checks and balances in the system). In countries with huge resourcerents, checks and balances become even more important as most of the FDIprojects are capital intensive in nature with a large amount of investmentlocked in fixed assets. For example, the instant democracies (like Africancountries in the 1990s) are largely associated with instant electoral compe-tition; however, it is not possible to instantly build checks and balances inthe system, which puts constraints on the executive. Henisz (2002) calls this“contractual hazards.” Notice that these results show a robustly positive asso-ciation across the columns, signifying the importance of political constraintson foreign affiliates’ operations, net of all the control variables.
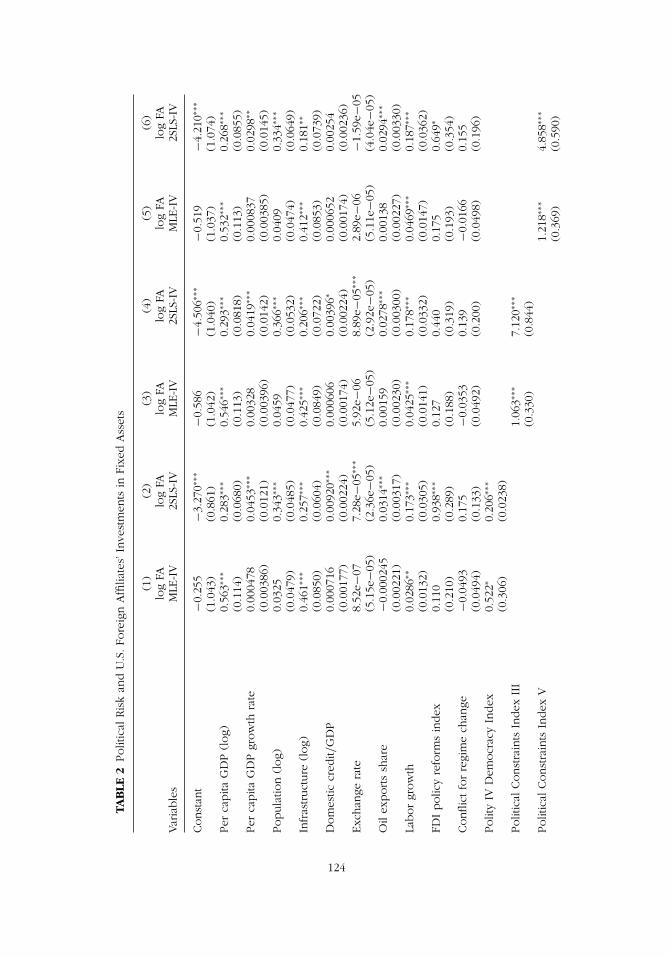
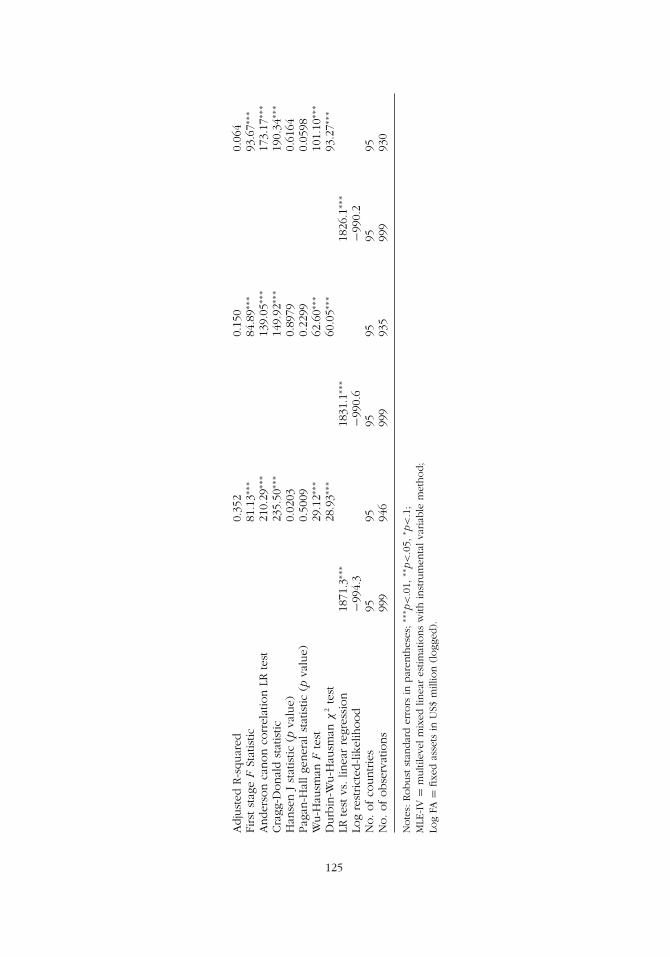
My results also indicate no contradiction between different operationsof U.S. firms in the host countries. Table 2 shows that a point increase inthe polity IV index raises U.S. firms’ investments in fixed assets (logged)by roughly 0.52%. These positive effects are reconfirmed by the two-stageleast squares method in column 2. A standard deviation increase in thepolity IV index would increase firms’ investments in fixed assets by roughly1.36%, which is 66% of the standard deviation of polity IV index (see column2, Table 2). Further columns show that both forms of political constraintsindices are significantly different from zero at the 1% level, irrespective of theestimation technique. In both cases, the substantial positive impact is muchhigher than polity IV index. In Table 3, I replace the dependent variable withtotal assets (logged). As seen here (column 1 and 2), polity IV correlatespositively with an increase in total assets and is statistically highly significantin both models. On the other hand, an increase in the political constraintindices would raise the value of total asset investments by 1.02% and 1.6%respectively (see column 3 and 5, Table 3). These positive effects of politicalconstraints indices are once again reconfirmed by the two-stage least squaresmethod (see column 4 and 6). Finally, all three political risk indicators arefound to be positive and significantly different from zero at the 1% level inrelation to the income earned by the U.S. firms in the host countries (seeTable 4). Given that these results are net of the indirect effects through otherkey determinants of firms’ operations, the total impact of political risk is notnegligible.
All tables list additional statistics that confirm the strength of the instru-ments for the models estimated using the 2SLS-IV method. Regarding theendogeneity tests, the joint F-statistic here allows us to reject the null hypoth-esis that the instruments selected for all the models in Tables 1–4 can betreated as exogenous. The F-statistic from the first stage for all the modelsrejects the null that the instruments selected are not relevant. The resultsfor the Cragg-Donald and Anderson canon likelihood ratio (LR) statisticsoverwhelmingly reject the null of weak instruments at the 1% level. Finally,the Hansen J-Statistic shows that the null-hypothesis of exogeneity cannot be
Impact of Political Risk on FDI 131
rejected at the conventional level of significance.9 I also ran the reduced formregression of the selected instruments and respective dependent variables forall the models, and the estimates of the selected instruments remained sta-tistically insignificant.10 With these additional tests, I have avoided the weakinstrument problem, and the results are robust. In all the models, the resultsof the Durbin Wu-Hausman test to examine the claims of endogeneity, sug-gested by Durbin (1954), Wu (1974), and Hausman (1978), reject the nullindicating that the instrumental variables technique is required. I also employPagan and Hall’s (1983) test of heteroskedasticity and find no support forthe presence of heteroskedasticity.
With respect to the controls, it is interesting to note that in all modelswith different dependent variables, there is a consistency with the theoreticalexpectations. There is a positive relationship between economic develop-ment (per capita GDP) and firms’ operations. Although the results on therate of growth of income are positive, they are largely insignificant. Likeothers, I find that countries with large market size (population) are associ-ated with an increase in firms’ operations (Agarwal and Ramaswami 1992,Gatignon and Anderson 1988). I also find that the level of infrastructure andavailability of domestic credit are positive and significantly different fromzero at the 1% level. While the results of infrastructure remained robustacross the board, I could not find a significant effect of domestic credit inTable 2. The results related to exchange rates remain largely insignificant.On the other hand, I find that resource rich states attract U.S. firms, which isnot reconfirmed by the multilevel mixed liner models. The rate of growth inlabor availability has positive effects on firms’ operations. Last, as expectedI find that FDI reforms play a positive role in increasing the operations ofU.S. firms.
Further Checks on Robustness
I examine the robustness of my main findings in the following ways. First,I replaced the main political risk indicators with the polity IV executiveconstraints index as well as the checks and balances measure from theDatabase of Political Institutions. The results pertaining to these variables areprovided upon request. In all the models, both these variables are found tobe positive and significantly different from zero at the 1% level. However, thesignificant results regarding the executive constraints index are not recon-firmed by the multilevel mixed linear-IV method. Second, I replaced thepolity IV measure of democracy index with Freedom House’s index. I take
9Alternatively, I also test the exogeneity of the instruments using a Basmann test. I find the results to besimilar to that of the Hansen J-statistic.10Results are not shown due to brevity but can be provided upon request.
132 K. C. Vadlamannati
the average of the civil liberty and political freedom indices, coded on a scaleof 0–7, with higher values representing worse liberties. Despite some changein this variable, I do not find any change in our results. Third, I also ran allthe results by replacing my existing instruments with two new instruments,namely number of years since independence and number of years since theconstitution has been formed. Both these variables were used because coun-tries with a long history of autonomous rule are more likely to be associatedwith democratic institutions (Persson 2005). Prominent studies in the liter-ature, such as, Acemoglu, Johnson, Robinson, and Yaned (2004), Mobarak(2005), Persson, Tabellini, and Trebbi (2001), Vreeland (2003), Eichengreenand Leblang (2008), have used either one or both of these variables as adeterminant of democracy. Our results remain robust to the use of alterna-tive instruments. In summary, the results obtained seem robust to alternativeinstruments, specifications, and testing procedures and are reconfirmed bythe 2SLS-IV method.
CONCLUSION
The founding father and current President of Zimbabwe, Robert Mugabe,is fond of saying “Zimbabwe for Zimbabweans” when introducing newIndigenous Acts, a sentiment echoed by many poor Zimbabweans whohave seen MNCs exploit their resources to make profits. This Act severelyrestricts the presence and operations of foreign firms in Zimbabwe. Therecent changes in business law by the Zimbabwean President have onceagain brought “political risk” into the spotlight, namely the issue of directexpropriation of foreign assets. When assessing the impact of political riskon FDI, the copious amount of previous research presents a systematicallyargued empirical analysis illustrating that political risk reduces FDI inflows.However, this conclusion seems to be somewhat premature. I argue thatmost of the past findings use macrolevel FDI data to test micro-level the-ories, which is inadequate. In this article, I examine various risk hedgingstrategies which MNCs may employ when operating in a high risk envi-ronment. Moreover, reverse-causality is one of the most serious issues inestimating the effects of political risk on FDI, which the studies dealing withfirm level analysis have failed to address.
To reassess the propositions, I make use of aggregate data on U.S. firms’investment activities in 101 developing countries during the period 1997–2007. Using both multilevel mixed-effects linear regression—IV and 2SLS—IV (with time effects) methods, I find that lower political risk is associatedwith an increase in U.S. firms with an equity stake of 51% or above, followedby a higher proportion of investment in fixed assets and also an increase intheir return on investments, controlling for a host of relevant factors. Theseresults bring the multiple risk hedging strategies available for foreign firms
Impact of Political Risk on FDI 133
operating in high risk environments to the fore. Our results reaffirm thatinstead of avoiding the lucrative markets, foreign investors can strategizeby restricting the size of their operations in countries with relatively highpolitical risk, thus minimizing obsolescence risk on their assets.
Taken together, these results provide scope for further research on thistopic. First, the focus of this study was on aggregate firm level data. Futureresearch might use disaggregated firm level data to check whether or notpolitical risk is an issue for MNCs in different sectors like manufacturing,services, and resource extraction. And if so, how differently do these effectsvary across sectors. Given the nature of operations, services sectors? tend toinvest less in fixed assets compared to manufacturing and extractive sectors.Therefore, one might expect the effects to vary across the board.11 Secondly,given the resurgence of leftists governments in some parts of the worldwhere U.S. firms have significant presence, future research could also focuson how foreign investors strategize in the face of a change of government(within a democratic system) with a different ideology, particularly thosewith extreme leftist tendencies.
REFERENCES
Acemoglu, Daron, Simon Johnson, James Robinson, and Pierre Yared. (2004)Income and Democracy. Mimeo. Boston: Department of Economics,Massachusetts Institute of Technology.
Agarwal, S., and S. Ramaswami. (1992) Choice of foreign entry mode: Impactof ownership, location and internalisation factors. Journal of InternationalBusiness Studies 23(1):1–16.
Aguiar, M., A. Bhattacharya, T. Bradtke, P. Cotte, S. Dertnig, M. Meyer, D. C. Michael,and H. Sirkin. (2006) The New Global Challengers: How 100 Top Companiesfrom Rapidly Developing Economies Are Changing the World. Boston: TheBoston Consulting Group.
Alfaro Laura, Sebnem Kalemli-Ozcan, and Vadym Volosovych. (2008) Why Doesn’tCapital Flow from Rich to Poor Countries? An Empirical Investigation. TheReview of Economics and Statistics 90(2):347–368.
Al Nasser, Oman. (2007) The Determinants of US FDI: Does the Regime matter?Global Economic Review 36(1):37–51.
Angrist, Joshua D., and Alan B. Krueger. (2001) Instrumental Variables and theSearch for Identification: From Supply and Demand to Natural Experiments.Journal of Economic Perspectives 15(Fall):69–85.
Asiedu, Elizabeth, and Donald D. Lien. (2004) Capital Controls and Foreign DirectInvestment, World Development, 32(3):479–490.
11For example, much of the Indian Information and Technology (IT) and allied industry’s balance sheetsshow negligible investments in fixed assets to liquid assets.
134 K. C. Vadlamannati
Beck, Nathaniel. (2001) Time-series Cross-section Data: What Have We Learned inthe Past Few Years? Annual Review of Political Science 4:271–293.
Beck, Nathaniel, and Jonathan N. Katz. (1995) What to Do (and Not to Do) withTime-Series Cross-Section Data. American Political Science Review 89(3):634–647.
Beck, Nathaniel L., and Jonathan N. Katz. (2007) Random Coefficient Models forTime-Series—Cross-Section Data: Monte Carlo Experiments, Political Analysis15:182–195.
Beck, Thorsten, George Clarke, Alberto Groff, Philip Keefer, and Patrick Walsh.(2001) New Tools in Comparative Political Economy: The Database of PoliticalInstitutions. World Bank Economic Review. 15(1):165–176.
Bhagwati, Jagdish. (1999) Globalization: Who gains, Who loses? In Globalizationand Labour, edited by Horst Siebert. Tubingen: Mohr Siebeck, pp. 225–236.
Biglaiser, Glen, and Michelle Danis. (2002) Privatization and Democracy: TheEffects of Regime Type in the Developing World. Comparative Political Studies35(1):83–102.
Biglaiser, Glen, and Karl DeRouen. (2006) Economic Reforms and Inflows ofForeign Direct Investment in Latin America. Latin American Research Review.41(1):51–75.
Blonigen, Bruce A. (2005) A Review of the Empirical Literature on FDI Determinants.Atlantic Economic Journal 33(4):383–403.
Blonigen, Bruce A., and Ronald B. Davies. (2004) The Effects of Bilateral Tax Treatieson U.S. FDI Activity. International Tax and Public Finance 11(15):601–622.
Bound, John, David A. Jaeger, Regina M. Baker. (1995) Problems with InstrumentalVariables Estimation When the Correlation Between the Instruments and theEndogenous Explanatory Variable Is Weak. Journal of the American StatisticalAssociation 90(430):443–450.
Brown, Drusilla K., Alan V. Deardorff, and Robert M. Stern. (2003) The Effects ofMultinational Production on Wages and Working Conditions in DevelopingCountries. Cambridge, Mass: NBER.
Busse, Matthias, and Carsten Hefeker. (2007) Political Risk, Institutions and FDI.European Journal of Political Economy. 23(2):397–415.
Cameron, Colin, and Patrick Trivedi. (1998) Regression Analysis of Count Data.Cambridge: Cambridge University Press.
Campos, Nauro F., and Yuko Kinoshita. (2008) Foreign Direct Investment andStructural Reforms: Evidence from Eastern Europe and Latin America. IMFWorking Papers, 2008/26. Washington DC: International Monetary Fund.
Coeurdacier, Nicolas, Roberto A. De Santis, and Antonin Aviat. (2009) Cross-borderMergers and Acquisitions and European Integration. Economic Policy 24(57):55–106.
Cho, Seo-Young. (2010) International Human Rights Treaty to Change SocialPatterns—The Convention on the Elimination of All Forms of DiscriminationAgainst Women. Cege Discussion Paper Series No. 93. Goettingen, Germany:Georg-August University.
Cushman, David O. (1985) Real Exchange Rate Risk, Expectations, and the Level ofDirect Investment. Review of Economics and Statistics 67(2):297–308.
Cragg, John G, and S. G. Donald. (1993) Testing Identifiability and Specification inInstrumental Variable Models. Econometric Theory. 9:222–240.
Impact of Political Risk on FDI 135
Daude, Christian, and Ernesto Stein. (2007) The Quality of Institutions and FDI.Economics and Politics 19(3):317–344.
Daude, Christian, J. Mazza, and A. Morrison. (2003) Core Labor Standards andForeign Direct Investment in Latin America: Does Lax Enforcement of LaborStandards Attract Investors? Washington, DC: Inter-American DevelopmentBank.
Dreher, Axel, Christian Bjornskov, and Justina A.V. Fischer. (2010, forthcoming).Formal Institutions and Subjective Well-being: Revisiting the Cross-countryEvidence. European Journal of Political Economy.
Dreher, Axel, Heiner Mikosch, and Stefan Voigt. (2010) Membership Has ItsPrivileges—The Effect of Membership in International Organizations on FDI.Paper presented at the Conference on the Political Economy of InternationalOrganizations, Washington, DC.
Dunning, John. (1988a) The Eclectic Paradigm of International Production; ARestatement and Some Possible Extensions. Journal of International BusinessStudies 19:1–31.
Dunning, John H. (1988b) Explaining International Production. London: UnwinHyman.
Dunning, John H. (1993) Multinational Enterprises in the Global Economy.Wokingham Berks: Addison Wesley.
Dunning, J. H. (1994) Re-evaluating the Benefits of Foreign Direct Investment.Transnational Corporations 3(1):27–51.
Durbin, J. (1954) Errors in Variables. Review of the International Statistical Institute22(1/3):23–32.
Eaton, Jonathan, and Mark Gersovitz. (1984) A Theory of Expropriation andDeviations from Perfect Capital Mobility. Economic Journal 94(March):16–40.
Eichengreen, Barry J. and David A. Leblang. (2008) Democracy and Globalization.Economics and Politics 20(3):289–334.
Egger, Peter, and Hannes Winner. (2005) Evidence on Corruption as an Incentivefor FDI. European Journal of Political Economy 21(4):932–952.
Fatehi, Kamal, and Hossein M. Safizadeh. (1994) The Effect of SociopoliticalInstability on the Flow of Different Types of FDI. Journal of Business Research31(1):65–73.
Feinberg, Susan E., and Anik K. Gupta. (2009) MNC Subsidiaries and Country Risk:Internalization as a Safeguard against Weak External Institutions. Academy ofManagement Journal 52(2):381–399.
Gassebner, M., and Pierre-Guillaume Méon. (2010) Where do Creditor Rights Matter?Creditor Rights, Political Constraints and Cross-border Mergers and Acquisitionsactivity. Zurich: CEB Working Paper 10/09.
Gatignon, H., and E. Anderson. (1988). The multinational corporation’s degreeof control over foreign subsidiaries: An empirical test of a transaction costexplanation. Journal of Law, Economics, and Organization 4(2):305–336.
Gleditsch, Nils Petter, Peter Wallensteen, Mikael Eriksson, Margareta Sollenberg, andHåvard Strand. (2002) Armed Conflict 1946–2001: A New Dataset. Journal ofPeace Research 39(5):615–637.
136 K. C. Vadlamannati
Hahn, Jinyong, and Jerry Hausman. (2002) A New Specification Test for the Validityof Instrumental Variables. Econometrica 70(1):163–189.
Hahn, Jinyong, and Jerry Hausman. (2003) Weak Instruments: Diagnosis and Curesin Empirical Econometrics. American Economic Review. 93(2):118–125.
Hansen, L. Peter (1982) Large Sample Properties of Generalized Method of MomentsEstimators. Econometrica 50(4):1029–1054.
Hausman, Jerry A. (1978) Specification Tests in Econometrics. Econometrica46(6):1251–1271.
Henisz, Witold J. (2000) The Institutional Environment for Economic Growth.Economics and Politics 12(1):1–31.
Henisz, Witold J. (2002a) Politics and International Investment. Cheltenham, UK:Edward Elgar.
Henisz, Witold J. (2002b) The Institutional Environment for InfrastructureInvestment. Industrial and Corporate Change 11(2):355–89.
Henisz, Witold J. (2004) Political Institutions and Policy Volatility. Economics andPolitics. 16(1):1–27.
Jakobsen, Jo, and Indra de Soysa. (2006) Do Foreign Investors Punish Democracy?Theory and Empirics, 1984–2001. Kyklos 59(3):383–410.
Jensen, Nathan M. (2003) Democratic Governance and Multinational Corporations:Political Regimes and Inflows of Foreign Direct Investment. InternationalOrganization 57(3):587–616.
Jensen, Nathan M. (2006) Nation-States and the Multinational Corporation: PoliticalEconomy of Foreign Direct Investment. Princeton: Princeton University Press.
Jun, K.W., and H. Singh. (1996) The Determinants of FDI: New Empirical Evidence.Transnational Corporations. 5(2):67–106.
Keefer, Philip, and David Stasavage. (2003) The Limits of Delegation: Veto Players,Central Bank Independence and the Credibility of Monetary Policy. AmericanPolitical Science Review 97(4):403–427.
Kobrin, Stephen J. (1980) Foreign Enterprise and Forced Divestment in LDCs.International Organization 34(1):65–88.
Kobrin, Stephen J. (1984) Expropriation as an Attempt to Control Foreign Firms inLDCs: Trends from 1960 to 1979. International Studies Quarterly 28(3):329–348.
Kobrin, Stephen J. (1985) Expropriation as an Attempt to Control Foreign Firms inLDCs: Trends from 1960 to 1979. In Political Risk in International Business:New Directions for Research, Management, and Public Policy, edited byThomas L. Brewer. New York: Praeger.
Le Quan, and Pawl Zak. (2006) Political Risk and Capital Flight. Journal ofInternational Money and Finance 25(2):308–329.
Li, Quan, and Adam Resnick. (2003) Reversal of Fortunes: Democratic Institutionsand Foreign Direct Investment Inflows to Developing Countries. InternationalOrganization 57(1):175–212.
Lipsey, Robert E. (2002) Home and Host Country Effects of FDI . NBER Working paper9293. Boston: National Bureau of Economic Research.
Lowrey, Annie. (2010) Zimbabwe’s Terrible New Business Law. Foreign Policy, April6 2010. http://blog.foreignpolicy.com/posts/2010/03/01/zimbabwes_terrible_new_business_law
Malesky, Edmund J. (2008) Straight Ahead on Red: How Foreign Direct InvestmentEmpowers Sub National Leaders. The Journal of Politics 70(1):97–119.
Impact of Political Risk on FDI 137
Mobarak, Ahmed Mushfiq. (2005) Democracy, Volatility, and EconomicDevelopment. Review of Economics and Statistics 87(2):348–61.
Montero, Altred P. (2008) Macroeconomic Deeds, Not Reform Words: Determinantsof Foreign Direct Investment in Latin America. Latin American Research Review43: 55–83.
Pagan, Adrian R., and A. D. Hall. (1983) Diagnostic Tests as Residual Analysis.Econometric Reviews 2(2):159–218.
Persson, Torsten. (2005) Forms of Democracy, Policy and Economic Development,Manuscript. Stockholm: Institute for International Economic Studies, StockholmUniversity.
Persson, Torsten, Guido Tabellini, and Francesco Trebbi. (2001) Electoral Rulesand Corruption. Working Paper 8154. Boston: National Bureau of EconomicResearch.
Pinto, M. Pablo, and Santiago M. Pinto. (2006) The Politics of InvestmentPartisanship and the Sectoral Allocation of Foreign Direct Investment. Paperpresented at American Political Science Association 2006, Pennsylvania.
Resnick, Adam. (2001) Investors, Turbulence and Transition: Democratic Transitionand Foreign Direct Investment in Nineteen Developing Countries. InternationalInteractions 27(4):381–98.
Rosendorff, B. Peter, and James Raymond Vreeland. (2006) Democracy and DataDissemination: The Effect of Political Regime on Transparency. Unpublishedmanuscript.
Scaperlanda, Anthory E., and Laurence J. Mauer. (1969) The Determinants of U.S.Direct Investment in the EEC. The American Economic Review 59(4):558–570.
Schneider, Friedrich, and Bruno S. Frey. (1985). Economic and PoliticalDeterminants of FDI. World Development 13(2):161–175.
Staiger Douglas, and James H. Stock. (1997) Instrumental Variables Regression withWeak Instruments. Econometrica 65(3):557–586.
Stock, James, Jonathan H. Wright, and Motohiro Yogo. (2002) A Survey of WeakInstruments and Weak Identification in Generalized Method of Moments.Journal of Business and Economic Statistics 20(4):518–529.
Tuman, John P. (2009) The Political and Economic Determinants of Foreign DirectInvestment in Latin America. Latin American Research Review 44(1):191–194.
Tuman, John P., and Craig F. Emmert. (2004) The Political Economy of US ForeignDirect Investment in Latin America: A Reappraisal. Latin American ResearchReview 39(3):9–28.
Vernon, Raymond. (1971) Sovereignty at Bay: The Multinational Spread of USEnterprises. New York: Basic Books.
Vreeland, James Raymond. (2003) A Continuous Schumpeterian Conception ofDemocracy. Manuscript. New Haven, CT: Department of Political Science, YaleUniversity.
Wheeler D., and A. Mody. (1992) International Investment Location Decisions: TheCase of US Firms, Journal of International Economics 33(1–2):57–76.
World Bank. (2008) World Development Indicators. Available at http://data.worldbank.org/data-catalog/world-development-indicators
Wu, D. M. (1974) Alternative Tests of Independence Between Stochastic Regressorsand Disturbances: Finite Sample Results. Econometrica 42(3):529–546.
138 K. C. Vadlamannati
APPENDIX 1: COUNTRIES UNDER STUDY
Algeria El Saluador Morocco TurkeyAngola Equatorial Guinea Nicaragua UgandaArgentina Estonia Nigeria United Arab EmiratesAntigua and Barbuda Ethiopia Oman UzbekistanAzerbaijan Gabon Pakistan VenezuelaBahamas Ghana Panama UkraineBahrain Guatemala Papua New Guinea UruguayBangladesh Guyana Paraguay VietnamBarbados Haiti Peru YemenBelize Honduras Philippines ZambiaBolivia Hungary Poland ZimbabweBotswana India QatarBrazil Indonesia RomaniaBrunei Israel Russian FederationBulgaria Italy Saudi ArabiaCameroon Jamaica SenegalChad Jordan SingaporeChile Kenya SlovakiaChina Kazakastan SlovaniaColombia Korea Republic South AfricaCongo, Democratic Republic Kuwait St. LuciaCongo Republic Latvia Sri LankaCosta Rica Lithuania SurinameCote d’Ivoire Lebanon SwazilandCroatia Liberia TaiwanCzech Republic Libya TanzaniaDominica Malaysia ThailandDominican Republic Malawi TogoEcuador Mauritius Trinidad and TobagoEgypt Mexico Tunisia
Impact of Political Risk on FDI 139
APPENDIX 2: DATA SOURCES
Indicators Data sources
Polity IV indices Polity IV, (http://www.colorado.edu/IBS/GAD/spacetime/data/Polity.html)
Political constraints indices Henisz (2002)Checks and Balances Beck et al. (2001), Keefer and Stasavage (2003)log Population World Development Indicators–2007, http://ddp-ext.
worldbank.org/WDIlog Per capita GDP World Development Indicators—2007, http://ddp-ext.
worldbank.org/WDIPer capita GDP growth World Development Indicators—2007, http://ddp-ext.
worldbank.org/WDIlog Infrastructure World Development Indicators—2007, http://ddp-ext.
worldbank.org/WDIOil exports share Own construction from WTO trade statistics, 2010Domestic credit/GDP World Development Indicators—2007, http://ddp-ext.
worldbank.org/WDIFDI reforms index Annual Report on Exchange Arrangements and Exchange
Restrictions, IMFLabor growth World Development Indicators—2007, http://ddp-ext.
worldbank.org/WDIConflicts UCDP dataset (Gleditsch et al., 2002)
APPENDIX 3: DESCRIPTIVE STATISTICS
Variables Mean Minimum MaximumStandardDeviation Observations