1 Impact of regional trade agreements on commodity trade between China and Australia Tianshu Liu, Xuean Jiao * May 2006 Abstract This paper aims to analyse the impact of current regional trade agreements on commodity trade between China and Australia. The paper estimates data from 1992-2004, using China’s commodity exports and imports to and from Australia as dependent variables to do a partial equilibrium analysis. Economic variables that explain the economic condition in China are estimated. Additional dummy variables that are related with China’s membership in a regional trade agreement are introduced as dummy variables into the model. The regional trade agreements of EU, NAFTA, CER, ASEAN and APEC are estimated in the model. The results show that the inception of a regional trade agreement, especially NAFTA and APEC, has affected China’s commodity trade with Australia to some extent. Key words: Regional trade agreements, commodity trade, partial equilibrium analysis * Tianshu Liu: School of Economics, Finance and Marketing, RMIT University, Melbourne, Australia. E-mail: [email protected]Xuean Jiao: School of Marketing, Monash University, Melbourne, Australia. E-mail: [email protected]
Transcript
1
Impact of regional trade agreements on commodity trade between China and Australia
Tianshu Liu, Xuean Jiao*
May 2006
Abstract This paper aims to analyse the impact of current regional trade agreements on commodity trade
between China and Australia. The paper estimates data from 1992-2004, using China’s commodity
exports and imports to and from Australia as dependent variables to do a partial equilibrium
analysis. Economic variables that explain the economic condition in China are estimated.
Additional dummy variables that are related with China’s membership in a regional trade
agreement are introduced as dummy variables into the model. The regional trade agreements of
EU, NAFTA, CER, ASEAN and APEC are estimated in the model. The results show that the
inception of a regional trade agreement, especially NAFTA and APEC, has affected China’s
In these two equations DEXP and DIMP are China’s exports and imports by commodity to and from
Australia respectively (adjusted by GDP deflator). GDP is China’s gross domestic products at
constant 1990 price. Distance is the distance between capital cities of China and Australia.
Population is China’s population. Exchange rate is defined as one U.S. Dollar equals to a number
of Renminbi. T is time period, and i stands for different classified commodities.
EU, CUSFTA, NAFTA, ASEAN and CER are regional economic integration excluding China as
their member. They take the value of 1 when they form a regional economic agreement, indicating
the impact of their aggregation on China’s trade with Australia, and zero otherwise.
APEC is the only RTA China participates in. It is defined differently from other RTA dummies. As
China became a member of APEC in 1991 and the available commodity trade data is from 1992, it
is incredible to estimate the impact of APEC when it is defined the same as other RTA dummies.
Therefore a substitute dummy definition is adopted here. Lu points out that APEC’s development
over these fifteen years (until 2004) can be separated into two periods: the first period is
prosperous developing period from 1989 to 1997, and the second period is adjusting slow
developing period from 1998 up to now. The 1997 Asian financial crisis is the separated year.
During the first eight years, APEC actively promoted liberalizing trade and investment in Asia-
Pacific region pushed by 1994 Bogor Goals, 1995 Osaka Action Agenda, and 1996 Manila Action
5
Plan. However as the 1997 Early Voluntary Sectoral Liberalization that tends to liberalize trade in
sector level was negatively affected by the 1997 Asian financial crisis, APEC enters slowly
developing period, slowing down its trade and investment liberalization progress. Up to now APEC
has not yet come out of the low tide.
In regard to different developing period, I choose to separate APEC development into two periods
as a dummy variable, i.e. 1992-1997, and 1998-2004. It takes the value of 1 for the former period
and zero for the latter period, indicating the high speed development of APEC has a positively
significant impact on China’s trade with Australia. Thus a positive relationship is expected between
the dummy and dependent variables.
2.3 Data source China’s merchandise trade with Australia data are obtained from SourceOECD International Trade
by Commodities Statistics from 1992 to 2004 in thousand U.S. Dollars. The data are classified
according to Standard International Trade Classification system Revision 2. In this paper 1-digit
subheading including 10 broad classified commodities and 2-digit subheadings commodities are
estimated in the model.
GDP and exchange rate data are collected from United Nations National Aggregate Database. The
distance (measured in kilometres) between Beijing and Canberra is obtained from “Direct-Line
Distances (International Edition)” of Fitzpatrick and Modlin. Exports, imports and GDP are deflated
by GDP deflator which is obtained from United Nations database.
3. Empirical result The data are estimated using pooled least squares method from 1992 to 2004. Both exports and
imports are estimated as a whole and by commodity separately. In the model estimation, only five
variables can be worked out, including GDP, population, exchange rate, NAFTA and APEC; other
variables are finally excluded from final regression of the model. Consequently the results show
only these five variables.
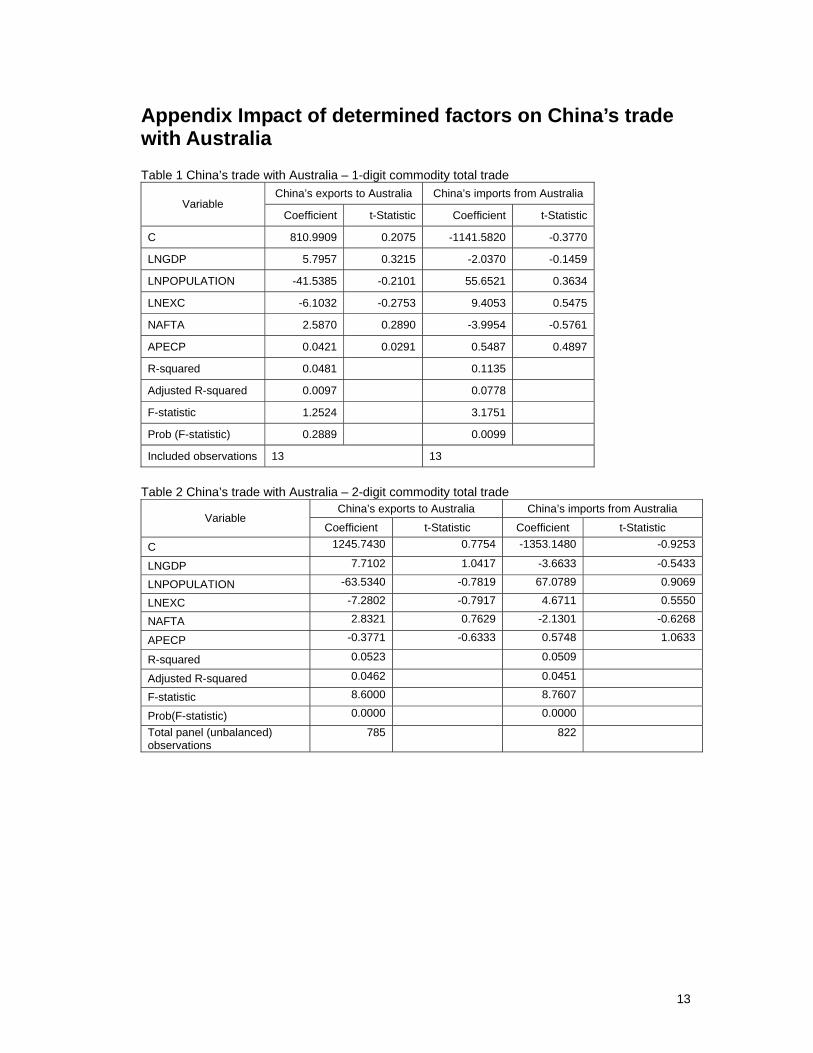
When regressions are made by using the whole pooled data, it is clear that there are no any
particular factors that have any statistical significant impact on China’s exports to and imports from
Australia, including the formation of NAFTA and different development of APEC (Table 1 and Table
2). However when considering detailed classified commodity, the results can be shown and
explained by the following.
3.1 Empirical results of China’s exports to Australia Generally speaking, the coefficients of GDP are found to have expected positive sign in nine out of
ten 1-digit commodities, including classification 0 Food and live animals, classification 2 Crude
materials, inedible, except fuels, classification 4 Animal and vegetable oils, fats and waxes,
classification 5 Chemicals and related products, classification 6 Manufactured goods classified
6
chiefly by material, classification 7 Machinery and transport equipment, classification 8
Miscellaneous manufactured articles, and classification 9 Commodities and transactions not
elsewhere classified; only the coefficient of classification 3 Mineral fuels, lubricants and related
materials is negative. Except classifications 1 and 3, the coefficients of GDP of other classifications
are statistically significant at 1 percent or 5 percent level. The results indicate that most of China’s
exports to Australia are highly related with China’s GDP changes, i.e. a higher GDP in China
pushes more exports to Australia.
However when considering regression results for impact of GDP on 2-digit commodities, not all
detailed commodities are positively affected in China’s exports to Australia. When China’s GDP
increases those commodities are intended to fulfill domestic demand and serve Chinese market
first. They are goods of basic food for human being and animals and resources from classifications
0, 1 and 2, including meat, cereals, feeding stuff, tobacco, crude materials, pulp and waste paper;
energy in classification 3, including coal and petroleum; medicines and dyeing materials in
classification 5; and photographic apparatus and watches in classification 8. Most of these goods
are inputs or semi-products in manufacturing process and are highly related with Chinese people’s
daily life. They will be in large demand when China’s GDP is growing larger.
In the 1-digit commodity regression, the coefficients of population have expected negative sign in
eight out of ten classified commodities; while the coefficients of classifications 1 and 3 show
positive signs. The negative coefficients are statistically significant at 1 percent level except
classification 2. The significant negative sign indicates that China intends to produce and exchange
those goods inside the country instead of exporting them to Australia.
It is worth noting that regression results of some goods in 2-digit classification show that the
pushing effect of population increases to China’s exports to Australia is quite opposite to that of
GDP growth. All the 2-digit classified goods which are negatively related with GDP growth are
positively related with population increases, indicating China’s increasing population does not block
these goods from exporting outside China, especially for resources, crude materials and energy.
This result is quite puzzling, totally opposite to common concept that China’s large population
consumes more resources, materials and energy goods. In the 1-digit regression, most of the coefficients of exchange rate are statistically significant at 1
percent level and 10 percent level for classification 9. It is expected to see positive signed
coefficients in classifications 7 and 8, which clearly supports the fact that when Renminbi is
devalued, more machinery, transport and various manufactured goods are exported to Australia.
However other classified goods are not positively affected and seem to export less when RMB is
depreciated. This may indicate that those goods are in large demand in domestic market; thus they
are lured to serve Chinese market instead of Australian market. Considering the 2-digit
commodities, the only goods in the rest classifications that are positively related with exchange rate
7
are those commodities of fish and cereals in classification 0, crude rubber and pulp and waste
paper in classification 2, dyeing materials, medicines, perfumes, manufactured fertilizers and
plastic materials in classification 5, leather and rubber manufactured goods, and paper goods in
classification 6.
In the 1-digit commodity regression, most of the coefficients of NAFTA are statistically significant at
1 percent level and 10 percent level for classifications 5 and 9. The coefficients show expected
positive sign in classifications 0, 1, 2, 3, 4, 5, 6 and 9, while negative signed coefficients are found
in classifications 7 and 8. As China is expected to become a ‘world factory’, its cheap and quality
manufactured goods are quite competitive around world market. It is not a surprise that those
products are hindered to North American market after NAFTA is formed and freely traded within the
region, where Canada and USA can import from Mexico after cutting down their customs duties.
This instead affects China exporting more to Australia, enlarging Australian market instead.
However in the above broad classifications there are some kinds of goods that China does not
enlarge its exports to Australia when NAFTA market is not as easy to enter as before. These kinds
of commodities focus on fish, cereals and sugar products in classification 0, pulp and waste paper
in classification 2, dyeing materials, medicines, perfumes, manufactured fertilizers and plastic
materials in classification 5, leather and paper goods in classification 6. They are either largely
needed in Chinese domestic market or Australia has other better importing sources.
In the 1-digit regression, the expected positively signed coefficients for APEC dummy variable are
found in classifications 0, 2, 3, 5, 8 and 9, while negative coefficients occur in the classified goods
of classifications 1, 4, 6 and 7. The coefficients of classifications 1, 8 and 9 are not statistically
significant; others are significant either at 1 percent or 5 percent level.
The results indicate that China intends to export more goods in broad classifications 0, 2, 3 and 5,
and fewer goods in classifications 4, 6 and 7. Considering detailed 2-digit commodities, China
exports fewer goods in tobacco, cork and wood, metalliferous ores and metal scraps in
classifications 1 and 2, coal, coke and briquettes in classification 3, dyeing materials, manufactured
fertilizers, explosives and pyrotechnic products in classification 5, apparel and clothing accessories
in classification 8, arms of war in classification 9; while at the same period China enlarges its
exports to Australia in goods of cork and wood manufactures, paper articles, manufactures of metal
in classification 6, machinery specialized for particular industries, metalworking machinery, office
machines and automatic data processing equipment, and road vehicles in classification 7.
3.2 Empirical results of China’s imports from Australia In the 1-digit commodity regression, positive coefficients of GDP are found expectedly in the first
eight classified commodities, with classifications 8 and 9 negative coefficients. Most coefficients are
statistically significant at 1 percent level; the coefficient of classification 3 is significant at 10 percent
level. The results show that most goods China imports from Australia increase when
8
simultaneously China’s consumption ability estimated by GDP increases, while some kinds of
goods in classifications 8 and 9 decrease when China’s GDP increases.
Considering regression results of GDP for 2-digit classification, some kinds of commodities show
fewer imports from Australia, including dairy and fish, vegetables and fruit, sugar and feeding stuff
in classification 0, oil seeds in classification 2, petroleum and gas in classification 3, animal-
vegetable oils fats in classification 4, dyeing materials in classification 5, cork and wood
manufacturers, paper and textile related products in classification 6; some of these goods like fish
could be produced by China itself. China also imports a little more of goods of professional and
scientific instruments in classification 8, and coin in classification 9.
In the 1-digit regression, the coefficients of population are statistically significant at either 1 percent
or 5 percent level. They have expected negative sign in classifications 0, 1, 2, 4, 5, 6 and 7, and
positive signs are found in classifications 3, 8 and 9. It indicates although China tends to import
fewer goods from Australia when China can produce by itself, China needs more energy goods and
electronic and military goods in classifications 8 and 9 to support its economic development.
In the detailed 2-digit classification, China tends to import more as larger population needs more
goods to consume, including basic food for human and animals in classification 0, oils seeds, crude
rubber and textile fibres in classification 2, petroleum and gas in classification 3, animal-vegetable
oils in classification 4, inorganic chemicals, dyeing materials, medicines, perfumes in classification
5, cork and wood manufactures, paper, textile yarn, iron and steel in classification 6.
In the 1-digit regression, the expected negatively signed coefficients of exchange rate are found
only in classifications 2, 3 and 6, which are also statistically significant at 1 percent level, indicating
China tends to import fewer goods in these classifications when Renminbi is devalued. The
coefficients of other classifications 0, 1, 4, 5, 7, 8 and 9 are all positively signed and statistically
significant at either 1 percent or 5 percent level. This result shows that China does not decrease
imports in these classifications from Australia although the imported cost in Renminbi increases.
Considering detailed 2-digit commodities after the price of Renminbi changes, China imports more
goods of oil seeds, crude rubber, pulp and waste paper in classification 2, leather and leather
manufactures, cork and wood manufactures, paper and paper articles, non-metallic mineral
manufactures, iron and steel in classification 6. While China imports fewer goods of meat,
vegetables and fruit, feeding stuff in classification 0, fixed vegetable oils and fats in classification 4,
organic and inorganic chemicals, perfumes, manufactured fertilizers, explosives and pyrotechnic
products, chemical materials and products in classification 5, power generating machinery, office
machines and automatic data processing equipment in classification 7, sanitary, plumbing, heating
and lighting fixtures in classification 8.
9
In the 1-digit commodity regression, it is expectedly to find positive coefficients of NAFTA in
classifications 2, 3 and 6, while negative ones are found in classifications 0, 1, 4, 5, 7, 8 and 9. It
indicates that under the influence of NAFTA’s implementation, China begins to import more from
Australia in crude materials, mineral fuels and material manufactured goods.
Considering detailed 2-digit commodities after NAFTA is formed, China imports more goods of
meat, vegetables and fruit, feeding stuff in classification 0, hides and skins, cork and wood, crude
fertilizers, metalliferous ores and metal scrap, crude animal and vegetable materials in
classification 2, coal, petroleum and gas in classification 3, fixed vegetable oils in classification 4,
organic and inorganic chemicals, perfumes, manufactured fertilizers, chemical materials and
products in classification 5, textile yarn, non-ferrous metals, and metal manufactures in
classification 6, power generating machinery, office machines and automatic data processing
equipment in classification 7, sanitary, plumbing products in classification 8.
In the 1-digit regression, most of the coefficients of APECP are found expectedly positively signed
and statistically significant at 1 percent level, while the coefficient of classification 5 is negative and
significant at 5 percent level. The results indicate clearly that the quick and prosperous
development of APEC enables China importing more goods from Australia.
Only imports of the following goods in detailed 2-digit classification are not growing as expected in
APEC’s fast development: live animals chiefly for food, feeding stuff in classification 0, oil seeds,
crude fertilizers and crude materials in classification 2, non-ferrous metals in classification 6, power
generating machinery, metalworking machinery, office machines, telecommunications and sound
recording apparatus, electrical machinery, road vehicles in classification 7, footwear in
classification 8. In classification 5, some goods are imported more although the whole classification
is not. They are manufactured fertilizers, explosives and pyrotechnic products.
3.3 Major regression conclusion China’s large GDP and its dramatic growth pushes China’s trade with Australia, both in
exports and imports. It is a crucial determined factor in improving trade between two countries.
Although China’s large population promotes China’s trade with Australia in some detailed 2-
digit commodities, it traps manufactured goods exported to Australia in 2-digit classifications 6,
7 and 8.
Generally speaking exchange rate does not have a positive effect on China’s trade with
Australia. However when considering detailed classified commodities, the depreciation of
Renminbi pushes China’s exports to Australia in chemical goods, machinery and transport
equipment and miscellaneous manufactured articles, including clothing and footwear.
RTA variables are found positively affected China’s trade with Australia. The formation of
North American Free Trade Area and its trade liberalization development tends to exclude
China’s goods outside North American market, especially USA and Canada markets.
Therefore it indirectly pushes China’s exports to Australia and imports from Australia.
10
The quick development of APEC before 1997 pushes China’s exports to Australia in resources,
energy, animals and chemicals, and imports from Australia in most goods except chemicals.
3.4 Modeling issues The trade data time series are only from 1992 to 2004, which are not reflected the development of
the two countries’ trade before and after 1991 when China participated in APEC for the first time.
The data also could not reflect the conditions before and after EU, ASEAN and CER’s
establishment. Therefore the impact of these regional trade agreements could not be estimated in
the pooled model. The positive and negative effect from NAFTA and APEC on China’s trade with
Australia could not reflect thoroughly if all RTAs have a definite impact.
4. Conclusion This paper studies the impact of regional trade agreements on China’s commodity trade with
Australia in discussing current China’s exports to and imports from Australia in SITC listed
commodities. The paper uses partial equilibrium model to estimate the relationship between
China’s trade with Australia and other determined factors, including China’s GDP changes,
population changes, changes of Renminbi prices, the formation of NAFTA and the development of
APEC.
The increases of China’s GDP enable Chinese consuming more goods from Australia and
producing and exporting more to Australia. However the large population of China discourages
China’s trade with Australia to some extent, which indicates that China has the tendency of trading
inside the country if more population is expected in the future. The devaluation of RMB does not
bring more trade to China from Australia as expected, while decreasing trade between two
countries to some extent. It might indicate that China’s currency depreciation policy does not reflect
correspondent effect.
The inception and implementation of regional trade agreements have a crucial impact on China’s
commodity trade with Australia. The North American market is integrated by NAFTA in 1990s,
where Canada and USA can import cheaper manufactured goods from Mexico. China as a major
exporter to USA is severely impacted by this activity. Thus China diverts to other countries to
enlarge its exports and imports, making Australia become China’s third major trading partner in
2003. At the same time the quick development of APEC has pushed both countries’ commodity
trade to some extent as well. Therefore under the development of regional economic integration
around the world, it is possible and necessary for China and Australia to involve in bilateral free
trade, which in turn encourages trade between the two countries.
Acknowledgement This paper is supported by Endeavour Australia Cheung Kong Awards 2005. The author would like
to thank the Cheung Kong Enterprises and the Australian Government for the financial support and
11
Institute of World Economics and Politics of Chinese Academy of Social Sciences of Beijing China
for academic support and proper supervision.
12
Reference Aitken, N. D., 1973. The effect of the EEC and EFTA on European trade: a temporal cross-section
analysis. American Economic Review, 63, pp. 881-892.
Bayoumi, T. and B. Eichengreen, 1997. Is regionalism simply a diversion: evidence from the
evolution of the EC and EFTA, In: Regionalism Versus Multilateral Trade Arrangements.
(eds Ito, T.&Krueger, A. O.), pp. 141-167. Chicago: University of Chicago Press.
Braga, P., R. Sadafi and A. Yeats, 1994. Regional integration in the Americas: deja vu all over
again? World Economy, 17, pp. 577-601.
DFAT (Department of Foreign Affairs and Trade, A. G. and C. Ministry of Commerce, 2005.