IMPACT OF RIVETING SEQUENCE, PITCH AND GAP BETWEEN SHEETS ON QUALITY OF RIVETED LAP JOINTS A Thesis by Kazi Aman Ullah M. Faishal Bachelor of Science in Mechanical Engineering, Bangladesh University of Engineering and Technology (BUET) Dhaka, Bangladesh, 2004 Submitted to the Department of Industrial and Manufacturing And the faculty of Graduate school of Wichita State University in partial fulfillment of the requirements of the degree of Master of Science December 2006
Transcript
i
IMPACT OF RIVETING SEQUENCE, PITCH AND GAP BETWEEN SHEETS ON QUALITY OF RIVETED LAP JOINTS
A Thesis by
Kazi Aman Ullah M. Faishal
Bachelor of Science in Mechanical Engineering, Bangladesh University of Engineering and Technology (BUET)
Dhaka, Bangladesh, 2004
Submitted to the Department of Industrial and Manufacturing And the faculty of Graduate school of
Wichita State University in partial fulfillment of
the requirements of the degree of Master of Science
December 2006
ii
IMPACT OF RIVETING SEQUENCE, PITCH AND GAP
BETWEEN SHEETS ON QUALITY OF RIVETED LAP JOINTS
I have examined the final copy of this thesis for form and content, and recommend that it be accepted in partial fulfillment of the requirement for the degree of Master of Science with a major in Industrial Engineering.
__________________________________ Dr. S. Hossein Cheraghi, Committee Chair We have read this thesis and recommend its acceptance: ___________________________________ Dr. Krishna K. Krishnan, Committee Member
___________________________________ Dr. Hamid M. Lankarani, Committee Member
iii
ACKNOWLEDGMENTS
I would like to express my gratitude to my supervisor, Dr. S. Hossein Cheraghi,
whose expertise, understanding, and patience added considerably to my graduate experience.
I appreciate his vast knowledge and skill in many areas and his assistance in writing reports,
which have on occasion made me "GREEN" with envy. I would also like to thank my co-
supervisor, Dr. Krishna Krishnan—without his help, this thesis would not have been possible.
Finally, I would like to thank Dr. Lankarani from the Faculty of Mechanical Engineering for
taking time out from his busy schedule to serve as my external reader.
This research would not have been possible without the financial assistance of NIS to
the Industrial Engineering Department of Wichita State University. I would like to extend my
gratitude to the NIS industry liaisons, Michael Hannigan from Cessna Aircraft and Tom Fagan
from Raytheon Aircraft, for their technical assistance and guidance.
I would also like to thank my family, including my parents, brother, sister, uncle Dr.
Rezaul Karim, Dr. Rdiwanur Rahman and aunt Dr. Halima Karim, for always being there
when I needed them most, and for supporting me through my entire life. In particular, I would
like to acknowledge my wife and best friend, Nadia, without whose love, encouragement and
editing assistance I would not have finished this thesis. Thanks are also due to all my dear
friends for encouraging me throughout my graduate career and especially for supporting me
during the completion of this thesis.
iv
ABSTRACT
This Thesis presents a study on the effect of controllable process parameters in riveting (i.e.,
such as the sequence of riveting, distance between rivets (pitch) and gap between sheets) on
the quality of riveted lap joint and formed rivet. The quality of a riveted lap joint is
characterized by sheet metal bulging, sheet material growth, residual stress level on sheets
and rivets, and post riveting clearance in the joint. The quality of a formed rivet is often
determined by the geometry of its head formation. This study is to determine the best riveting
sequence for riveted lap joint in sheet metal assembly with 1/8" nominal diameter of flat head
tinner rivet on 0.064" thick aluminum sheet. The study is performed using finite element
simulation of riveting process. Statistical design of experiment is employed to analyze the
simulation data of riveting process along with the effect of individual factors, their
interactions and relationship with the quality parameters of riveted lap joint in sheet metal
assembly. A good combination of riveting process parameters is found that minimizes the
residual stress in sheets and rivets, bulging and material growth in sheets and reduces the
chance of post riveting clearance in riveted lap joint.
2.1 Residual Stress and Material Expansion……………….…….………………… 7 2.2 Crack Initiation and Crack Propagation ……………………………..................9 2.3 Load Distribuation in the Riveted Lap Joint …………...................................... 10 2.4 Analysis of Fatigue Life ……………… …………….………………………… 11 2.5 Impact of Different Factors in the Rivetd Joint Life ………….......................... 13 2.6 Application of Fretting Fatigue ………………………………………………...15
3. METHODOLOGY……………………………………………………………………… 17
3.1 Modeling ………………………………………………………………………. 17 3.1.1 Model Development ………………………………………………… 17 3.1.2 Model Validation ……………………………………………….…… 26 3.2 Experimental Design ………………………………………………………….. 29 3.2.1 Levels and Ranges of Parameters …………………………………… 30
3.2.2 Constant Factors ……………………………….……………………. 32 3.2.3 Response Variables ………………………………………….............. 32 4. RESULTS AND DISCUSSION ………………………………………………………... 35 4.1 Analysis of Residual Stress Level in the Sheets ….………………………..... 36
4.2 Analysis of the Residual Stress Level in Rivet ………………………………. 45 4.3 Analysis of Sheet Metal Bulging .. ...…………………………………............ 47 4.4 Sheet Material Growth ……………………………………………………….. 51 4.5 Clearance between Sheets or Sheet and Rivet……………………………….... 55 4.6 Process Optimization …………………………………………………………. 58
5. CONCLUSIONS AND FUTURE WORK ……………………………………............... 58
LIST OF TABLES Table Page 1. Geometric Parameters Used in Modeling ……………………………………………… 20 2. Material Properties Used in Modeling …………………………………………………. 24 3. Material Properties for Rigid Material …………………………………………………. 25 4. Comparison of Theoretical, and Model D and H ………………………………………. 29 5. DOE Design Matrix …........……………………………………………………………. 30 6. Experimental Data ……………………………….…………………………….............. 35 7. Best Combination of Factors to Achieve the Least Residual Stress in Rivets …………. 45 8. Best Combination of Factors to Achieve the Least Residual Stress in Last Rivets …… 46 9.Desirability Factor Chart…………………………….. ...…...…………………………... 57
vii
LIST OF FIGURES Figure Page 1. Tinner’s Rivet……………………………….………...………………………………… 19 2. Typical Finite Element Model …….....…………………………………………………. 20 3. 3D Cross Section Model of Rivet and Sheets ...………………………………………. 21 4. Boundary Conditions and Mesh Size ……………………...…………………………... 22 5. Geometry of Rivet Head Formation …………………………………………………… 26 6. Validation of Formed Head Diameter …………………………………………………. 28 7. Validation of Formed Head Height ……………………………………………………. 28 8. : Factor Interaction Plot for Riveting Sequence 1-2-3………………………….……… 38
9. Factor Interaction Plot for Riveting Sequence 2-1-3…………..………………………. 39
10. Factor Interaction Plot for Riveting Sequence 1-3-2……………..…………………... 39
11. Factor B and C Interaction Plot When Pitch is equal to 3D ………………………… 41
12. Factor B and C Interaction Plot When Pitch is equal to 5D…………..……….…….. 41
13. Factor A and C Interaction Plot When the Gap Between Sheets is 0.005”...………… 43
14. Factor A and C Interaction Plot When the Gap Between Sheets is 0.01”………...…… 43
15. Factor A and C Interaction Plot When the Gap Between Sheets is 0.015”…………… 44
16. 3D Contour Plot for Bulging in the Top Sheet…………………………………...…… 47
17. Bulging in the Bottom Sheet When the Gap Between Sheets is 0.005” and 0.015”…... 49 18. Bulging in the Bottom Sheet When the Gap Between Sheets is 0.375” and 0.675”…... 49 19. Riveting Sequence Variability: Studentized Residual vs. Riveting Sequence …...…… 51
20. Material Growth Vs. Distance Between Rivets When the Gap Between Sheets is 0.005”
viii
and 0.015”……………….……………………………………………..……………..…… 52
21. Material Growth Vs. the Gap Between Sheets When Distance Between Rivets is 0.375”
and 0.675”………………………………………………………………………......…… 52
22. Clearence Between Sheets and/or Sheets and Rivets Versus the Distance Between Rivet
When the Gap Between Sheets is 0.005” and 0.015…………………..……………..…… 55
23. Clearence Between Sheets and/or Sheets and Rivets Versus the Distance Between Rivet
When the Pitch 0.375” and 0.675……………………………………..……………...…… 55
ix
LIST OF ABBREVIATIONS / NOMENCLATURE
DOE Design of Experiment
FEM Finite Element Modeling
x
LIST OF SYMBOLS
º Degree
Є True Strain
σsq Squeeze Stress
Fsq Squeeze Force
” Inches
lbf Pound Force
D Diameter of Formed Rivet Head / Buck-tail Diameter
H Height of Formed Rivet Head / Buck-tail Height
V Volume of Deformed / Bucked Rivet Head
Do Nominal Rivet Diameter
Ho Rivet Shank Height that Protrudes out of the Sheet
n Strain Hardening Exponent
K Strength Coefficient of Material
1
CHAPTER 1
INTRODUCTION
Sheet metal is an important component of an aircraft’s design; without its skin, an
aircraft cannot fly. Because so many lives depend on the structural integrity of the sheet
metal on an aircraft, any concerns about the strength of its joints must be addressed
thoroughly once a potential problem is uncovered. One area of possible concern is in the
current process of joining two pieces of sheet metal using the riveted lap joint method. The
rivet is the standard fastener of the aircraft industry because of its reliability, but there are no
established standard methods practiced in the industry for the riveting process with respect to
riveting sequence, the distance between rivets and the gap between sheets. It is the intent of
this thesis to address this oversight and help establish these much-needed standards.
The most common riveted (in tension) joint failures are tearing between the rivet
holes, shearing of a rivet, or crushing of either the rivet or the material joined by it. Tearing
between rivet holes happens at the material joined, not at the rivet, as with the shearing of a
rivet. Crushing takes place either at the material joined or at the rivet. Tearing between rivet
holes is the most frequent type of failure in riveted joints.
In the aircraft industry, riveted joint failure occurs due to a combination of three
factors: induced stresses during manufacturing (residual stresses), thermal fatigue, and
vibration. Thermal fatigue and vibration are the less common causes of riveted joint failure.
Thermal fatigue is induced in sheet metal parts during the assembly due to temperature
variation. Rapid heating and cooling by frictional material changes the residual stress level in
sheet metal parts that affect the fatigue life of the joint. Thermal variation cannot be
controlled during assembly. Vibration comes from different sources during sheet metal
2
assembly, especially from manual drilling and manual riveting. As a result, vibration is not
easy to control without perfect automation in the assembly line.
Because induced or residual stress is the chief cause of failures, this thesis is only
concerned with induced residual stresses and will not address vibration or thermal fatigue.
Several factors can contribute to residual stresses in sheet metal riveted joint assembly,
including riveting sequence and riveting process parameters such as riveting squeeze force,
gap between sheets, distance between rivets (pitch), rivet geometry (diameter, length, shape)
and edge margin. Clamping force is also responsible for induced stress in sheet metal parts.
Clamping is used to bring the sheets together and then hold them during riveting to minimize
the gap between sheets, and it also helps to hold the assembly as well. The clamp is a
necessary tool for the riveting process, but clamping forces induce some extra residual
stresses in sheets, which is not desirable.
Many factors in the riveting process occur at different times and in different locations,
so variations are difficult to control. In the manual riveting process, drilling a hole and
punching a rivet are two different tasks that happen at different times. As a result,
manufacturing variability can come from both. The variability can result from hole
misalignment, improperly drilled holes, improper rivet formation, or all three. Stresses are
concentrated at particular points at sheets and rivets when a drilled hole is not correctly
dimensioned. The hole should be perpendicular to the sheet surface/skin and there should be
sufficient clearance between sheets and rivets, otherwise the rivet can be formed badly or
extra stress concentration can be induced in sheets or rivets which can lead to a later failure.
The effects of different riveting process parameters during assembly can be minimized by
pursuing the proper manufacturing procedure.
3
Another factor that can vary widely during fabrication is the amount of sheet material
growth. Sheet material growth can be caused axially during the riveting process. As a result,
the sheet material growth can exceed the assigned allowable tolerance of a particular part.
The parts’ quality and durability depends on its adherence to correct dimensions and the
shapes given by designer. Sheet material growth can affect the part quality significantly.
During rivet formation, a rivet formed head applies pressure to the top of the inner sheet, a
bucking bar applies pressure at the outer sheet and clamps apply pressure to both sheets.
Because of the entire external load, sheet material can be extended longitudinally and reduce
vertically (radially). This variation can affect the quality of the riveted lap joint.
Another factor, sheet metal bulging, is induced in riveted lap joints during the riveting
process due to an inappropriate gap between sheets, distance between rivets, riveting
sequence, and riveting squeeze force. Bulging in sheets affects the surface smoothness by
inducing uneven bumps (rough surfaces) at inner and outer sheets. Bumps are not desirable
in sheet metal aircraft assembly because an unusual external load (drag force) can affect the
skin/surface of sheet metal, which can reduce rivet joint life and lead to failure. The riveted
joint life can be increased by decreasing the sheet metal bulging during the riveting process.
To get quality riveting and an extended riveted joint life, an attempt should be made
to manage some of the controllable parameters. There are no standard methods practiced in
aircraft industries for the riveting process with respect to riveting sequence, gap between
sheets, riveting squeeze force, etc. Riveters usually use their experience during the riveting
process, which results in variation from person to person. Because of bulk amounts of
riveting, variability always exists in the process, even if the same person is riveting. Riveting
sequence is considered to be an influential parameter of riveting processes which can affect
4
riveted joint life significantly. When considering the riveted lap joint, riveting sequence
might have significant effect on residual stresses in sheets and rivets, sheet material growth
and sheet metal bulging or any combination of the four.
The objective of this thesis is to determine the optimal riveting method with regard to
riveting sequence, distance between rivets and the gap between sheets. To determine the best
riveting method, the most significant concerns to consider are minimizing the residual stress,
bulging and material growth and the clearance between sheets and rivets. Identifying the
best method for riveting will lead to stronger connections, longer fatigue life, better quality
riveted lap joints and will significantly reduce the chance of failure.
The experiments that formed the basis of this thesis were conducted numerically
using finite element simulation under boundary conditions and material properties similar to
those described by Szolwinski and Farris (2000). After finite element model validation, the
numerical data is analyzed statistically using the analysis of variance method. A statistical
analysis of general factorial design with three factors and three levels is used to find the
significant factors. The result of this research is the identification of the optimal riveting
method and the establishment of standards, which will benefit the aircraft industry by
extending the life of aircraft.
In this thesis, the second chapter will review the pertinent literature that discusses
related research conducted by various experts. This information helped form the theoretical
basis for this thesis. It also helped guide the research conducted for this thesis by showing
what areas could be studied more. The third chapter of this thesis discusses the methodology
that was used to design and conduct the experiments and how the resulting data was
analyzed. The actual analysis of the data is shown in chapter four, where the data is shown
5
both numerically and graphically to illustrate more fully which riveting sequence showed the
best results. Chapter five is the conclusion of the thesis, where recommendations for further
research are discussed in detail. The appendices show simulated models of the experiments
conducted as part of this thesis.
6
CHAPTER 2
LITERATURE REVIEW
Analysis of the riveting process is highly complex due to non-linear behavior
resulting from the interaction of process geometry, thermal conditions, inelastic material
models, contact conditions in interface surface and different boundary conditions. This
research was conducted to examine the quality of rivet formation and the riveted lap joint and
takes into account the many variations that occur during a normal manufacturing process.
Few researchers have actually worked on an assembly line to see firsthand the many types of
variations that occur in practical application of riveting sequences. Most of the published
literature on riveted lap joints analyzes the riveted joint life or rivet life in regard to the
fatigue life, crack propagations, residual stress analysis, crack initiation and load distribution
in and around the rivet hole. Some limited research has been done on the rivet installation
process taking into account with rivet hole size, rivet diameter, rivet length and riveting
squeeze force. The research and literature related to riveting process could be classified
according to the following traits:
1. Residual stress and material growth
2. Crack initiation and crack propagation
3. Load distribution in riveted lap joint
4. Analysis of fatigue life
5. Impact of different factors in the riveted joint life
6. Application of fretting fatigue
7
2.1 Residual Stress and Material Expansion
Very limited research was conducted on the stress condition of riveted lap joints.
Engineering science Data Unit, item 67008 (1967) conducted experiments and considered
elastic stresses in a single lap joint, but they did not take into account the rivet structure. It
was found that the maximum tensile stress is always located at the end of the overlapped
sheet in a riveted lap joint. Later, Fitzgerald et al (1994) first found a technique to measure
residual stress in and around the rivets and plates. Riveted clad aluminum alloy is frequently
used in the aircraft industry but little was known about that kind of joint and the residual
stresses it experiences. Fitzgerald et al (1994) proposed for the first time a method where
residual stress could measured by using the X-ray diffraction method. It was found that after
drilling a hole in the sheet, tensile stress grows in a tangential direction to the hole (i.e. in a
transverse direction to the sheet). The diameter of the riveted material expands against the
hole and develops a barrel-like shape inside the hole during the rivet formation. Tensile and
compressive stress in the material must be balanced because tensile residual stress is very
detrimental to the strength of a riveted lap joint. When force is applied on the rivet, the rivet
and the hole in the sheet is loaded either elastically or plastically. If the hole is loaded
elastically, the sheet material became induced with compressive residual stress; if it is loaded
plastically the sheet material is infused with tensile residual stress. The stress on formed
head rivets and the surrounding material is lower compared to rivet head material. The
amount of radial stress depends on the riveting squeeze force, and it increases with the
increase of riveting force. The residual stresses in the formed head (buck-tail) diameter are
not consistent throughout, and the compressive stress is at a maximum near the center and it
decreases toward the edge.
8
The tensile residual stress in sheets close to the rivet hole is a factor in fatigue failure.
As a result, it is important to know the stress conditions near the rivet hole. The X-ray
diffraction method can provide enough information about the stress contour in the sheets and
it is also determines the stress pattern in and around the rivets in riveted lap joints in relation
to the riveting squeeze force. When compressive residual stress is induced on the rivet head,
tensile residual stress is induced on the sheets for low forces, and the whole wall becomes
loaded elastically as expected. The compressive stress is increased with the increase of
forces.
Edwards and Ozdemir (1992) used the neutron method to find information about three-
dimensional residual stress distribution for a drilled hole after a cold work process. This
method provides information about residual stresses but it cannot provide any other
mechanical method of stress analysis. A sleeveless method for cold expanding circular holes
was developed where the holes’ expansion varied infinitely in a simple way. The technique
involved plastic deformation of the hole, where the hole diameter increased permanently.
The deformation was accomplished by using a mandrel larger than the hole diameter. Once
the mandrel is removed from the hole, the hole and sheet experience shrinkage because of
spring-back. As a result, compressive residual stresses took place area around the hole, which
results in a plastically deformed area where compressive residual stresses consistently takes
place in and around the hole area. The compressive radial and hoop stresses in the plastically
deformed hole area help to improve the fatigue life of the joint by reducing the chance of
crack initiation and crack propagation.
Wang (1998) found that the longest initial crack dominate the fatigue life of a joint
when the fixed hole expansion is taken into account. The more the hole expansion, the larger
9
amount of compressive residual stresses are induced around the rivet hole, so the average
fatigue life is increased when the hole expansion is increased.
Fung and Smart (1994) examined the countersunk and snap-riveted single lap joints
using both experimental and numerical methods. A 3D finite element elastic model was
developed and analyzed and found that the stress concentration point and failure initiation
point are not the same. Failure occurs in a riveted joint but the initiation point is away from
the point where the most stress is concentrated. The clamping force, friction coefficient and
interference in the rivet hole has a considerable influence on stress concentration factors in
and around the rivet hole.
Muller (1995) and Hertzberg (1993) both found in different investigations that the use
of cold expansion technique for drilling holes induces compressive residual stresses at
material in and around the drilled hole. Kang et al (2002) developed two-dimensional and
three-dimensional finite element models to study the cold expansion process numerically
using standard aluminum sheet material alloys 2024-T351 and 7050-T7451 in the lap joint.
2.2 Crack Initiation and Crack Propagation
Fung and Smart (1994) performed an experimental and numerical analysis of riveted
single lap joints. They found that crack initiation and joint failure for countersunk riveted
joint and snap riveted joint start in the riveted plate not in the rivets themselves. Tong et al
(1973) analyzed elastic stress intensity factors for plane cracks where they used the hybrid-
element concept and a complex variable method to design and construct a special super-
element for finite element analysis. Nicoletto (1989) studied fatigue crack-tip deformation in
aluminum alloy 7075-T6 where coherent optics techniques were use to measured in-plane
displacement in the submicrorange. Nicoletto studied the local strain distributions and the
10
crack-tip plasticity in constant loading conditions and correlated the theoretical description
and models. The effect of stress intensity factors initiation, propagation and its profile
investigated. Nicoletto found that overload and cyclic plasticity have a significant effect on
crack length and its growth.
Wang (1998) found that for higher fixed expansion levels, the range of fatigue life
distribution become wider and flatter (i.e. the hole expansion can minimize the crack size
effect through enhancing the fatigue life of riveted lap joint.
2.3 Load Distribution in the Riveted Lap Joint
Wang (1998) investigated numerically and experimentally the load transfer
mechanism for different types of riveted joints, such as pin, clamped and countersunk rivets.
Wang found that a higher squeeze force can cause higher clamping pressure on the panel, and
the higher load can transfer better from one rivet to the adjacent rivet. Wang also found that a
higher squeeze force joint can transfer the load better than a low squeeze force joint. The
presence of a crack in the riveted joint changes the load transfer capability drastically; an
uncracked panel can transfer a 60% load, while under the same conditions a cracked panel
can transfer only a 40% load. Silva et al (2000) studied the effect of multiple site damage in
a riveted lap joint both experimentally and numerically. In a riveted lap joint, loads are
transfer by rivet shear and interference between sheets or faying surfaces. The combined
stresses concentrate the effect due to the hole in the sheet and secondary bending in the sheet,
and uneven load transfer through friction between faying surfaces gives more of a complex
three-dimensional stress distribution.
Estaugh et al (1995) investigated the multiple-site fatigue crack growth and link-up in
fuselage skin splices and reported different causes for stress distribution. Stress distribution is
11
caused by many factors and many combinations of factors. Some potential factors include
biaxial tension in sheets, the clamping load applied by the rivet, pin loading at the hole due to
load transfer through rivet shear, internal pressure in the hole due to expansion of the rivet,
surface shear within the clamping zone of the rivet due to load transfer through friction and
the bending of the plane. Repeated loads always reduce the fatigue life of a joint; when
repeated loads are applied cyclically, stress concentration can affect fatigue crack initiation
and propagation, and it causes the joint to fail by shearing off the rivets or tearing the sheets.
As a result, it is important to control the residual stress level in riveted lap joints, which will
enhance the joint life significantly.
2.4 Analyses of Fatigue Life
To enhance the riveted lap joint life, it is very important to increase the fatigue life of
rivets and sheets. There are many research projects involved with riveted joints and their
fatigue behaviors. Recently most of the research work related to fatigue analysis of riveted
lap joints considered the riveting squeeze force as an important factor because these
researchers have found a correlation between squeeze force, formed head diameter and
height of rivets after formation, and a joint’s fatigue life. Muller (1995) studied the
relationship between riveting squeeze force and riveted joint life numerically by using the
finite element method, and found that high riveting force has a positive effect on riveted lap
joint life. The high squeeze forces help to form the rivet inside the hole properly so that it
fills the rivet hole. Larger buck-tail rivet heads increase clamping pressure and create better
contact between sheets. Better contact between sheets leads to better load distribution and
better interference between surfaces.
12
Szolwinski and Farris (1999) studied the link between the quasi-static squeeze force-
controlled riveting process and the residual stress conditions for riveted lap joints. A finite
element model was designed to show the force-controlled rivet and the model established the
link between different riveting process parameters and the residual stresses. A 0.1875 inch
nominal diameter of rivet was used with two 0.09 inch-thick sheets to form the riveted lap
joint. 2117 T4 aluminum alloy was used for rivet material, and 2024 T3 aluminum alloy for
sheet material. The force-controlled rivet formation was performed and six different forces
were used to form the rivet. The applied squeeze force was varied from 2500 lbf to 5000 lbf.
The study found that compressive hoop stress directly related to squeeze forces, where hoop
stress increased with the increase of forces and it increased the hole expansion too. The area
around the hole was fully dominated by residual compressive hoop stress, whereas tensile
residual hoop stress took place chiefly away from the hole.
Li et al (2004) showed the relationship between rivet-driven head deformation,
induced residual stress, strain, and interference in the sheets, sheets and rivets, in different
conditions under different riveting squeeze forces. Li’s study used 8/32 inch diameter rivets
and 0.08 inch-thick sheets to form the riveted lap joints in a 2D axisymmetric model. For
force-controlled riveting processes, they used different amounts of squeeze force to form the
rivet, and the squeeze force ranged from 12000 lbf to 14000 lbf. After analyzing the results
of finite element simulations and experimental setup, it was found that the riveting squeeze
force is one of the most influential factors in the riveting process. Finally, a rivet-driven head
can be measured based on the riveting squeeze force. They also found that connection
between the rivet and the outer sheets is weaker than the connection between the rivet and the
13
inner sheets. The finite element result matches with experimental results, and therefore the
finite element results are reliable.
Li et al (2005) also studied the effect of residual stresses on single-row countersunk
riveted lap joints experimentally and numerically. Three-dimensional finite element models
were designed and run according to experimental setup. Geometric nonlinearity, elasto-
plastic constitutive relationship and nonlinear contact boundary conditions were considered
in the 3D finite element model. Experimental results favored the numerical results during the
tensile loading stage and riveting process stage. The effects of residual stress and strain were
predicted after the riveting process, and the effect of stress and strain variations were found
during the tensile loading stage. The results showed that squeeze force can induce residual
stresses and that residual stresses have considerable effect on stress variation tensile loading
stage.
Fung et al (1994) found that snap-riveted joints have slightly better fatigue life than
countersunk-riveted joints and the experimental results were validated by the numerical finite
element results.
2.5 Impact of Different Factors in the Riveted Joint Life
The quality of a riveted joint depends on many individual parameters or combinations
of parameters such as distance between rivets (pitch), number of rivets in between clamps,
distance between clamps, edge margin distance etc. Based on design or joint parameters, the
riveted joint strength will increase or decrease. According to the aircraft standard handbook
and rivet manual, all parameters have applications in standard practice. Riveting parameters
mainly depend on the nominal diameter of the rivet and on sheet thickness. The pitch is
measured by the rivet nominal diameter, and the minimum distance between rivets should be
14
three times the nominal diameter of the rivet. Again, the length of the rivet is selected based
on the sheets’ thickness at the joints.
Smith (1957) performed his study to investigate the factors that affect the life of a
riveted joint, and found that a smaller pitch can be reduce the load on the rivet. Increasing the
number of rows in a riveted lap joint can increase the fatigue strength of the joint, and the
maximum fatigue strength can achieved by adjusting the distance between rivets and position
of rivets (Frost el al 1974). Smith (1957) and Seliger (1943) found that pitch has significant
effect on joint fatigue strength and smaller pitch is better. Heywood (1962) studied
influential factors and their effect on the strength of riveted joints. Different parameters are
considered during the study, including the type of material, dimensional parameters, stresses
in the joint and the arrangement of rivets in the joint, among others. The rivet’s nominal
diameter, sheet thickness and distance between rivets (pitch) were found to be the most
important parameter in the riveting process. Other research projects determined that, under
the same loading conditions, a rivet with a larger diameter and thicker sheets have more
fatigue strength and longer fatigue life in comparison to rivet with a smaller diameter.
Ekvall (1986) developed a simple finite element model to study the stress analysis of
riveted joint. Stress analysis was conducted to determine the critical stress and strain
locations and identify the critical fatigue locations on a riveted lap joint. No contact was
assumed between sheets and rivets. Fung and Smart (1996) did a numerical and experimental
study of fatigue tests on riveted lap joints where they considered countersunk and snap-
riveted joints. The fatigue test analysis found that stresses were present around the rivet hole.
Fung and Smart also found that the total effective stress was reduced by increasing the level
15
of clamping force, contact and friction coefficient between sheets and sheets and rivets, and
by decreasing the width and thickness of the sheets.
The fatigue crack started from the upper skin (top sheet) of the riveted lap joint, not in
the rivet or bottom sheet (Silva et al 2000). The multiple site damage was studied via finite
element simulation and the result was verified by experimental results. A crack can initiate
from bottom or inner sheets, but it depends on many factors, such as sheet thickness, rivet
type and clamping pressure, among others.
2.6 Application of Fretting Fatigue
Fretting is a major cause of crack initiation or formation in the riveted lap joint skin.
Fretting is a contact damage mechanism arising from microslip and its small movement
within the structure. Harish and Farris (1999) investigated the fretting crack nucleation in
riveted lap joints numerically using finite element simulations. An integrated approach to
fretting crack initiation was presented for riveted lap joints. It incorporated the residual
stresses and plastic strain to the riveting processes as well. A finite element model showed
details of the load transfer approach and its effect in residual stress in and around the rivets
and interface between the rivets and the sheets. Harish and Farris (1997) studied the
application of fretting fatigue, and they focused on fretting as a crack nucleation mechanism
for riveted lap joints. It was found that the distinct stick-slip zone and high tensile stress at
the edge of contact in combination initiate the fretting and as a result the crack nucleates at
the edge of contact. The top row of rivets has less predicted life and the life increases with an
increase of friction coefficient at low remote stress conditions. The joint’s life decreases
when remote stress is high then the friction coefficient increases. Life also increases with the
increase of rivet head clamping pressure.
16
Collins (1993) provides some of important parameters that involved/promote fretting
damage, such as relative motion in between fretting surfaces, normal pressure distribution
between the fretting surfaces, stress condition in the area of fretting surface, number of
fretting cycles, temperature of the fretting surface, ambient condition around the fretting
surface and the material of the structure being fretted.
17
CHAPTER 3
METHODOLOGY
Once the three controllable parameters (riveting sequence, distance between rivets
and the clearance between pieces of sheet metal) were established, the effect of riveting
process variations and riveting sequence could be studied using finite element simulation. In
this chapter, the finite element model is described. Next, the finite element model is
validated with theoretical data. Once the finite element model is validated, the experiment
was designed. The input and output parameters are described in detail in this chapter. These
studies use a half-3D solid model for finite element simulation where the gap between sheets
and the pitch are varied; all other parameters remain constant.
3.1 Modeling
A finite element model is developed and simulated to study the effect of riveting
process parameters and riveting sequence on sheet metal assembly. The stress and strain
contours are observed for each input parameter and all of the response variables are measured
after simulations.
3.1.1 Model Development
The riveting process is complex because of the presence of many nonlinear behaviors,
such as geometric nonlinearity, boundary nonlinearity and material nonlinearity. A large
displacement effect in rivets and sheets causes geometric nonlinearity during the riveting
process. Interference between surfaces results in boundary nonlinearity. The riveting
process involves considerable interference between materials like sheet to sheet, rivet to
sheet, and punch to rivet. Material nonlinearity occurs because of elastic plastic deformation
of rivets and sheets.
18
In this study of riveting sequence, three rivets are located in between clamps, so a
half-3D solid model is necessary so stress, strain, and bulging contours can be observed
properly on the top and bottom of sheets. Szolwinski and Farris (2000) developed a model
for studying the riveting process using a 2D axisymmetric model. The model was verified
experimentally. This study follows their technique to develop a model for finite element
simulations, but instead of 2D axisymmetry models, half 3D solid models are used. To study
the riveting sequence in sheet metal assembly, it is essential to use a half-3D finite element
model because in a 2D model, the rivet makes the sheets separate so they will not react in the
same way as a single sheet. Msc. Patran (preprocessor, model-2003r) is used to model the
parts, create appropriate meshing and boundary conditions, and generate an input key file for
LS Dyna Solver. LS-Post is used as a post-processor to analyze the simulated model (as
d3plot, in binary formats) from LS Dyna Solver. LS-Post can run binary solved files from
LS-Dyna Solver where stress and strain contours are visible step by step. This study
measures several output or response parameters from LS-Post, such as sheet material growth,
top and bottom sheet front side coordinate, stress contour of rivets and sheets, and clearence
between sheets or sheet and rivet. The rivet driven head deformation is measured as a formed
head diameter and formed head height to check the quality of rivet formation.
3.1.1.1 Model Geometry
The 100o flat top countersunk head rivet and 2017 T4 aluminum alloy as a rivet
material are exclusively used in aircraft sheet metal assembly. This study chose a standard
2017 T4 aluminum alloy flat head tinner’s rivet of 1/8” nominal diameter to investigate the
effect of riveting sequence with different pitch and different gap between sheets, because this
rivet is very similar to a 100o countersunk rivet and it has similar material properties
19
(Mechanical Design and System Handbook, 1985). The rivet geometry is shown in Figure 1.
It is also assumed that rivet shape does not have any effect on riveting sequence. Two
0.064”-thick 2024 T3 aluminum alloy sheets are modeled because aircraft industries most
commonly use this configuration. The model configurations shown in Table 1 are taken from
Standard Aircraft Handbook (1991) and Mechanical Design and System Handbook (1985).
Figure: 1 Tinner’s Rivet
This investigation studied a total of nine different models. All nine models consist of
three rivets (rivet 1, rivet 2 and rivet 3), two sheets (top and bottom sheets), three punches
and four clamps (see Figure 3) to reduce the total number of simulations that had to be
performed in order to identify the best riveting sequence. All nine models are designed with
similar work and boundary conditions by using the same material properties and material
model. Figure 2 represents the 2D view of a typical model and Figure 3 shows a typical 3D
finite element model with three rivets, two sheets, four clamps and three punches.
20
Figure 2: Typical Finite Element Model (2D View)
TABLE 1
GEOMETRIC PARAMETERS USED IN MODELING
Nominal rivet diameter, Do (inch) 1/8 = 0.125 Rivet length, l (inch) 0.32 Hole diameter, Dhole (inch) 0.128 Sheet thickness, t (inch) 0.064 Head Diameter (inch) 0.2813 Head Depth (inch) 0.0375
Rivet 1 Rivet 2 Rivet 3
21
Figure 3: 3D Cross Section Model of Rivet and Sheets
3.1.1.2 Element Selection
Though many different techniques are used for finite element simulation modeling to
reduce simulation time and cost, 3D solid models are the most reliable and accurate. As a
result, the 3D solid model is used more frequently than other models because it needs fewer
assumptions. Fully integrated quadratic eight node elements are used to represent the 3D
solid element in sheets, rivets, clamps and punches. A typical schematic diagram with
meshing is shown in Figure 3.
3.1.1.3 Mesh Selection
Because the rivet and sheet both have considerable plastic deformations, the rivet
formation follows the power law plasticity material model. The accuracy of finite element
analysis results fully depends on proper mesh size of the material; thus, proper meshing is of
vital importance. Many experiments were conducted to select the proper mesh size for sheets
and rivets. A mesh size of 0.005” (inch) is used for rivets. Meshing is the same throughout
the rivet model, whereas meshing in sheets is different from region to region. For example,
near a critical area such as a rivet hole, the mesh needs to be finer and denser compared to
Rivet
Bottom Sheet
Punch
Top Clamp
Top Sheet
22
farther from the hole. The difference in mesh types helped the model to solve the contact
problem between sheets and rivets and it shows better the stress and strain contour at the
model’s critical zones. Different mesh sizes were tested for both top and bottom sheets to
determine the best mesh density. Finally, a particular mesh was chosen based on adequate
precision in the finite element calculations. Figure 4 shows a typical model with proper
meshing. In general, these models used 0.04” (inch) mesh size for the top sheet and 0.03”
(inch) mesh size for the bottom sheet.
er
Figure 4: Boundary Conditions and Mesh Size
The number of elements varied between models because each model used a different
pitch. When the model is designed for a pitch of 3D (D = the nominal diameter of the rivet),
then the top sheet and bottom sheet are shorter than the model that was designed for a pitch
of 5D. The larger sheet has more elements than the smaller sheet. Model 1 (pitch = 3D)
used 17,757 elements for the bottom sheet, 11,452 elements for the top sheet. Model II
(pitch = 4D) used 18,747 elements for the bottom sheet and 12,606 for the top sheet. Model
III (pitch = 5D) used 19,886 elements for the bottom sheet and 13,158 elements for the top
Front side of Half 3D solid Rivet Model
Z-directional constraint at back side of both sheets
Top side of flat head rivet: all degree of freedom constraint
23
sheet. All models used 12,626 elements for the rivets. Clamps and punches are modeled as a
rigid body, so mesh size and density do not have any significant effect on simulation results.
3.1.1.4 Boundary Conditions
The accuracy of finite element simulations results depends most extensively on
proper application of boundary conditions on the model. The front sides of the half-3D solid
rivet model are constrained along the z-axis displacement and rotation, and allowed to move
only in x- and y-directions (Figure 4). The top of the flat head rivet is constrained along x, y
and z axis displacement and rotation (which constrains all degrees of freedom). The top and
bottom sheets are constrained along z-axis translation (back side of sheets; see Figure 4), and
those can move along x and y axes in translation and in rotation. A punch is used to squeeze
the rivets, so it is modeled as a rigid body, and it has all translational movements but is
constrained on all rotational movements. The finite element model along with boundary
conditions is shown in Figure 4
3.1.1.5 Material Modeling
The material model depends on material characteristics. The rivets and sheets use an
isotropic plasticity model with rate effects which is known as a power-law-plasticity model.
The model material follows the power law hardening rule. The mathematical expression of
this rule is σ = KЄn, where σ is true stress, Є is true strain, K is the strength hardening
coefficient and n is the strength hardening exponent. In their studies of the riveting process,
Szolwinski and Farris (2000) used the material pattern and material properties shown in
Table 2.
24
TABLE 2
MATERIAL PROPERTIES USED IN MODELING (For Rivet and Sheets)
Rivet (2117 T4) Sheets (2024 T3)
Young’s Modulus (psi) 10.4 E6 10.5 E6
Poisson ratio 0.33 0.33
Yield Strength (Ksi) 24 45
Hardening parameter K = 80 Ksi, n = 0.15 K = 105.88 Ksi, n = 0.1571
Density (lb/in3) 0.101 0.101
The punches and clamps in the finite element model used the rigid body material
model (material 20 from LS Dyna). This rigid body material model is convenient and cost-
efficient to use in simulation because the model considers all the elements as one rigid body.
In this finite element model, the rigid bodies (punches, clamps) interact with rivets and sheet
materials, so the rigid body material properties are as important as the sheet and rivet
material properties. The rigid body material properties are given in Table 3.
TABLE 3
MATERIAL PROPERTIES FOR RIGID BODY/ MATERIAL
Rigid Body
Young’s Modulus (psi) 29.7e6
Poisson ratio 0.33
Density (lb/in3) 0.284
25
3.1.1.6 Contact Conditions
The consideration of sliding and impact along the interface is always important for
dynamic finite element simulations. The model has many interfaces between upper and lower
sheets, rivet holes and rivets, the riveting gun or squeezer (herein referred to as a punch),
rivets, etc. LS Dyna provides three distinguishable basic methods: the kinematic constraint
method, the penalty method and the distributed parameter method for contact analysis.
Automatic surface-to-surface contact is used for contact analysis of these models. The master
and the slave surfaces are automatically generated internally within the LS Dyna in this
approach. As a result, the finite element model does not need to define point-to-point contact
anymore; rather, it can define master and slave surfaces, where slave surface nodes can slide
on the master surface. For example, the punch and rivet have contact interface where the
punch is used as a master surface and the rivet as a slave (it is obvious that the punch is going
to apply forces on rivet surface).
Friction also has a significant impact while surface-to-surface contact is present in the
system. The effect of friction can be considered in the finite element analysis by applying the
proper static and dynamic friction coefficient between the interference surfaces. Szolwinski
(2000) used 0.2 frictional coefficients for both static and dynamic frictional conditions in his
study of the riveting process. This study used a 0.2 frictional coefficient for static and
dynamic conditions in all finite element models as well.
3.1.2 Model Validation
The finite element model is validated by comparing the simulation results with
theoretical calculation results. Bajracharya (2006) derived the theoretical relationship
between formed rivet head geometries (diameter and height) and riveting upset squeeze force
26
under ideal conditions. It was assumed that ideally no rivet material gets filled inside the
rivet hole during the rivet formation and all rivet material is formed outside the sheet. In that
case, according to the law of conservation of volume, the rivet material volume before and
after rivet formation is the same. Figure 5a shows diameter D0 and height H0; after rivet
formation, the diameter would be D and the height H (Figure 5b).
.
a) Before Impact (b) After Impact
Figure 5: Geometry of Rivet Head Formation
The theoretical relationship between riveting squeeze force and rivet buck-tail head diameter
(D) is shown below in equation 3.1 and the theoretical relationship between riveting squeeze
force and buck-tail head height (H) is given below in equation 3. 2. Both equations are taken
from Bajracharya (2006).
Fsq = ¼ П D2 K [ln (Do/D)2]n (3.1)
Fsq = ¼ П D2 K [ln(H/Ho)]n (3.2)
Equations 3.1 and 3.2 can be used to verify the finite element simulation results. The
model should be made close to ideal conditions and data analyzed after running the
simulations for verifications. The finite element model is designed with minimum clearance
between rivet and hole for the purpose of result verification. Different known squeeze forces
are applied on the rivet and simulations are run. The rivet formed head diameter (D) and
height (H) are measured from the solved finite element simulation model and the results are
compared to theoretical D and H through equations 3.1 and 3.2.
D 0
R 0 .0 1 8 7 5.0 3 7
5
H 0
27
3.1.2.2 Results of Model Validation
The derived theoretical equation assumed some ideal conditions for riveting process.
For example, it is assumed that the clearance between rivet and hole is negligible so that rivet
material cannot be formed inside the hole, but this is impossible to achieve in practice. The
finite element model is designed with minimum clearances between rivets and rivet holes to
address this issue. A 0.1275” nominal diameter rivet and a 0.128” diameter rivet hole were
chosen to minimize the clearance between rivet and hole.
The model is simulated for forces ranging from 1800 lbf to 3200 lbf in increments of
200 lbf. The force versus theoretical D and simulated D are plotted as shown in Figure 6.
The force versus theoretical H and simulated H are plotted as shown in Figure 7. According
to both figures, it is obvious that formed head diameter (D) increases with increasing force,
whereas formed head height (H) decreases with increasing force, almost linearly.
Model Validation: Formed head dia D
0
0.05
0.1
0.15
0.2
0.25
1800 2000 2200 2400 2600 2800 3000 3200
Load(lbf)
Form
ed h
ead
Dia(
inch
)
theoreticalSimulation
Figure 6: Validation of Formed Head Diameter
28
Model Validation:Formed Head Height
0
0.02
0.04
0.06
0.08
0.1
0.12
1800 2000 2200 2400 2600 2800 3000 3200
Load(lbf)
Form
ed h
ead
heig
ht(in
ch)
SimulationTheoretical
Figure 7: Validation of Formed Head Height
The average difference between theoretical and simulated value of D and H are calculated
and shown in Table 4.
TABLE 4
COMPARISON OF THEORETICAL AND MODEL D AND H
Average Difference: Model versus Theory
Diameter, D (in) 0.00578”
Height, H (in) 0.001091”
At 95% confidence level, the difference between the mean values of the theoretical D
and model D is not statistically significant. Similarly, at 95% confidence level, the difference
between the mean values of theoretical H and model H is not statistically significant. The
model and the theory produced the same data and therefore the model is valid and can be
used for further analysis.
29
3.2 Experimental Design
The Stat-Ease Design Expert software is used to analyze the experimental design.
The design of an experiment is an essential tool to conduct any kind of experiment in a
systematic and scientific way. This experiment was designed specifically to study the effects
of riveting process parameters on sheet metal assembly. The parameters of study are: riveting
sequence, distance between rivets (pitch) and gap between sheets. The experiments take into
account all of the possible combinations of those parameters, and at the same time sheet
material growth, gap between sheets, bulging in sheets, and residual (von-misses) stresses in
sheets and rivets are measured. The rivet driven head geometry (i.e., buck tail diameter and
height) is measured to check the quality of rivet formation in every case and at each rivet. As
a statistical tool, the experiment was designed to determine the critical factors and their
contributions to and interaction in sheet metal assembly
Only three factors and three levels are taken into consideration for this study; many
more factors are involved with the real problem, but those factors are more difficult to
control in practical application. It is assumed that the middle values of these ranges factors
have a linear relationship. The generated results from the experimental design are valid only
within the range tested. The number of factors and factor levels selected are indicated in
Table 5.
30
TABLE 5
FACTORS AND THEIR CORRESPONDING LEVELS FOR MODELS:
DOE DESIGN MATRIX
Factor Name Units Low Medium High A
(Numerical) Gap between sheets In 0.005 0.01 0.015 B
(Numerical) Distance between rivets (pitch) In 3D 4D 5D C
(Categorical) Sequences of riveting 1-2-3 2-1-3 1-3-2 D=0.125 inch = Nominal Diameter of rivet
3.2.1 Levels and Ranges of Parameters
Gap Between Sheets: Sheet metal assembly on the shop floor does not follow the same
pattern consistently. For example, sheets are not always straight; they are sometimes curved
or contoured with different curvature. When both sheets are straight or sheets are assembling
for any straight section then the gap between the sheets would be minimal, but when both
sheets are not straight or the sheets are being assembled for any contoured shape like an
aircraft tail cone or engine nose cap, then the gap between sheets would vary. This means
that the gap between sheets on the shop floor would not be the same in every case. For the
purposes of this study, the gaps between sheets are varied in three levels from 0.005” to
0.015” in 0.005” increments.
Distance Between Rivets (Pitch): In riveted sheet metal assembly, rivets are
maintained at a certain distance to each other, which is called pitch. Pitch is measured as the
distance between the centers of two adjacent rivets, and it is expressed in terms of the
nominal diameter of the rivets. According to previous research, the pitch should be no less
then three times that of the nominal diameter of the rivet. Pitches are varied 3D (D =
31
nominal diameter of tinner rivet, or 0.125” inch) to 5D in the finite element simulation model
because in practical application on the shop floor it is hard to maintain the same small pitch
all along the whole assembly.
Riveting Sequences: Riveting sequence is an important parameter in the riveting
process. Each factor then has three levels: low, medium and high. Again, the model has one
categorical factor-riveting sequence. The maximum number of possible sequence
combinations for three rivets is 3!, or 6. Out of six sequences, however, three are exactly
identical to the other three sequences. For example, sequence 1-2-3, where rivet 1 is formed
first, then rivets 2 and 3 is exactly the same as sequence 3-2-1, where rivet 3 formed first,
then rivets 2 and 1, because they result in the same model and calculations. Because of this
unnecessary duplication, this study only considers three distinctly different sequences
(sequence 1-2-3, sequence 2-1-3 and sequence 1-3-2) as a categorical factor for the
experiment. Therefore, each of three factors has three levels. The number of total
experiments run is 33, or 27 total runs. This experiment is aimed at quantifying the effect of
different sequences on sheet metal assembly in relation to different pitches and gaps between
sheets.
3.2.2 Constant Factors
These experiments are studied for a total of nine different models and each model is
simulated for three different riveting sequences. Only two factors vary among all nine
models: pitch (the distance between rivets) and gap between sheets. Other than these two
factors, everything is the same in all nine models. The rivet diameter is constant throughout
the study (a nominal diameter of 1/8”), rivet hole tolerance is zero (Dhole = 0.128” inch), rivet
length is constant 0.32”, and bottom and top sheet thickness is 0.064”. The same squeeze
32
force is applied for rivet formation in all simulations (2800lbf). 2117 T4 aluminum alloy is
used as a rivet material and 2024 T3 aluminum alloy is used as a sheet material.
3.2.3 Response Variables
Bulging in Sheets: Sheet metal bulging is unavoidable but extremely undesirable in the
aircraft and automobile industries because it creates an uneven and unfinished surface in an
aircraft or automobile’s skin. Any kind of uneven surface creates air drag force and more
friction. Drag force is the force that exerts on a body moving in a medium such as air or
water, and it depends on the velocity of the body, the viscosity and density of the medium,
shape of the body, and roughness. Bulging in sheet metal creates more roughness and more
complex shape in the skin, so it makes more area where drag force can affect the body’s
aerodynamics. Drag force always works against the velocity of the moving body in that it can
affect speed of a moving body as well. As a result, it is essential to increase surface
smoothness and decrease surface roughness by decreasing skin bulges. For this reason, sheet
metal bulging is considered one of the most important response variables for sheet metal
assembly and the riveting process. To evaluate bulging, it is assumed that it can be
approximated as flatness error. Flatness error is defined as the distance between two parallel
planes that contain the evaluated surface. A geometric error evaluation software is used to
measure flatness (bulging) error.
Stress Concentration in Sheets and Rivets: All types of mechanical designs need to
consider stress concentration because it is always an important design factor. This is
especially true when material is deformed plastically (elastic-plastic deformation takes place
in any material then there are always some extra stresses that are induced or locked into it).
These induced stresses are called residual stresses because these stresses stay permanently
33
with machines, parts and assembly materials. The concentrated Von-misses stress in rivets
and sheets after rivet formation is considered collectively as residual stresses in sheets and
rivets for the purposes of this study. Von-misses stress is the maximum principle stress in
sheets and rivets. The power law plasticity material model are used for rivet and sheet
material, while material can be formed plastically if external force is applied. Residual stress
always develops when external forces are applied on any material, and the material is
deformed plastically. As a result of residual stress, any metal parts can be split into two or
more pieces suddenly without external force being applied.
However, residual stresses are not the cause of failure all the time; compressive
residual stress can prevent failure but tensile residual stress always creates a problem.
Residual stress is not concentrated all over the parts, but its excessive concentration at one
place can promote failure. The internal residual stress is balanced in all components, like
tensile stress is counterbalanced internally by the compressive stress. It is important to find
out the minimum residual stress level condition for rivets and sheets; otherwise, it will affect
the riveted joint life. The tensile Von-misses stress data are collected from simulated the
finite element model using LS-Post. The data is later analyzed statistically by using the
analysis of variance method.
Material Growth in Sheets: Sheet metal used in the aircraft industry is only 0.064”
thick and very flexible. On the assembly floor, sheet material tolerance stack-up is made
more complicated because of its compliance property. If sheet material starts to grow
longitudinally (along the x-axis in the finite element simulation model) during the riveting
process it would be more difficult to keep the sheet metal within tolerance. Obviously, sheet
material growth is not desirable in the assembly line. One of the objectives of this study is to
34
find out how to minimize sheet material growth during the riveting process by adjusting
parameters like riveting sequence, pitch and gap between sheets.
Clearance Between Sheets or sheet and rivet: The clearance between sheets or
clearance between rivet and sheets after the formation of the rivet should be zero. Any gap or
clearance between sheets or sheets and rivet creates a loose connection in a riveted lap joint.
Air sealing is very important for aircraft and automobiles, so a slack connection in riveted lap
joint is not desirable. Loose rivets can also lead to damage or failure of a riveted lap joint,
which can certainly affect the whole assembly. Obviously, proper sealing is very important
to ensure the quality of sheet metal riveted lap joint.
35
CHAPTER 4
RESULTS AND DISCUSSION
The results of the simulations and the analysis of the data performed by Stat-Ease are
outlined in this chapter. These results are shown in Table 6.
Stat-Ease is used to examine the data and determine which factors were statistically
significant and which are not. Stat-Ease then produced graphs that showed the relationships
and interactions between factors and, in the end, which riveting sequence offered the best
results. Both numerical and graphical representations are discussed and shown to illustrate
the results of the simulations.
Quality Check
To be validated, the data shown in Table 6 must pass a series of quality checks.
According to the Aircraft Standard Handbook (1991), the quality of rivet formation depends
on several factors, such as formed buck-tail diameter (D), height (H), and clearance between
sheet and rivet. This study uses buck-tail diameter and height as a parameter for a quality
check. Buck-tail diameter and height are measured after rivet formation in the finite element
simulation model. The Aircraft Standard Handbook (1991) shows that the maximum and
minimum values of buck-tail diameter (D) and buck-tail height (H) for an 1/8” nominal
diameter rivet are: D = (0.171875 – 0.21875)” and H = (0.046875 – 0.078125)” respectively.
If the diameter and height of a rivet after formation falls within this range, then the data
generated by the model is valid.
4.1 Analysis of Residual Stress Level in the Sheets
After the simulations were run in LS Dyna Solver, the information regarding the Von-
misses stresses were collected in the upper and lower sheets using LS Post. This data is
shown in Table 6 . The residual stress data were analyzed statistically to find the significant
factors and the best combination that yields the least residual stress level in the sheets. The
numerical and graphical interpretation of the analyzed data is provided below.
37
The statistical analysis indicates that at 90% confidence level, factors A (distance
between rivets), B (gap between sheets) and C (riveting sequence) all have significant
effects on sheet metal residual stresses. The interaction between factors A and B; A and C; B
and C; and A, B and C also have significant effect on sheet metal residual stresses. The
factor interaction means that either all three factors or a combination of any two factors
collectively induced higher or lower residual stress levels in the sheets for all sequences.
Based on statistical analysis, the Stat-Ease Design Expert gives a numerical relationship
between residual stress and the factors A, B and C. The relationship is shown in equations
4.1(a), 4.1(b) and 4.1(c)
For Sequence 1-2-3: Residual stress in sheets = 12327.90741+2.56542E+005 *A + 9.27647E+006 * B -2.46668E+005* A2 - 3.48224E+007*A*B + 3.26816E+007 *A2 *B------------------------------------ 4.1(a) For Sequence 2-1-3: Residual stress in sheets = -953.64815 + 2.82675E+005 * A + 1.09545E+007* B -2.46668E+005* A2 - 3.79246E+007*A*B +3.26816E+007*A2 * B------------------------------------- 4.1(b) For Sequence 1-3-2: Residual stress in sheets = 21212.74074 + 2.41428E+005* A + 7.65397E+006*B -2.46668E+005*A2 -3.20854E+007*A*B + 3.26816E+007*A2*B-------------------------------------- 4.1(c) These three equations can be used to find the residual stress level in sheets for a particular
sequence in terms of pitch and gap between sheets.
a) Comparison Between Riveting Sequences: Interaction Between Factors A and B
The interaction between factors A (distance between rivets) and B (gap between
sheets) are shown in Figures 8, 9 and 10 . In these graphs, Design Expert plots the interection
38
between A and B in the different sequences. Basically, for a particular sequence, the gap
between sheets varies from 0.005 inch to 0.015 inch, while the distance between rivets varies
from 0.375 (3D) to 0.675 (5D). Figures 8, 9 and 10 show the amounts of residual stress in
the sheets relative to the gap between sheets.
B: Gap between sheetsInteraction Graph
A: Distance Between rivets
Res
idua
l stre
ss in
she
ets
0.375 0.438 0.500 0.563 0.625
75408.6
79073.8
82739.1
86404.3
90069.5
B-
B+
Figure 8: Factor Interaction Plot for Riveting Sequence 1-2-3
Gap 0.005”
Gap 0.015”
39
B: Gap between sheetsInteraction Graph
A: Distance Between rivets
Res
idua
l stre
ss in
she
ets
0.375 0.438 0.500 0.563 0.625
74708.1
79177.9
83647.7
88117.5
92587.3
B-
B+
Figure 9: Factor Interaction Plot for Riveting Sequence 2-1-3
B: Gap between sheetsInteraction Graph
A: Distance Between rivets
Res
idua
l stre
ss in
she
ets
0.375 0.438 0.500 0.563 0.625
75287.8
78983.2
82678.7
86374.1
90069.5
B-
B+
Figure 10: Factor Interaction Plot for Riveting Sequence 1-3-2
The results shown above in Figures 8, 9 and 10 are summarized below.
Gap 0.015”
Gap 0.005”
Gap 0.015”
Gap 0.005”
40
• Riveting sequence 1-3-2 shows less variability for residual stresses in sheets, when
the gap between sheets varied from 0.005 inch to 0.015 inch.
• The residual stress level increases in sheets with an increased gap between sheets.
• For all three sequences, the residual stress levels do not make any significant
difference while the distance between rivets is 0.675 inch and pitch is equal to 5D, so
a bigger pitch is better to control the residual stress level in the sheets.
• The residual stress in sheets varies widely when the gap between sheets is more than
0.005 inch.
• The variation in residual stress is larger when the pitch is smaller rather than larger.
• Sequence 1-3-2 is significantly better than sequence 1-2-3 or 2-1-3 because it has
less variability in the residual stress level.
b) Comparison Between Riveting Sequences: Interaction Between Factor B and C
The data regarding residual stress in the sheets are plotted against factor B (gap
between sheets) while the distance beween rivets varied from 0.375 inch to 0.675 inch (the
pitch is 3D and 5D at Figure 11 and 15). Here, the S132 indicated line represents the
residual stress in sheets that was induced in the sequence 1-3-2, a S123 indicated line
represents the sequence 1-2-3 and a S213 indicated line represents the results from sequence
2-1-3 while the gap between sheets varied from 0.005 inch to 0.015 inch.
41
C: SequenceInteraction Graph
B: Gap between sheets
Res
idua
l stre
ss in
she
ets
0.005 0.007 0.010 0.012 0.015
74708.1
79177.9
83647.7
88117.5
92587.3
s123s213s132
Figure 11: Factor B and C Interaction Plot When Pitch is equal to 3D
C: SequenceInteraction Graph
B: Gap between sheets
Res
idua
l stre
ss in
she
ets
0.005 0.007 0.010 0.012 0.015
75287.8
78983.2
82678.7
86374.1
90069.5
s123
s213
s132
Figure 12: Factor B and C Interaction Plot When Pitch is equal to 5D
S132
S123
S213
S213 S132
S123
42
The results shown in Figures 11 and 12 are summarized below.
• Sequence 1-3-2 has significantly less variability in residual stress level in the sheets
while the gap between sheets varies from 0.005 inch to 0.015 inch and the pitch is
3D.
• If the distance between rivets is 5D (0.675 inch), then residual stress levels do not
have any significant affect on riveting sequence. Based on this result, a larger pitch is
better for minimizing the residual stresses in the sheets.
• When the gap between sheets is less than 0.005 inch, the riveting sequence does not
seen to have any significant effect on which riveting sequence is better.
• Because it offers less variability in residual stress levels, the data clearly shows that
sequence 1-3-2 is significantly better than sequence 1-2-3 and 2-1-3.
c) Comparison Between Riveting Sequences: Interaction Between Factors A and C
Figures 16, 14 and 15 show the residual stress in sheets versus the distance between
rivets for the three different riveting sequences, while the distance betweeen rivets varied
from 0.375 to 0.675 inch and the gap between sheets is constant. In Figure 16, the graph
shows the results when the gap between sheets is 0.005 inches; Figure 14 represents a gap
between sheets of 0.01 inches; and Figure 15 shows the results when the gap between sheets
is 0.015 inches. As before, the sequence 1-3-2 is represented as indicated S132 line,
sequence 1-2-3 with a indicated S123 line and sequence 2-1-3 with a indicated S213 line.
43
C: SequenceInteraction Graph
A: Distance Between rivets
Res
idua
l stre
ss in
she
ets
0.375 0.438 0.500 0.563 0.625
74708.1
78548.4
82388.8
86229.1
90069.5
s123s213s132
Figure 13: Factor A and C Interaction Plot When the Gap Between Sheets is 0.005”
C: SequenceInteraction Graph
A: Distance Between rivets
Res
idua
l stre
ss in
she
ets
0.375 0.438 0.500 0.563 0.625
76053
79557.1
83061.3
86565.4
90069.5
s123
s213
s132
Figure 14: Factor A and C Interaction Plot When the Gap Between Sheets is 0.01”
S213
S123
S132
44
C: SequenceInteraction Graph
A: Distance Between rivets
Res
idua
l stre
ss in
she
ets
0.375 0.438 0.500 0.563 0.625
76053
80186.6
84320.1
88453.7
92587.3
s123
s213
s132
Figure 15: Factor A and C Interaction Plot When the Gap Between Sheets is 0.015”
The data shown above in Figures 13, 14 and 15 is summarized below.
• The effect of the riveting sequence increases with the increase of the gap between the
sheets. When the gap between sheets is 0.005 inch, the riveting sequences do not have
any significant effect on the residual stress level in the sheets. However, when the
gap between sheets is increased to 0.015 inches, the riveting sequence has a
significant effect on residual stress in the sheets.
• Sequence 1-3-2 has less variability when the residual stress in sheets is considered
and it is plotted against the distance between rivets. Therefore, riveting sequence 1-3-
2 is significantly better than the other riveting sequences.
• When the distance between rivets is 0.675 inch and the pitch is 5D, the riveting
sequence does not have any significant effect in residual stress in the sheets.
S132
S123
S213
45
• Sequence 1-3-2 induced significantly less residual stresses in the sheets compared to
riveting sequences 1-2-3 and 2-1-3.
4.2 Analysis of the Residual Stress Level in Rivets
The residual stresses in rivets have been studied to find out the effects and
relationship between factors A, B and C. The residual stress data is collected for each rivet
from solved finite element simulation using LS Post and as shown in Table 6. The data is
analyzed by taking into account the average residual stresses in rivets and the maximum
residual stresses in the last rivet. Because the last rivet always yields the maximum residual
stress for the entire riveting sequence, this study considered the amount of stress in the last
rivet as one response variable. In both cases, it was found that models are not significant.
Using statistical tool the model is optimize and found the best ten combination of the three
factors to minimize the residual stresses in the rivets. The best ten combinations are shown
in Table 7.
TABLE: 7
Best Combination of Factors to Achieve the Least Residual Stresses in Rivets
The riveting sequence has little effect on the level of residual stress in the last rivet, but
sequence 1-3-2 has better results than the other two sequences.
4.3 Analysis of Sheet Metal Bulging
Sheet metal bulging is measured by using flatness error evaluation software, which
can measure the flatness of a surface. The point coordinates are collected from simulated
models (outer and inner sheets) using LS Post, and then the data was used to measure the
flatness error. As with the other factors, the bulging data was analyzed Stat-Ease. The
software analyzed the data (shown in Table 6) numerically and graphically to determine the
significant factors that affect the amount of sheet metal bulging. The sheet metal bulging
47
data for the top sheet and bottom sheet was analyzed separately because the top sheet only
experiences bulging between rivets, while the bottom sheet experiences bulging as well as
plastic deformation in and around the hole surface. As a result, the elastic deformation in the
bottom sheet also affects the surface flatness.
a) Sheet Metal Bulging in the Top Sheet
The statistical data analysis found that the only significant factor that affects the sheet
metal bulging in the top sheet is B (the gap between sheets). The numerical relationship
between bulging in the top sheet and significant factor B is shown in equation 4.3(a) below.
The equation is helpful to determine the expected bulging in the top sheet if the gap between
sheets known before the riveting.
Bulging(Top sheet) = 9.236E-003 + 2.389E-003* B - 3.342E-003* B2 4.3(a) The Statistical tool plots 3D contours showing the straightness error in the top sheet versus
the factor A (distance between rivets) and B (gap between sheets) as shown in Figure 16
below.
Figure 16: 3D Contour Plot for Bulging in the Top Sheet
0.00350533
0.0050432
0.00658107
0.00811894
0.00965681
Bul
ging
(Top
she
et)
0.005 0.008 0.010 0.013 0.0150.375
0.438 0.500
0.563 0.625
B: Gap between sheets
Distance Between rivets
48
Figure 16 shows that Factor A does not have any effect on bulging at the top sheet
because the contour surface is straight throughout the axis. However, Factor B has a
significant effect on bulging at the top sheet and bulging increases as the gap between sheets
increases. Thus, bulging at the top sheet can be controlled or minimized by reducing the gap
between sheets as much as possible during the riveting process.
b) Sheet Metal Bulging in the Bottom Sheet
The analysis indicated that factors A (distance between rivet) and B (gap between
sheet) are statistically significant with respect to sheet metal bulging in the bottom sheet.
Both factors are individually responsible for the sheet metal bulging in bottom sheets. Using
the statistical tool, a numerical relationship between factors A and B and sheet metal bulging
in the bottom sheet is shown in equation 4.3 (b) below.
[Bulging(bottom sheet)]1.75 = +3.416E-004 - 2.659E-005* A + 1.134E-004* B -4.490E-005 * A2 - 1.144E-004* B2 ----------------- 4.3(b) The equation can be used to measure the amount of bulging in the bottom sheet in terms of
factors A and B, so it is easy to determine the expected surface roughness in the bottom sheet
if factors A and B are known.
Figure 17 shows the bulging at the bottom sheet plotted against Factor A (distance
between rivets). The lines represent the amount of bulging in the bottom sheet when the gap
between sheets is 0.015 inch and 0.005 inch respectively in the model before rivet formation.
In Figure 18, the bulging is plotted against Factor B (gap between sheets) as the pitch varies
from 0.375 inch to 0.675 inch. Both lines in Figure 18 represent the bulging in the bottom
sheet The lines in Figure 18 represent the amount of bulging when the pitches are 0.675
inch (5D) and 0.375 inch (3D), respectively.
49
Gap 0.015”
Gap 0.005”
Pitch 0.375”
Pitch 0.675”
B: Gap between sheetsInteraction Graph
A: Distance Between rivets
Bul
ging
(bot
tom
she
et)
0.375 0.438 0.500 0.563 0.625
0.002222
0.00434625
0.0064705
0.00859475
0.010719
B-
B+
Figure 17: Bulging in the Bottom Sheet When the Gap Between Sheets is 0.005” and 0.015”
A: Distance Between rivetsInteraction Graph
B: Gap between sheets
Bul
ging
(bot
tom
she
et)
0.005 0.007 0.010 0.012 0.015
0.002222
0.00434625
0.0064705
0.00859475
0.010719
A-
A+
Figure 18: Bulging in the Bottom Sheet When the Gap Between Sheets is 0.375” and 0.675”
The results shown in Figure 17 and 18 are summarized below.
• Sheet bulging increases with the increase of the gap between sheets.
50
• Compared to Factor B, Factor A has less effect on bulging at the bottom sheet but it is
still significant. Sheet metal bulging decreases with the increase of the distance
between rivets, which can be caused by the plastic deformation in the bottom sheet.
The deformation effect increases when the pitch is smaller, because the smaller pitch
means smaller sheet length where adjacent rivets influence each other more (like load
transfer, stress and strain effect transfer).
3.5 Sheet Material Growth
Sheet material growth is the expansion of the sheet longitudanlly along the x-axis of
the FEA Model after rivet formation. The data is collected from finite element simulation
model using LS Post, where the sheet length is measured for every four elements along the
sheets and added together to get the the full length of the sheets after rivet formation. The
material growth is measured by deducting the orginal length of sheet from the sheet length
after rivet formation, and then the material growth devied by each sheet length to change in
percentage. The sheet material growth data was analyzed statistically to determine the
significant factors that affect the material growth in sheets and the best combination of
factors that result in the least material growth in sheets. The numerical and graphical
interpretation of analyzed data is provided below.
The analysis indicate that Factor A (distance between rivets) and B (gap between
sheets) both have a significant effect on sheet material growth but riveting sequence does not
have any significant effect on sheet material growth. The numerical relationship between
factors A and B and sheet material growth is shown in equation 4.4. The equation can
measure the sheet material growth when the gap between sheets and pitch are known.
Sqrt(Material growth + 0.50) = +0.72 + 4.586E-003* A + 1.958E-003* B - 4.762E-003* A2 + 2.219E-003* B2 ------------------- 4.4
51
The graphical relatiosnship between sheet material growth and factors A and B are
shown in the Figure 20 and 21 and the studerdize residual of material growth and riveting
sequence are plotted in Figure 19. The studentized residuals (material growth in sheets) are
plotted against the riveting sequences to determine the riveting sequence variability during
the riveting process. Sequence 1-3-2 demonstrates the least variability in the process.
Sequence
Stu
dent
ized
Res
idua
ls
Residuals vs. Sequence
-3.00
-1.50
0.00
1.50
3.00
1 2 3
Figure 19: Riveting Sequence Variability: Studentized Residual vs. Riveting Sequence
This is further proof that sequence 1-3-2 is the better riveting sequence, since lesser
variability is better.
a) Sheet Material Growth: Interaction Between Factors A and B
The sheet material growth data was analyzed and material growth was plotted in
comparison with the distance between rivets in Figure 20 and material growth versus the gap
between sheets in Figure 21. In Figure 20, the lines represent the amount of material growth
in the sheets when gaps between the sheets are 0.015” and 0.005”, respectively.
S123 S213 S132
52
Gap 0.005
Gap 0.015
Pitch 0.375”
Pitch 0.675”
B: Gap between sheetsInteraction Graph
A: Distance Between rivets
Mat
eria
l gro
wth
0.375 0.438 0.500 0.563 0.625
0.000343646
0.00341672
0.0064898
0.00956287
0.0126359
B-
B+
Figure 20: Material Growth Vs. Distance Between Rivets When the Gap Between Sheets is 0.005” and 0.015”
In Figure 21, the lines represent the amount of material growth when the pitches are
0.675” and 0.375”, respectively.
A: Distance Between rivetsInteraction Graph
B: Gap between sheets
Mat
eria
l gro
wth
0.005 0.007 0.010 0.012 0.015
0.000343646
0.00341672
0.0064898
0.00956287
0.0126359
A-
A+
Figure 21: Material Growth Vs. the Gap Between Sheets When Distance Between Rivets is
0.375” and 0.675”
The results shown in Figures 20 and 21 are summarized below.
• The gap between sheets has significant a effect on sheet material growth
53
• The amount of material growth increases with the increase of gap between sheets
during the riveting process.
• The distance between rivets (pitch) has a significant effect on sheet material growth
• The amount of sheet material growth increases with the increase of pitch/distance
between rivets during the riveting process.
These results clearly show that a smaller pitch and reduced gap between sheets are better to
minimize the sheet material growth in sheets during the riveting processes. The riveting
sequences do not have any significant affect on sheet material growth but a smaller pitch and
smaller gap between sheets are highly recommended to minimize the lower sheet material
growth.
4.5 Clearance Between Sheets and Sheets and Rivets
Any clearance between sheets or between rivets and sheets is not acceptable in the
riveting process because any amount of clearance can create a loose rivet. A loose rivet
means a loose joint in an assembly, which can lead to a joint failure. The clearance between
sheets or sheets and rivets is measured in a finite element simulated model where all types of
clearance or gaps after rivet formation are measured and the maximum data is noted for
further analysis.
After analysis, the data demonstrated that Factors A, B, A2 and B2 are the significant
factors. That means that at a 90% confidence level, Factor A (distance between rivets) and B
(gap between sheets) has a significant effect on the clearance between sheets or sheets and
rivets. As a result, it is important to determine the best combination of factors A and B to
minimize the clearance between sheets or sheets and rivets. The statistics show a numerical
relationship between clearance between sheets or sheets and rivets and Factors A and B,
54
Gap 0.015”
Gap 0.005”
which is represented in equation 4.5. The equation can be used to predict the clearance or
gap in the riveted joint based on known factors A and B. It is also helpful to ascertain the
best combination of factors A and B, assuming no gap or clearance exists in the joint.
1.0/(cleraence between sheets -1.00) = -1.00- 4.372E-004* A - 1.027E-003* B
+7.091E-004* A2 - 1.186E-003* B2 ----------- 4.5
The numerical relationships are represented in a graph to visualize the effects of these
factors on the post-gap between sheets or sheets and rivets. The clearance between sheets or
sheets and rivets is plotted against Factor A in Figure 22 and against Factor B in Figure 23.
In Figure 22, Factor B varies from 0.005 inch to 0.015 inches. In Figure 23, Factor A varies
from 0.375 inch to 0.675 inch. The lines actually represent the clearance or gap measurments
in the model after simulation. The red line in Figure 22 shows the amount of clearance
between sheets or sheets and rivets when the gap between sheets is maintained at 0.015
inches.
B: Gap between sheetsInteraction Graph
A: Distance Between rivets
cler
aenc
e be
twee
n sh
eets
0.375 0.438 0.500 0.563 0.625
0.000249004
0.00158974
0.00293047
0.0042712
0.00561194
B-
B+
Figure 22: Clearence Between Sheets and/or Sheets and Rivets Versus the Distance Between
Rivet When the Gap Between Sheets is 0.005” and 0.015”
55
Pitch 0.375
Pitch 0.675
A: Distance Between rivetsInteraction Graph
B: Gap between sheets
cler
aenc
e be
twee
n sh
eets
0.005 0.007 0.010 0.012 0.015
0.000249004
0.00158974
0.00293047
0.0042712
0.00561194
A-
A+
Figure 23: Clearence Between Sheets and/or Sheets and Rivets Versus the Distance Between
Rivet When the Pitch 0.375” and 0.675” The results shown in Figures 22 and 23 are summarized below.
• Factor A (distance between rivets) and B (gap between sheets) has a significant effect
on the clearance between sheets or sheets and rivets after rivet formation.
• Post clearance/gap is larger when the gap between sheets is bigger in the model
before simulation. It is essential to minimize the gap between sheets during the
riveting process to minimize the post gap/clearance between sheets or sheets and
rivets.
• A smaller pitch has less effect on post clearance between sheets or sheet and rivets
than a larger pitch. A bigger pitch produces more of a gap during the riveting
process. As a result, it is essential to optimize the pitch to minimize the post gap in to
the riveting process.
56
This data clearly shows that the riveting sequence does not have any significant effect on the
amount of clearance between sheets or sheets and rivets. The other factors both significantly
affect the process.
4.6. Process Optimization
In process optimization, a statistical tool improves the process quality by finding the
optimal results of factors based on their response variables. Here, three factors (riveting
sequence, gap between sheets and distance between rievets) are analyzed based on seven
different response variables (residual stress in sheets and rivets, bulging in top and bottom
sheet, sheet material growth, post-clearance between sheets or between sheets and rivets).
All of the response variables need to be minimized to achieve the best quality riveted lap
joint. The method calculates the best combination of all factors for each response variable
and produces a percentage of desirability achieved by that combination of factors. When the
final analysis was complete, all desirability factors combined together to produce a single
desirability factor. Based on that desirability factor, the eleven overall best combinations of
Table 9 clearly shows that the best combination of three factors are a distance between rivets
is 0.375”, a gap between sheets of 0.005 inch, and a riveting sequence of 1-3-2. The overall
desirability of this optimal combination is 69.6%.
58
CHAPTER 5
CONCLUSIONS AND FUTURE WORK
The goal of this thesis was to determine the best riveting sequence to reduce
variability, the amount of residual stress in the sheet metal and produce stronger and more
reliable riveted joints. To do this, however, the study first had to identify the crucial factors
that interact in a riveted joint (the riveting sequence, the distance between rivets and the gap
between the sheets) and determine how much, if any, these factors influence the quality of
the riveted joint. The study also sought to identify which riveting sequence caused the least
material bulging and material growth.
The research showed the following statements to be true:
• Sequence 1-3-2 yielded the least residual stress in the sheets;
• Sequence 1-3-2 showed the least variability in residual stress in the sheets when the
gap between sheets and the distance between rivets varied;
• When the pitch is equal to 5D, the riveting sequence has no statistically significant
effect on the amount of residual stress in the sheets; however, when the pitch is equal
to 3D, sequence 1-3-2 clearly shows the least variability and produces the least
residual stress;
• To minimize the variability in residual stress in the sheets, the gap between the sheets
should be as little as possible, preferably less than 0.005”;
• Though the riveting sequence had little affect on the residual stress in the rivets,
sequence 1-3-2 was found to produce the least residual stress;
59
• Though the amount of gap between the sheets and the distance between rivets has a
direct effect on the amount of material bulging, the riveting sequence was not found
to have any significant effect;
• To minimize sheet metal bulging, a smaller gap between the sheets and a larger pitch
are better;
• Though the riveting sequence did not have any significant effect on sheet material
growth, sequence 1-3-2 showed the least variability in sheet material growth;
• A smaller pitch and smaller gap between the sheets results in the least material
growth in the sheets;
• The riveting sequence was not shown to have any significant effect on the amount of
post-clearance between sheets and between sheets and rivets, but a smaller pitch and
gap is better.
After extensive testing involving 27 simulations and literally hundreds of data points, the
data showed that the best riveting sequence was 1-3-2, the optimal pitch is 3D and the gap
between the sheets should be less than 0.005”.
5.1 Recommendations
Riveting Sequence: If three rivets are used to join pieces of sheet metal while they are
clamped together, the best riveting sequence would be (from left to right) rivet #1 first, rivet
#3 next and rivet #2 last. This riveting sequence assures the least amount of residual stress in
the sheets and it has less variability in sheet metal bulging, sheet material growth and post-
clearance between sheets and sheets and rivets. As a result, riveting sequence 1-3-2 is highly
recommended for sheet metal assembly.
60
Gap Between Sheets: A smaller gap between sheets during the riveting process is
better to keep the residual stress level low in the sheets and rivets. It is also has a significant
effect on sheet metal bulging, sheet material growth and the clearance between sheets and/or
rivets after rivet formation. The gap between the sheets should be as small as possible to
improve the quality of the riveted joint. This study found that the maximum allowable gap
between sheets is 0.005 inch.
Distance Between Rivets: This study recommends that the distance between rivets be
kept within 0.375” for 1/8” nominal rivets. This spacing recommendation, when used in
conjunction with the aforementioned optimal riveting sequence of 1-3-2 and a maximum gap
between sheets of 0.005”, should result in the most desirable riveting method.
5.2 Future Works
The scope of this study was limited by time and resources. Given sufficient time and
resources, this study could be expanded in many ways. First, largely because of time
constraints, only a three-rivet sequence was studied. Additional research should be
performed in riveting sequences for the more-common five-to-seven-rivet sequence. The
three rivets were studied in a single row. Multiple-row sequences should also be considered.
Also, only tinner’s rivets of a nominal diameter of 1/8” were considered in the study; other
researchers could perform studies on rivets of different sizes and shapes to see if different-
sized rivets affect the results given here. In this study, the pieces of sheet metal were a
constant thickness of 0.064”. Additional research could be performed on sheets of smaller
and larger thicknesses to see what, if any, effect sheet metal thickness has on the optimal
riveting sequence. Also because of time constraints, a single punch velocity and speed and a
single friction coefficient were taken into account in the simulations. Obviously, all of these
61
factors could be varied significantly in subsequent studies. Further research could also be
performed regarding different amounts of squeeze force, since this study could only examine
one level of squeeze force.
The most significant area of recommended further research is the potential for another
researcher to perform actual experiments to validate the data generated by these simulations.
Though data produced by computer simulations is a valuable tool for researchers to use to
direct their work and do preliminary research, actual physical experiments are essential to
ascertain the validity of preliminary data. Because of the potential costs (both monetary and
in human life) associated with changing the fabrication process for joining sheet metal in the
aircraft industry, experiments will be needed before the recommendations of this study can
be put into practical use with any significant level of safety and certainty. Once these
experiments are performed and this preliminary data is validated, the recommendations
outlined in this thesis should improve the quality of riveted joints and thus save the aircraft
industry a significant amount of money by extending aircraft life.
62
REFERENCES
63
LIST OF REFERENCES
Andrews, H. J., Holt, M. (1945). “Fatigue Tests on 1/8th in Aluminum Alloy Riveted Joints” National Advisory Committee for Aeronautics (NACA), TN971, ARC8858.
ASME: Small Solid Rivets, ASME, United Engineering Center, NY, 1965. Edwards, L. and Ozdemir, T, (1992) “Residual stresses at cold expanded fastener holes”,
Measurement of Residual and Applied Stress Using Neutron diffraction, pp. 545-553 ESDU Data Sheets No. 67008. “Elastic stresses in single lap joints under tension or
compression” Engineering science Data Unit item 67008, 1967 Estaugh, G., Simpson, D., Straznicky, P., and Wakeman, R., (1995), “ A special uniaxial
coupon test specimen for the simulation of multiple site fatigue crack growth and link up in fuselage skin splices, NASA N96-24261
Fitzgerald, T. J. and Cohen J. B. (1994) “Residual stress in and around rivets in clad
aluminum alloy plates,” Material Science and Engineering, vol. 188, pp. 51-58 Fung, C.P. Smart, J. (1996), ”An Experimental and Numerical Analysis of Riveted Single
Lap Joints,” Proceedings of the Institution of Mechanical Engineers, Vol. 208, pp. 79-90.
Harish, G. and Farris, T. N. (1999),“Shell Modeling of Fretting in Riveted Lap Joints,”
AIAA Journal, Vol. 36, No.6, pp. 1087-1093. Harish, G. and Farris, T. N. (1999),“An integrated approach for prediction of fretting crack
nucleation in riveted lap joints”, American Institute of Aeronautics and Astronautics. AIAA-99-1340, Pp. 1219-1226
Li, G. and Shi, G. (2004). “Effect of the Riveting Process on the Residual Stress in Fuselage
Lap Joints,” Canadian Aeronautics and Space Journal, Vol. 50, No. 2, pp. 91-105. Li, Gang, Shi, Guoqin, Bellinger, Nicholas C. (2005). “Studies of Residual Stress in Single-
row Countersunk Riveted Lap Joints,” 46th AIAA/ASME/ASCE/AHS/ASC Structures, Structural Dynamics and Materials Conference, Austin, Texas, pp. 1-18
Mechanical Design and Systems Handbook (2nd Edition), McGraw-Hill Book Company,
New York, 1985 Nicoletto, G. (1989), “Fatigue crack-tip mechanics in 7075-T6 aluminum alloy from high
sensitivity displacement field measurements,” Nonlinear Fracture Mechanics, Vol. 1, Pp. 416-432, 1989.
64
Silva, Lucas F.M. et al. (2000). “Multiple Site Damage in Riveted Lap-joints: Experimental Simulation and Finite Element Prediction,” International Journal of Fatigue, Vol. 22, pp. 319-338
Szolwinski, M. P. and Farris, T. N. (1999), “Linking riveting process parameters to the
fatigue performance of riveted aircraft structures,” American Institute of Aeronautics & Astronautics. Pp 1208-1218
Tong, P., Pian T. and Lasry,(1973) “A hybrid-element approach to crack problems in plane
elasticity,” International journal for Numerical Methods in Engineering, Vol 17, pp. 297-308
Wang, H.L (1998), “Evaluation of multiple site damage in lap joint specimens” Ph.D.
dissertation, Purdue University.
65
APPENDICES
66
APPENDIX A
MODEL: GAP BETWEEN SHEETS 0.005 INCH, PITCH 3D
After riveting: sequence 1-2-3
67
After riveting: sequence 2-1-3
After riveting: sequence 1-3-2
68
APPENDIX B
MODEL : GAP BETWEEN SHEETS 0.01 INCH, PITCH 3D, SEQUENCE 1-2-3
MODEL : GAP BETWEEN SHEETS 0.015 INCH, PITCH 3D, SEQUENCE 1-2-3
Bulging increases with increasing the gap between sheets.
69
APPENDIX C
MODEL : GAP BETWEEN SHEETS 0.015 INCH, PITCH 4D, SEQUENCE 1-2-3
70
APPENDIX D
MODEL III: GAP BETWEEN SHEETS 0.005 INCH, PITCH 5D, SEQUENCE 1-2-3
MODEL III: GAP BETWEEN SHEETS 0.01 INCH, PITCH 5D,
SEQUENCE 1-2-3
71
MODEL: GAP BETWEEN SHEETS 0.015 INCH, PITCH 5D, SEQUENCE 1-2-3


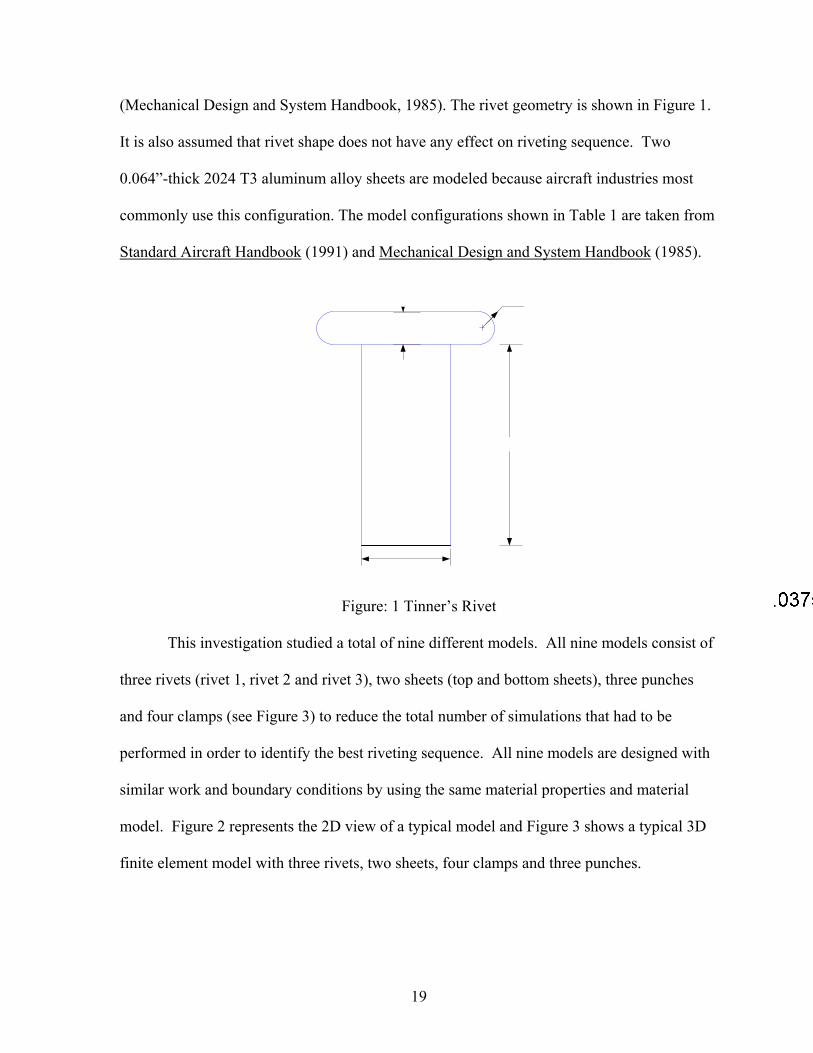
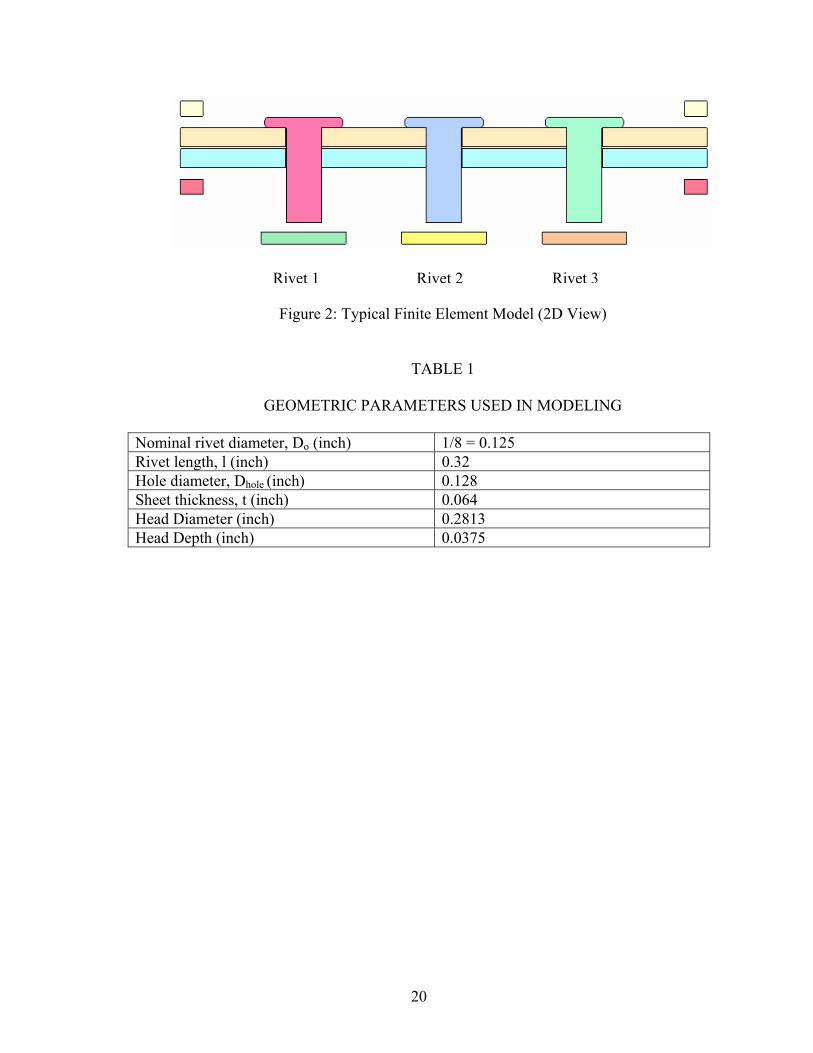
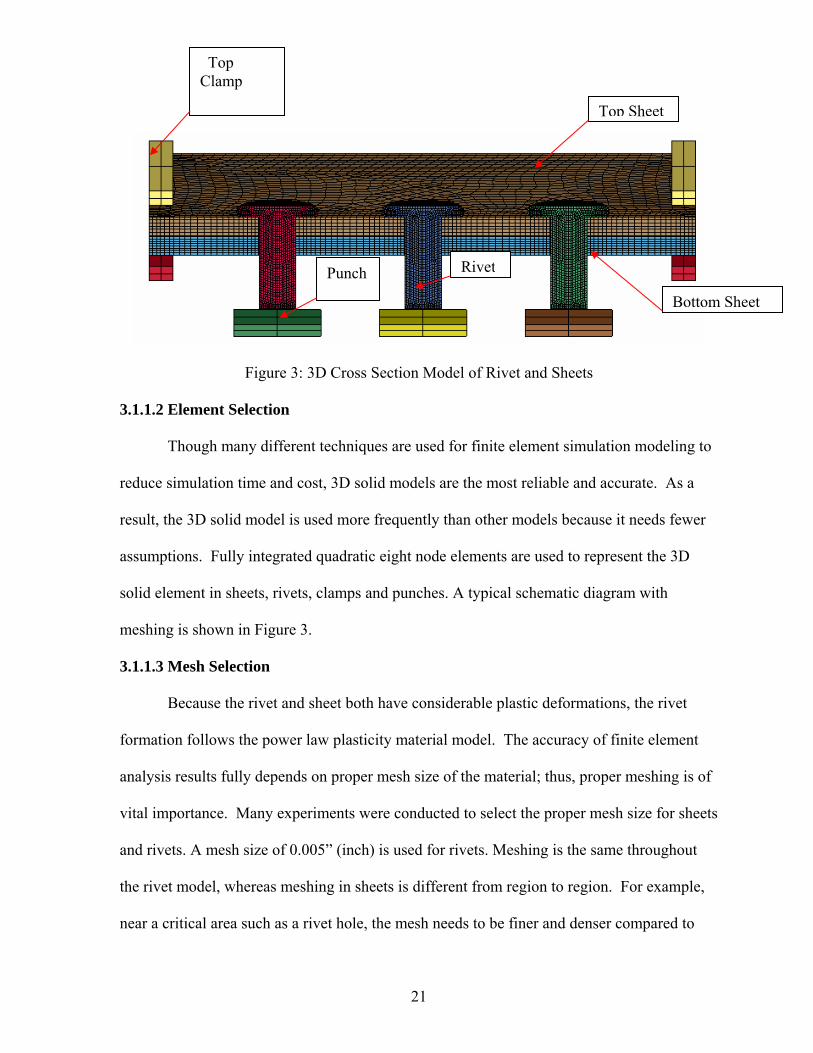


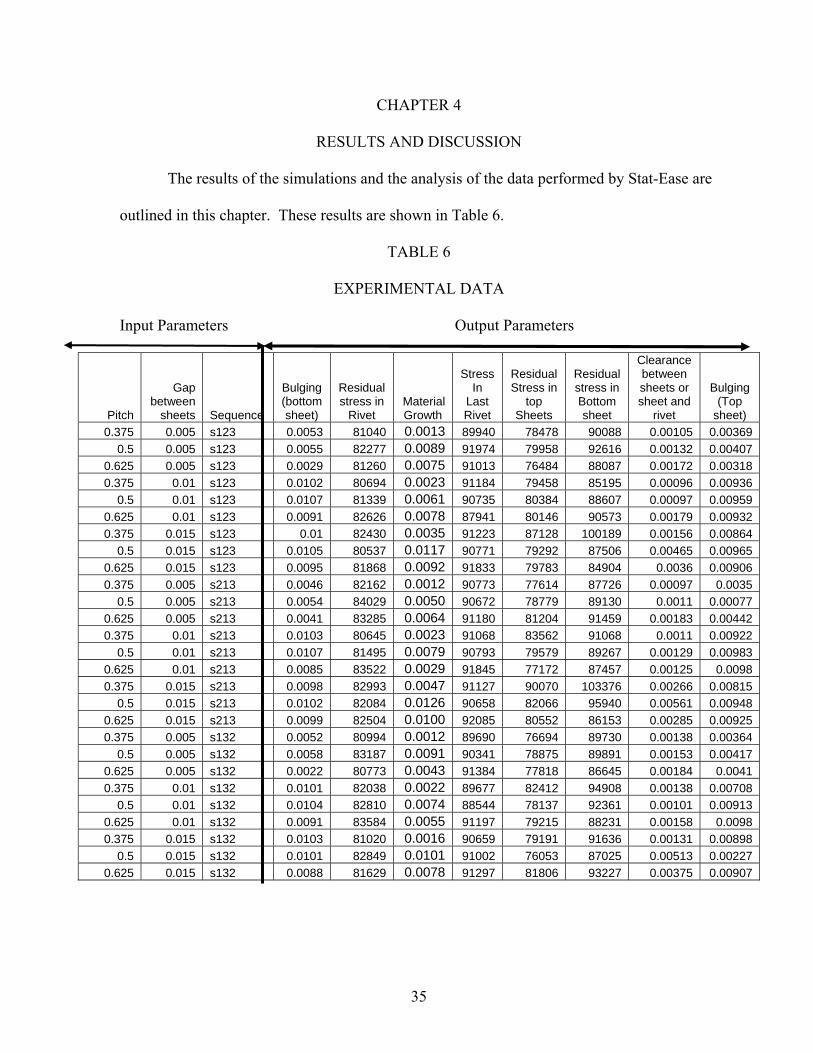


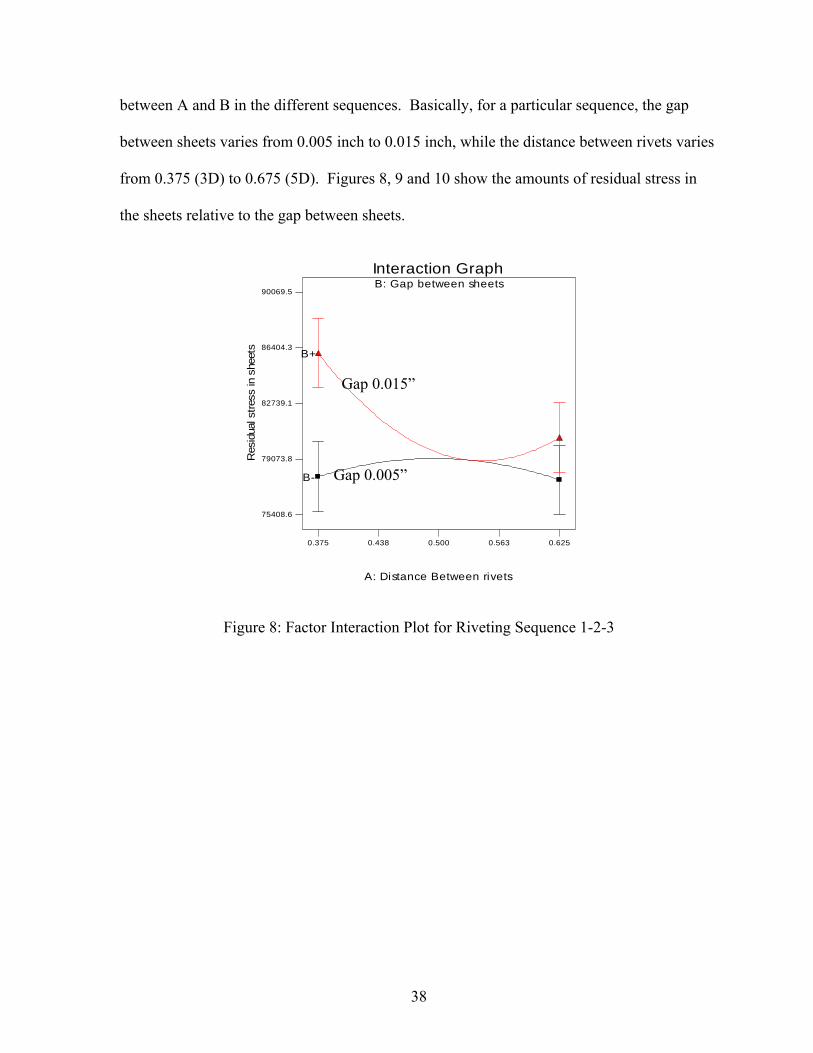

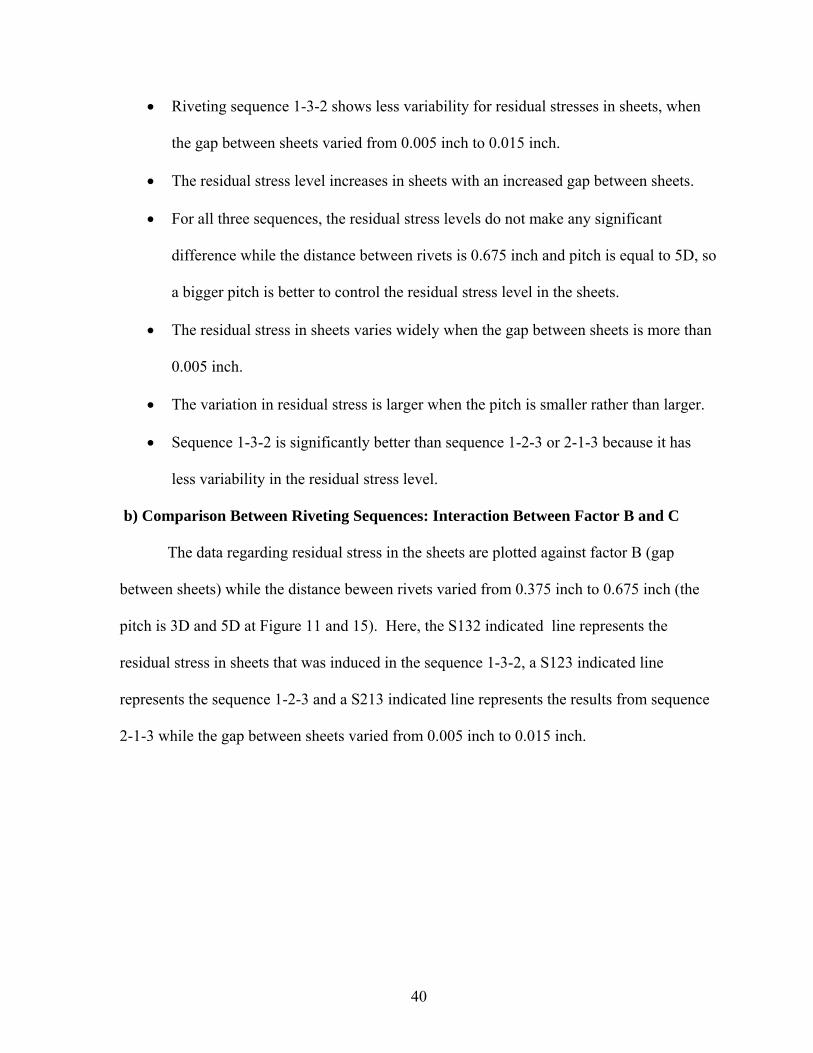


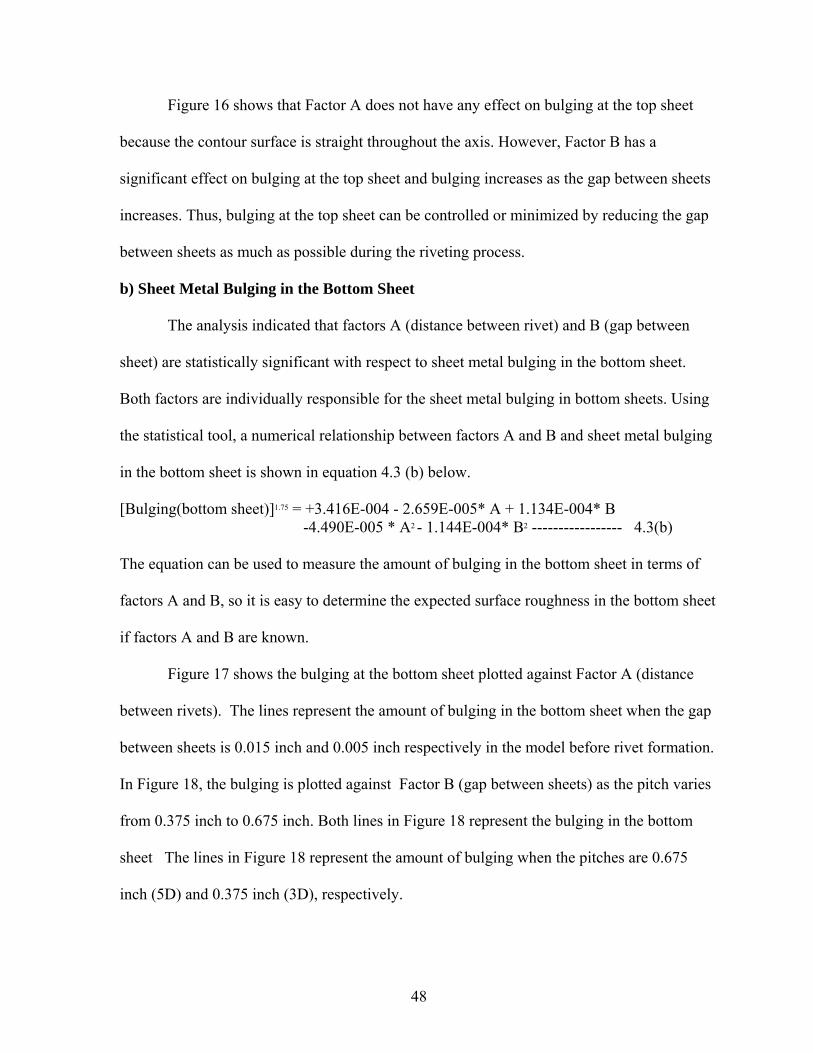


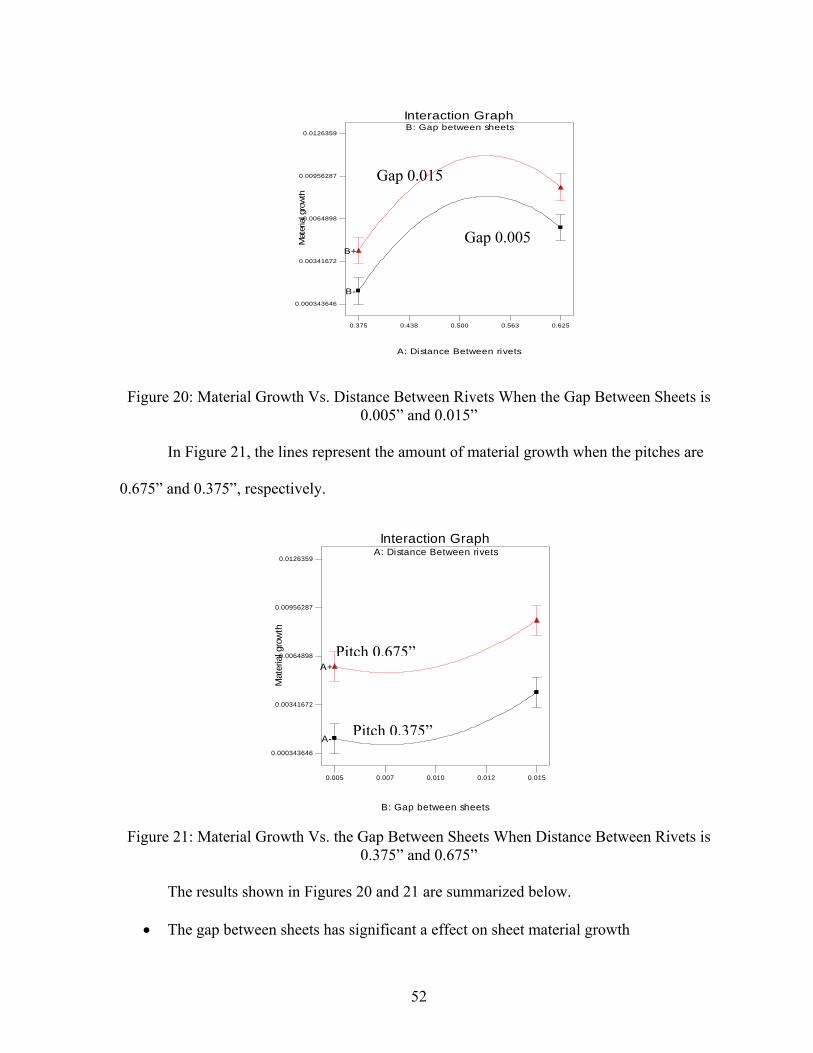


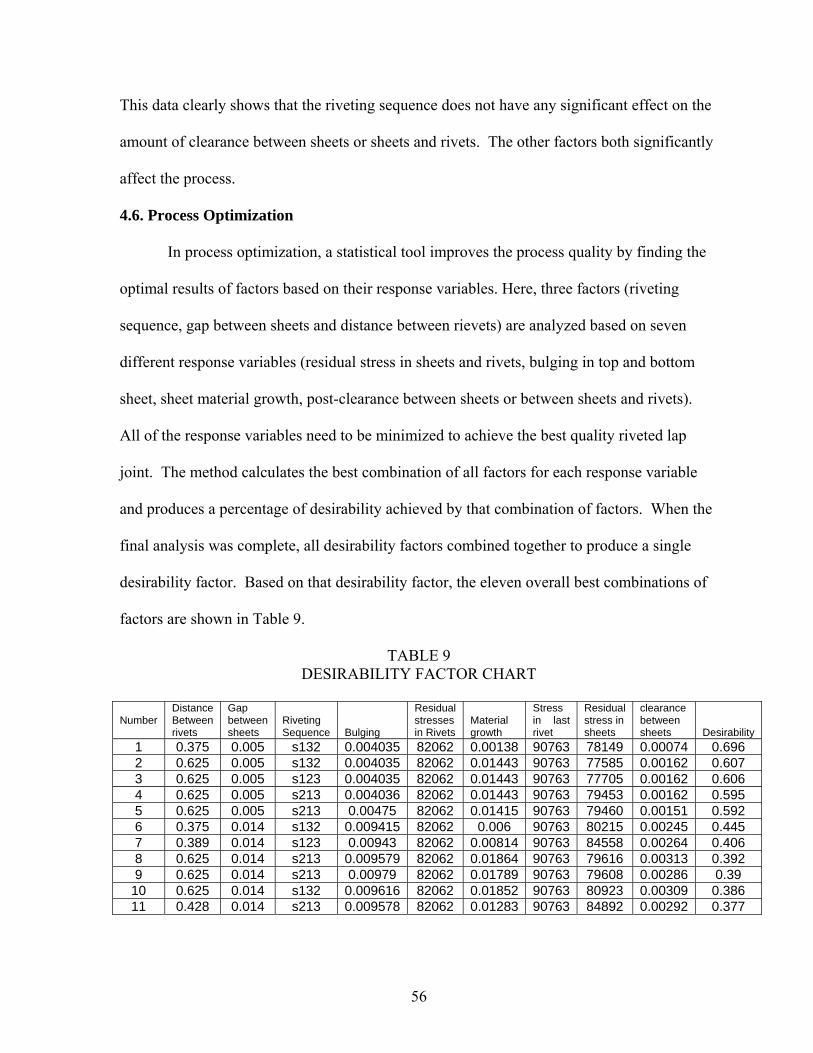


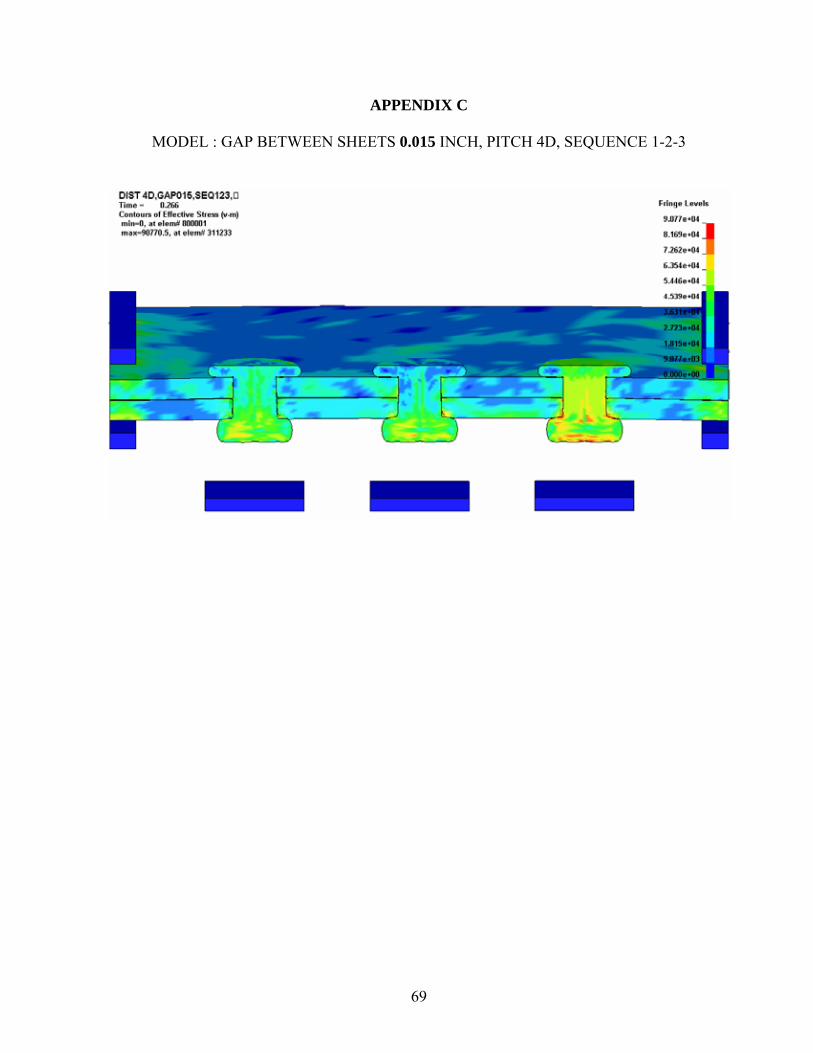
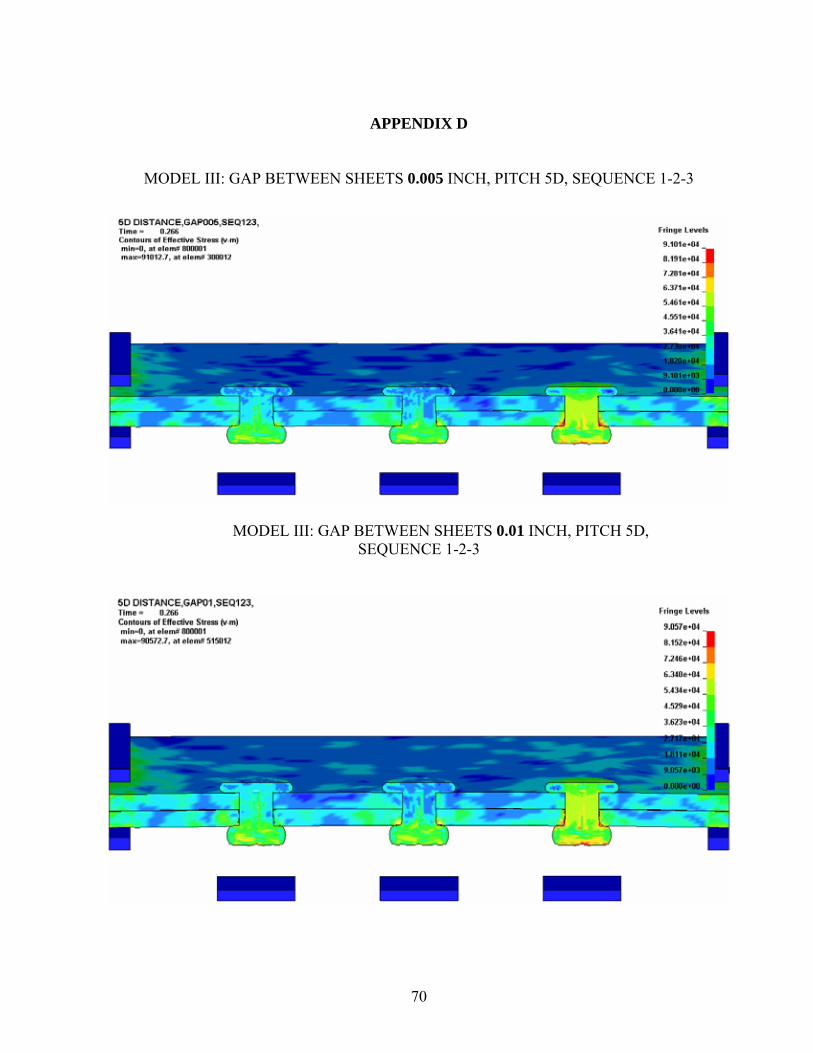


![Radial riveting technology - OK Strojservis · Coordinate riveting station RNC 181 RNC 231 RNC 281 RNC 331 Diameter handled [mm] 6 8,5 12 16 Riveting force max. 6 bar [kN] 6 12 17](https://static.documents.pub/doc/80x56/5e50e3351fce830ac74ad686/radial-riveting-technology-ok-coordinate-riveting-station-rnc-181-rnc-231-rnc.jpg)


