Page 1
IMPACT OF STAPHYLOCOCCUS AUREUS
BIOFILM CONDITIONED MEDIUM ON INFLAMMATION AND
EPITHELIALIZATION IN HUMAN KERATINOCYTES
by
Patrick Robert Secor
A dissertation submitted in partial fulfillment
of the requirements for the degree
of
Doctor of Philosophy
in
Cell Biology and Neuroscience
MONTANA STATE UNIVERSITY
Bozeman, Montana
January 2011
Page 2
©COPYRIGHT
by
Patrick Robert Secor
2011
All Rights Reserved
Page 3
ii
APPROVAL
of a dissertation submitted by
Patrick Robert Secor
This dissertation has been read by each member of the dissertation committee and
has been found to be satisfactory regarding content, English usage, format, citation,
bibliographic style, and consistency and is ready for submission to the Division of
Graduate Education.
Dr. Thomas Hughes
Approved for the Department of Cell Biology and Neuroscience
Dr. Thomas Hughes
Approved for the Division of Graduate Education
Dr. Carl A. Fox
Page 4
iii
STATEMENT OF PERMISSION TO USE
In presenting this dissertation in partial fulfillment of the requirements for a
doctoral degree at Montana State University, I agree that the Library shall make it
available to borrowers under rules of the Library. I further agree that copying of this
dissertation is allowable only for scholarly purposes, consistent with “fair use” as
prescribed in the U.S. Copyright Law. Requests for extensive copying or reproduction of
this dissertation should be referred to ProQuest Information and Learning, 300 North
Zeeb Road, Ann Arbor, Michigan 48106, to whom I have granted “the exclusive right to
reproduce and distribute my dissertation in and from microform along with the non-
exclusive right to reproduce and distribute my abstract in any format in whole or in part.”
Patrick Robert Secor
January 2011
Page 5
iv
TABLE OF CONTENTS
1. INTRODUCTION...................................................................................................1
Contextf...................................................................................................................1
Objectives................................................................................................................2
2. BACKGROUND.....................................................................................................4
Literature Reviewed.................................................................................................4
Biology and Immunology of Acute Wound Healing...................................4
Inhibition of Healing in Chronic Woundsf..................................................7
Bacterial Biofilm and S. aureus Infection of Chronic Wounds.................10
Epidermal Keratinocytes and Their Functions in Immunitye....................12
Cytokine Biologyf......................................................................................13
Signal sTransduction in Activated Keratinocytes......................................16
Mitogen Activated Protein Kinase.................................................17
Transcription Factorss....................................................................20
Intracellular Calcium Release........................................................22
Physiology of Wounded Human Skin.......................................................23
3. PHYLOGENETIC CHARACTERIZATION OF
CHRONIC WOUND BIOFILM MICRO-COMMUNITIES................................25
Introduction............................................................................................................25
Materials and Methods...........................................................................................26
DNA Extraction from Debridement Samples............................................26
PCR and DGGE………………………….................................................26
Cloning and Sequencings...........................................................................27
Results…................................................................................................................28
Estimation of Bacterial Diversity by
DGGE and Sequencing of 16S rDNAs......................................................28
Characterization of Bacterial Populations in
Diabetic Foot Ulcers, Venous Leg Ulcers, and Pressure Ulcers................32
Discussion..............................................................................................................34
4. DEVELOPMENT OF A NOVEL IN VITRO
BIOFILM DISEASE MODEL AND CHARACTERIZATION OF
S. AUREUS BIOFILM CONDITIONED MEDIUM….........................................38
Introduction............................................................................................................38
Page 6
v
TABLE OF CONTENTS– CONTINUED
Materials and Methods...........................................................................................39
Cell Culture................................................................................................39
S. aureus Biofilm Culture Conditions
and Preparation of Biofilm Conditioned Medium.....................................40
S. aureus Planktonic Culture Conditions
and Preparation of Planktonic Conditioned Medium................................40
Population Density Measurements of S. aureus Cultures.........................41
1D SDS-PAGE..........................................................................................42
Nuclear Magnetic Resonance (NMR) Metabolite Profiling......................43
Organic Extraction of Conditioned Medium.............................................43
High-Performance Liquid Chromatography
Mass Spectrometry (HPLC/MS) Analysiss...............................................44
HPLC.........................................................................................................44
ESI-MS......................................................................................................44
Q-TOF-MS................................................................................................44
ICP-MS.....................................................................................................45
Results....................................................................................................................45
Characterization of S. aureus in the
Biofilm Disease Model and
S. aureus Biofilm Conditioned Medium....................................................45
S. aureus Biofilm Produces Mixed Acid Fermentation Products..............49
Hydrophobic Small Molecules Production in
S. aureus Biofilm and Planktonic Cultures................................................57
Oxygen Tension in Planktonic S. aureus
Cultures Impacts Production of Aureusimine AandBw.............................61
Discussion..............................................................................................................63
5. S. AUREUS BIOFILM CONDITIONED
MEDIUM INDUCES A DISTINCT INFLAMMATORY
RESPONSE AND INHIBITS PROCESSES ASSOCIATED WITH
EPITHELIALIZATION IN HUMAN KERATINOCYTES.................................71
Introduction............................................................................................................71
Materials and Methods...........................................................................................71
Cell Culture................................................................................................71
Bacterial Strains and Culture Conditions..................................................72
Conditioned Medium Microarray..............................................................72
Co-Culture Microarray..............................................................................73
RT-qPCR...................................................................................................75
Microscopy............................................................................................................75
Page 7
vi
TABLE OF CONTENTS– CONTINUED
Terminal Deoxynucleotidyl Transferase
dUTP Nick End Labeling (TUNEL) Assay...............................................76
Measurement of Intracellular Calcium Levels...........................................77
Cytokine Detection by Enzyme Linked Immunoassays (ELISA).............77
Detection of MAPK Phosphorylation Using Cell-Based ELISAs............78
Inhibition of MAPK...................................................................................78
Results....................................................................................................................79
Epithelialization.........................................................................................79
S. aureus Biofilms Induce
Changes in Keratinocyte Morphology .........................................79
S. aureus Biofilms Induce Apoptosis in Human Keratinocytes....84
Increase of Intracellular Calcium
Levels in BCM Stimulated Keratinocytes.....................................87
Inflammations...............................................................................89
S. aureus Biofilm Upregulates Genes
Associated with Inflammation in Human Keratinocytes...............89
S. aureus BCM and PCM Induce Differential Temporal
Cytokine and Chemokine Production in Human Keratinocytes....92
S. aureus BCM and PCM Differentially Modulate MAPK
Phosphorylation in Human Keratinocytess...................................96
XME Genes Upregulated in Human
Keratinocytes Exposed to Bacterial Secreted Products..............100
Discussion............................................................................................................102
Inflammation............................................................................................102
Transcriptional Analysis of Human
Keratinocytes Exposed to BCMh.................................................103
Cytokine Production in BCM Treated Keratinocytes..................104
MAPK Signaling..........................................................................105
Xenobiotic Metabolizing Enzymes are
Induced by BCM in Human Keratinocytes..................................107
Epithelialization.......................................................................................111
Morphologic Changes
and Apoptosis Induced by BCM..................................................112
A Model of the Effects of Bacteria on Wound Healing...........................114
6. CONCLUSIONS AND SUMMARY OF RESULTS.........................................117
APPENDICES.....................................................................................................119
Page 8
vii
TABLE OF CONTENTS– CONTINUED
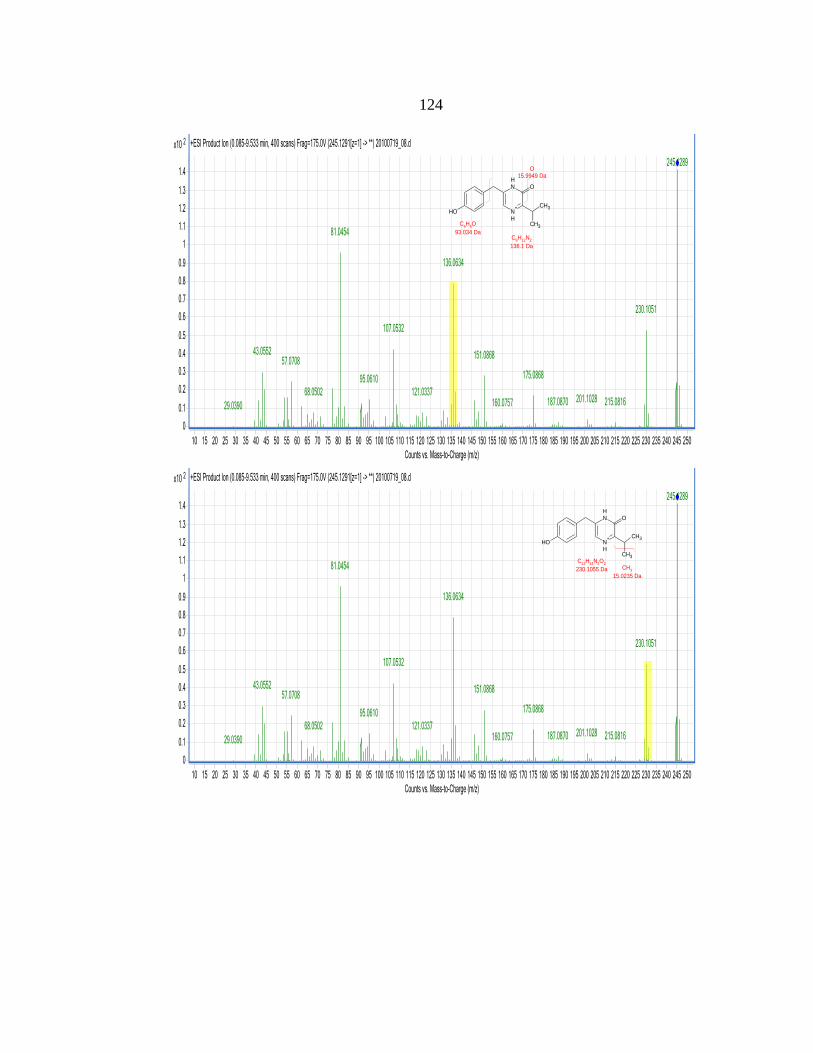
APPENDIX A: MS2 Data for Aureusimine A...................................................120
APPENDIX B: MS2 Data for Aureusimine B...................................................125
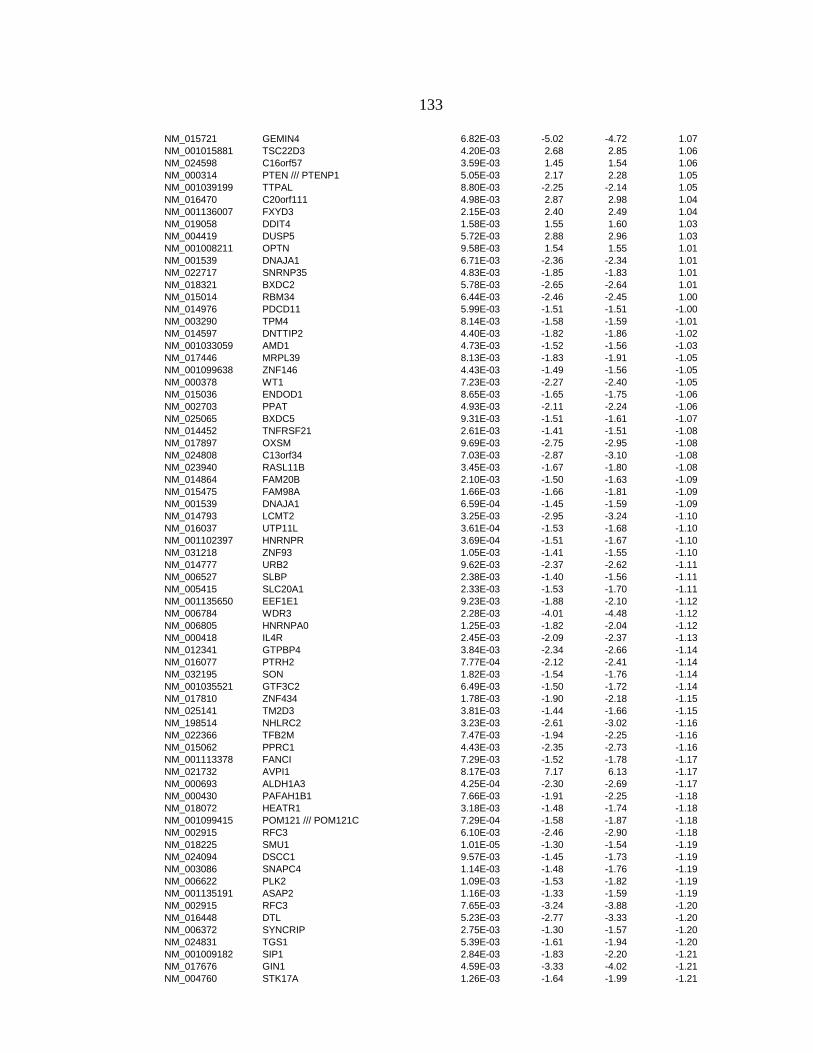
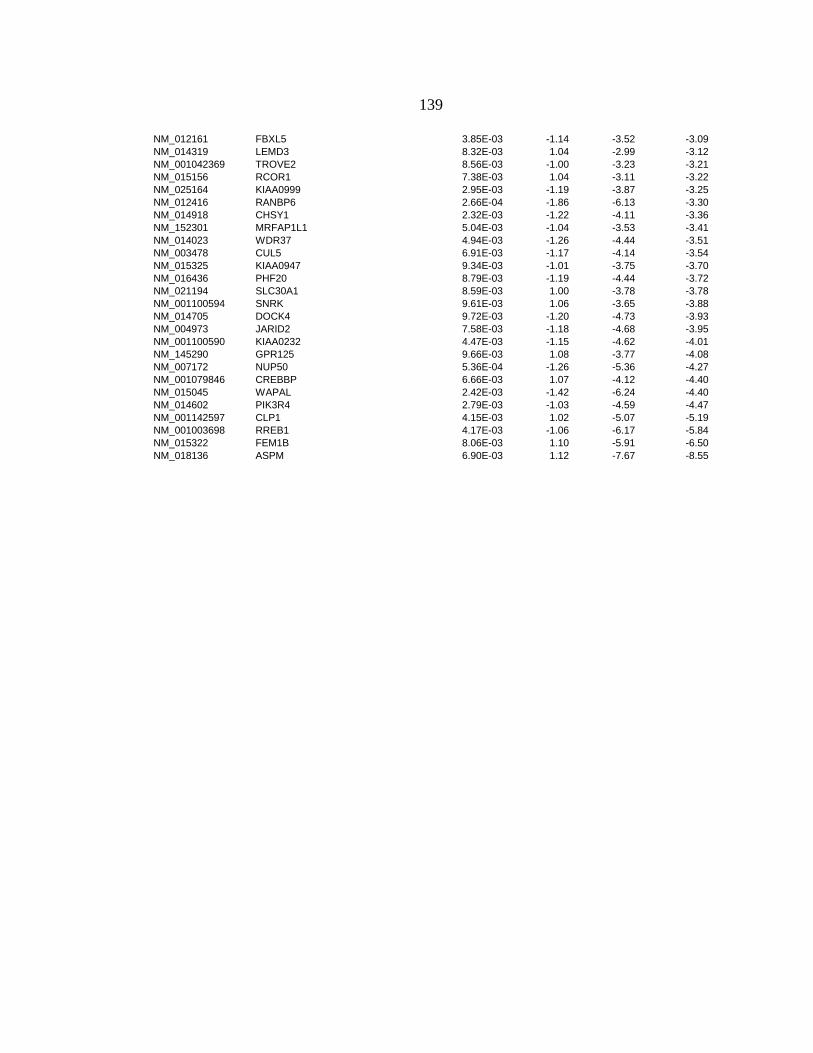
APPENDIX C: BCM/PCM Microarray Data.....................................................130
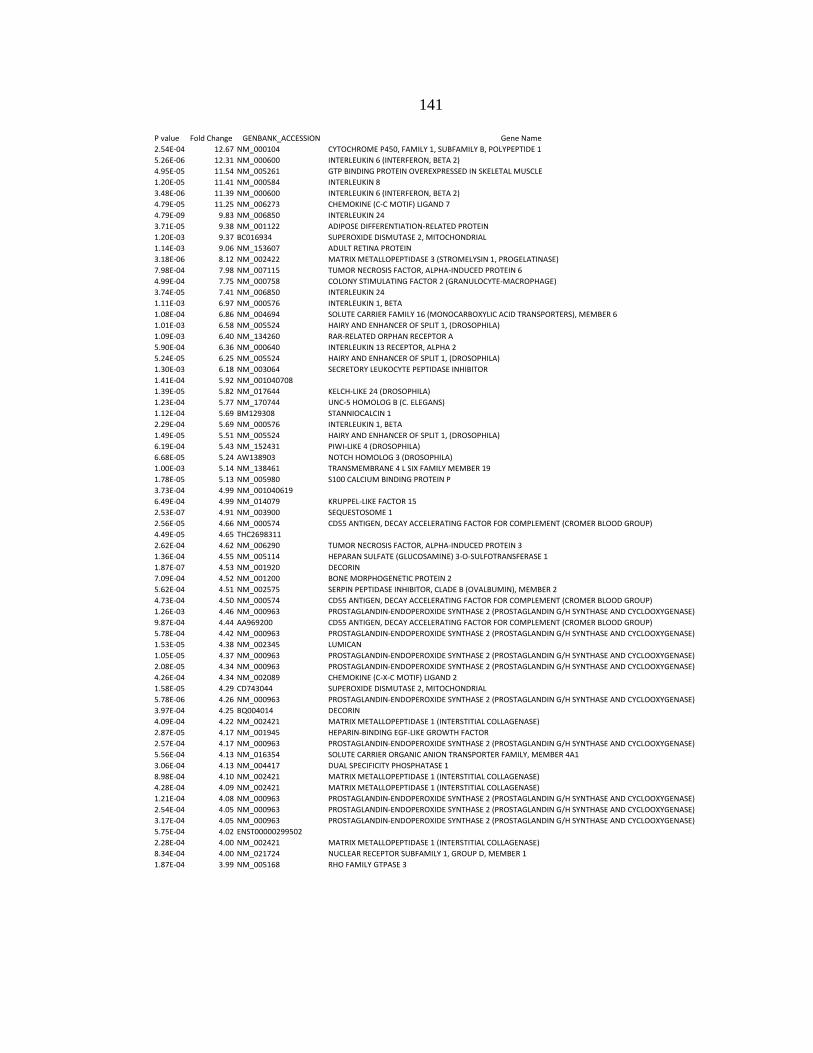
APPENDIX D: Co-Culture Microarray Dataq..................................................140
APPENDIX E: Fibroblast Morphology and Apoptosis......................................154 APPENDIX F: The Small GTPase GEM and Cell Morphology........................156
Introduction..............................................................................................157
Materials and Methods.............................................................................158
Microarray...................................................................................158
RT-qPCRj....................................................................................158
GEM Immunostaining.................................................................158
Protein Kinase C Detection.........................................................158
shRNA Interference.....................................................................158
Results and Discussion............................................................................159
APPENDIX G: Peroxisome and Lysosome Depletion
in Keratinocytes Treated with BCM ........................................164
APPENDIX H: Unknown Cell Types Present in HFK
Culture Resistant to Ill Effects of BCM....................................166
REFERENCES CITED........................................................................................172
Page 9
viii
LIST OF TABLES
Table Page
1. Bacterial Genera Identified by Culture Data as Related
to DGGE Banding Patterns of Chronic Wound Debridement Samples................29
2. Bacteria Identified by Traditional Culturing Techniques From
Debridement Samples from 37 Chronic Wounds..................................................30
3. BLAST Results from Sequenced 16S rDNA Sequences
from 31 Debridement Samples..............................................................................31
4. Results from DGGE Band Excision and Sequencing...........................................33
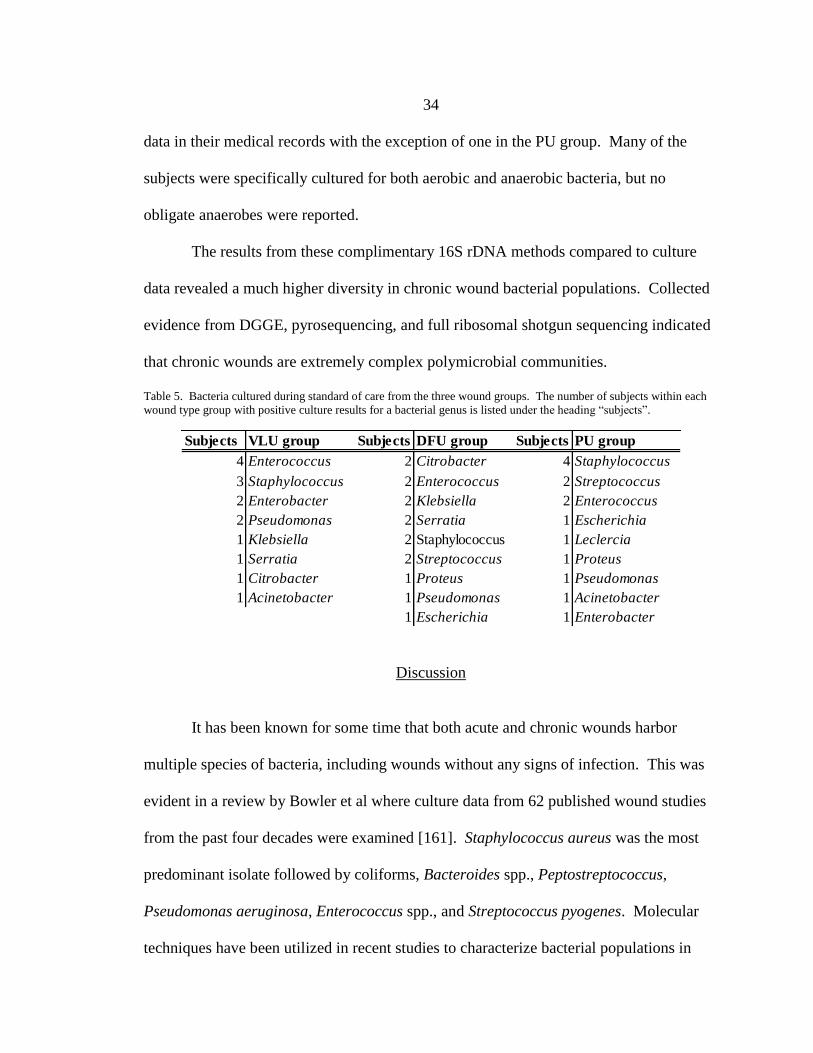
5. Bacteria Cultured During Standard Care from the Three Wound Groups...........34
6. Aureusimine A and B Production in Different Bacterial Strains..........................60
7. Pro-Inflammatory Genes Upregulated in BCM Treated HFKs............................90
8. Inflammatory Genes Significantly Regulated in HFKs in the
S. aureus Biofilm Co-Culture Model After 24 hours of Co-culture......................91
9. Transcription Factors Induced in PCM and BCM
Treated Keratinocytes after Four Hours................................................................92
10. DUSP Genes Activated in HFKs by BCM after Four Hours of Contact..............96
11. Genes with Xenobiotic Metabolic Activity are Upregulated in
Keratinocytes Exposed to S. aureus Biofilm.......................................................100
12. Genes Involved in the Aryl Hydrocarbon Receptor Pathway are Regulated
by S. aureus Biofilm Secreted Factors in Human Keratinocytes........................100
13. Functional Enrichment Using the DAVID
Functional Analysis Tool Revealed Several Genes Related
to Oxidative Stress and DNA Damage in Response to BCM..............................102
Page 10
ix
LIST OF FIGURES
Figure Page
1. The Three Main Phases of Wound Healing.............................................................7
2. Generalized Scheme of MAPK Signaling.............................................................18
3. Image of a Typical DGGE Gel Showing
Results from 13 Chronic Wound Specimens.........................................................29
4. DGGE Profiles for Diabetic Foot Ulcers,
Venous Leg Ulcers, and Pressure Ulcers...............................................................32
5. Image of the in vitro Biofilm Disease Model........................................................46
6. Population Density Curves for S. aureus Biofilm
and Planktonic Cultures Over a Four Day Period..................................................47
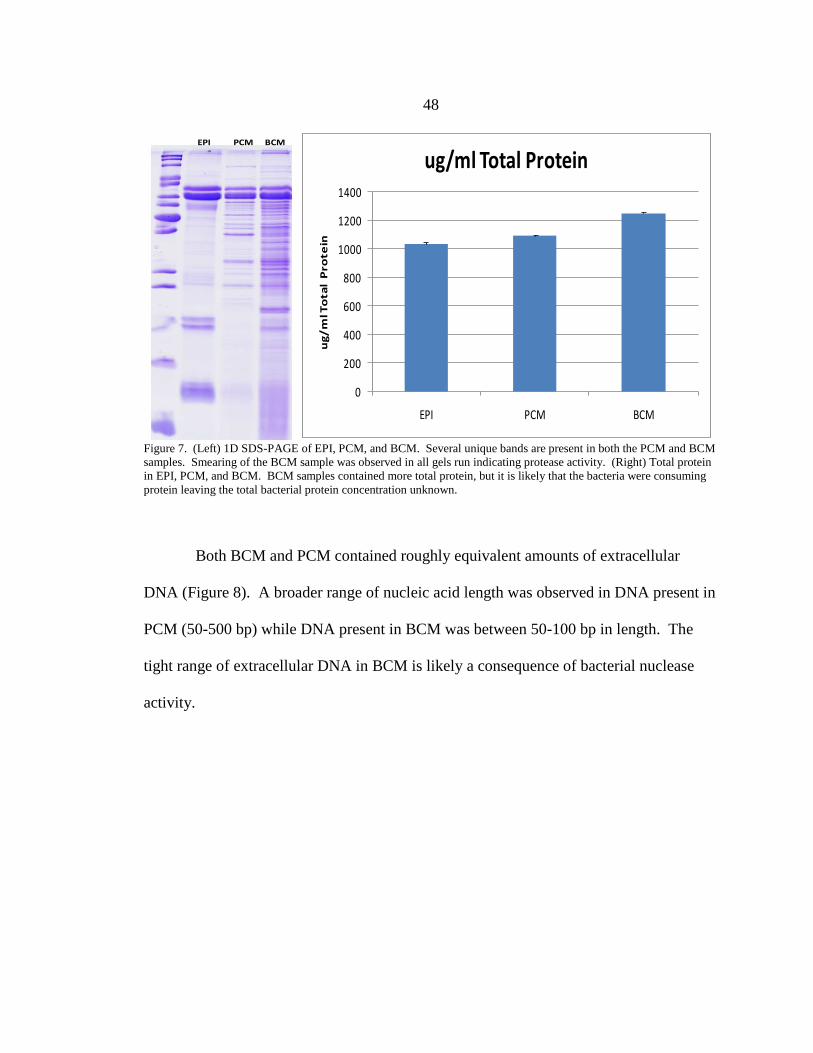
7. 1D SDS-PAGE and Total Protein Concentrations in BCM, PCM, and EPI.........48
8. Extracellular DNA in BCM and PCM...................................................................49
9. NMR Raw Spectrum BCM....................................................................................50
10. Hierarchical Clustering of Metabolite Concentrations
in BCM, PCM, and EPI as Revealed by Nuclear Magnetic Resonance................51
11. Hierarchical Clustering of Excreted Metabolites from Human Keratinocytes
Exposed to BCM, PCM, or EPI............................................................................53
12. Growth Curves for S. aureus Under
Open, Aerobic, Sealed Aerobic, and Anoxic Conditions......................................54
13. pH Values for BCM and PCM
Produced Under Differing Oxygen Tensions........................................................55
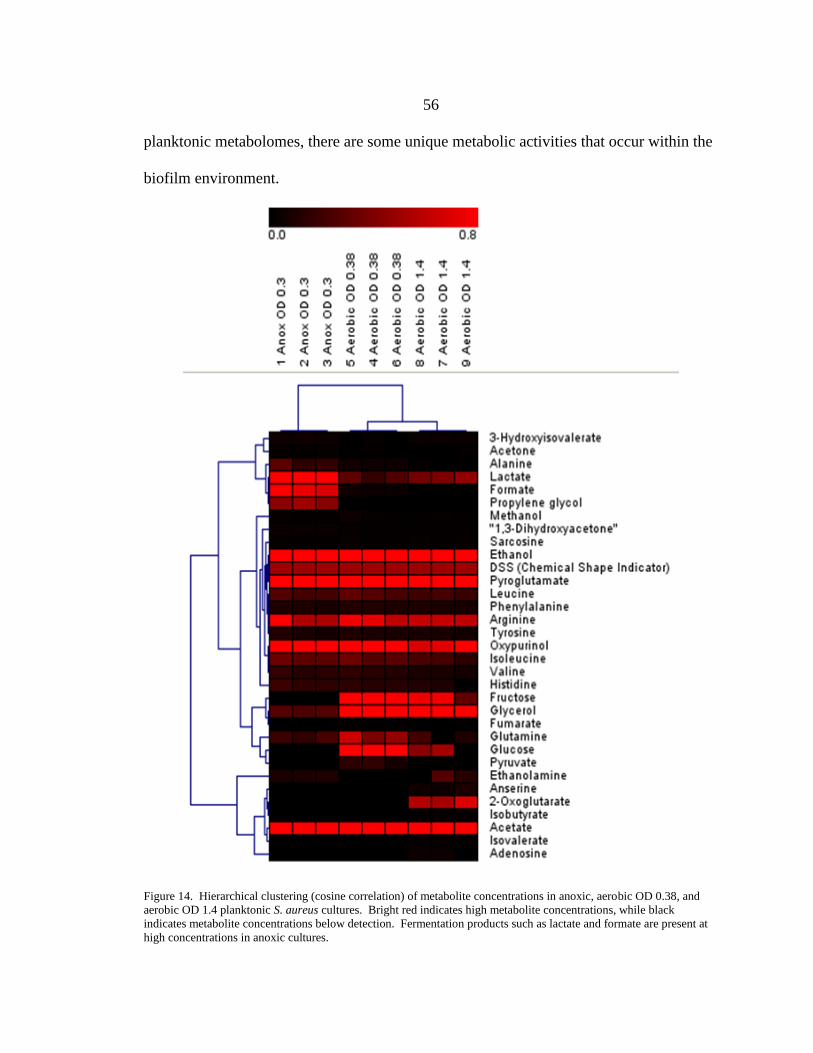
14. Hierarchical Clustering of
Metabolite Concentrations in Planktonic
Cultures of S. aureus Under Differing Oxygen Tensions.....................................56
Page 11
x
LIST OF FIGUES – CONTINUED
Figure Page
15. High Performance Liquid Chromatography
Mass Spectrometry Analysis of BCM, PCM, and EPI..........................................57
16. Chemical Structures of Aureusimine A and B.......................................................58
17. Extracted Ion Chromatogram and UV absorbance for m/z 245 and m/z 229........59
18. Production of Aureusimine A and B under
Various Oxygen Tensions in Planktonic S. aureus Cultures.................................62
19. Production of Aureusimine A and B
Under Various Oxygen Tensions at Similar Phases of Planktonic Growth..........63
20. Time Lapse Microscopy of HFKs in Contact with BCM......................................80
21. F-Actin and β-Tubulin Structures in
BCM and PCM Treated HaCaT Keratinocytes.....................................................82
22. Prevention of BCM Induced Morphology by Taxol..............................................83
23. Nuclear Morphologies in
HFKs Treated with BCM or PCM.........................................................................84
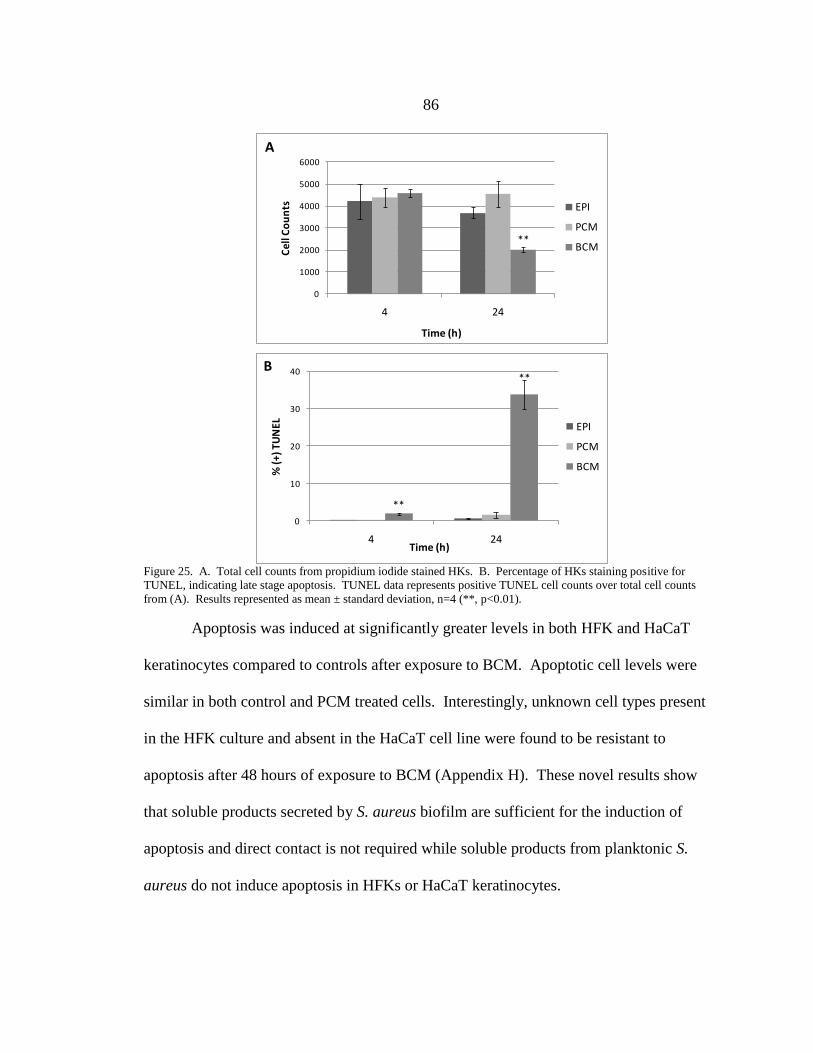
24. Percentage of HFKs Staining Positive for TUNEL...............................................85
25. Cell Counts and Percentage of HaCaT
Keratinocytes Staining Positive for TUNEL.........................................................86
26. Intracellular Calcium Levels in BCM and PCM Treated
HFKs Correlate with BCM Induced Morphology Changes..................................87
27. Intracellular Calcium Levels in
BCM and PCM Treated HaCaT Keratinocytes.....................................................88
28. Cytokine and Chemokine Production in Keratinocytes
after 24 Hours of Exposure to BCM or PCM.......................................................93
Page 12
xi
LIST OF FIGUES – CONTINUED
Figure Page
29. Cytokine and Chemokine Production in
Keratinocytes After 24 Hours of Exposure to BCM or
PCM, Normalized to pg/100,000 Non-Apoptotic Cells.........................................95
30. Mitogen Activated Protein Kinase Phosphorylation
in HaCaT Keratinocytes Exposed to PCM or BCM..............................................97
31. Mitogen Activated Protein Kinase Inhibition and
Cytokine Production in HaCaT Keratinocytes......................................................98
32. Mitogen Activated Protein Kinase Inhibition and
Impacts on HaCaT Morphology............................................................................99
33. CYP1A1 and CYP1B1 Expression in
HFKs Exposed to S. aureus Biofilm...................................................................101
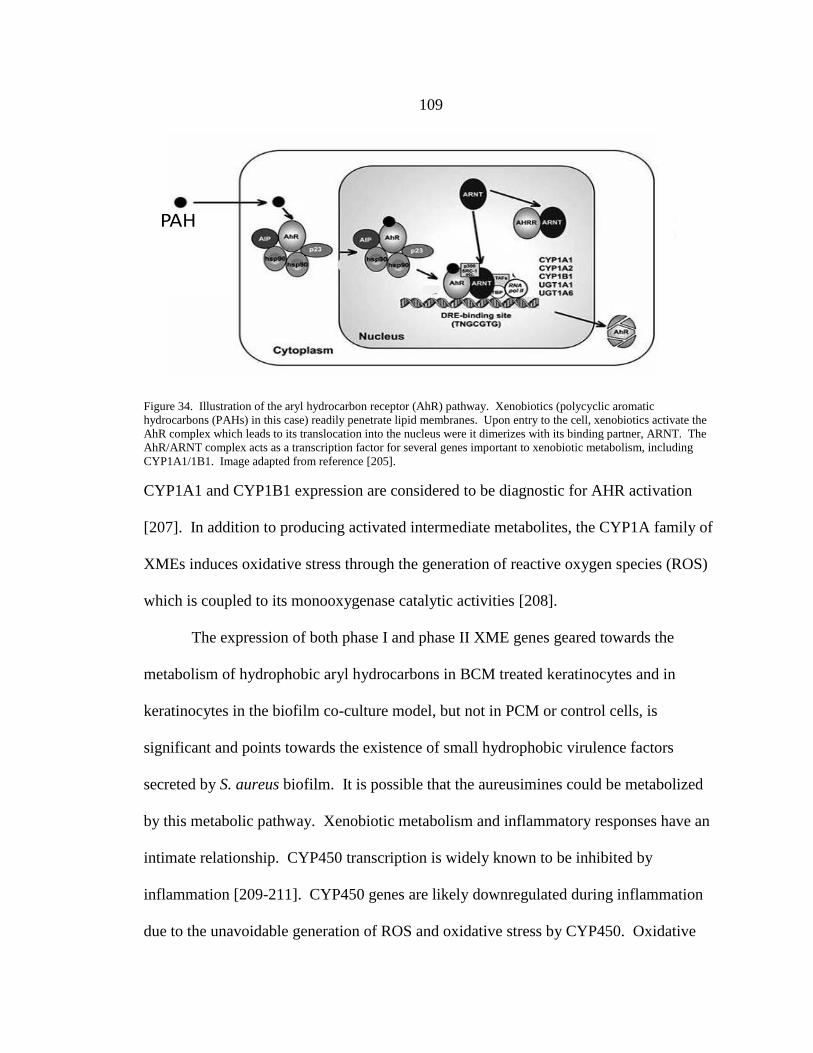
34. Illustration of the aryl hydrocarbon receptor (AhR) pathway.............................109
35. Overview of the Potential Mechanisms of Pathogenesis Induced
by Secreted Factors from either S. aureus Biofilm or Planktonic Cultures........115
Appdx 1. Morphology of Primary Human Fibroblasts Exposed to BCM......................155
Appdx 2. Apoptosis Induced by BCM in Human Foreskin Fibroblasts.........................155
Appdx 3. Genes Upregulated by BCM Relating to Cell Morphology............................159
Appdx 4. Expression of GEM Over 24 Hours of Exposure to BCM.............................160
Appdx 5. GEM Immunostaining.....................................................................................161
Appdx 6. Over Expression of GEM and Impacts on Cell Morphology..........................161
Appdx 7. Protein Kinase C Staining of BCM treated HFKs..........................................162
Appdx 8. shRNA Knockdown of GEM and Cell Morphology......................................163
Appdx 9. Peroxisome Depletion in BCM Treated HFKs...............................................165
Page 13
xii
LIST OF FIGUES – CONTINUED
Figure Page
Appdx 10. Lysosome Depletion in BCM Treated HFKs...............................................165
Appdx 11. Unknown Cell Type Resistant to BCM Induced Apoptosis.........................167
Appdx 12. Unknown Cell Type Morphologies...............................................................168
Appdx 13. Protein Kinase C Not Induced in Unknown Cell Types...............................169
Appdx 14. Re-population of Culture Wells by
Unknown Cell Types after Exposure to BCM..............................................170
Page 14
xiii
ABSTRACT
Chronic wounds are characterized by prolonged inflammation and failure to
epithelialize and do not respond well to conventional treatment. Bacterial biofilms are a
major impediment to wound healing. The effective treatment of chronic wounds requires
a better understanding of the relationship between bacterial biofilms and human skin.
Human keratinocytes are the most abundant cell type in the epidermis and play essential
roles in the inflammatory and epithelialization phases of wound repair. The aim of this
dissertation was to determine the effect of biofilm-conditioned medium (BCM) and
planktonic-conditioned medium (PCM) on inflammatory and epithelialization processes
in keratinocytes. The phylogeny of chronic wounds was characterized to select a model
pathogen. Staphylococcus aureus was found to be prevalent in chronic wounds. A novel
in vitro model was developed to facilitate host-pathogen investigations between S. aureus
biofilms and human keratinocytes. S. aureus BCM contained fermentation products and
metabolites that regulate virulence. After four hours of exposure to BCM, pro-
inflammatory genes were upregulated in keratinocytes relative to PCM. ELISA analysis
of cytokine production in BCM-treated keratinocytes confirmed that after four hours of
exposure, cytokine levels were higher relative to PCM-treated keratinocytes. However
after 24 hours of exposure, BCM stalled the production of cytokines, suppressed
activation of the mitogen activated protein kinases JNK and p38, and induced the release
of intracellular calcium in keratinocytes. Processes relating to epithelialization such as
the disruption of cytoskeletal components and induction of apoptosis were induced by
BCM in keratinocytes. BCM induced a distinct inflammatory response and inhibited
processes related to epithelialization. Collectively, the results provide insight into the
formation and persistence of chronic wounds. The use of biofilm-based models of
disease such as the in vitro model described herein will aid in the development of new
biofilm based treatment strategies, not only for chronic wound infections, but all biofilm-
based disease.
Page 15
1
CHAPTER 1
INTRODUCTION
Context
Bacterial biofilms are prevalent in nature and harbor unique properties relative to
their planktonic counterparts. Biofilms are associated with increased resistance to
antibiotics, radiation, osmotic shock, starvation, attack from other bacteria and fungi, and
immune responses in infectious environments. Bacterial biofilms are increasingly
accepted as a major barrier to healing in chronic wounds and several other diseases (i.e.
pneumonia associated with cystic fibrosis and periodontal disease). Despite this, the bulk
of the literature pertaining to in vitro models of bacterial infection focus primarily on the
planktonic characteristics of bacteria. Models used to define the response of mammalian
cell cultures to planktonic bacteria do not accurately reflect the nature of bacteria in a
biofilm. Effective treatment of chronic wounds requires an understanding of the
interactions between bacterial biofilms and host cells. The impacts of bacterial biofilms
on the inflammatory and epithelialization phases of wound healing have not been well
established in human skin. The impact of bacterial biofilms on wound healing processes
in host cells could have implications for the pathogenesis of disease and the persistency
of chronic infections.
Page 16
2
Objectives
The overarching question addressed in this dissertation was as follows: Does
biofilm-conditioned medium (BCM) impact wound-healing processes including
inflammation and epithelialization in human skin?
The first objective was to select a model host and pathogen for use in an in vitro
model of biofilm disease. Human keratinocytes were selected as a model host since they
are involved in the inflammatory and epithelialization phases of wound-healing.
Phylogenetic characterization of chronic wound micro-communities was used to identify
bacterial species which were prevalent in chronic wounds. Both culture and molecular-
based methodologies were employed in the investigation of microbial communities
present in chronic wounds. The results revealed that Staphylococcus aureus was
prevalent in these infections and was therefore selected as a model pathogen.
The second objective was to characterize S. aureus BCM. Conditioned medium
from S. aureus biofilm and planktonic cultures was analyzed using metabolite profiling.
S. aureus biofilms grown in ambient oxygen concentrations produced mixed-acid
fermentation products indicating the presence of an anoxic niche within the biofilm. S.
aureus biofilm also produced the virulence factors aureusimine A and B in greater
quantities than planktonic cultures.
The final objective was to investigate the impact of S. aureus BCM on
inflammation and epithelialization in human keratinocytes. S. aureus BCM induced
sustained low-level inflammation, perhaps contributing to the persistent nature of
biofilm-infected wounds. S. aureus BCM induced cytoskeletal rearrangements and
Page 17
3
apoptosis in keratinocytes. The morphological changes in addition to the induction of
apoptosis would likely inhibit wound epithelialization and lead to the advancement of the
wound front. The in vitro biofilm model could be expanded to include different
pathogens and mammalian cells to study other biofilm-based disease. Knowledge of
biofilm pathogenesis could lead to new therapeutic and preventative strategies for
biofilm-based diseases such as chronic wounds.
Page 18
4
CHAPTER 2
BACKGROUND
Literature Reviewed
Biology and Immunology of Acute Wound Healing
An acute wound includes wounds such as burns, traumatic injuries, and surgically
created wounds that heal in a timely fashion. The process of wound healing is an
overlapping progression of events were certain factors are released in a predictable
manner, triggering the three main phases of wound repair: inflammation,
epithelialization (formation of neo-epidermis and granulation tissue), and tissue
remodeling. For excellent reviews on wound healing, see [1, 2]. The three phases of
wound healing are dynamic processes involving the secretion of soluble mediators by
several cell types, degradation and formation of the extracellular matrix, and expansion of
appropriate cell types, and loosely follows a temporal organization scheme.
When tissue is injured, blood vessels are disrupted leading to the extravasation of
blood constituents. The resulting coagulation of blood constituents and the aggregation
of platelets lead to the formation of a fibrin rich clot and swift initiation of the
inflammatory phase of wound repair. Keratinocytes are important mediators of this
initial inflammatory response since they are often the first cell type to experience injury
and encounter microorganisms. The fibrin rich clot serves multiple purposes including:
plugging severed blood vessels, filling any discontinuity in the wounded area, and
providing a provisional matrix for cell migration [2]. Factors released by damaged tissue
Page 19
5
and platelets in the clot recruit inflammatory leukocytes to the site of injury [3].
Infiltrating neutrophils and monocytes remove foreign particles and invading
microorganisms from the damaged area and secrete important factors required for the
progression of the wound repair process. If the wounded area is not substantially
contaminated, the infiltrating neutrophil population becomes senescent after a few days
and are destroyed by tissue macrophages [4]. If there are a substantial number of
microorganisms present in the wound, a stronger inflammatory response is mounted
resulting in the infiltration of many more neutrophils and other immune cells. If the
body’s immune system is overrun by an aggressive acute bacterial infection that reaches
the circulatory system, septic shock and death are likely within hours. In a low bioburden
wound, even after the resolution of invading neutrophils, monocytes continue to
accumulate in the wounded tissue. Once in the affected area, infiltrating monocytes
adhere to the extracellular matrix which induces them to differentiate into inflammatory
or reparative macrophages [5]. Inflammatory and reparative macrophages function to
debride damaged tissue, clear any remaining or newly contaminating pathogens, and
digest apoptotic neutrophils [6]. The accumulation of macrophages in damaged tissue
signals a transition from the inflammatory phase, (which lasts roughly 48 hours), to the
tissue formation, or epithelialization, phase of wound repair.
The process of reestablishing a cutaneous cover begins within 2-10 days after
injury, depending upon the severity of the wound. This stage of wound repair is
characterized by the proliferation and migration of several cell types in the wounded area.
The migration of keratinocytes into the wound bed is one of the first processes in this
Page 20
6
stage. Migrating keratinocytes are basal in nature as they do not contain keratin or other
matrix proteins. In contrast to basal keratinocytes, migrating keratinocytes express the
integrins fibronectin and vitronectin, and collagen receptors which enable the migrating
keratinocyte to crawl over the wound matrix and underlying dermis [1]. The formation
of granulation tissue is a key process during this phase of wound healing. The formation
of new vasculature in the wounded area through a process known as angiogenesis is
essential in maintaining granulation tissue. Mature granulation tissue derives its name
from the appearance of numerous newly formed capillaries in the new tissue. Fibroblasts
contribute to the formation of granulation tissue when they are stimulated to proliferate
and migrate into the wound and replace the fibrin rich clot with a collagen rich matrix
[7]. Granulation tissue primarily consists of macrophages, fibroblasts, and connective
tissue and provides new substrate for migrating keratinocytes [8]. Keratinocytes at the
leading edge of migrating epithelium produce increased levels of various members of the
matrix metalloproteinase (MMP) family which act to cleave the basal lamina, allowing
keratinocytes to detach from the basal lamina and migrate [9]. After a monolayer of
keratinocytes has been established over the wound surface, the formation of a new
stratified epidermis is reestablished from the margins of the wound inward [10].
The third phase of wound repair, tissue remodeling, occurs in concert with tissue
formation. The remodeling of the extracellular matrix, cell maturation, and apoptosis are
involved in this phase of wound repair. Remodeling of the extracellular matrix and the
maturation of newly formed epidermal tissue has been shown to occur at the same time
granulation tissue is still invading the wound space in wounds larger than a small scratch
Page 21
7
[11]. After the wounded area is covered with neoepidermis, fibroblasts differentiate into
myofibroblasts and act to contract the wound [12]. Roughly 2-3 weeks after wounding,
endothelial cells, fibroblasts, and macrophages remaining in the granulation tissue
undergo apoptosis or exit the wound leaving predominantly acellular, collagen rich scar
tissue. The collagen rich matrix undergoes remodeling over several months as type III
collagen is replaced by type I collagen strengthening the scar tissue [13]. An overview of
the major processes that occur and cell types involved in the three phases of wound
healing is provided in Figure 1.
Figure 1. The overlapping progression of the three main phases of wound healing. Major events are shown along with
the cell types mediating those events. Image adapted from Li, et al [14].
Inhibition of Healing in Chronic Wounds
There are three main types of chronic wounds: diabetic foot ulcers, venous leg
ulcers, and pressure ulcers (DFUs, PFUs, and PUs). Underlying medical conditions
(diabetes, pulmonary disease, etc.) and the location of the wound characterize which of
Page 22
8
the three categories a non-healing wound falls into. Disruption of any of the phases
involved in wound healing may lead to any of the three types of chronic wounds [14].
Bacterial contamination of damaged skin is unavoidable under normal circumstances.
Microorganisms and foreign objects are destroyed in the inflammatory phase of acute
wound healing and the progression of the healing process continues. However, wounds
exposed to constant, abnormally high loads of bacteria, or people with compromised
immune systems or underlying diseases that predispose them to bacterial infection or
chronic inflammation, are susceptible to altered phases of wound healing. Acute wounds
go through the three overlapping phases of healing in an orderly fashion while chronic
wounds do not progress in an orderly process.
Some areas of chronic wounds are found in different phases of wound healing
which leads to the loss of the necessary synchrony of events that lead to normal healing
[15]. Chronic wounds have been described as being predominantly stuck in the
inflammatory phase of wound healing. The production of several cytokines in
chronically inflamed tissues recruit activated immune and inflammatory cells to the site
of infection, were they amplify and perpetuate the inflammatory state. Conditions that
lead to the failure of the wound healing process to exit the inflammatory phase include a
layer of necrotic tissue encapsulating the wound, heavy bacterial burden, and/or high
levels of foreign material that is resistant to phagocytosis or solublization during an acute
inflammatory response [14].
If planktonic bacteria attach to an exposed surface like a traumatic wound and are
not cleared immediately by the host immune system, they can form a microcolony which
Page 23
9
then progresses to a biofilm. Early microcolonies evade opsonization as host antibodies
do not recognize them [16]. Neutrophils and polymorphonuclear leukocytes nestle
themselves into the biofilms extracellular matrix and become ineffective at killing
bacteria in the biofilm [17-21].
Elevated neutrophil levels are observed in chronic wound infections leading to
pathologic inflammation [22, 23]. Normal acute wound healing is characterized by a
rapid influx of neutrophils followed by monocytes that mature into inflammatory
macrophages, both components of the innate immune response. Resolution of
inflammation can only occur if the neutrophils are eliminated from the affected area.
Many inflammatory cytokines present in chronic wounds are capable of prolonging
neutrophil survival by inhibiting spontaneous neutrophil apoptosis [24, 25].
High levels of proteolytic activity have been observed in chronic wound fluid.
Inappropriate protease production (MMPs) may contribute to the inability of some
chronic wounds to heal through the ill timed degradation of molecules in the extracellular
matrix [26-28]. MMPs also regulate the release, activation, and silencing of growth
factors, modify cell surface receptors, and regulate apoptosis and inflammation [29].
Chronic wounds contain keratinocytes with altered phenotypes [30].
Keratinocytes on the edge of chronic wounds do not migrate properly leading to the
failure of the second phase of wound healing [31, 32]. The failure of keratinocytes to
migrate properly at the wounds edge may lead to apoptosis in response to inappropriate
matrix contact [33].
Page 24
10
Bacterial Biofilm and
Biofilm Infection of Chronic Wounds
The prolonged inflammation and failure of the epithelialization process in
addition to a heavy microbial burden are common characteristics of chronic wounds.
Microbial infection has been implicated in disrupting wound healing processes and
microbes have been studied in the laboratory since they were described as the causative
agents of infectious disease. Historically, bacteria grown suspended in liquid medium in
the laboratory have been assumed to have similar properties to bacteria that cause
infectious disease such as wound infections. Research over the past two decades has
revealed that, in many environments, bacteria exist as a complex, multi-species surface
associated community termed biofilm. Bacteria within these communities secrete an
extracellular polymer matrix, form complex structures, and are phenotypically distinct
from their planktonic counterparts [34, 35]. Bacteria within biofilm communities are
orders of magnitude more resistant to antibiotics and biocides than planktonic bacteria
[36]. Additionally, it has been documented that bacterial genes involved in biofilm
formation are controlled by regulatory systems that also control the expression of
virulence factors [37, 38].
It has been speculated for many years that bacteria colonizing chronic wounds
exist as biofilm. The wound bed offers an ideal environment for bacteria to form a
biofilm due to their susceptibility to contamination, the availability of nutrients, and an
ideal surface for attachment. Chronic wound infections are persistent and are not cleared
by the host’s immune system and are resistance to traditional treatment strategies
including systemic and topical antimicrobial agents [39]. Removal of the biofilm by
Page 25
11
frequent debridement is one of the most clinically effective treatments to help heal
chronic wounds [40]. James, et al recently showed that biofilms were prevalent in
chronic wounds and rare in acute wounds, but the role biofilms play in preventing wound
healing and mechanisms involved have yet to be determined [41].
Healthy human skin is colonized by large numbers of microorganisms classified
as either the resident or transient microflora. The resident skin microflora includes
coagulase-negative staphylococci (e.g., Staphylococcus epidermidis, Staphylococcus
hemolyticus, Staphylococcus hominis) which are found in proportionally constant
numbers in healthy human skin [42]. Organisms constituting the transient skin
microflora temporarily colonize the surface of the skin due to contact with external
sources and disrupt the homeostasis of the resident microflora. The prevalence of S.
aureus skin colonization in the healthy human population is approximately 32% and is
not considered a member of the resident skin microflora [43]. S. aureus infection of the
skin initiates or induces persistence of many inflammatory skin disorders including atopic
dermatitis and other chronic infections.
S. aureus is known to produce a wide range of virulence factors including
hemotoxins, pore forming toxins, peptidoglycan (PG), lipoteichoic acid (LTA), and
superantigens (e.g. toxic shock syndrome toxin-1, Staphylococcal enterotoxin). The
impact of biofilm formation on virulence is controversial. Virulence factor gene
expression in S. aureus cells within a biofilm have been shown to be downregulated
when compared to planktonic S. aureus cultures [35]. Another study showed that biofilm
formation had no effect on S. aureus virulence factor production [44], while several
Page 26
12
studies highlight the necessity of regulatory elements associated with biofilm formation
on the regulation of virulence [45, 46]. The role of biofilms in various infectious skin
diseases is an area of active research leading to new insights in host/pathogen
relationships.
Few studies have investigated the effects of bacterial biofilms on mammalian
cells and those that have focus primarily on the well established biofilm infection
associated with periodontal disease [47, 48]. Most studies investigating interactions
between bacteria and cultured mammalian cells involve either direct contact with washed
planktonic bacteria or the application of known or unknown soluble products from
overnight cultures grown with constant agitation [49-55]. S. aureus was selected as a
model organism for this research because it is an important human pathogen implicated
in several infectious diseases including chronic skin infections [56-58].
Epidermal Keratinocytes and Their Functions in Immunity
Keratinocytes are by far the most abundant cell type in the epidermis. The view of
the role keratinocytes play in cutaneous infection has changed drastically in the past two
decades from a passive target of infection, to an active participant in the immune
response to bacterial infection. A primary function of the epidermis is to act as a barrier
to the environment and infectious organisms. The predominant mechanism in which
keratinocytes function in innate immunity is through the recognition of conserved
pathogen associated molecular patterns (PAMPs) which include bacterial cell wall
components, bacterial DNA, flagella, PG, LTA, and other conserved prokaryotic
structures [59]. PAMPs are recognized by cell surface receptors called toll like receptors
Page 27
13
(TLRs) which are found on a variety of cell types including professional immune cells,
endothelial cells, and cells of the epidermis. Human keratinocytes are constantly exposed
to bacterial stimuli and express functional TLRs making them the first line of defense
against pathogens in the skin [60]. In response to PAMPs, the keratinocyte is capable of
producing immunomodulatory molecules including lipid-derived mediators of
inflammation and protein cytokines [61]. Activation of TLR signaling by PAMPs
ultimately results in the production of various cytokines which mediate various aspects of
an inflammatory response (see cytokine biology section below) [59, 62].
Keratinocytes also express major histocompatibility complex (MHC) class II
molecules in response to various pro-inflammatory and immune stimulation signals and
thus play a role in adaptive immunity [63]. Activated keratinocytes expressing MHC II
molecules produce increased amounts of cytokines in response to various Staphylococci
superantigens [64]. Cytokine production by epidermal keratinocytes is initiated by
various external signals which activate various intracellular pathways and is an important
initial step in a normal immune response and in pathogenesis.
Cytokine Biology
Cytokines encompass a large and diverse family of small secreted proteins which
mediate and regulate immunity and inflammation. Interleukins (IL) and chemokines are
part of this family. Cytokines are capable of inducing their biological effects at very low
concentrations (pg/ml to ng/ml) and act by binding specific cell surface receptors.
Activation of cell surface receptors in turn activate second messengers which regulate
Page 28
14
gene expression and cellular functions. Some cytokines act as primary cytokines, a
cytokine that stimulates target cells to produce additional cytokines.
Tumor necrosis factor alpha (TNF-α) is a primary cytokine capable of inducing
apoptosis in many cell types including keratinocytes [65], but this effect is often negated
by the simultaneous induction of other pro-survival pathways activated in response to
inflammation [66, 67]. TNF-α production by keratinocytes leads to the expression of
adhesion molecules in endothelial cells and chemokine production in various epidermal
and dermal cell types [68]. These changes lead to the attachment, diapedesis, and
chemotaxis of immune cells into the affected area. The presence of additional
inflammatory cells leads to the secretion of additional cytokines forming a positive
feedback loop resulting in further TNF-α production and modulation of production of
other cytokines [69].
Interleukin-1β (IL-1β) is a multifunctional primary cytokine that plays a role in
both acute and chronic inflammation and is produced primarily by monocytes,
macrophages, and polymorphonuclear phagocytes [70]. Other cell types known to
produce IL-1β include fibroblasts, B cells, osteocytes, epithelial cells, and keratinocytes
[71]. IL-1β affects nearly all cell types in the human body [72]. IL-1β is also known to
affect the production of inflammatory molecules such as prostaglandins, leukotrienes, and
cytokines and affects diverse innate immune processes [73]. IL-1β functions in a variety
of activities such as immune cell recruitment, cell proliferation, tissue destruction, bone
resorption, vascular smooth muscle cell contraction, blood pressure, and central nervous
cell functions [74]. With such diverse roles, IL-1β has been described as a master or key
Page 29
15
cytokine in many chronic diseases ranging from Alzheimer's disease [75], rheumatoid
arthritis [76], periodontitis [77], and diabetes [78].
IL-6 was initially discovered through studies looking into mechanisms of B-cell
terminal differentiation [79]. It was quickly realized that IL-6 possessed several
additional biological activities beyond the activation of B-cells. IL-6 is capable of
stimulating hepatocytes during inflammatory responses leading to systemic changes in
acute phase serum protein compositions [80]. IL-6 is produced by T-cells, macrophages,
fibroblasts, synovial cells, endothelial cells, glia cells, and keratinocytes in response to a
variety of stimuli including cytokines such as TNF-α and IL-1β, and bacterial products
[81]. IL-6 is overproduced in a variety of autoimmune and chronic inflammatory
diseases such as rheumatoid arthritis, cardiac myxoma, psoriasis, and chronic
inflammatory proliferative diseases [82].
CXC ligand-8 (CXCL-8, also known as IL-8) and other CXCL family members
are potent chemo-attractants for neutrophils and are thus members of the chemokine
family (CXC refers to the conserved cysteine “X” cysteine motif in this family were “X”
represents any amino acid). Neutrophil infiltration is a hallmark of acute inflammation
[83] while the inappropriate accumulation of neutrophils in inflamed tissue is a hallmark
of chronic inflammation [22, 23]. CXCL family members preferentially bind the receptor
CXCR2 (IL-8Rβ). Ligand binding and activation of CXCR2 in neutrophils has been
shown to inhibit spontaneous neutrophil apoptosis leading to their accumulation in
inflamed tissues [25]. Several cell types produce CXCL-8 including monocytes, T-cells,
neutrophils, vascular endothelial cells, dermal fibroblasts, hepatocytes, human gastric
Page 30
16
cancer cells, and keratinocytes [83]. During normal healing processes in healthy wounded
tissue, CXCL-8 and other CXCL family members recruit neutrophils to a wounded area
were angiogenesis is stimulated concomitantly with neutrophil recruitment resulting in
the formation of granulation tissue [84].
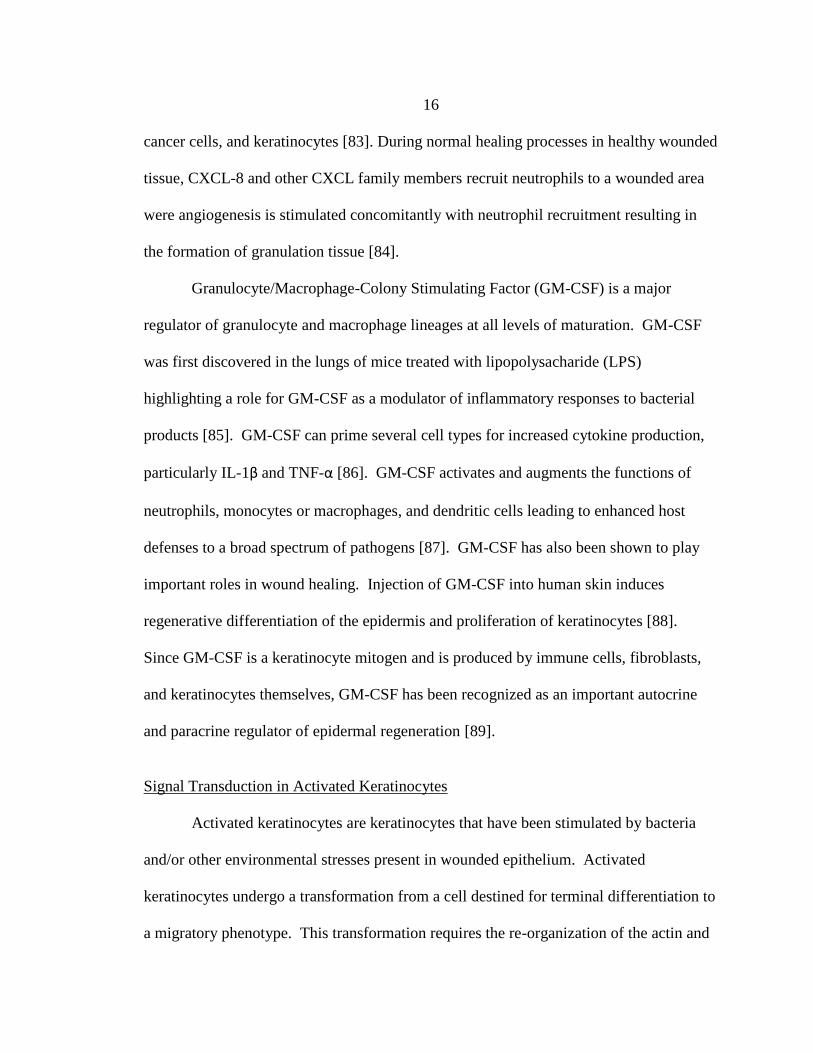
Granulocyte/Macrophage-Colony Stimulating Factor (GM-CSF) is a major
regulator of granulocyte and macrophage lineages at all levels of maturation. GM-CSF
was first discovered in the lungs of mice treated with lipopolysacharide (LPS)
highlighting a role for GM-CSF as a modulator of inflammatory responses to bacterial
products [85]. GM-CSF can prime several cell types for increased cytokine production,
particularly IL-1β and TNF-α [86]. GM-CSF activates and augments the functions of
neutrophils, monocytes or macrophages, and dendritic cells leading to enhanced host
defenses to a broad spectrum of pathogens [87]. GM-CSF has also been shown to play
important roles in wound healing. Injection of GM-CSF into human skin induces
regenerative differentiation of the epidermis and proliferation of keratinocytes [88].
Since GM-CSF is a keratinocyte mitogen and is produced by immune cells, fibroblasts,
and keratinocytes themselves, GM-CSF has been recognized as an important autocrine
and paracrine regulator of epidermal regeneration [89].
Signal Transduction in Activated Keratinocytes
Activated keratinocytes are keratinocytes that have been stimulated by bacteria
and/or other environmental stresses present in wounded epithelium. Activated
keratinocytes undergo a transformation from a cell destined for terminal differentiation to
a migratory phenotype. This transformation requires the re-organization of the actin and
Page 31
17
tubulin cytoskeleton to produce lamellipodia and filopodia. Activated keratinocytes also
secrete inflammatory mediators such as cytokines initiating the inflammatory phase of
wound repair while gearing up for the epithelialization phase.
Mitogen Activated Protein Kinases. Keratinocytes express functional TLRs
which function in immunity by recognizing PAMPs. TLRs are prominent in the
activation of mitogen activated protein kinase (MAPK) cascades [90]. MAPKs are a
family of serine/threonine protein kinases found in all eukaryotic organisms which
participate in signal transduction pathways with diverse physiological outcomes. All
MAPKs include a central signaling theme which involves the activation of three tiers of
core molecules: MAPK kinase kinases (MAPKKK), MAPK kinases (MAPKK), and
MAPKs (Figure 2). MAPK cascades are activated by concurrent phosphorylation of
tyrosine and threonine residues in the conserved activation loop of the kinase domain
[91]. Deactivation of MAPK signaling is mediated primarily through dephosphorylation
by dual specificity protein phosphatases (DUSPs) [92]. In mammals, MAPK cascades
can be activated by a wide range of stimuli involving diverse receptor families. These
receptor families include hormone and growth factor receptors acting through receptor
tyrosine kinases (e.g. epidermal growth factor receptor), cytokine receptors acting
through G protein-coupled seven-transmembrane receptors, and inflammatory cytokines
of the TNF family [93].
MAPKs are intimately involved with fundamental biological processes such as
embryonic development, innate and acquired immunity, cell differentiation, cell
proliferation, and cell death [94]. MAPKs are major components of pathways regulating
Page 32
18
the pathology of chronic inflammation [93] and mediate cellular responses essential to
wound healing. MAPKs transduce signals relating to apoptosis [95-97], cytoskeletal
rearrangements essential to the migration of keratinocytes [98, 99], keratinocyte
differentiation [100], secretion of antimicrobial peptides [101], and responses to
mechanical and osmotic stress [102, 103].
The stress-activated protein kinase/c-JUN NH2-terminal kinase (JNK) and p38
MAPK are the major MAPK pathways activated by inflammatory cytokines and
environmental stress [104]. The extracellular signal-regulated kinase 1 and 2 (ERK)
MAPKs play roles in activities such as cell migration and mitosis and are also recruited
in response to stress and inflammation [94].
MAPKKKInactive
MAPKKKActive
MAPKKInactive
MAPKKActive
MAPKInactive
MAPKActive
P
P
P
Activation in Response to Ligands
Activation of Transcription Factors (NFkB, AP-1, Others)
Cytosol
Nucleus
Initiate biological response to stimuli
DUSP Phosphatases
Figure 2. Generalized scheme of MAPK signaling. Diverse inputs such as cytokines, growth factors, and
environmental stress lead to the activation of MAPK signaling. An extracellular stimulus leads to the phosphorylation
of MAPKKKs which in turn phosphorylated MAPKKs, which activate MAPK proteins. Activated MAPKs regulate
the activity of transcription factors resulting in a specific biological response to extracellular stimuli. Dual specificity
protein phosphatases (DUSPs) de-activate MAPK signaling by dephosphorylating activated MAPKs. Activation of
specific MAPKs (JNK, p38, and ERK) is described in the text.
Page 33
19
JNK was first identified after exposing cells to stressful treatments such as
exposure to ionization, osmotic shock, heat shock, mechanical shear, and protein
synthesis inhibitors [105-107]. JNK has been shown to be activated by the inflammatory
cytokines TNF-α and IL-1β which leads to the activation of the transcription factor c-
JUN which activates genes associated with apoptosis, proliferation, and inflammation in
response to cytokines, growth factors, chemical carcinogens, and bacterial infection (see
transcription factor section below) [108, 109].
Evidence for a role of JNK in wound healing is conflicting with one study finding
that JNK is not activated during wound healing in corneal epithelial cells [99] while other
studies suggest that JNK is essential for normal wound healing to progress [110, 111].
These discrepancies are likely attributed to extracellular stimuli unique to different
wound types, bacterial burden, and cell type.
The p38 MAPK is a 38-kDa polypeptide that is activated in response to stress
such as endotoxin treatment and osmotic shock [112]. p38 is the target for two classes of
anti-inflammatory drugs: pyridinyl-imidazole anti-inflammatory drugs and cytokine-
suppressive anti-inflammatory drugs which block p38 dependent activation of AP-1
[113]. The p38 MAPK is activated by inflammatory cytokines and in most cases, the
same stimuli that activates JNK also activates p38 [106]. A role in cell proliferation and
migration in wound healing has been described for p38 in concert with ERK [99].
ERK1/2 are ~42 kDa MAPKs that are ubiquitously expressed in all tissues and
are not considered to be stress related kinases like JNK and p38. ERK has been
implicated in wound healing through the action of growth factors and acts to coordinate
Page 34
20
the migration of groups of cells [114]. One study found that ERK was inactivated when
migrating epithelial sheets meet at closing edges of wounds, but remained active at the
open edges [98].
Collectively, JNK and p38 MAPK pathways are important mediators of cellular
activities in response to stress, growth arrest, and apoptosis while the ERK cascade is a
critical pathway for mitogenesis and differentiation [115-117]. However, ERK is also
involved in pro-inflammatory responses [118]. The activation of NFkB and AP-1 is
mediated by MAPK signaling and activation of these transcription factors by MAPK is
known to lead to the production of TNF-α, IL-1β, IL-6, CXCL-8, CXCL-1, and GM-CSF
[50, 119, 120].
Transcription Factors. Transcription factors are regulatory proteins that mediate
changes in genes expression in response to extracellular stimuli. Activation of c-JUN by
cell surface receptors linked to MAPK cascades is an example. c-JUN is a member of the
activator protein-1 (AP-1) family of transcription factors which also includes Fos and
activating transcription factor (ATF) family members. The AP-1 transcriptional complex
consists of dimers of various combinations of Jun, Fos, and ATF proteins. AP-1
transcription factors are some of the most well studied transcription factors relating to
wound healing activities in human keratinocytes [121]. AP-1 transcription factors
regulate a variety of extracellular stimuli including apoptosis, proliferation, and
inflammation in response to cytokines, growth factors, chemical carcinogens, and
bacterial infection [108, 109]. AP-1 family members are regulated at the transcript level
and act as early response genes which are rapidly transcribed in response to extracellular
Page 35
21
stimuli [122]. Post-transcriptional modification through MAPK dependent
phosphorylation of AP-1 transcription factors alters their DNA binding affinity leading to
activation of target genes, namely cytokines and chemokines [123].
In addition to AP-1 activation, MAPKs activate the transcription factor Nuclear
Factor-Kappa B (NFkB) [124-126]. NFkB regulates the expression of many genes
involved in immune and inflammatory responses and often acts in synergy with AP-1 to
mediate inflammatory responses [127, 128]. NFkB usually consists as a heterodimer
consisting of the p65 (RelA) and p50 subunits [129]. In resting cells NFkB is sequestered
in the cytosol by regulatory IkB proteins which prevent NFkB from entering the nucleus
and activating target genes [130].
Stimulation of resting cells by cytokines, UV radiation, and bacterial products
activates various kinase cascades which include MAPKs, resulting in the phosphorylation
of IkB [131-133]. Phosphorylation of IkB causes a transformational change dissociating
IkB from NFkB. Liberation of NFkB allows translocation to the nucleus were NFkB
binds promoter regions of target genes. NFkB is also negatively by NFkBIA, a gene
which encodes the protein IκBα. IκBα enters the nucleus and actively removes NFkB
from DNA causing NFkB to be translocated back to the cytoplasm [134]. TNFAIP3
(A20). TNF-α induced protein (TNFAIP3 (A20)) is a transcription factor that also
negatively regulates NFkB and protects cells from TNF-α induced apoptosis [135].
TNFAIP3 has been shown to regulate TLR2/4 mediated inflammation through inhibition
of the NFκB pathway [136].
Page 36
22
In wound healing, NFkB has been shown to be essential for the upregulation of
MMPs and inflammatory cytokines required for normal wound healing [137, 138].
NFkB plays a protective role in cells stimulated by an inflammatory environment to
produce pro-apoptotic signals by preventing apoptotic programs and stimulating pro-
survival pathways [139].
Intracellular Calcium Release. The activation of keratinocytes is accompanied by
an increase in intracellular calcium. Changes in cell morphology are initiated for
keratinocyte migration which requires the release of internal calcium stores in addition to
MAPK signaling cascades [140, 141]. The release of intracellular calcium is also
required for cytoskeletal rearrangements that occur when activated keratinocytes return to
their terminal differentiation program [142].
Inflammatory responses are also mediated by intracellular calcium. MAPK
cascades and AP-1 activation are accompanied by an increase in intracellular calcium
[121]. Activated keratinocytes expressing MHC II molecules signal through intracellular
calcium dependent mechanisms often involving protein kinases A and C (PKA, PKC)
[143, 144]. Release of intracellular calcium stores also occurs when keratinocytes are
exposed to S. aureus superantigens [145]. Activation of these pathways can result in the
production of cytokines and an inflammatory response through tyrosine kinase dependent
mechanisms or induce cell death through PKC dependent mechanisms [146].
Page 37
23
Physiology of Wounded Human Skin
One of the most influential factors relating to the physiology of both normal and
infected skin is pH. The pH of the wound bed is both directly and indirectly associated
with all aspects of healing, and inappropriate changes in pH inhibit the body’s natural
healing processes by interfering with every phase of wound healing. Human
keratinocytes have been shown to produce high amounts of lactate both in vivo and in
vitro contributing to the acidic nature of the skin [147]. This is thought to serve as a
protective mechanism against invading pathogens. Chronic wounds have an alkaline pH
ranging from pH 7.15-8.9, while normal healing wounds have a neutral pH witch
acidifies to pH 5.5-6.0 as healing progresses [148]. Additionally, destructive bacterial
proteases common in chronic wound infections have optimal catalytic activity in an
alkaline environment [149].
Another important factor impacting the physiology of infected skin is the
availability of oxygen. Oxygen concentration is an important parameter used to guide
treatment of chronic wounds [150]. In wounds, oxygen levels affect the activity of
antimicrobials, the oxidative killing of phagocytes, and the viability and population
structure of microbes [151]. Chronic wounds are generally viewed as hypoxic and are
routinely treated through intermittent hyperbaric oxygenation (HBO) of infected tissue
which has proven successful in enhancing wound healing [152, 153]. HBO enhances
wound healing by increasing the partial pressure of oxygen in the blood, attenuating
keratinocyte apoptosis, and in many cases, reducing inflammation [154].
Page 38
24
Bacterial biofilms contain both aerobic and anaerobic niches induced by differing
oxygen and nutrient profiles. Anaerobic metabolism due to an anoxic niche in the core of
bacterial biofilms has been described for many bacterial species, including S. aureus
[155-157]. The oxidative state of biofilms has been shown to influence biofilm
formation, biofilm persistence, and virulence factor production [158-160]. Wounds
contain both anaerobic and facultative aerobic organisms, including S. aureus [41, 56].
Facultative anaerobes are capable of both aerobic and anaerobic respiration as well as
fermentation.
Consumption of oxygen by host tissues and bacterial biofilms could quickly
generate an anoxic environment in chronic wounds. An increase in fermentation
products due to anaerobic metabolism in chronic wounds may contribute to the delayed
healing and persistence of infection.
Page 39
25
CHAPTER 3
PHYLOGENETIC CHARACTERIZATION OF CHRONIC WOUND BIOFILM
MICRO-COMMUNITIES
Introduction
Culture based methodologies are routinely utilized by most clinical laboratories
for the identification and quantification of microorganisms. Culture based identification
of clinical samples biases results towards microorganisms that thrive under the synthetic
conditions found in laboratory settings. This leads to the under-representation of
important members of micro-communities. Using molecular techniques such as
denaturing gradient gel electrophoresis (DGGE) and sequencing of 16S ribosomal genes,
the composition of bacterial populations in the three major chronic wound types (DFUs,
PFUs, PUs) were characterized. DGGE separates polymerase chain reaction (PCR)
generated 16S ribosomal gene fragments (16S rDNA) based on sequence rather than
molecular weight. Theoretically, each band present in a DGGE gel represents a single
prokaryotic genus found within the wound micro-community. Bacterial community
diversity (i.e. number of different genera) can be estimated from the number of bands
present in each sample. To aid in the estimation of bacterial diversity in chronic wounds,
culture data were collected from chronic wound debridement samples and compared to
DGGE banding patterns for each wound analyzed. DNA extracted from pooled patient
populations with the same type of chronic ulcer were also analyzed by DGGE,
pyrosequencing of 16S rDNA, and full ribosomal shotgun sequencing of 16 S rDNA.
Page 40
26
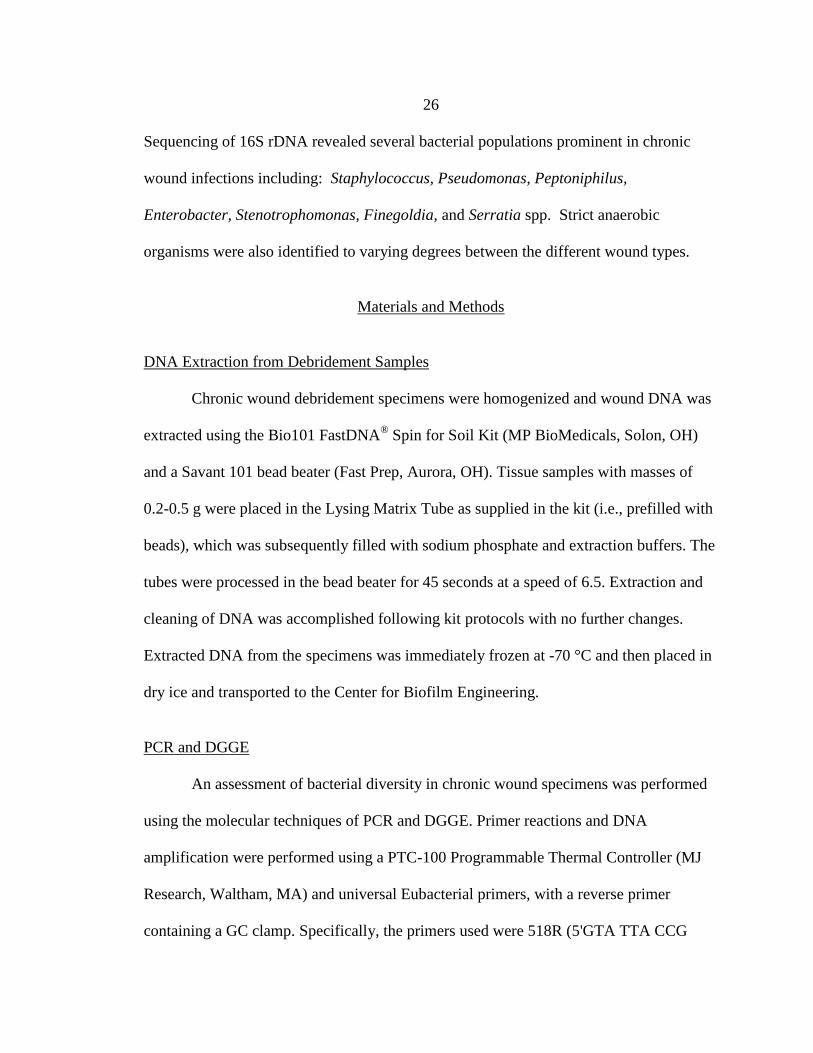
Sequencing of 16S rDNA revealed several bacterial populations prominent in chronic
wound infections including: Staphylococcus, Pseudomonas, Peptoniphilus,
Enterobacter, Stenotrophomonas, Finegoldia, and Serratia spp. Strict anaerobic
organisms were also identified to varying degrees between the different wound types.
Materials and Methods
DNA Extraction from Debridement Samples
Chronic wound debridement specimens were homogenized and wound DNA was
extracted using the Bio101 FastDNA® Spin for Soil Kit (MP BioMedicals, Solon, OH)
and a Savant 101 bead beater (Fast Prep, Aurora, OH). Tissue samples with masses of
0.2-0.5 g were placed in the Lysing Matrix Tube as supplied in the kit (i.e., prefilled with
beads), which was subsequently filled with sodium phosphate and extraction buffers. The
tubes were processed in the bead beater for 45 seconds at a speed of 6.5. Extraction and
cleaning of DNA was accomplished following kit protocols with no further changes.
Extracted DNA from the specimens was immediately frozen at -70 °C and then placed in
dry ice and transported to the Center for Biofilm Engineering.
PCR and DGGE
An assessment of bacterial diversity in chronic wound specimens was performed
using the molecular techniques of PCR and DGGE. Primer reactions and DNA
amplification were performed using a PTC-100 Programmable Thermal Controller (MJ
Research, Waltham, MA) and universal Eubacterial primers, with a reverse primer
containing a GC clamp. Specifically, the primers used were 518R (5'GTA TTA CCG
Page 41
27
CGG CTG CTG G 3') and 357F (5' CGC CCG CCG CGC CCC GCG CCC GGC CCG
CCGC CCC CGC CCC C CTA CGG GAG GCA GCA G 3') or 1070F (5'-ATG GCT
GTC GTC AGC T-3') and 1392R (5'-CGC CCG CCG CGC CCC GCG CCC GGC CCG
CCG CCC CCG CCC CAC GGG ACG GGC GGT GTG TAC-3') (Integrated DNA
Technologies, Coralville, IA). Primer reactions and DNA amplification were performed
using the following parameters: 94 °C for 2 minutes, 15 cycles of 94 °C for 45 seconds,
55 °C for 45 seconds, 72 °C for 45 seconds with a final extension step of 72 °C for 7
minutes. Verification of the presence of DNA was assessed in 1.5% agarose gels before
analysis by DGGE. Positive controls for PCR were clinical isolates including
Pseudomonas aeruginosa, Staphylococcus epidermidis, and S. aureus, and the negative
control was sterile water. DGGE was performed on the 16S amplicons described above
using the DCode™ DGGE system (Bio-rad). A 40%–70% denaturing gradient was
optimal for separation of the approximately 450 bp 16S amplicons, where 7 M urea and
40% formamide is defined as 100%. Gels also contained an 8%–12% acrylamide
gradient with a 12% native stacking gel. Different volumes of each sample were loaded
for optimal visualization of bands with varying intensities. The gel was run at 60 V for
20 hours and was then stained with SYBR Gold®
(Molecular Probes, Invitrogen,
Carlsbad, CA) and visualized with a FluorChem™ 8800 fluorescence imager (Alpha
Innotech Inc. San Leandro, CA).
Cloning and Sequencing
For bacterial identification, PCR products of approximately 200 bp and DNA
from the excised DGGE bands were directly cloned using the TOPO TA Cloning Kit
Page 42
28
(Invitrogen Inc., Carlsbad, CA), following the manufacturer's directions. For excised
DGGE bands, the maximum amount of DNA (4 μl diffused DNA in TE buffer) was used
in each of the cloning reactions following the manufacture's instructions. Plasmid
preparation was performed using the Wizard Plus SV Miniprep DNA Purification System
(Promega, Madison, WI), following the manufacturers' directions. The plasmid DNA
was sequenced by Laragen Inc. Sequence data were analyzed using Basic Local
Alignment Search Tool (BLAST) sequence searches (http://www.ncbi.nlm.nih.gov) to
identify bacterial genera. Sequences for clones were analyzed in both the forward and
reverse direction.
Results
Estimation of Bacterial Diversity by
DGGE and Sequencing of 16S rDNA
To estimate the diversity of bacterial populations in chronic wounds, DNA from
chronic wound specimens was analyzed by running PCR amplified 16S rDNA on DGGE
gels. DGGE analysis of chronic wound debridement samples revealed that on average,
DGGE banding patterns contained multiple bands with no two specimens sharing the
exact same banding pattern (Figure 3). Information on wound types and culture data
associated with Figure 3 are presented in Table 1. Several specimens cultured few or no
organisms while analysis by DGGE revealed several bands indicating a more diverse
population was present than indicated by culture data.
Page 43
29
Figure 3. Image of a typical DGGE gel showing results from 13 chronic wound specimens. Most specimens revealed
multiple bands and each specimen had a unique banding pattern. Letters correlate with culture data obtained at the
clinic shown in table 1.
Table 1. Culture data associated with figure 3. Many wounds cultured few or no bacteria while analysis by DGGE
revealed one or more bands indicating an underrepresentation of diversity by traditional culture techniques.
Gel
Lane
Number of
distinct
bands
Wound type Genera/species cultured
A 2 Non-healing surgical
wound
Enterobacter, Pseudomonas
B 1 Venous leg ulcer None
C 2 Calciphylaxis Pseudomonas, Staphylococcus
D 5 Venous leg ulcer Escherichia coli, Staphylococcus aureus
E 6 Diabetic foot ulcer Streptococcus (Group B), Citrobacter,
Staphylococcus
F 1 Venous leg ulcer Pseudomonas, Staphylococcus
G 11 Chronic wound Enterococcus (Group B), Escherichia coli,
Staphylococcus aureus
H 3 Venous leg ulcer Pseudomonas
I 8 Diabetic foot ulcer Enterococcus (Group D)
J 9 Diabetic foot ulcer Citrobacter freundii, Staphylococcus aureus
K 7 Decubitus ulcer Staphylococcus aureus
L 6 Diabetic foot ulcer Staphylococcus
M 5 Non-healing surgical
wound Pseudomonas, Staphylococcus
Bacterial genera in chronic wound micro-communities were identified by
traditional culture techniques and 16S rDNA sequencing. Culture data were collected
from 37 debridement samples and 16S rDNA analysis was performed on 31 debridement
Page 44
30
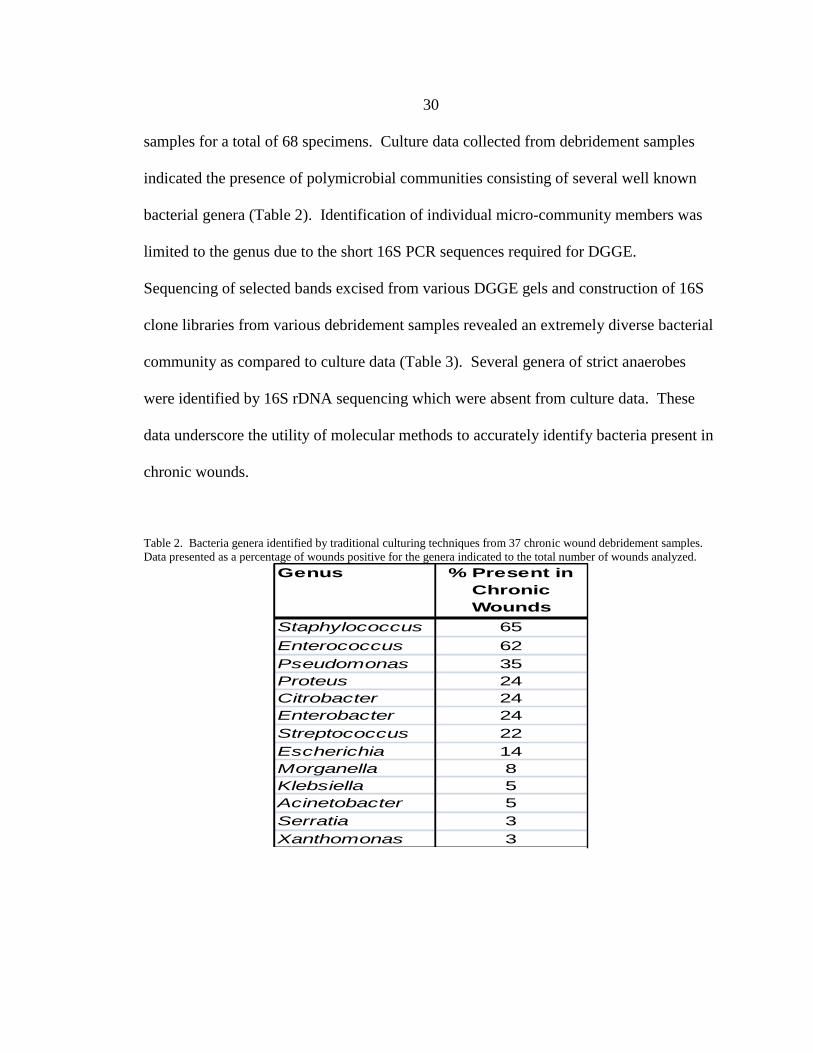
samples for a total of 68 specimens. Culture data collected from debridement samples
indicated the presence of polymicrobial communities consisting of several well known
bacterial genera (Table 2). Identification of individual micro-community members was
limited to the genus due to the short 16S PCR sequences required for DGGE.
Sequencing of selected bands excised from various DGGE gels and construction of 16S
clone libraries from various debridement samples revealed an extremely diverse bacterial
community as compared to culture data (Table 3). Several genera of strict anaerobes
were identified by 16S rDNA sequencing which were absent from culture data. These
data underscore the utility of molecular methods to accurately identify bacteria present in
chronic wounds.
Table 2. Bacteria genera identified by traditional culturing techniques from 37 chronic wound debridement samples.
Data presented as a percentage of wounds positive for the genera indicated to the total number of wounds analyzed.
Genus % Present in
Chronic
Wounds
Staphylococcus 65
Enterococcus 62
Pseudomonas 35
Proteus 24
Citrobacter 24
Enterobacter 24
Streptococcus 22
Escherichia 14
Morganella 8
Klebsiella 5
Acinetobacter 5
Serratia 3
Xanthomonas 3
Page 45
31
Table 3. BLAST results from sequenced 16S rDNA sequences from 31 debridement samples revealed a diverse
microbial population in chronic wound biofilms. Pseudomonas and Staphylococcus were the predominant genera
identified.
Aerobic/ Facultative Anaerobic
Bacteria*
Number of Patients in
Which Organism
Identified
% Present in
Chronic
WoundsAchromobacter spp. 1 3
Acinetobacter spp. 5 16
Uncultured beta Proteobacterium 1 3
Burkholeria spp. 1 3
Citrobacter freundii 1 3
Corynebacterium spp. 1 3
Delftia acidovorans 1 3
Edwardsiella ictaluri 1 3
Enterobacter spp. 2 6
Enterococcus faecalis 2 6
Escherichia coli 1 3
Granulicatella adiacens 2 6
Haemophilus spp. 3 10
Klebsiella pneumoniae 1 3
Microbacterium paraoxydans 1 3
Morganella morganii 3 10
Pectobacterium carotovorum 2 6
Proteus mirabillis 2 6
Pseudomonas spp. 20 65
Uncultured Pseudomoandales spp. 1 3
Rhodococcus spp. 1 3
Serratia marcescens 1 3
Staphylococcus spp.** 10 32
Streptococcaceae bacterium 2 6
Streptococcus spp. 5 16
Anaerobic BacteriaActinomyces odontolyticus 1 3
Anaerococcus vaginalis 1 3
Bacteroides fragilis 1 3
Bacteroidetes 1 3
Uncultured Clostridia bacterium 2 6
Dialister invisus 1 3
Finegoldia magna 1 3
Fusobacterium spp. 3 10
Peptococcus sp. 1 3
Peptoniphilus spp. 2 6
Prevotella oralis 1 3
Peptostreptococcus spp. 3 10
Porphyromonas somerae 3 10
Bacterium strain Rauti 1 3
*Species listed are the most probable species as identified by BLAST
**70% of Staphylococcal genera identified were probable S. aureus species
Page 46
32
Characterization of Bacterial Populations in
Diabetic Foot Ulcers, Venous Leg Ulcers, and Pressure Ulcers
Wound micro-communities were analyzed in debridement samples from patients
with one of the three main wound types: DFUs, VLUs, and PUs. Ten patients per wound
type were analyzed by pooling extracted debridement DNA from each patient at equal
concentrations prior to 16S PCR amplification and analysis.
Venous Leg Ulcer Pooled
Diabetic Foot Ulcer Pooled
Pressure Ulcer PooledAll Pooled
Figure 4. DGGE profiles for diabetic foot ulcers, venous leg ulcers, pressure ulcers, and all three wound types pooled.
Notice the presence of both shared and unique bands. PCR products were diluted 1.5 fold 3 times to observe any faint
bands or bands that may be present next to a larger band.
DGGE profiling of the pooled wound samples is shown in Figure 4. Some bands
are shared between all wound types with varying intensities while many bands are unique
to only one specific wound type. This indicates that while all wound debridement
samples analyzed in this study shared certain bacterial populations, there were distinct
differences in community composition between the three wound types. Various bands
were excised, cloned, and sequenced. BLAST results from the sequenced DGGE bands
are shown in Table 4. Bands shared by all wound types were often found to contain 16S
Page 47
33
rDNA sequences from several different genera of bacteria between wound types.
Therefore, bands shared by all wound types cannot be identified as a specific genus of
bacteria.
Table 4. Results from DGGE band excision and sequencing. UWB refers to uncultured wound bacterium not found in
the NCBI database.
Number of
seqeunces
VLU Genus Number of
seqeunces
DFU Genus Number of
seqeunces
PU Genus
18 Enterobacter spp. 13 Pseudomonas spp. 34 Serratia spp.
17 Pseudomonas spp. 12 Haemophilus spp. 13 Dialister spp.
4 Proteus spp. 11 Citrobacter spp. 10 Peptococcus spp.
2 Klebsiella spp. 11 Stenotrophomonas spp. 3 Pseudomonas spp.
2 Pectobacterium spp. 10 Morganella spp. 2 Citrobacter spp.
2 Erwinia spp. 10 Staphylococcus spp. 2 Morganella spp.
1 Serratia spp. 5 Acinetobacter spp. 2 Proteus spp.
1 UWB 5 Acinetobacter spp. 1 Haemophilus spp.
1 Haemophilus spp. 4 Morganella spp. 1 Klebsiella spp.
4 Proteus spp. 1 Leminorella spp.
3 Delftia spp. 1 Pectobacterium spp.
3 Obesumbacterium spp. 1 Peptoniphilus spp.
2 Dialister spp. 1 Prevotella spp.
2 Mannheimia spp. 1 UWB
1 Comamonas spp.
1 Grimontia spp.
1 Klebsiella spp.
1 Macrococcus spp.
1 Methylophaga spp.
1 Pantoea spp.
1 Pectobacterium spp.
1 Rahnella spp.
1 Serratia spp.
1 Streptococcus spp.
1 UWB
In addition to DGGE analysis of debridement samples, pooled DNA samples were
analyzed by traditional culture methods, pyrosequencing and full ribosome shotgun
sequencing in collaboration with Dowd et al [56]. Culture data were generated by
analysis of the subject’s medical record. Positive culture tests nearest to the date of
sample collection for molecular analysis were recorded. All thirty subjects had culture
Page 48
34
data in their medical records with the exception of one in the PU group. Many of the
subjects were specifically cultured for both aerobic and anaerobic bacteria, but no
obligate anaerobes were reported.
The results from these complimentary 16S rDNA methods compared to culture
data revealed a much higher diversity in chronic wound bacterial populations. Collected
evidence from DGGE, pyrosequencing, and full ribosomal shotgun sequencing indicated
that chronic wounds are extremely complex polymicrobial communities.
Table 5. Bacteria cultured during standard of care from the three wound groups. The number of subjects within each
wound type group with positive culture results for a bacterial genus is listed under the heading “subjects”.
Subjects VLU group Subjects DFU group Subjects PU group
4 Enterococcus 2 Citrobacter 4 Staphylococcus
3 Staphylococcus 2 Enterococcus 2 Streptococcus
2 Enterobacter 2 Klebsiella 2 Enterococcus
2 Pseudomonas 2 Serratia 1 Escherichia
1 Klebsiella 2 Staphylococcus 1 Leclercia
1 Serratia 2 Streptococcus 1 Proteus
1 Citrobacter 1 Proteus 1 Pseudomonas
1 Acinetobacter 1 Pseudomonas 1 Acinetobacter
1 Escherichia 1 Enterobacter
Discussion
It has been known for some time that both acute and chronic wounds harbor
multiple species of bacteria, including wounds without any signs of infection. This was
evident in a review by Bowler et al where culture data from 62 published wound studies
from the past four decades were examined [161]. Staphylococcus aureus was the most
predominant isolate followed by coliforms, Bacteroides spp., Peptostreptococcus,
Pseudomonas aeruginosa, Enterococcus spp., and Streptococcus pyogenes. Molecular
techniques have been utilized in recent studies to characterize bacterial populations in
Page 49
35
chronic wounds [56, 162, 163]. All such studies have found chronic wound micro-
communities are more diverse than indicated by culture-based techniques. Overall, both
culture and molecular based microbiological analyses have shown that wounds harbor
diverse populations of bacteria. A single bacterial species responsible for chronic wound
infections has not been identified and several species of bacteria have been cultured from
both chronic and acute wounds. As chronic wounds do not seem to have a specific
causative agent of disease, they violate Koch’s postulates:
1. The microorganism must be found in abundance in all organisms suffering
from the disease, but should not be found in healthy animals.
2. The microorganism must be isolated from a diseased organism and grown in
pure culture.
3. The cultured microorganism should cause disease when introduced into a
healthy organism.
4. The microorganism must be re-isolated from the inoculated, diseased
experimental host and identified as being identical to the original specific
causative agent.
However, a complex, polymicrobial causative agent for chronic diseases such as
periodontal disease and chronic wounds is increasingly accepted.
DGGE banding patterns from chronic wound debridement samples revealed that,
while some wounds shared certain bands, no two wounds shared identical banding
patterns (Figure 3). This suggests that while some species of bacteria are common in
many wounds, each wound micro-community is unique. DGGE banding profiles
consistently produced several more bands than culture data indicated would be present
(Figure 3, Table 1). These initial analyses indicated that culture data underrepresented
the bacterial communities present in chronic wound infections.
Page 50
36
To further address chronic wound bacterial community structure, 16S rDNA and
culture data were compared from wound debridement samples (Tables 2 and 3). The
diversity revealed by 16S rDNA analysis was far greater than indicated by traditional
culture techniques. In addition to the greater number of bacterial genera identified, strict
anaerobic genera were identified by 16S rDNA sequence analysis. No strict anaerobes
were cultured from any wound analyzed, even though standard anaerobic culture
techniques were applied.
The micro-communities from pooled DNA samples derived from ten patients per
each of the three main wound types (DFUs, VLUs, and PUs) were analyzed by DGGE
and 16S rDNA sequencing of excised bands. Each wound type produced a unique
banding pattern which shared some bands (Figure 3). The finding that bands that
denature at similar migration distances in the gel do not necessarily contain the same
genera of bacteria indicated that DGGE analysis may under represent microbial diversity
as well. This was considered a drawback to DGGE analysis. It was determined that
DGGE is a tool best used for the qualitative analysis of bacterial diversity in complex
communities rather than a quantitative method.
In collaboration with Dowd et al, sequence results from excised DGGE bands
were compared to sequence results from complimentary 16S rDNA techniques [56]. The
same DNA extracts from pooled patient populations with one of the three main wound
types were analyzed by pyrosequencing and full ribosome shotgun sequencing. The
complimentary comparison of the banding profiles and sequences produced by DGGE
analysis, deep sequence coverage produced by pyrosequencing, and the species level
Page 51
37
identification of bacterial community members by full ribosomal shotgun sequencing
revealed that Staphylococcus, Pseudomonas, Peptoniphilus, Enterobacter,
Stenotrophomonas, Finegoldia, and Serratia spp. are predominant populations of bacteria
in chronic wound biofilms from the subjects analyzed in this study.
Page 52
38
CHAPTER 4
DEVELOPMENT OF A NOVEL IN VITRO BIOFILM DISEASE MODEL AND
CHARACTERIZATION OF S. AUREUS BIOFILM CONDITIONED MEDIUM
Introduction
An in vitro model to study the impact of bacterial biofilms on inflammatory and
epithelialization processes in human epidermal cells was developed. S. aureus was
chosen as a model pathogen since it was discovered in all of the three main wound types
and is an important human pathogen associated with high rates of nosocomial infections.
Keratinocytes form a physical barrier (the epidermis) to the outside environment, and are
one of the first cell types to initiate inflammatory processes induced by invading
microorganisms and environmental stresses associated with wounding. Additionally, the
persistent nature of chronic wound infections is in part due to the failure of the epidermis
to reestablish itself on the wound bed. Keratinocytes are thus involved in both the
inflammatory and epithelialization phases of wound healing. Keratinocytes derived from
human foreskin (HFKs) and the spontaneously immortalized keratinocyte cell line
HaCaT (Human adult low Calcium Temperature) were selected as model epidermal
cells. HaCaT keratinocytes are a widely used keratinocyte line which display similar
responses to TLR ligands and migrate at similar rates as primary keratinocytes and are
suitable for studies investigating innate immunity and cell migration [164, 165].
Research into the effects of disease causing bacteria has been overwhelmingly
focused on the effects of planktonic bacterial cultures on different aspects of
Page 53
39
pathogenesis. Several studies have been conducted that observed the effects of
planktonic bacteria in exponential or stationary phase growth on various mammalian cell
types [52, 53]. The formation of bacterial biofilms and their effects on pathogenic
mechanisms is largely underrepresented in the literature. Bacterial biofilms occur
frequently in nature and it can be argued that bacteria in a planktonic phenotype are the
minority outside of the laboratory. Characterization of S. aureus biofilm and planktonic
conditioned medium (BCM and PCM, respectively) was performed to evaluate
fundamental differences between the planktonic and biofilm phases of growth. Analysis
of S. aureus BCM could potentially elucidate mechanisms that impact wound healing
processes in human keratinocytes. Our in vitro biofilm disease model is a more relevant
way to study chronic wound infections than traditional planktonic based in vitro models.
Materials and Methods
Cell Culture
Human foreskin keratinocytes (HFKs) and the spontaneously immortalized
human HaCaT keratinocyte cell line were used in these studies. Additionally, HaCaT
keratinocytes undergo the same Biofilm Conditioned Medium induced morphology
changes, induction of apoptosis, and increases in intracellular calcium as HFKs.
HFKs were cultured from newborn foreskin and passaged in serum free medium
using methods previously described [166]. Cells were maintained in EpiLife®
keratinocyte growth medium (Cascade Biologics, Portland, OR) supplemented with
human keratinocyte growth supplement (HKGS; Cascade Biologics, Portland, OR).
Page 54
40
Experiments were conducted with cell passages 4–10, using EpiLife® medium
supplemented with HKGS (EPI). HaCaT keratinocytes were maintained and cultured
under identical conditions. All cultures were kept in a humidified 5% CO2 incubator at
37 °C.
S. aureus Biofilm Culture Conditions and
Preparation of Biofilm Conditioned Medium
Tissue culture inserts (35 mm diameter, 0.2 µm pore size, Nalge Nunc
International, Rochester, NY) were placed into six well plates with 2.1 ml of EPI
supplemented with human keratinocyte growth supplement in each well. An overnight
culture of a clinical isolate of S. aureus (South West Regional Wound Care isolate
#10943) was diluted in EPI to an optical density of 0.05 at 600 nm. Seven 10 µl drops of
the diluted culture were placed on each insert and the biofilm was allowed to mature for
three days at 37°C in a humidified 5% CO2 atmosphere. Every 24 hours for four days
thereafter, the growth medium was collected, pH adjusted to 7.2 (from pH 7.7), filter
sterilized, pooled, and replaced with fresh EPI. The collected growth medium will be
referred to as biofilm-conditioned medium (BCM). Alternatively, mature biofilms were
transferred to 6-well plates with confluent keratinocytes and observed for various
amounts of time. This will be referred to as the biofilm co-culture model.
S. aureus Planktonic Culture Conditions and
Preparation of Planktonic Conditioned Medium
To obtain a planktonic culture of S. aureus that most closely resembled the
physiological conditions found in bacterial biofilms, mature three day old S. aureus
Page 55
41
biofilms were re-suspended into 2.1 ml of EPI growth medium and grown at 37°C with
constant agitation. Bacterial cells were centrifuged out of solution and the supernatant
was collected, pH adjusted to 7.2 (from pH 6.9), and filter sterilized. This collected
supernatant will be referred to as planktonic conditioned medium (PCM). The bacterial
pellet was re-suspended in 2.1 ml fresh EPI growth medium and this process was
repeated every 24 hours for four days and the supernatants pooled. Both S. aureus
planktonic and biofilm cultures were maintained for four days and the conditioned
medium pooled to help eliminate any day to day variations that might occur in overnight
planktonic and biofilm cultures.
Planktonic cultures of S. aureus grown under varying oxygen tensions were
grown in 30 ml EPI growth medium in glass tubes crimp sealed with a butyl rubber
stopper maintained with constant agitation at 37°C. Cultures described as aerobic open
were vented to ambient air with a needle and syringe filter. Cultures described as aerobic
closed were inoculated with ambient air in the headspace and sealed. Cultures described
as anoxic were purged with 0.2 µm filtered nitrogen for 30 minutes prior to inoculation.
OD600 readings were obtained for all cultures at various times. Conditioned medium was
harvested as described previously for PCM.
Population Density Measurements of S. aureus Cultures
Population densities were measured by reading the optical density of the culture at
600nm (OD600). Planktonic measurements were taken after centrifuged planktonic
bacterial pellets were re-suspended in fresh growth medium. An initial and final (day 0
Page 56
42
and day 4) OD600 was measured for S. aureus biofilm by re-suspending the biofilm in the
same volume of fresh EPI in which planktonic cells were re-suspended.
1D SDS-PAGE
Total protein from BCM, PCM, and EPI was quantified using a modified Lowry
assay following the manufacturer’s protocol (Thermo Scientific, Rockford, IL). Proteins
from equal volumes (2 ml) of PCM, BCM, and EPI were precipitated by adding 50 µl
40% TCA and 150 µl acetone. Samples were vortexed and incubated at 4°C for 2 hours.
Samples were then centrifuged at 10,000 RPM for 10 min at 4oC. The supernatant was
decanted and the protein pellet was washed in 500 µl acetone and centrifuged. This
process was repeated and the protein pellet was allowed to air dry for 5 minutes at room
temperature. Precipitated protein pellets were re-suspended in 50 µl sample buffer (3.8
ml dH2O, 1.0 ml 0.5M Tris-HCL pH 6.8, 0.80 ml glycerol, 1.6 ml 10% SDS, 0.4 ml 2-β-
mercaptoethanol, 0.4 ml 0.05% (W/V) bromophenol blue). Samples were incubated at
950C for 5 min. Samples were loaded onto 12% acrylamide gels (33.5 ml dH2O, 25 ml
1.5M Tris-HCL pH 8.8, 1.0 ml 10% SDS, 40 ml 30% acrylamide/bis, 500 µl 10%
ammonium persulfate, 50 µl TEMED) with a 4% acrylamide stacking gel (3.05 ml
dH2O, 1.25 ml .5M Tris-HCL pH 6.8, 50 µl 10% SDS, 0.65 ml 30% acrylamide/bis, 25
µl 10% ammonium persulfate, 5 µl TEMED). Gels were run in a Tris/Glycine running
buffer at 60 mAmps until the dye front ran off of the gel. Gels were stained with
Coomassie Blue (GE Healthcare Biosciences, Pittsburgh, PA).
Page 57
43
Nuclear Magnetic Resonance (NMR) Metabolite Profiling
NMR metabolite profiling of bacterial conditioned medium was performed by the
NMR Core facility at Montana State University. Samples of BCM, PCM, and EPI (400
ul) were diluted with 100 ul of concentrated NMR buffer and analyzed with NMR
Samples were lyophilized and re-suspended in deuterated water and standard 1-D 600
MHz 1H NMR spectra were acquired for all samples. NMR spectra were obtained on a
Bruker 600 MHz magnet. Metabolites were quantified with Chenomx software. The
Genesis software was used to generate a heat map of the metabolites and calculate
ANOVA p-values.
Organic Extraction of Conditioned Medium
Conditioned medium was extracted into an equal volume of chloroform in glass
test tubes and vortexed. The organic layer was removed to a fresh glass tube using glass
Pasteur pipettes. The collected chloroform was then completely dried under a gentle
stream of 0.2 µm filtered ambient air at room temperature and re-suspended into 100 µl
chloroform. All samples destined to be analyzed and compared were prepared at the
same time.
High-Performance Liquid
Chromatography Mass Spectrometry (HPLC/MS) Analysis
HPLC. Metabolites present in bacterial conditioned medium were routinely
separated using an Agilent series 1100 high-performance liquid chromatograph equipped
with an auto sampler, a fraction collector, a diode array detector, a temperature-controlled
Page 58
44
column compartment, and a Hypersil BDS-C18 column (Agilent, 2.0x125 mm with 3 µm
pore size). Solvents used were 0.1 % formic acid and 95% acetonitrile (0.1% formic
acid) with a 5-95% gradient at a 0.4 ml/minute flow rate. Separation was performed at
25°C.
ESI-MS. Positive-mode electro spray ionization (ESI) mass spectra of bacterial
conditioned medium were obtained using a series 6300 Agilent SL ion trap mass
spectrometer. MS analysis was performed simultaneously with HPLC separation
(HPLC/MS). For MS2 compound identification, fractions of each metabolite were
collected at the time that their concentrations were the highest (between 8 and 9 minutes
for aureusimine A and between 9.5 and 10.5 minutes for aureusimine B) and analyzed via
direct infusion into the mass spectrometer. The MS parameters were as follows: nitrogen
dry gas flow rate, 5 liters/ min; dry gas and vaporizer temperature, 350°C and 400°C,
respectively; corona current, +4000 nA; and nebulizer pressure; 60 psi.
Q-TOF-MS. Samples were separated on a Agilent 1290 uHPLC with a
Phenomenex Kinetex C-18 column (150 x 2.1 mm with 2.6 µm pore size). Solvents used
were 0.1 % formic acid and 95% acetonitrile (0.1% formic acid) with a 5-95% gradient at
a 0.4 ml/minute flow rate. Fractions containing m/z 229 and m/z 245 were collected
based upon the time they eluted as determined by UV 322 nm detection. Collected
fractions were directly injected into an Agilent 6520 quadrupole time-of-flight (Q-TOF)
with a micro-syringe. MS2 was performed using collision energies ranging from 10-
100V and acquired spectra were averaged.
Page 59
45
ICP-MS. Filter sterilized (0.2 μm) samples were taken and preserved at 4 °C for
analysis. Inductively coupled plasma mass spectrometry (ICP-MS) (Agilent 7500ce
ORS, Foster City, CA, U.S.A.) with an Octopole Reaction System and a MicroMist glass
concentric nebulizer was used to measure metal concentrations. The sample temperature
was set at 2 °C and the radio frequency power was set to 1500 W. Argon was used as the
carrier gas, at a flow rate of 0.64 L min−1
. The nebulizer pump was operated at 0.15
rotations per second (rps) and the sample pump was set to 0.1 rps. Measurements were
compared with standards to calculate metal concentrations. Germanium and indium were
used as internal standards to correct for drift over a series of runs.
Results
Characterization of S. aureus in the Biofilm
Disease Model and S. aureus Biofilm Conditioned Medium
S. aureus biofilms grown on tissue culture inserts were used in either the co-
culture model or for the production of BCM (Figure 5).
Page 60
46
Figure 5. A. Three day old S. aureus biofilms grown on tissue culture inserts. B. EPI growth medium in contact with
the biofilm (biofilm conditioned medium) was collected and replaced with fresh growth medium every 24 hours.
Alternatively, mature biofilms (A) were placed in wells containing confluent keratinocytes (B) in the co-culture model.
Population density curves for both biofilm and planktonic cultures of S. aureus
show that both cultures had comparable OD600 levels indicating similar growth rates and
cell densities (Figure 6).
Page 61
47
0
0.2
0.4
0.6
0.8
0 1 2 3 4
OD
60
0A
bso
rba
nce
Day
OD600 Population Density
Planktonic
Biofilm
Figure 6. Population density curves for S. aureus biofilm and planktonic cultures over a four day period. Both cultures
show stationary growth with comparable OD600 levels indicating that both culturing techniques produce similar culture
densities. Data represents mean measurements from three individual cultures. Error bars on the order of 0.005 for all
time points were too small to be charted.
The total protein concentration of PCM and BCM did not change drastically in
any sample, but BCM was found to contain the highest amount of total protein (Figure 7).
However, these data do not represent the total bacterial protein since the bacteria are
consuming protein in the growth medium. Differences in bacterial proteins compositions
were revealed by 1D SDS-PAGE (Figure 7). Several bands were found to be unique to
each sample indicating differential protein production by S. aureus during planktonic and
biofilm growth. Both planktonic and biofilm S. aureus consumed protein as indicated by
the disappearance of large bands from the EPI control. Additionally, the BCM sample
produced a smear in every gel run indicating the presence of bacterial proteases.
Page 62
48
0
200
400
600
800
1000
1200
1400
EPI PCM BCM
ug
/m
l To
tal
Pro
tein
ug/ml Total ProteinEPI PCM BCM
Figure 7. (Left) 1D SDS-PAGE of EPI, PCM, and BCM. Several unique bands are present in both the PCM and BCM
samples. Smearing of the BCM sample was observed in all gels run indicating protease activity. (Right) Total protein
in EPI, PCM, and BCM. BCM samples contained more total protein, but it is likely that the bacteria were consuming
protein leaving the total bacterial protein concentration unknown.
Both BCM and PCM contained roughly equivalent amounts of extracellular
DNA (Figure 8). A broader range of nucleic acid length was observed in DNA present in
PCM (50-500 bp) while DNA present in BCM was between 50-100 bp in length. The
tight range of extracellular DNA in BCM is likely a consequence of bacterial nuclease
activity.
Page 63
49
PCM BCM
Figure 8. Precipitated DNA from 2 ml PCM or BCM. Both samples have roughly the same amount of DNA, but BCM
ran without smearing. S. aureus biofilm are secreting DNA fragments between 50-100 bp while DNA present in
planktonic cultures of S. aureus are between 50-500 bp. Ladder ranges from .05-10 kbp.
S. aureus Biofilm Produces
Mixed Acid Fermentation Products
To investigate the complex metabolite compositions of planktonic and biofilm S.
aureus secretions, NMR based metabolite profiling was applied to PCM, BCM, and EPI
growth medium. With a lower limit of detection of 0.001 mM, 55 compounds were
identified in S. aureus BCM, PCM, and EPI samples. It is important to note that this
method of metabolite identification is limited to known standards in a library. As seen in
Figure 9, several compounds are present which are not accounted for (orphan
compounds). Compounds can be added to this library, but other methods are required for
identification (i.e. HPLC/MS). A hierarchical clustering of known metabolite
concentrations is shown in Figure 10.
Page 64
50
Figure 9. Raw spectrum produced by NMR analysis of BCM (note chemical shifts between 5-10 ppm are magnified,
bottom). Compounds in the Chenomx library were identified (red) while several orphan compounds were observed
(black). These orphan compounds are present in the sample, but compound identification is limited to known
compounds in a library.
Page 65
51
Figure 10. Hierarchical clustering (covariance distance) of metabolite concentrations in BCM, PCM, and EPI. Light
colors indicate high metabolite concentrations, while black indicates metabolite concentrations below detection. Basic
nutrients like glucose and amino acids were consumed more quickly in planktonic S. aureus cultures while S. aureus
biofilm cultures were found to excrete the anaerobic fermentation products acetate, formate, lactate, and propionate.
Results are consistent with the notion that bacterial biofilms harbor diverse metabolic niches including an overall more
dormant metabolic state and anoxic areas deep within the biofilm. Triplicate biological replicates are indicated by 1, 2,
and 3.
Page 66
52
While both planktonic and biofilm cultures were found to consume glucose and
amino acids, S. aureus planktonic cultures consumed more than S. aureus biofilm. S.
aureus biofilm cultures selectively consumed amino acids over glucose and produced the
fermentation products acetate, lactate, formate, and propionate. The lack of fermentation
products in the planktonic culture supernatant indicates that glucose and other nutrients
were consumed primarily through oxidative metabolic pathways.
Secreted metabolites from both planktonic and biofilm cultures of S. aureus were
placed into contact with confluent HaCaT keratinocytes. The resulting metabolic profiles
are shown in Figure 10. Relative to initial metabolite levels indicated by NMR analysis
of PCM, BCM, and EPI, nutrients such as glucose and amino acids were only partially
consumed by keratinocytes under all conditions. An increase in lactate, acetate, formate,
and proprionate in all samples exposed to keratinocytes was observed indicating
anaerobic glycolysis was occurring in HaCaT keratinocytes in our model. The absence of
these fermentation products in the planktonic S. aureus culture followed by their
appearance after incubation with the keratinocyte culture indicates they are produced by
the keratinocytes. ICP-MS analysis of BCM, PCM, and EPI revealed that sodium,
magnesium, potassium, and calcium levels were unchanged.
Page 67
53
Figure 11. Hierarchical clustering (covariance distance) of excreted metabolites from human keratinocytes exposed to
S. aureus metabolites in BCM, PCM, and EPI for four hours. Lactate production was observed in all conditions while
the presence of other fermentation products such as acetate, formate, and propionate are present in samples exposed to
bacterial products. Triplicate biological replicates are indicated by 1, 2, and 3.
Page 68
54
0
0.2
0.4
0.6
0.8
1
1.2
1.4
1.6
0.00 10.00 20.00 30.00 40.00 50.00 60.00
OD
60
0
Time (hours)
S. aureus 10943
Aerobic sealed
Nitrogen bubbled through medium
Aerobic open
Figure 12. Growth curves for S. aureus under open, aerobic, sealed aerobic, and anoxic conditions. All cultures were
grown planktonically with constant agitation at 37°C in EPI.
To further characterize secreted metabolite compositions from S. aureus biofilm,
planktonic cultures grown under anoxic and aerobic environments were investigated.
These conditions were selected to mimic the anoxic core and aerobic shell present in the
biofilm. The expected growth patterns were observed with anoxic cultures growing
slowly, open aerobic cultures growing very quickly, and sealed aerobic cultures growing
modestly fast (Figure 11). It is important to note that the stationary phase open aerobic
culture may have consumed all dissolved oxygen in the medium even though the
headspace was exchanged to the atmosphere. In total, 33 metabolites were identified in
planktonic S. aureus samples. Measured pH values revealed that all of the planktonic
Page 69
55
cultures became more acidic over time while the biofilm was the only culture that
actually increased its pH relative to the starting pH of EPI (Figure 12).
6.2
6.4
6.6
6.8
7
7.2
7.4
7.6
7.8
Sample (OD600 Measurement)
pH
pH
Figure 13. Planktonic cultures of S. aureus grown in EPI were harvested at various phases of growth and the pH was
measured. EPI media had an initial pH of 7.2 and all planktonic cultures showed a decrease in pH over time regardless
of the presence or absence of oxygen. BCM was the only sample were the pH increased above 7.2. Error bars
represent standard deviation of the average of three experiments.
The hierarchical clustering of metabolites analyzed from S. aureus planktonic
cultures cultivated under different oxygen tension is shown in Figure 13. Planktonic
anoxic cultures of S. aureus contained higher concentrations of common fermentation
products such as lactate and formate. The presence of these metabolites in planktonic
anoxic S. aureus cultures in addition to the relatively low concentrations found in aerobic
cultures confirms the presence of an anoxic niche in S. aureus biofilms. Metabolites such
as glucose and other sugars were found to be consumed in anoxic cultures while they
were not consumed in early exponential phase aerobic cultures or BCM. This indicates
that while the metabolome of S. aureus biofilm is a mix between anoxic and aerobic
Page 70
56
planktonic metabolomes, there are some unique metabolic activities that occur within the
biofilm environment.
Figure 14. Hierarchical clustering (cosine correlation) of metabolite concentrations in anoxic, aerobic OD 0.38, and
aerobic OD 1.4 planktonic S. aureus cultures. Bright red indicates high metabolite concentrations, while black
indicates metabolite concentrations below detection. Fermentation products such as lactate and formate are present at
high concentrations in anoxic cultures.
Page 71
57
Hydrophobic Small Molecule Production in
S. aureus Biofilm and Planktonic Cultures
Hydrophilic molecules are readily secreted from mammalian systems while
hydrophobic molecules must be metabolized to a more water soluble form prior to
elimination from the body. As a consequence, hydrophobic molecules are often much
more toxic to mammalian cells than are hydrophilic molecules. To test the possibility
that S. aureus biofilms were secreting small hydrophobic molecules that could diffuse
freely into host cells, an organic extraction on BCM, PCM, and EPI medium was
performed using chloroform. HPLC/MS analysis of chloroform extracts EPI, PCM, and
BCM is shown in Figure 14.
8 9 10 11 12 13 14 15 16 Time [min]
0
2
4
6
8
4x10
Intens.
081013_BioFilmCHCl3Extract_4_01_5868.d: BPC 50-1701 +All MS 081013_PlankCHCl3Extract_5_01_5870.d: BPC 49-1701 +All MS
20081013_Epi_CHCl3Extract_3_01_5866.d: BPC 49-1701 +All MS
229.13032
230.13464
+MS, 9.9min #175
0
1
2
3
4
4x10
Intens.
229 230 231 232 233 234 235 236 m/z
*
*
Figure 15. HPLC/MS base peak chromatogram displaying BCM (red), PCM (blue), and EPI medium (black). (*)
represent peaks absent in EPI growth medium but present with high intensities in BCM samples relative to PCM
samples (left * m/z=245.13, Right * m/z=229.13). Other peaks with high intensities in the BCM sample were found to
be present in the growth medium and were not analyzed further.
Page 72
58
Two peaks were present at high intensities in BCM relative to PCM which were
absent in the growth medium. The ion with the highest intensity had an m/z ratio of
229.13 and the lower intensity ion had an m/z of 245.13. While this dissertation was
being prepared, Wyatt et al published the structures of two non-ribosomal peptide
secondary metabolites (aureusimine A and B) produced by S. aureus that regulated
virulence [167]. Wyatt et al determined that these two compounds were synthesized by
S. aureus through the combination of the amino acids valine and tyrosine (aureusimine
A) and valine and phenylalanine (aureusimine B). The m/z of aureusimine A and B were
reported by Wyatt et al as m/z 245.17 and m/z 229.13, respectively. The structures of the
aureusimines are shown in Figure 15.
NH
NH
+
O
CH3
CH3
NH
NH
+
O
CH3
CH3OH
Aureusimine Am/z=245.17
Aureusimine Bm/z=229.13
Figure 16. Structures the positive ions of S. aureus non-ribosomal peptide secondary metabolites published by Wyatt
et al [167]. These compounds were shown to regulate virulence in S. aureus both in vitro and in vivo. These
compounds were found to have the same molecular weight and UV absorbance spectra as the compounds identified in
BCM.
Wyatt et al detected the aureusimines using Ultra Violet light (UV, 322 nm). They
found that aureusimine A eluted first followed by aureusimine B. The ions described in
this dissertation were also detected by 322 nm UV light which corresponded with
extracted ion chromatograms (EICs) for m/z 245 and m/z 229 (Figure 17). Furthermore,
based on the m/z of the eluting ions, the m/z which corresponded with aureusimine A
Page 73
59
eluted first, followed by the ion correlating with aureusimine B. These data suggest that
the ions described here are likely the same ions described by Wyatt et al.
A
Ab
sorb
ance
Co
un
ts
Time (min)
B
C
Time (min)
Figure 17. (A). Wyatt et al reported that aureusimine A (1) and B (2) absorbed UV radiation at 322 nm. EICs for m/z
245 and m/z 229 (B) correlated with UV absorbance at 322nm (C). The reproduction of UV absorbance at 322 nm
indicates that m/z 229 and m/z 245 may be the aureusimines described by Wyatt et al.
In light of the publication of the structures of aureusimine A and B, MS2
experiments were carried out to identify the two ions present in high quantities in BCM
relative to PCM. High resolution MS spectra obtained using a Q-TOF/MS provided high
resolution masses for the two positive ions: m/z 245.1289 and m/z 229.1338. A high
resolution chemical formula calculator was used to determine possible molecular
formulas for the measured masses. The only possible chemical formulas for the two
masses, within an acceptable error range of 1.5 ppm, were C14H17N2O2 and C14H16N2O.
These are the chemical formulas for the positive ions of aureusimine A and B,
respectively. MS2 fragmentation of collected fractions of each ion directly injected into a
Q-TOF/MS revealed that the expected fragmentation ions of aureusimine A and B were
present (Appendices A and B, respectively). Both ions experienced similar losses of
masses that corresponded to shared molecular features (i.e. loss of the isopropyl group)
Page 74
60
while aureusimine A fragmentation patterns were consistent with the additional hydroxyl
group in its tyrosine residue.
The production of aureusimine A and B in other strains of S. aureus and other
Gram positive and Gram negative bacterial species were investigated using HPLC/MS
and MS2 (Table 6). Interestingly, only Gram positive species were found to produce
aureusimine A and B as none of the extracts from Gram negative bacteria contained
either ion. The two MRSA strains were found to produce several times more
aureusimine A and B than any other strain tested.
Table 6. Strains analyzed for aureusimine A and B. Relative production indicated by plus signs. Only Gram positive
strains were found to produce the aureusimines. The MRSA strains tested produced the highest levels of the
aureusimines.
Strain Gram
Aureusimine
A
Aureusimine
B
S. aureus SWRWC 10943 + ++ ++
S. aureus ALC 2035 + ++ +++
S. aureus SWRWC 113 (MRSA) + ++++ +++++
S. aureus ATCC 33591 (MRSA) + ++++ +++
S. aureus ATCC 29213 + + ++
Coag (-) Staph. spp. SWRWC 129 + + +
Staphylococcus epidermidis (SWRWC clinical isolate) + +++ ++
Enterococcus faecalis (SWRWC clinical isolate) + + ++
Pseudomonas aeruginosa SWRWC 215 - - -
Escherichia coli ATCC 8739 - - -
Page 75
61
Oxygen Tension in Planktonic S. aureus
Cultures Impacts Production of Aureusimine A and B
The presence of mixed acid fermentation products in BCM and not in PCM
indicated an anoxic niche was present in S. aureus biofilms. Since BCM contained
relatively high levels of the aureusimines compared to PCM, it was hypothesized that the
presence of an anoxic niche may contribute to the production of the small molecules
observed in organic extracts of BCM. To test the production of the aureusimines in
aerobic or anoxic environments, the same planktonic S. aureus cultures cultivated for
metabolite analysis were analyzed for aureusimine A and B. Optical density readings
were measured for all of the growth conditions (Figure 6) and the pH measured (Figure
12).
Culture supernatants were harvested based on OD600 readings (exponential or
stationary growth phases) and extracted into chloroform for analysis of aureusimine
production with HPLC/MS. Oxygen was found to influence the production of the
aureusimines (Figures 18 and 19). All stationary phase cultures produced the
aureusimines over time with the sealed aerobic culture producing the most. None of the
aerobic cultures growing exponentially produced the ions while anoxic cultures were
found to have the ions present during all phases of growth. Anoxic cultures produced the
aureusimines at reduced levels compared to other cultures, but this is likely due to the
low cell densities achieved during anoxic growth. The presence of aureusimine A and B
was measured in freshly harvested BCM and in 8 week old BCM stored at -20°C. It was
found that the aureusimines slowly decomposed over time.
Page 76
62
0.00E+00
2.00E+06
4.00E+06
6.00E+06
8.00E+06
1.00E+07
1.20E+07
1.40E+07EI
C Pe
ak A
rea
Sample ID (OD600)
Aureusimine A
m/z 245
0.00E+00
2.00E+07
4.00E+07
6.00E+07
8.00E+07
1.00E+08
1.20E+08
1.40E+08
1.60E+08
1.80E+08
EIC
Peak
Are
a
Sample ID (OD600)
Aureusimine B
m/z 229
Figure 18. EIC peak areas indicate that as oxygen is consumed, the ions of interest are produced. Other than the BCM
samples, the sealed aerobic sample collected during stationary growth contained the most aureusimines. No
aureusimines were detectable in either aerobic culture until a stationary phase of growth was achieved. Anoxic cultures
contained low levels of aureusimines at all time points indicating that although the anoxic cultures had low cell
numbers, the low oxygen levels in those environments stimulated the synthesis of aureusimine A and B. Data
representative of triplicate experiments.
Page 77
63
Comparison of similar cell densities (OD600 0.3-0.4) revealed that anoxic cultures
did in fact produce more aureusimine A and B than similar cell densities of aerobic
cultures (Figure 18). However, this could be attributed to a longer period of growth
required to reach these population levels in anoxic cultures relative to aerobic cultures,
resulting in the production of more of these molecules as a consequence of time rather
than cell density.
0.00E+00
1.00E+05
2.00E+05
3.00E+05
4.00E+05
5.00E+05
Aerobic sealed (0.382)
Anoxic (0.3) Aerobic open (0.398)
EIC
Pe
ak
A
re
a
Sample ID (OD600)
Aureusimine A
OD600 0.3-0.4
0.00E+00
5.00E+05
1.00E+06
1.50E+06
2.00E+06
2.50E+06
Aerobic sealed (0.382)
Anoxic (0.3) Aerobic open (0.398)
EIC
Pe
ak
A
re
a
Sample ID (OD600)
Aureusimine B
OD600 0.3-0.4
Figure 19. EIC peak areas of aerobic sealed, anoxic, and aerobic open cultures at similar OD600 readings between 0.3
and 0.4. At these similar cell densities, the anoxic cultures produced higher levels of the aureusimines. This further
indicates that low oxygen tension is required for the production of these molecules. Data representative of triplicate
experiments.
Discussion
S. aureus biofilm were grown on tissue culture insert membranes with a pore size
smaller than the diameter of individual bacteria (0.2 µm pore size). No direct physical
contact between the biofilm and keratinocytes was possible in this model without
physically disrupting the biofilm by scraping it off of the membrane. Rather, interactions
Page 78
64
between soluble products released from the biofilm and their effects on cultured
keratinocytes were examined. Advantages of growing S. aureus biofilm on tissue culture
inserts include: i) the biofilm and keratinocytes can be separated completely for
study/maintenance with minimal disruption to either the host or pathogen, ii) the ability
to separate the biofilm from the keratinocytes allows certain methods to be utilized for
study without cross contamination (i.e. microarray analysis), iii) BCM can be produced in
relatively large quantities and stored at -20 °C for future study.
Keratinocytes interacted with S. aureus biofilm in two ways: i) The biofilm co-
culture model: Matured (three day old) S. aureus biofilms were placed in co-culture with
confluent human keratinocytes or, ii) Bacterial conditioned medium model: S. aureus
biofilms were matured for three days, placed in fresh growth medium, and after 24 hours,
the biofilm conditioned medium was collected and given to confluent keratinocytes. A
comparable co-culture model incorporating planktonic bacteria could not be readily
devised. Planktonic cultures are maintained with constant agitation. This growth
parameter for planktonic bacteria does not facilitate normal growth in mammalian cell
cultures. Directly adding planktonic cells to keratinocytes would introduce effects caused
by direct cell-cell contact between the host and pathogen, and the bacteria could be
argued to form a biofilm over time. The fragile nature of the tissue culture insert
membrane eliminated the possibility of agitating planktonic cultures inside of an insert
with a magnetic stir bar or other mechanical mechanism. Because of these limitations,
soluble excreted products from planktonic or biofilm S. aureus cultures grown in
isolation and their effects on human keratinocytes were initially examined.
Page 79
65
A planktonic culture similar in physiology, closely resembling the stationary
growth of a biofilm, with similar cell densities was desired for comparison to the effects
of S. aureus biofilm on human keratinocytes. To obtain such a culture, mature three day
old biofilms were re-suspended into growth medium and grown at 37°C with constant
agitation. This method effectively reverted S. aureus cells from a biofilm growth phase
back to a planktonic growth phase.
Both the biofilm and planktonic cultures had comparable population densities and
similar amounts of extracellular DNA and protein in the conditioned medium. 1D SDS-
PAGE revealed that BCM and PCM consisted of different protein compositions rather
than one simply having more or less of the same protein than the other. Smearing of the
BCM samples indicated the presence of bacterial proteases. The presence of bacterial
proteases in BCM may contribute to the pathogenesis of chronic wounds. Bacterial DNA
has been shown to induce innate immune responses through recognition of conserved
bacterial motifs [168]. Additionally, the presence of a narrow range of small fragments
of extracellular DNA (~50-100 bp) in BCM may be indicative of nuclease activity in
BCM. DNA processing by nucleases has been attributed to its pro-inflammatory nature
in S. aureus [169].
Anoxic niches exist in bacterial biofilms, but the effect of oxygen deprivation
caused by bacterial biofilms on the wound healing process has not been fully
investigated. Increased oxygen levels in wounded tissue promotes the healing process by
stimulating several activities including, degradation of necrotic wound tissue [170],
collagen production [171, 172], neovascularization [173], phagocytosis [174], and
Page 80
66
neutrophil-mediated oxidative microbial killing [175]. Presumably, oxygen levels in
infected wounds would quickly be consumed by bacterial biofilms leading to the
inhibition of the healing process. Oxygen levels in infected wounds are lower than
oxygen levels in healthy skin [176]. Available oxygen in infected wounds has been
shown to be primarily consumed by immune cells during the production of ROS to fight
the invading microorganisms, leaving essentially no oxygen for the wound healing
process [177].
S. aureus biofilms cultured in ambient air produced the mixed acid fermentation
products propionate, formate, lactate, and acetate (Figure 9). These results indicated that
S. aureus biofilms in our in vitro model harbor an anoxic niche. The presence of mixed
acid fermentation products in BCM and not in PCM indicated that planktonic cultures of
S. aureus were not growing in an anoxic environment. Planktonic anoxic cultures of S.
aureus produced fermentation products found in BCM further supporting the presence of
an anoxic core in the biofilm (Figure 11). Although several metabolites were shared
between anoxic planktonic cultures and BCM, BCM is best described as a mix between
the anoxic and aerobic metabolic profiles generated by NMR based metabolite profiling.
However, the biofilm does contain unique metabolic profiles not found in the planktonic
cultures, such as preferential amino acid metabolism over other available carbon sources
such as glucose. Additionally, propionate, formate, lactate, and acetate production by
bacterial biofilms in the oral cavity are known to be cytotoxic to human gingival
keratinocytes, leading to damage of the gingival epithelium [178, 179]. The production
Page 81
67
of fermentation products by S. aureus biofilm may contribute to the pathogenesis/
persistence of chronic wounds.
S. aureus biofilm caused an increase in pH in BCM (Figure 12). Additionally, S.
aureus biofilms preferentially consume amino acids. Amino acid metabolism could lead
to the liberation of the observed fermentation products, releasing ammonia through the
deamination of amino acids, explaining the increase in pH in BCM. An increase in
wound pH would inhibit the highly regulated progression of wound healing.
Bacterial conditioned medium and the EPI control in contact with keratinocytes
for four hours produced mixed acid fermentation products (Figure 10). Fermentation
products which were not present in PCM samples were present in PCM after contact with
keratinocytes indicating that the keratinocytes were responsible for their production. The
fermentation products produced by the keratinocytes are likely due to reduced levels of
key nutrients such as glucose and amino acids originally present in the EPI culture
medium. These depleted conditions may lead to the initiation of alternative metabolic
pathways accounting for the production of the observed fermentation byproducts. The
production of lactate by keratinocytes under all conditions including controls was
observed. Lactate production by keratinocytes in vivo and in vitro helps to maintain the
normally acidic nature of the skin, and the increased production of lactate in epidermal
cultures in response to bacterial infection has been described [180].
NMR metabolite profiling provided a representation of hydrophilic compounds
present in BCM. The presence of hydrophobic molecules was investigated using
HPLC/MS. Hydrophobic molecules are, in general, more toxic to mammalian cells. This
Page 82
68
is due to several factors including the accumulation of hydrophobic compounds in cell
membranes and fatty tissues, the production of harmful ROS during their metabolism,
and the transformed intermediates that are produced during their metabolism are often
more harmful than the parent compound.
Two hydrophobic compounds were found to be produced in relatively high
quantities by S. aureus biofilm relative to S. aureus planktonic cultures. While this
dissertation was in preparation, Wyatt et al published the structures of two small non-
ribosomal peptides produced by S. aureus which they named aureusimine A and
aureusimine B [167]. Aureusimine A and B were found to regulate virulence genes in S.
aureus and a mutant incapable of aureusimine production (ΔausA) was not as virulent as
the wild type. The small, hydrophobic molecules discovered in high quantities in BCM
described in this dissertation were determined to be the aureusimines described by Wyatt
et al.
The presence of aureusimine A and B in all Gram positive organisms tested
suggests that this is a common metabolite produced during biofilm growth in many Gram
positive species of bacteria (Table 6). Most importantly, aureusimine production was
found to be several orders of magnitude higher in BCM relative to PCM. The higher
levels of production of these molecules by S. aureus biofilm may induce the biofilm to
become more virulent. This family of molecules could potentially be a therapeutic target
for Gram positive species of bacteria in biofilm based diseases.
Wyatt et al isolated the aureusimines from planktonic cultures grown under
fermentative conditions suggesting that a lack of oxygen may play a role in the
Page 83
69
production of these molecules. The lower production of aureusimines in planktonic
aerobic cultures of S. aureus relative to planktonic anoxic cultures suggests that
aureusimine production is dependent upon an anoxic environment. The high production
of aureusimine A and B in S. aureus BCM relative to PCM could be due to the anoxic
niche present at the core of the biofilm. The relationship that these molecules share with
oxygen availability and biofilm formation in S. aureus could possibly correlate with S.
aureus virulence in general. Wounds infected with S. aureus biofilm could theoretically
contain higher levels of aureusimine A and B due to the low oxygen tension induced by
both the immune ROS burst, lack of functional vascularization, ischemia, and the anoxic
nature of the biofilm.
Limitations of the in vitro model described in this dissertation are associated
mainly with the biofilm and include the limited use of anaerobic bacteria, bacteria that
swarm, and the absence of any physical contact between the biofilm and mammalian
cells. Anaerobic bacteria cannot be incorporated into the co-culture version of this model
as pure cultures due to the requirement of oxygen by the mammalian cell culture. This
drawback may be overcome through the production of anaerobic bacteria conditioned
medium in the absence of cultured cells. Alternatively, multispecies biofilms are capable
of harboring anaerobic cultures due to pre-established anoxic niches deep within the
biofilm. It was observed that bacteria that are capable of swarming (i.e., some isolates of
Pseudomonas aeruginosa) quickly form a lawn of bacteria on the culture insert resulting
in higher bacterial loads than intended. Non-motile species are ideal, but some strains
capable of locomotion were found to form stable biofilms. Additionally, a lawn of
Page 84
70
bacteria on the culture insert would likely deprive the cultured cells below the insert of
oxygen.
A lack of physical contact between the biofilm and host cells absolutely
influences any result observed utilizing this model. While this is very useful when
techniques are employed that require the separation of the host and pathogen for analysis,
effects induced by direct host/pathogen contact may be overlooked. These limitations are
tolerable when taken in the light of the evidence presented in this dissertation.
Experiments utilizing this in vitro model have provided clues about the potential effects
of soluble products produced by bacterial biofilms in chronic wounds. Bacterial biofilms
are widely accepted as the native phenotype in many natural settings including chronic
wound infections. The underlying principal of this model could be applied to other
infectious diseases by simply substituting bacterial species and cell cultures to suit
various diseases. Studying the effects of bacterial biofilms rather than planktonic
cultures using this in vitro model provides a more relevant way to study the biology of
chronic wound biofilm infections.
Page 85
71
CHAPTER 5
S. AUREUS BIOFILM CONDITIONED MEDIUM INDUCES A DISTINCT
INFLAMMATORY RESPONSE AND INHIBITS PROCESSES ASSOCIATED WITH
EPITHELIALIZATION IN HUMAN KERATINOCYTES
Introduction
Chronic wounds are unable to coordinate the phases of wound healing leading to
an inflammatory environment in the wounded area that is unable to epithelialize.
Keratinocytes are the main cell type in the epidermis and are essential in both the
inflammatory and re-epithelialization phases of wound repair. The presence of bacterial
biofilm in non-healing wounds is assumed by a growing number of physicians and
clinicians to contribute significantly to the persistent nature of the wound. Often, patients
with chronic wounds acquire pathogenic bacteria such as S. aureus through routine visits
to hospitals and/or clinics. S. aureus is an important human pathogen that is associated
with several skin diseases. The correlation of bacterial biofilms with chronic infections
and not acute infections suggests that differential routes of pathogenesis in infected skin
[41]. The effects of S. aureus planktonic and biofilm conditioned medium on wound
healing processes in human keratinocytes were investigated using the in vitro biofilm
disease model described in the previous chapter.
Materials and Methods
Cell Culture
As described in Chapter 4.
Page 86
72
Bacterial Strains and Culture Conditions
As described in Chapter 4.
Conditioned Medium Microarray
Human foreskin keratinocytes (HFKs) were grown to 90% confluency in six well
plates. Cells were then treated with 2 ml BCM, PCM, or fresh EPI for four hours. After
treatment, the medium was removed and RNA was isolated using an RNeasy minikit
(Qiagen, Valencia, CA) following the manufacturer’s instructions for adherent cells.
Extracted RNA was then ethanol precipitated and resuspended in water as previously
described [181]. The following steps were performed at the Functional Genomics Core at
Montana State University. RNA concentrations and purity were determined by
measuring absorbencies at 260nm and 280nm on a GeneQuant spectrophotometer. RNA
quality was evaluated using the RNA 6000 NanoChip assay on a 2100 Bioalyzer (Agilent
Technologies, Palo Alto, CA). RNA integrity number results for all samples used
exceeded 9.5 on a scale to 10.
Total RNA (500ng) was reverse transcribed, and amplified and biotin-labeled via
in vitro transcription using the MessageAmp Premier kit (Ambion). The resulting cRNA
was fragmented and hybridized to Affymetrix GeneChip Human Genome U133A 2.0
arrays (#900468, Affymetrix, Santa Clara, CA) at 45oC for 16 hours with constant
rotational mixing at 60 rpm. Washing and staining of the arrays was performed using the
Affymetrix GeneChip Fluidics Station 450. Arrays were scanned using an Affymetrix
GeneChip Scanner 7G and GCOS software version 1.4.
Page 87
73
Microarray data were analyzed using FlexArray version 1.4. The Affymetrix
CEL files were imported and normalized using GC-RMA. Genes were filtered for
threshold signal intensities of at least 50 in one biological replicate. Analysis of Variance
(ANOVA) was performed to identify statistically significant differences among the three
conditions. 910 genes were identified (p-value < 0.01). The gene list was further
trimmed to identify genes with fold-change differences of at least 1.5 in any comparison,
resulting in 575 genes. The log2 values were imported into Genesis [182] for
visualization and hierarchical clustering. Subsequent functional enrichment analysis was
conducted using the database for annotation, visualization and integrated discovery
(DAVID) software [183]. Data were submitted to Gene Expression Omnibus (NCBI)
under accession GSE24118. A complete list of genes significantly regulated can be
found in Appendix C.
Co-Culture Microarray
HFKs were grown to 90% confluency in six well plates. Mature S. aureus biofilms (three
day old) grown on tissue culture inserts were placed in contact with the keratinocytes for
24 hours. After this time, RNA was extracted from the keratinocytes. RNA was sent to
Research and Testing Laboratory (Lubbock, TX) and quantified using a
spectrophotometry system (NanoDrop Technologies, Wilmington, DE). RNA quality
was confirmed using a BioRad Experion system (BioRad, Hercules, CA). For each
sample, 5 µg of RNA was converted to cDNA and labeled with either CyDye3-dCTP or
CyDye5-dCTP (PerkinElmer , Waltham, MA) in a crossover dyeswap design using the
LabelStar kit (Qiagen Inc.) and random nonomers (Integrated DNA Technologies,
Page 88
74
Coralville, IA ). Labeled cDNA was hybridized to the microarray using Agilent Hi-RPM
hybridization solution in an Agilent Hybridization chamber (Agilent Technologies, Santa
Clara, CA). A total of 8 arrays based upon the Agilent Human GE 4x44K v2 Microarray
(4 biological replicates), were analyzed to obtain genes that were consistently and
differentially regulated. Microarray images were captured using a Genepix 4000B
(Molecular Devices Corporation, Union City, CA) laser scanner and images processed
using GenePix 6.0 software (Molecular Devices Corporation). Microarray data analyses
were performed using Acuity 4.0 software (Molecular Devices Corporation, Union City,
CA). The signal intensity of each gene was globally normalized using LOWESS within
the R statistics package. The normalized data was analyzed using commercial SAS 9.1.3
program (SAS Institute Inc. Cary, NC). An approximate F test on least-square means
was used to estimate the significance of difference for each gene in each comparison.
Data were analyzed based upon log ratio (635/532) values. Genes were included in the
final dataset that exhibited at least 2.0-fold comparative regulation and p-values corrected
for multiple comparisons based upon False Discovery Rate (FDR) < 1% (Benjamini-
Hochberg p < 0.01). Annotations and functional enrichment analyses were derived using
the DAVID website (david.abcc.ncifcrf.gov) to evaluate functional clustering and
functional category enrichments with Homo sapiens as the background genome. Data
were submitted to Gene Expression Omnibus (NCBI) under accession GSE24370. A
complete list of genes significantly regulated can be found in Appendix D.
Page 89
75
RT-qPCR
Keratinocytes were grown to 90% confluency in six well plates. Cells were then
treated with BCM, PCM, or fresh EPI for various times. After treatment, the medium
was removed and RNA was isolated using an RNeasy minikit (Qiagen, Valencia, CA)
following the manufacturer’s instructions for adherent cells. Extracted RNA was then
ethanol precipitated as previously described [181]. RNA pellets were resuspended in 30
µl of water and quantified using the NanoDrop® ND-1000 UV-vis spectrophotometer
(Thermo Fisher Scientific Inc. Wilmington, DE). Reverse transcription PCR (RT-PCR)
was performed using the QuantiTech reverse transcription kit (Qiagen, Valencia, CA)
following the manufacturer’s instructions using 500 ng of template RNA. Quantitative
PCR (qPCR) was carried out using the QuantiFast SYBR green PCR kit (Qiagen,
Valencia, CA). All reactions contained 2 µl cDNA and 300 nM of each primer.
Validated qPCR primer sets for CYP1A1 and CYP1B1 were purchased from
SABiosciences, Frederick, MD.
Microscopy
Keratinocytes were grown to 80–90% confluence on 18 mm2 cover slips placed in
six-well plates. Afterwards, the keratinocytes were exposed to 2 ml of BCM or PCM.
After various times of exposure, the keratinocytes were fixed in 4% paraformaldehyde in
phosphate-buffered saline (PBS) for 15 minutes at 37 °C followed by three 5 minute
washes in PBS. Cells were then permeablized with 0.2% Triton-X 100 for 5 minutes at
room temperature, followed by three 5 minute washes in PBS. Keratinocytes were then
stained for F-actin (BODIPY phalloidin, Invitrogen, Carlsbad, CA), β-tubulin (anti β-
Page 90
76
tubulin monoclonal antibody conjugated to AlexaFluor 568, Cell signaling Technology,
Danvers, MA) and DNA (TOPRO-3 Iodide, Invitrogen) following the manufacturer's
instructions. The slides were then mounted using Vectashield® H-1000 (Vector
Laboratories, Burlingame, CA) and imaged immediately. Laser scanning confocal
microscopy (LSCM) was performed on a Leica TCS-SP2 AOBS confocal microscope
with a 100x oil immersion objective unless otherwise noted. Control cultures were also
stained and consisted of keratinocytes exposed to EPI.
Time lapse microscopy on keratinocytes exposed to BCM, PCM, or EPI was
performed using light microscopy. Keratinocytes were grown to 80–90% confluence in
35 mm non-coated glass bottom Petri dishes (MatTek, Ashland, MA). Two hours before
imaging, both the keratinocytes and the experimental solution were placed at room
temperature to allow the temperature to equilibrate. Immediately before imaging, the cell
culture medium was exchanged to the experimental solution and the cells were imaged
using a 16x or 60x water immersion objective. Bright-field images were captured every
45 seconds for 4 hours with an 18-ms exposure rate.
Terminal Deoxynucleotidyl Transferase
dUTP Nick End Labeling (TUNEL) Assay
TUNEL staining was used to investigate the induction of late stage apoptosis.
Keratinocytes were grown to 80–90% confluence on 18 mm2 cover slips placed in six-
well plates. Afterwards, keratinocytes were exposed to 2 ml BCM, PCM, or EPI. At
various time points, keratinocytes were fixed in 4% paraformaldehyde in PBS for 15
minutes at 37 °C followed by three 5-minute washes in PBS. The APO-BrdU TUNEL
Page 91
77
Assay Kit (Invitrogen, Carlsbad, CA) was used following the manufacturer's staining
protocol with one modification. Keratinocytes were not brought into suspension; rather,
all enzyme solutions were made in the same proportions suggested by the manufacturer,
and were added directly to the coverslip. Coverslips were then imaged using a Nikon
Eclipse E800 epifluorescent microscope using a 10x oil immersion objective. For
analysis, four images of each condition were taken and the numbers of adherent cells
staining positive for TUNEL (total cell number positive for apoptosis) or propidium
iodide (total cell number) were counted and the percentage of cells staining positive for
TUNEL was calculated.
Measurement of Intracellular Calcium
Fluo-4 AM (Invitrogen, Carlsbad, CA) was used to assay intracellular calcium
levels in keratinocytes after exposure to BCM or PCM. Two mls of a 3 µM solution of
Fluo-4 AM was prepared in fresh EPI and incubated at room temperature with 80-90%
confluent keratinocytes grown in glass bottom microwell dishes (MatTek Corporation,
Ashland, MA) for 30 minutes. Cells were washed twice with room temperature PBS for
5 minutes. Three mls of EPI, BCM, or PCM were then added to fluo-4 AM loaded cells.
Images were captured every 45 seconds for four and one half hours on a Leica TCS-SP2
AOBS confocal microscope with a 63X water immersion objective.
Cytokine Detection by Enzyme-Linked Immunoassays (ELISA)
Confluent HaCaT keratinocytes in 6-well plates were cultured in the presence of 2
ml bacterial conditioned medium (BCM or PCM) or EPI for various exposure times. Cell
Page 92
78
culture supernatants were collected and analyzed by colorimetric sandwich ELISA for
IL-1β, IL-6, TNF-α, CXCL-8, CXCL-1, and GM-CSF (R&D Systems, Minneapolis,
MN) following the manufacturer’s instructions. ELISA data were normalized to
adherent, non-apoptotic cell numbers using the delta method.
Detection of MAPK Phosphorylation Using Cell-Based ELISAs
HaCaT keratinocytes were grown to confluency in clear bottom black 96-well
plates. HaCaT cells were treated with 100 µl BCM, PCM, or EPI for various times.
Total and phosphorylated MAPKs (JNK, p38, and ERK) were detected simultaneously
using a cell-based ELISA (R&D Systems, Minneapolis, MN) following the
manufacturer’s instructions.
Inhibition of MAPK
The p38 MAPK inhibitor, SB203580 (4-[4-fluorophenyl]-5-[4-pyridyl]-1H-
imidazole); the ERK inhibitor, U0126 (1,4-diamino-2,3-dicyano-1,4-bis[2-aminophenyl-
thio]butadiene); and the JNK inhibitor, SP600125 (anthrax(1–9-c-d)pyrazol-6(2H)-one;
1,9-pyrazoloanthrone) were prepared as 10 mM DMSO stocks (Cayman Chemicals, Ann
Arbor, MI). HaCaT keratinocytes were pretreated with individual inhibitors or a
combination of all three inhibitors (10 µM each, 0.1% DMSO) in EPI growth medium for
one hour. Cells were then treated with PCM or BCM supplemented with 10 µM
inhibitor(s) for four hours. Cell culture supernatants were collected and analyzed by
ELISA for cytokine production. HaCaT keratinocytes treated with PCM or BCM
supplemented with 0.1% DMSO were prepared as vehicle controls.
Page 93
79
Results
Epithelialization
S. aureus Biofilms Induce Changes in Keratinocyte Morphology. Initial
experiments with both the co-culture biofilm and BCM models revealed massive changes
in cell morphology in keratinocytes. Similar changes in morphology were observed in
primary human fibroblasts exposed to BCM as well (Appendix E). Keratinocytes
exposed to BCM underwent rapid changes in morphology with the first signs occurring
about an hour after exposure and major changes occurring after 90 minutes (Figure 19).
BCM induced changes included the formation of spiny dendritic-like structures, rounding
of the cell body, cell retraction, and condensation of the nucleus. Keratinocytes exposed
to S. aureus biofilm in the co-culture model showed the same morphological changes, but
on a longer timescale with changes occurring after 10-12 hours.
Page 94
80
Control
BCM
Time (minutes)
0 30 60 90 120 150
150
150
Figure 20. Time lapse microscopy of foreskin keratinocytes in contact with BCM. BCM induces a rapid change in cell
morphology with cells losing adhesion to the bottom of the plate and each other as cells begin to retract. At 90 minutes
the cell body rounds and comes out of the focal plane while spiny dendritic like extensions extend from the cell in the
focal plane indicating that the dendritic like extensions are formed on the surface of the dish. Dendritic like extensions
and rounded cell bodies can be viewed in the enlarged image of BCM treated keratinocytes at 150 minutes. Control
and PCM treated cells do not show these characteristic changes in morphology. 60x water immersion objective, bar
represents 20 µm.
Page 95
81
The observed morphological changes induced by both BCM and S. aureus biofilm
in the co-culture model likely involved re-arrangement of major cytoskeletal structure
proteins such as filamentous actin (F-actin) and tubulin. F-actin and β-tubulin were
imaged by LSCM to obtain more insight into the specific morphologies of these major
cytoskeletal components in keratinocytes treated with BCM and PCM. HFKs and HaCaT
keratinocytes were exposed to BCM, PCM, or EPI, stained, and imaged using LSCM
(Figure 20).
Microtubules in BCM treated cells formed dense cables around the periphery of
severely affected keratinocytes with projections protruding from the body of the cell.
Stabilization of microtubules with the anti-cancer drug Taxol (Paclitaxel) inhibited the
characteristic BCM induced morphology changes (Figure 21). The actin cytoskeleton
formed several spiny dendritic like structures that did not positively stain for β-tubulin
after exposure to both S. aureus biofilm and BCM (Figure 20).
Page 96
82
Tubulin
EPI
A
ActinB
*
OverlayC
PCM
D E F
BCM
G H I
*
Figure 21. CSLM of HaCaT keratinocytes exposed to EPI, PCM, or BCM. BCM treated cells have an altered
microtubule (Green) structure with microtubules polymerizing around the periphery of the cell body (arrows, G). The
actin cytoskeleton (Red) formed several spikes extending from the cell body (arrows, H), which itself stains weakly for
F-actin (*, H). Morphology of PCM treated cells was similar to that of control cells with the notable exception that no
cells were observed to be undergoing mitosis, as observed in control cells (*, C). 100x oil objective, bars represent 15
µm.
PCM treated cells and control cells shared a similar morphology of branched
networks of microtubules and microfilament structures. Identical morphological changes
were observed in both the HaCaT cell line and HFKs (Compare Figure 20 and Figure 22)
and with BCM derived from several different strains of S. aureus including methicillin
resistant and susceptible strains. Disorganization of the microtubule and microfilament
Page 97
83
networks in keratinocytes stimulated with BCM likely inhibits keratinocyte proliferation
and migration which would lead to impaired wound healing. In addition to cytoskeletal
rearrangements, microarray analysis revealed that BCM induced the expression of the
small GTPase Gem, which is involved in regulating cytoskeletal architecture (Appendix
F).
EPI
BCM +Taxol
BCM
EPI +Taxol
Figure 22. Pretreatment of keratinocytes with Taxol prior to exposure to BCM prevented the characteristic morphology
changes induced by BCM. BCM +Taxol treated cells resemble the morphology of EPI +Taxol treated cells. 60x water
immersion objective, bar represents 20 µm.
Page 98
84
S. aureus Biofilms Induce Apoptosis in Human Keratinocytes
In addition to the formation of dendritic like extensions, changes in nuclear
morphologies were apparent in BCM treated keratinocytes. Nuclei of BCM treated cells
were highly fragmented indicating late stage apoptosis while control and PCM treated
cells retained normal nuclear morphologies (Figure 22). BCM was also found to reduce
peroxisome and lysosome levels in BCM treated HFKs (Appendix G).
A B C
D E F
Figure 23. HFKs stained for F-actin (green) and nuclei (blue) after 24 hours of exposure to BCM, PCM, or EPI. Top
row: Overlaid images of F-actin and nuclei. Bottom row: Images of nuclei associated with images in top row.
Keratinocyte control cells (A, D). Keratinocytes treated with PCM (B, E). Keratinocytes treated with BCM (C, F).
PCM treated cells and control cells have normal nuclear morphologies (D, E) while BCM treated cells show highly
fragmented nuclei indicating late stage apoptosis (F). 100x oil objective, bars represent 15µm.
Page 99
85
Nuclear fragmentation associated with late stage apoptosis in BCM treated
keratinocytes was further examined using TUNEL. The percentage of HFKs and HaCaT
keratinocytes staining positive for apoptosis is shown in Figure 23 and Figure 24,
respectively. Additionally, it was found that BCM treated HFKs and HaCaT cells
detached from the bottom of the culture dish after 24 hours (Figure 24). Human foreskin
fibroblasts were also observed to undergo apoptosis after exposure to BCM (Appendix
E).
Figure 24. Percentage of HFK cultures staining positive for terminal deoxynucleotidyl transferase dUTP nick end
labeling (TUNEL). Note: The control cultures had zero positive TUNEL staining in adherent cells at all time points.
Results represented as mean ±standard deviation, n=3. *Significantly different from controls at p < 0.005.
Page 100
86
0
10
20
30
40
4 24
% (+
) TU
NEL
Time (h)
EPI
PCM
BCM
**
**B
0
1000
2000
3000
4000
5000
6000
4 24
Cel
l Co
un
ts
Time (h)
EPI
PCM
BCM**
A
Figure 25. A. Total cell counts from propidium iodide stained HKs. B. Percentage of HKs staining positive for
TUNEL, indicating late stage apoptosis. TUNEL data represents positive TUNEL cell counts over total cell counts
from (A). Results represented as mean ± standard deviation, n=4 (**, p<0.01).
Apoptosis was induced at significantly greater levels in both HFK and HaCaT
keratinocytes compared to controls after exposure to BCM. Apoptotic cell levels were
similar in both control and PCM treated cells. Interestingly, unknown cell types present
in the HFK culture and absent in the HaCaT cell line were found to be resistant to
apoptosis after 48 hours of exposure to BCM (Appendix H). These novel results show
that soluble products secreted by S. aureus biofilm are sufficient for the induction of
apoptosis and direct contact is not required while soluble products from planktonic S.
aureus do not induce apoptosis in HFKs or HaCaT keratinocytes.
Page 101
87
Increase of Intracellular Calcium
Levels in BCM Stimulated Keratinocytes
Release of intracellular calcium stores often mediate changes in cell morphology
and apoptosis. The calcium sensitive dye fluo-4 AM was used to measure relative levels
of intracellular calcium release in human keratinocytes exposed to PCM or BCM.
Time (minutes)
0 30 60 90 120 150
0 30 60 90 120 150
BCM/Fluo-4
BCM/ Morphology
PCM/Fluo-4
EPI/Fluo-4
Figure 26. CSLM time lapse microscopy revealed intracellular calcium levels increase in BCM treated HFKs (green
fluorescing cells) as indicated by the calcium sensitive dye Fluo-4 AM. Intracellular levels of calcium began to
increase significantly at about the same time changes in morphology were observed in BCM treated cells. The lack of
fluorescence in PCM treated cells indicates that intracellular calcium levels do not increase in response to PCM. 60x
water immersion objective, bars represent 15 µm.
A significant increase in calcium levels in BCM treated cells over control levels
correlated well with the time the observed morphology changes took place (Figure 25).
Intracellular calcium levels were increased after 4 hours of exposure to BCM while PCM
induced intracellular calcium levels remained near or below background. When
keratinocytes were incubated with BCM or PCM for 21 hours and spiked with Fluo-4, a
Page 102
88
rapid increase in intracellular calcium was again observed in BCM stimulated
keratinocytes (Figure 26). These data indicate that BCM induces continual stimulation
of intracellular calcium in keratinocytes.
0.00E+00
2.00E+03
4.00E+03
6.00E+03
8.00E+03
1.00E+04
1.20E+04
1.40E+04
0 0.5 1 1.5 2 2.5 3 3.5 4 4.5 5
Re
lati
ve F
luo
resc
en
ce U
nit
s
Time (h)
BCM
PCM
EPI
-1.00E+04
0.00E+00
1.00E+04
2.00E+04
3.00E+04
4.00E+04
5.00E+04
6.00E+04
7.00E+04
8.00E+04
21 22 23 24
Re
lati
ve F
luo
resc
en
t U
nit
s
Time (h)
BCM
PCM
EPI
Figure 27. Relative levels of intracellular calcium in HaCaT cells exposed to BCM, PCM, or EPI were measured with
a fluorescent plate reader using the calcium sensitive dye fluo-4 AM. BCM induces the release of relatively more
intracellular calcium than control or PCM treated cells. Error bars represent standard deviation of the mean of 6
experiments.
Page 103
89
Inflammation
S. aureus Biofilm Upregulates Genes Associated with Inflammation in Human
Keratinocytes. The transcriptional response of HFKs exposed to BCM or S. aureus
biofilm in the co-culture model were examined. Transcriptional responses in HFKs
exposed to PCM or BCM were analyzed after 4 hours of stimulation. The effects of S.
aureus biofilm on the transcriptome of HFKs in the co-culture model were examined
after 24 hours of co-culture. This 24 hour time point is comparable to the conditioned
medium experiments since BCM and PCM were harvested after 24 hours of bacterial
conditioning. A shorter exposure time (4 hours) to bacterial conditioned medium was
examined since bacterial products present in the growth medium were assumed to be at
higher initial concentrations. Additionally, at 4 hours keratinocytes exposed to BCM had
already undergone the observed morphology changes but had not yet started late stage
apoptotic programs. These two approaches were taken to evaluate transcriptional
response of keratinocytes exposed to planktonic or biofilm bacterial products in the
conditioned medium or continual communication through secreted products between
keratinocytes and S. aureus biofilm in the co-culture model.
Analysis of microarray data revealed changes in several genes related to a pro-
inflammatory response. Several of the inflammatory genes upregulated by BCM
included pro-inflammatory cytokines and chemokines (Table 7).
Page 104
90
Table 7. Pro-inflammatory genes upregulated in BCM treated HFKs.
Gene Name Gene Symbol
PCM v
control
BCM v
Control
BCM v
PCM p-value
Pro-Inflammatory
interleukin 8 IL8 6.14 64.43 10.49 4.01E-07
chemokine (C-X-C motif) ligand 2 CXCL2 6.21 62.11 10.00 3.08E-07
tumor necrosis factor alpha TNF α 3.05 27.73 9.10 4.00E-05
chemokine (C-X-C motif) ligand 3 CXCL3 1.82 12.23 6.72 6.65E-04
interleukin 6 IL6 1.06 3.40 3.20 1.79E-03
vascular endothelial growth factor A VEGFA 3.93 8.08 2.05 1.12E-04
colony stimulating factor 3 (granulocyte) CSF3/G-CSF 1.54 2.84 1.84 6.73E-05
colony stimulating factor 2 (granulocyte-macrophage) CSF2/GM-CSF 2.43 4.24 1.75 5.36E-04
chemokine (C-X-C motif) ligand 1 CXCL1 13.86 20.81 1.50 5.34E-04
chemokine (C-C motif) ligand 20 CCL20 12.01 13.92 1.16 2.94E-03
Fold Change (4 h)
These pro-inflammatory genes were upregulated in PCM treated cells relative to
control cells as well, with the exception of IL-6, which was not significantly induced in
HFKs exposed to PCM. BCM treated keratinocytes showed a much stronger induction of
pro-inflammatory genes indicating that S. aureus BCM induced a stronger pro-
inflammatory transcriptional response than PCM.
Page 105
91
Table 8. Inflammatory genes significantly regulated in HFKs in the S. aureus biofilm co-culture model after 24 hours
of co-culture. P<0.01.
Fold Change
(24 h)
Gene Name Gene Symbol
Biofilm v
control
Cytokines and Chemokines
Interleukin 6 IL6 12.31
Interleukin 8 IL8 11.41
Chemokine (C-C Motif) Ligand 7 CCL7 11.25
Interleukin 24 IL24 9.83
Colony Stimulating Factor 2 (Grannulocyte/Macrophage) CSF2/GM-CSF 7.75
Interleukin 1 β IL1B 6.97
Chemokine (C-X-C motif) ligand 2 CXCL2 4.34
Chemokine (C-X-C motif) ligand 3 CXCL3 3.75
Chemokine (C-X-C motif) ligand 5 CXCL5 3.66
Chemokine (C-C Motif) Ligand 2 CCL2 3.44
Chemokine (C-X-C motif) ligand 1 CXCL1 3.24
Chemokine (C-X-C motif) ligand 6 CXCL6 3.10
Colony Stimulating Factor 3 (Grannulocyte) CSF3/G-CSF 2.41
Interleukin 1 α IL1α 2.32
Tumor Necrosis Factor Ligand Superfamily Member 15 TNFSF15 2.11
Prostaglandin Production
Cylcooxygenase 2 PTGS2/COX-2 4.46
Prostaglandin E Synthase PTGES 2.09
Phospholipase A2, Group Iva PLA2G4A 1.50
A similar pro-inflammatory transcription profile was observed in the 24 hour co-
culture microarray data (Table 8). Genes involved in prostaglandin synthesis were
upregulated in keratinocytes in the co-culture model indicating further activation of pro-
inflammatory networks. Several transcription factors that regulate inflammation were
upregulated in keratinocytes treated with BCM (Table 9). Many of the upregulated
transcription factor genes belong to the AP-1 family of transcription factors.
Page 106
92
Table 9. Transcription factors induced in PCM and BCM treated HFKs after four hours of contact. Several members
of the AP-1 family of transcription factors were induced in BCM treated cells. Other transcription factors such as
EGR1 and NFkBIA indicate the regulation of other signaling pathways known to mediate inflammatory responses.
Gene Name Gene Symbol
PCM v
control
BCM v
Control
BCM v
PCM p-value
Transcription
AP-1 family of transcription factors
v-fos FBJ murine osteosarcoma viral oncogene homolog c-FOS 1.01 43.58 42.97 2.59E-03
activating transcription factor 3 ATF3 1.42 13.63 9.61 1.06E-03
jun oncogene c-JUN 1.78 3.64 2.05 3.54E-05
jun B proto-oncogene JUNB 2.31 3.65 1.58 1.48E-05
Other transcription factors
early growth response 1 EGR1 -1.10 17.79 19.58 4.80E-03
basic helix-loop-helix family, member e40 BHLHE40 1.44 13.58 9.46 1.40E-03
hairy and enhancer of split 1, (Drosophila) HES1 1.80 13.71 7.62 8.00E-05
zinc finger protein 36, C3H type, homolog (mouse) ZFP36 1.76 7.08 4.02 4.99E-05
RanBP-type and C3HC4-type zinc finger containing 1 RBCK1 1.05 1.84 1.76 4.46E-03
nuclear factor of kappa light polypeptide gene enhancer in B-cells inhibitor, αNFKBIA 2.35 3.65 1.55 1.17E-04
Fold Change (4 h)
S. aureus BCM and PCM Induce Differential
Temporal Cytokine and Chemokine Production in Human Keratinocytes
ELISA assays were used for further investigation of cytokine and chemokine
production induced in HFKs by BCM or PCM. The cytokines IL-1β, IL-6, TNF-α, GM-
CSF, and chemokines CXCL-8 and CXCL-1 were selected for further study. This battery
of cytokines and chemokines were selected based on the microarray data and for
comparison to other investigations of inflammatory responses induced by bacteria.
Page 107
93
0
200
400
600
800
1000
IL-1β IL-6 CXCL-8 CXCL-1 TNFα GM-CSF
pg/
ml
EPI
PCM
BCM
**
**
**
**
**
**
B
0
20
40
60
80
100
120
IL-1β IL-6 CXCL-8 CXCL-1 TNFα GM-CSF
pg/
ml
EPI
PCM
BCM
**
**
***
**A
Figure 28. Cytokine and chemokine levels in keratinocytes after 4 (A) or 24 (B) hours of exposure to PCM, BCM, or
EPI (pg/ml ). Error bars represent standard deviation of the average of three experiments (*, p<0.05, **, p<0.01).
Page 108
94
Cytokine production after 4 hours of stimulation was greater in BCM treated
keratinocytes than in PCM treated keratinocytes (Figure 28). After 24 hours, PCM
treated keratinocytes produced substantially more cytokines and chemokines than BCM
treated keratinocytes. The observed decrease in cell numbers and apoptotic cell death
induced by BCM were assumed to impact cytokine production. To adjust for this, cell
numbers were counted for each time point and treatment condition. The percentage of
apoptotic HaCaT keratinocytes at 4 and 24 hours (Figure 24) was used to calculate pg of
cytokine produced per 100,000 adherent, non-apoptotic cells (Figure 29).
Normalized cytokine levels revealed that BCM treated HaCaT cells initially
produced more cytokines and chemokines after four hours, in agreement with microarray
data for HFKs. Surprisingly, normalized cytokine levels in PCM treated HaCaT cells
still exhibited the highest production of all cytokines and chemokines tested after four
hours, with the exception of normalized levels of TNF-α.
Page 109
95
0
50
100
150
200
250
300
IL-1β IL-6 CXCL-8 CXCL-1 TNFα GM-CSF
pg
/10
5n
on
-ap
op
toti
c, a
dh
era
nt
cell
s
EPI
PCM
BCM
**
**
****
**A
0
1000
2000
3000
4000
5000
6000
IL-1β IL-6 CXCL-8 CXCL-1 TNFα GM-CSF
pg
/10
5n
on
-ap
op
toti
c, a
dh
era
nt
cell
s
EPI
PCM
BCM
**
**
**
**
**
*
**
B
Figure 29. Cytokine and chemokine levels in keratinocytes after 4 (A) or 24 (B) hours of exposure to PCM, BCM, or
EPI (pg protein / 100,000 non-apoptotic, adherent cells). Error bars represent standard deviation of the average of three
experiments (*, p<0.05, **, p<0.01).
Page 110
96
S. aureus BCM and PCM Differentially Modulate
MAPK Phosphorylation in Human Keratinocytes
An enrichment analysis conducted using the DAVID functional annotation
clustering tool revealed that genes associated with apoptosis, inflammation,
serine/threonine kinase cascades, and NFkB signaling were significantly overrepresented
(p < 0.05) in the set of genes upregulated in keratinocytes exposed to BCM. These data
suggested that MAPK signaling may be differentially activated in HKs treated with
BCM. Additionally, DUSP genes were more highly upregulated in BCM treated
keratinocytes relative to PCM treated keratinocytes indicating differential regulation of
MAPK cascades (Table 10). The role of MAPK signaling in PCM and BCM treated
keratinocytes was investigated by measuring phosphorylation levels of JNK, p38, and
ERK (Figure 29).
Table 10. DUSP genes are activated in keratinocytes exposed to both BCM (top) and S. aureus biofilm in the co-
culture model (bottom), but not in PCM treated keratinocytes. Differential activation of DUSP genes in BCM and
PCM treated cells indicates that MAPK pathways are differentially regulated under these conditions.
Gene Name Gene Symbol
PCM v
control
BCM v
Control
BCM v
PCM p-value
dual specificity phosphatase 1 DUSP-1 1.62 10.13 6.24 4.82E-04
dual specificity phosphatase 5 DUSP-5 2.88 2.96 1.03 5.72E-03
Fold
Change
(24 h)
Gene Name Gene Symbol
Biofilm v
control
dual specificity phosphatase 1 DUSP-1 4.13
dual specificity phosphatase 10 DUSP-10 2.95
Fold Change (4 h)
Levels of phosphorylated p38 and JNK in PCM treated keratinocytes increased
after exposure to PCM while exposure to BCM reduced phosphorylation of both JNK and
Page 111
97
p38. ERK phosphorylation was slightly increased in BCM treated keratinocytes and was
not affected in PCM treated cells.
40
60
80
100
120
140
4 24
% P
ho
sph
ory
lati
on
Re
lati
ve
to
Co
ntr
ol C
ell
s
Time (h)
A. p38
PCM
BCM
20
40
60
80
100
120
140
160
180
4 24
% P
ho
sph
ory
lati
on
Re
lati
ve
to
Co
ntr
ol C
ells
Time (h)
B. JNK
PCM
BCM
40
50
60
70
80
90
100
110
120
130
4 24
% P
ho
sph
ory
lati
on
Re
lati
ve
to
C
on
tro
l Ce
lls
Time (h)
C. ERK
PCM
BCM
Figure 30. MAPK phosphorylation in HKs exposed to PCM or BCM. Data represented as percentage of
phosphorylated p38, JNK, or ERK in control (EPI) cells. Error bars represent standard deviation, n=6, p<0.005.
If factors present in BCM were suppressing MAPK signaling cascades, then
inhibition of MAPK signaling would not have as great of an impact on downstream
targets such as cytokine and chemokine genes.
Page 112
98
0
20
40
60
80
100
IL-1β IL-6 TNF-α IL-8 CXCL-1
% C
yto
kin
e P
rod
uct
ion
Re
lati
ve to
D
MSO
Co
ntr
ol
B. JNK
PCM
BCM
**** *
*
0
20
40
60
80
100
120
IL-1β IL-6 IL-8 TNFα CXCL-1% C
yto
kin
e P
rod
uct
ion
Re
lati
ve to
D
MSO
Co
ntr
ol
A. JNK+p38+ERK
PCM
BCM
**
**
***
*
0
20
40
60
80
100
120
140
IL-1β IL-6 TNF-α IL-8 CXCL-1% C
yto
kin
e P
rod
uct
ion
Re
lati
ve to
D
MSO
Co
ntr
ol
C. p38
PCM
BCM
*
**
**
**
**
0
20
40
60
80
100
IL-1β IL-6 TNF-α IL-8 CXCL-1% C
yto
kin
e P
rod
uct
ion
Re
lati
ve to
D
MSO
Co
ntr
ol
D. ERK
PCM
BCM
** ** ***
*
Figure 31. Percent cytokine production in MAPK inhibited HK after 4 hours of exposure to PCM or BCM. Data
represented as percent DMSO control (BCM or PCM supplemented with DMSO). Error bars represent standard
deviation of the average of triplicate experiments (*, p<0.05, **, p<0.01).
To investigate the role of MAPK signaling in BCM and PCM induced cytokine
and chemokine production, the MAPK family members JNK, p38, and ERK, were
inhibited using the inhibitors SP600125, SB203580, and U0126, respectively. Levels of
GM-CSF were not analyzed in these experiments due to nearly undetectable levels at all
time points except for 24 hours of exposure to PCM (Figure 28). Inhibition of JNK, p38,
and ERK led to significant (p<0.05) decreases in cytokine and chemokine production in
PCM-treated HKs relative to BCM-treated HKs with the exception of IL-6 production in
ERK-inhibited HKs (Figure 30). The data demonstrate that in keratinocytes, MAPK
signaling is responsible for a greater percentage of PCM mediated cytokine production
than BCM mediated cytokine production. This may indicate that BCM induces cytokine
production through alternative mechanisms in keratinocytes.
Page 113
99
The effects of MAPK inhibitors on cell morphology were also investigated
(Figure 31). It was found that inhibition of individual MAPKs (JNK, p38, or ERK) or the
inhibition of all three combined did not prevent the characteristic biofilm induced
morphology in HaCaT keratinocytes. These results indicate that morphological changes
induced by BCM act through MAPK independent mechanisms. No apparent changes in
morphology were observed by light microscopy in control cells with the exception of
cells treated with all three MAPK inhibitors. Simultaneous inhibition of JNK, p38, and
ERK in control cells lead to an abnormal morphology with formation of lamellipodia like
structures along the entire perimeter of the cell and loss of cell/cell contact.
10 µM SP600125 (JNK Inhibitor)
10 µM SB203580 (p38 Inhibitor)
10 µM U0126 (ERK Inhibitor)
10 µM all 3 MAPK inhibitors
EPI
BCM
Figure 32. Inhibition of all or individual MAPKs did not have an impact on the morphology changes induced by BCM.
This indicates a MAPK independent process for cytoskeletal rearrangements induced by S. aureus biofilm secreted
factors. Control cells maintained apparently normal morphologies with the exception of treatment with all three
inhibitors. Control cells treated with all inhibitors displayed an abnormal morphology and lost contact with one and
other. 60x water immersion objective, bars represent 20 µm.
Page 114
100
XME Genes Upregulated in Human
Keratinocytes Exposed to Bacterial Secreted Products
Transcriptional analysis of keratinocytes exposed to BCM revealed that, in the
biofilm co-culture model, the monooxygenase cytochrome P450 1B1 (CYP1B1) was the
most highly upregulated gene (Table 12). A closely related family member, CYP1A1,
was the 24th
most highly upregulated gene in BCM treated keratinocytes. No CYP450
family members were found to be significantly regulated in control or PCM treated
keratinocytes. Additionally, genes of the aryl hydrocarbon receptor pathway (Figure 33)
were induced by S. aureus biofilm in the co-culture model (Table 13).
Table 11. Genes with xenobiotic metabolic activity upregulated in BCM treated keratinocytes (left) and keratinocytes
in the biofilm co-culture model (right). Genes in these groups include phase I (CYP1A1/CYP1B1) and phase II
(ALDH3B2, GSTM2, GSTM1, MPST, SHMT2, UGT1A6, and UAP1L1) XME genes. Metabolites produced by
CYP1A1 are further metabolized by aldehyde dehydrogenases, glutathione S-transferases, and UDP-
glucuronosyltransferase (UGT) transferases. Several solute carrier (SLC) proteins are also induced in the co-culture
model which function to shuttle electrphilic intermediates throughout the cell preventing them from reacting with
random cellular components causing cellular damage.
Gene Symbol
PCM v
Control 4h
BCM v
Control 4h Gene Symbol 24h Co-culture
Phase I CYP1A1 1.12 2.63 Phase I CYP1B1 12.67
Phase II ALDH3B2 1.50 1.93 Phase II SLC16A6 6.86
GSTM2 1.16 1.88 SLCO4A1 4.13
GSTM1 1.08 1.87 SLC2A3 2.89
MPST 1.47 1.75 UGT1A6 2.25
SHMT2 1.07 1.58 UAP1L1 1.93
Table 12. Genes involved in the aryl hydrocarbon receptor pathway are regulated by S. aureus biofilm secreted factors
in human keratinocytes.
Gene Symbol Fold Change
ARNT 2.04
AHRR 1.59
p23 1.58
Hsp90 -1.68
Page 115
101
CYP1A1/1B1 transcript levels were confirmed by RT-qPCR in BCM treated
keratinocytes and keratinocytes exposed to S. aureus biofilm in the co-culture model
(Figure 32). Keratinocytes in co-culture with S. aureus biofilm had higher CYP1A1/1B1
transcript levels indicating that continual contact with secreted products from the biofilm
induced a stronger induction of CYP1A1/1B1.
0
10
20
30
40
50
4 8 12
Fo
ld C
ha
ng
e
Time (h)
CYP1A1/1B1 Expression in Primary Keratinocytes
CYP1A1 Expression in Co-culture"
CYP1A1 expression in cells exposed to BCM
CYP1B1 Expression in Co-culture
CYP1B1 expression in cells exposed to BCM
Figure 33. CYP1A1 and CYP1B1 expression in HFKs exposed to either BCM or S. aureus biofilm in the co-culture
model. BCM induced lower levels of CYP1A1and CYP1B1 than did direct contact with the biofilm in the co-culture
model indicating that the biofilm may have to continuously produce virulence factors to induce CYP1A1/1B1
expression. Fold change calculated by the ΔΔCt method with GAPD as the house keeping gene. Error bars represent
standard deviation of the mean of three experiments.
Genes relating to oxidative stress and DNA damage were induced in keratinocytes
in the biofilm co-culture and in keratinocytes exposed to BCM (Table 14). The phase II
XME genes ALDH3B2 and GSTM1 and GSTM2 were induced by BCM in keratinocytes
(Table 12).
Page 116
102
Table 13. Functional enrichment using the DAVID functional analysis tool revealed several genes related to oxidative
stress and DNA damage in response to BCM.
Enrichment Score: 6.45 Count P_Value Benjamini
GOTERM_BP_FAT DNA metabolic process 54 2.50E-10 3.60E-07
GOTERM_BP_FAT DNA repair 34 6.00E-08 4.30E-05
GOTERM_BP_FAT response to DNA damage stimulus 39 2.00E-07 9.40E-05
GOTERM_BP_FAT cellular response to stress 48 3.00E-06 1.00E-03
SP_PIR_KEYWORDS DNA damage 23 8.10E-06 4.80E-04
SP_PIR_KEYWORDS dna repair 21 2.90E-05 1.60E-03
Discussion
Inflammation
Host-pathogen interactions were investigated between a clinical isolate of S.
aureus and human keratinocytes. S. aureus BCM and PCM induced distinct
inflammatory responses in human keratinocytes, in vitro. Transcriptional responses of
keratinocytes to BCM revealed the upregulation of pro-inflammatory genes, including
pro-inflammatory transcription factors and several cytokines and chemokines. ELISA
analysis of cytokine and chemokine production in keratinocytes revealed that over time,
BCM induced cytokine and chemokine levels were reduced relative to PCM treated
keratinocytes. Phosphorylation of the MAPKs JNK and p38 were also found to be
reduced by BCM while the ERK was not. Inhibition of MAPK pathways revealed that
MAPK signaling was responsible for a larger percentage of cytokine and chemokine
production in PCM treated keratinocytes compared to BCM treated keratinocytes. BCM
also induced pro-inflammatory genes involved in the aryl hydrocarbon receptor pathway
and xenobiotic metabolizing.
Page 117
103
Transcriptional Analysis of Human Keratinocytes Exposed to BCM. Microarray
analysis indicated an increase of cytokine and chemokine transcripts in keratinocytes
exposed to BCM and PCM. Several studies have investigated the inflammatory effects of
planktonic bacterial supernatants or bacterial conditioned medium on various mammalian
cell types [52, 53, 184-190]; however much less is known about the effects of biofilm
formation and the impacts on mammalian cell cultures.
Genes upregulated by PCM were in agreement with microarray data presented in
Moreilhon et al on the upregulation of pro-inflammatory genes in epithelial cells exposed
to S. aureus bacterial supernatant that was similar to PCM [52]. Peterson et al showed
similar cytokine/chemokine gene expression patterns in human vaginal epithelial cells
when exposed to late exponential phase S. aureus cultures [53]. Kumar et al reported that
mid-logarithmic-phase cultures of S. aureus planktonic-conditioned medium induce IL-6,
CXCL-8, and TNF-α in human-corneal-epithelial cells [185]. Different species of dental
bacteria were found to induce different levels of cytokine production (IL-1β, IL-6 and
CXCL-8 (IL-8)) after 4 or 24 hours of challenge in human gingival epithelial cells [48].
These differences were correlated to the virulence of the strains tested.
After four hours of contact with BCM, several genes encoding proteins belonging
to the AP-1 complex were upregulated in BCM treated cells. In BCM treated cells AP-1
components c-Fos and ATF3 were strongly induced while their change in expression in
PCM treated cells was not significant (Table 9). JUN and JUNB were upregulated by
2.05 fold and 1.58 fold in BCM treated cells, respectively, relative to PCM treated cells.
Page 118
104
After 24 hours of co-culture with S. aureus biofilm, AP-1 family members c-Fos, ATF3,
and ATF4 were induced +1.5, +4.99, and +1.90 fold, respectively.
The NFκB negative regulators TNFAIP3 (A20) and NFκBIA were upregulated
3.10 fold and 1.55 fold, respectively, in BCM treated cells relative to PCM treated cells.
Although components of the activated NFκB complex were not directly upregulated in
BCM treated cells, the expression of the negative regulators NFκBIA and TNFAIP3
indicates active regulation of the NFκB pathway.
The early growth response 1 gene (EGR1) was upregulated 19.6 fold in cells
exposed to BCM while there was not a significant change in expression levels of EGR1
in PCM treated cells. EGR1 was not significantly regulated after 24 hours in the co-
culture model. EGR1 is an early response transcription factor and regulates a variety of
cellular functions including injury induced gene expression, regulation of
pathophysiologically important genes, inflammation, apoptosis, differentiation, growth,
and development [191-193]. This result suggests that EGR1 may be important for the
biofilm induced production of an early inflammatory response in human keratinocytes.
Cytokine Production in BCM Treated Keratinocytes. The upregulation of
cytokine and chemokine transcripts in BCM stimulated keratinocytes indicated that BCM
induced a stronger inflammatory response in keratinocytes after four hours of exposure to
BCM. ELISA analysis of cytokines produced after 4 hours of BCM stimulation
confirmed microarray results. However, cytokine production in BCM treated
keratinocytes was reduced after 24 hours of contact. It was hypothesized that reduced
cell numbers and apoptotic cell death may have been responsible for the reduced level of
Page 119
105
cytokine and chemokine secretion in BCM treated cells. Cytokine and chemokine levels
normalized to non-apoptotic, adherent cells revealed that PCM treated cells still induced
higher levels of cytokines and chemokines at 24 hours compared to keratinocytes
exposed to BCM. The observed patterns of cytokine and chemokine production from
keratinocytes exposed to either PCM or BCM is analogous to the levels of cytokines
produced in sepsis and chronic inflammatory diseases.
Sepsis is characterized by uncontrollable release of massive amounts of cytokines
and is comparable to the effects of PCM on keratinocyte cytokine production. Chronic
inflammation, on the other hand, is more comparable to the effects of BCM on
keratinocytes were inflammation is induced, but a runaway self inducing inflammatory
response is not produced. The absence of GM-CSF in BCM treated cells at all time
points analyzed and GM-CSF production in PCM treated keratinocytes at 24 hours was
interesting given that GM-CSF is a mitogen for keratinocytes, and its absence in BCM
treated keratinocytes may contribute to delayed re-epithelialization.
MAPK Signaling. The transcription factors NFkB, EGR1, and AP-1 are
upregulated in several cell lines by diverse extracellular signals that activate MAPK
signaling resulting in increased production of cytokines and chemokines [194-196].
Additionally, keratinocytes function in innate immunity through the activation of MAPK
signaling cascades mainly through TLR activation resulting in cytokine and chemokine
production in response to bacterial infection [164, 197, 198].
S. aureus BCM and PCM induced differential responses in MAPK signaling in
keratinocytes. Phosphorylation of JNK and p38 MAPK family members was (i) low and
Page 120
106
decreased overtime in keratinocytes exposed to BCM and (ii) unchanged or increased in
keratinocytes exposed to PCM. Transcriptional analysis of BCM treated keratinocytes
revealed the upregulation of DUSP MAPK regulators which may be responsible for the
de-phosphorylation of JNK and p38. These data indicate that factors secreted by S.
aureus biofilm may be suppressing JNK and p38 signaling leading to the observed
reduction of cytokines and chemokines in BCM treated keratinocytes.
An increase in phosphorylation levels of p38 and JNK in PCM treated
keratinocytes coincided with large increases in cytokine and chemokine production
relative to BCM treated keratinocytes. This agrees with other reports of p38 and JNK
activation in mammalian cell cultures in response to bacterial cultures similar to the
planktonic cultures described in this dissertation [92, 120, 185, 199-201].
Chemical inhibition of MAPKs confirmed that BCM stimulation induced more
MAPK independent cytokine production than PCM stimulated keratinocytes after 4
hours. The relative ineffectiveness of the MAPK inhibitors on BCM mediated cytokine
production in addition to the reduced phosphorylation status of JNK and p38 would
suggest that BCM and PCM induced production of cytokines is mediated through
different signaling cascades in keratinocytes. The possibility of a secreted S. aureus
biofilm factor(s) that suppress MAPK signal transduction in human keratinocytes may
lead to reduced local cytokine and chemokine production establishing a chronic level of
inflammation that disrupts the immune response and is detrimental to the healing process.
The suppression of MAPK signaling by BCM could potentially impact other
wound related activities involving MAPK cascades in keratinocytes. These include
Page 121
107
keratinocyte differentiation [100], the secretion of antimicrobial peptides [101], response
to mechanical stress [102], and response to osmotic stress [103]. Suppression of MAPK
signal transduction in keratinocytes could be detrimental to all phases of wound healing,
possibly contributing to the formation and/or persistence of chronic wounds. The
upregulation of AP-1 transcription factors may be an attempt by the cell to compensate
for reduced MAPK signaling and subsequent cytokine production induced by BCM.
MAPK suppression in various mammalian cell types by bacterial products has
been observed. Bacillus anthracis secretes lethal toxin, which cleaves most isoforms of
MAPKs, reducing pro-inflammatory cytokine secretion from immune cells [202].
Shigella Flexneri, Yersinia spp., and Salmonella spp. deliver toxins which inhibit MAPK
signal transduction through a type III secretion mechanism resulting in the repression of
genes such as TNF-α, IL-6, and CXCL-8 [203, 204]. S. aureus has not been shown to
produce a toxin that inhibits MAPK signaling. This indicates a novel mechanism
responsible for the observed suppression of p38 and JNK MAPK signaling and reduced
cytokine and chemokine secretion in BCM treated keratinocytes.
Xenobiotic Metabolism Enzymes are Induced by BCM in Human Keratinocytes
Any foreign chemical found in the body including drugs, pollution, certain foods,
and chemicals liberated through combustion are known collectively as xenobiotic
chemicals. Xenobiotics are typically hydrophobic in nature and readily penetrate cellular
membranes. To combat the everyday exposure to these chemicals, the body utilizes
xenobiotic metabolizing enzymes (XMEs) which are broken into two groups, Phase I and
Phase II XMEs. Phase I XMEs generally prime Phase II XMEs through the formation of
Page 122
108
electrophilic intermediates. Phase II XMEs are then able to conjugate the metabolite with
a number of different moieties (glutathione, sulphate, glycine, etc) producing a
hydrophilic product. The combined effects of Phase I and Phase II XMEs results in the
detoxication of foreign chemicals through their excretion from the body.
The skin is the largest organ in the body and is a major barrier to the outside
world. Xenobiotic metabolism has been shown to be active in human keratinocytes,
albeit at a lower level when compared to other detoxifying organs such as the liver [205].
Major classes of phase I XMEs include members of the cytochrome P450 (CYP450)
family of monooxygenases. CYP450s contain a heme cofactor and catalyze the insertion
of one atom of oxygen into an organic substrate while the other oxygen atom is reduced
to water. CYP1A1 and CYP1B1 are inducible members of the CYP1A family which are
characterized by their ability to metabolize xenobiotic chemicals, mainly hydrophobic
polycyclic aromatic hydrocarbons (PAHs) and polyhalogenated aromatic hydrocarbons
[206]. CYP1A1 is classified as a phase I XME which is notorious for the metabolic
activation of several carcinogens/toxins producing reactive oxygenated metabolites that
are often more harmful than the parent compound. CYP1A1 is one of the most important
detoxification enzymes because of its wide distribution in the body and its broad
substrate specificity. PAHs show strong affinity towards the aryl hydrocarbon receptor
(AHR), which dimerizes with its binding partner ARNT to regulate the expression of
CYP1A family members and other genes involved in xenobiotic metabolism (Figure 33).
Page 123
109
PAH
Figure 34. Illustration of the aryl hydrocarbon receptor (AhR) pathway. Xenobiotics (polycyclic aromatic
hydrocarbons (PAHs) in this case) readily penetrate lipid membranes. Upon entry to the cell, xenobiotics activate the
AhR complex which leads to its translocation into the nucleus were it dimerizes with its binding partner, ARNT. The
AhR/ARNT complex acts as a transcription factor for several genes important to xenobiotic metabolism, including
CYP1A1/1B1. Image adapted from reference [205].
CYP1A1 and CYP1B1 expression are considered to be diagnostic for AHR activation
[207]. In addition to producing activated intermediate metabolites, the CYP1A family of
XMEs induces oxidative stress through the generation of reactive oxygen species (ROS)
which is coupled to its monooxygenase catalytic activities [208].
The expression of both phase I and phase II XME genes geared towards the
metabolism of hydrophobic aryl hydrocarbons in BCM treated keratinocytes and in
keratinocytes in the biofilm co-culture model, but not in PCM or control cells, is
significant and points towards the existence of small hydrophobic virulence factors
secreted by S. aureus biofilm. It is possible that the aureusimines could be metabolized
by this metabolic pathway. Xenobiotic metabolism and inflammatory responses have an
intimate relationship. CYP450 transcription is widely known to be inhibited by
inflammation [209-211]. CYP450 genes are likely downregulated during inflammation
due to the unavoidable generation of ROS and oxidative stress by CYP450. Oxidative
Page 124
110
stress is known to induce inflammation through several processes including MAPK
signaling [212]. Excessive ROS production during an inflammatory response, especially
in the skin, which is exposed to high levels of ultraviolet radiation and oxygen tension,
results in the damage of lipid membranes and nucleic acids, and induction of apoptosis
[213-215]. Given the presence of CYP450 gene expression in addition to the
upregulation of genes related to oxidative stress and DNA damage, ROS may be partially
responsible for the observed apoptosis in keratinocytes exposed to S. aureus biofilm.
CYP1A1 and CYP1B1 have been demonstrated to have an inverse expression
pattern when inflammation is induced where CYP1B1 is not affected by inflammatory
responses to the degree that CYP1A1 is [206, 216]. The common Staphylococcal toxins
Staphylococcal enterotoxin B and S. aureus protein A depresses CYP450 dependent
drug biotransformation through inflammatory responses from the cell [210]. The
expression patterns of CYP450 genes observed in keratinocytes in co-culture with S.
aureus biofilm show different expression patterns over time, though a clear inverse
expression pattern was not evident (Figure 32).
It is possible that BCM induces lower levels of CYP1A1/1B1 in keratinocytes
relative to co-culture keratinocytes because the responsible S. aureus biofilm secreted
products are metabolized and deactivated leading to the downregulation of CYP1A1/1B1
genes. Higher CYP1A1/1B1 levels in the co-culture model may be due to the continual
replacement of biofilm secreted products which may lead to higher levels of
CYP1A1/1B1 transcripts. The upregulation of more phase II XMEs in BCM treated cells
may indicate that phase I XME metabolism is progressing resulting in decreased CYP1
Page 125
111
levels and increased phase II XMEs responsible for the final metabolic steps prior to
elimination from the cell. To my knowledge, an infectious disease has never been shown
to directly induce xenobiotic metabolism while simultaneously generating an
inflammatory response. These results are in conflict with reports on the relationship
between xenobiotic metabolism and inflammation [206, 216].
The transcription of CYP450 genes under inflammatory conditions may be the
consequence of deranged MAPK signaling. MAPKs are involved in the regulation of
CYP450 genes [207, 217] and disruption of this regulation could potentially lead to
inappropriate CYP1A1/1B1 transcription and the production of more oxygen radicals.
These data provide insights into the mechanisms of sustained inflammation and
persistence in biofilm-based chronic-wound infections. Suppression of MAPK signaling
and the corresponding reduction in cytokine production could help to explain the local,
chronic inflammation observed in biofilm infected tissues. MAPK alternative
inflammatory mechanisms potentially induced by BCM may include the production of
lipid derived mediators of inflammation (i.e. arachadonic acid metabolites) and ROS
generated by CYP450.
Epithelialization
Keratinocytes stimulated with BCM underwent morphological changes including
the formation of actin rich dendritic like structures, rounding of the cell body,
polymerization of tubulin around the periphery of the cell, and fragmentation of the
nucleus. Additionally, BCM induced the release of intracellular calcium which
correlated well with changes in morphology. PCM did not induce the release of
Page 126
112
intracellular calcium stores. Apoptosis was also induced in BCM treated keratinocytes
accompanied by cell detachment. ROS production induced by BCM may also contribute
to apoptosis.
Morphologic Changes and Apoptosis Induced by BCM. S. aureus BCM induced
morphological changes and apoptosis in HFKs. BCM also inhibits keratinocyte
migration and increases the wounded area in a scratch based wound model [218]. The
same morphological changes and activation of apoptosis that occur in BCM stimulated
HFKs were also observed in HaCaT keratinocytes. Additionally, the same effects were
observed in keratinocytes exposed to biofilm secreted products in the co-culture model,
albeit on a longer timescale. The differences in the time during which the morphology
changes occurred after exposure to BCM as opposed to co-culture is logical, since BCM
treated cells received a large, concentrated dose of secreted bacterial factors while
keratinocytes in the co-culture model are initially in fresh growth medium and are
exposed to bacterial factors that build up to active concentrations over a longer period of
time.
Temporal changes in cell morphology correlated with an increase in intracellular
calcium levels, suggesting a calcium-dependent mechanism (Figure 25). The disruption
of microtubules in keratinocytes exposed to BCM likely inhibits cell proliferation since
microtubules are intimately involved in the cell division process. Microtubule and
microfilament structures are also essential to locomotion in keratinocytes. The observed
rearrangements in cytoskeletal structure likely explain the inhibition of scratch closure
we previously described for BCM treated keratinocytes [218]. These data support the
Page 127
113
hypothesis that cytoskeletal rearrangements induced by secreted factors from S. aureus
biofilm in human keratinocytes impacts the epithelialization phase of wound healing.
Alterations of cytoskeletal architecture by direct contact with bacteria have been
portrayed as a means for pathogenic bacteria to induce pathogenesis (i.e., apoptosis)
through invasion of host cells [219-221]. The observed cytoskeletal rearrangements
induced by BCM may play a role in the internalization of S. aureus and could potentially
modulate immune responses.
Previous studies have shown co-culturing planktonic S. aureus and keratinocytes
induces apoptosis, but direct contact and internalization of S. aureus was necessary [222-
225]. Keratinocytes treated with BCM contained highly fragmented nuclei and stained
positive in the TUNEL assay, consistent with late stage apoptosis (Figures 22-24).
Apoptosis induced by BCM coincided with increases in intracellular calcium after 24
hours of exposure to BCM (Figures 22, 23, and 26). Intracellular calcium regulates
differentiation and apoptotic programs in human keratinocytes [226]. Apoptosis in BCM
treated keratinocytes was accompanied by a decrease in adherent cell numbers over time
(Figure 24). Secreted biofilm factors capable of inducing apoptosis in keratinocytes
would have major impacts on epithelialization. Apoptosis in cells not in direct contact
with S. aureus, such as cells at the wound margin, could be induced to undergo
programmed cell death leading to advancement of the wound front, further inhibiting the
epithelialization phase of wound healing.
Page 128
114
A Model of the Effects of Bacteria on Wound Healing
An overview of S. aureus infection as related to the work outlined in this
dissertation is detailed in Figure 34. The initial colonization of a wound would
theoretically be primarily by bacteria with a more planktonic phenotype. This infection
would either result in a failed attempt to evade the host’s immune response or successful
infection of the wound. If the bacteria were successful in initiating an infection that was
not cleared by the host, the infection would either become systemic and spread to the
blood resulting in sepsis or the infection would remain localized and become chronic.
If the route of infection were to turn chronic, bacteria colonizing the wound would
likely revert from a predominantly planktonic phenotype into a predominantly biofilm
phenotype. The ability of S. aureus biofilms to induce apoptosis and induce abnormal
cell morphology in human epidermal keratinocytes would likely impact wound healing
through inhibition of the second phase of wound healing, re-epithelialization. Relatively
low production of inflammatory cytokines by keratinocytes exposed to BCM and the
suppression of MAPK signaling would lead to a deranged local inflammatory response
contributing to the persistent nature of chronic wounds. Many factors could potentially
influence the route of the infection. One of the most important factors to consider are
underlying medical conditions of the host known to complicate the wound healing
process including: immunosuppression, diabetes, pulmonary disease, and obesity.
Page 129
115
Keratinocyte
Apoptosis
BCM
Induced
Inhibited/Not Induced
Reduced
Chronic Wound Infection
MAPK
Cytokine/
Chemokine Production
Re-epithelialization
Immune Response/
Inflammation
Abnormal Keratinocyte Morphology
Sepsis and Death/Initiation of A Chronic Wound
Abnormal
Keratinocyte Morphology
Clearing of Acute Infection/ Normal Healing Process
PCM
Keratinocyte
Apoptosis MAPK
Cytokine/ Chemokine Production
Re-
epithelialization
Immune
Response/ Inflammation
Figure 35. An overview of the potential mechanisms of pathogenesis induced by secreted factors from either S. aureus
biofilm or planktonic cultures.
Page 130
116
The many differential effects induced in human keratinocytes by secreted factors
from S. aureus biofilm and planktonic cultures described in this dissertation underscore
the importance in considering the formation of a biofilm when studying bacterial based
diseases. A wide range of bacteria with varying degrees of phenotypes ranging from
“100% planktonic” to “100% biofilm” are likely present in chronic infections. This
phenotypic plasticity (in addition to population diversity) is what is assumed to lend
bacterial biofilms resistance to several factors including antibiotics and attacks from the
immune system. Data presented here revealed distinct characteristics in inflammatory
and epithelialization processes in keratinocytes stimulated with BCM or PCM. These
data further implicate biofilms as a causative agent of localized, persistent infections and
underscore the need to investigate the impact of biofilm formation not only in studies
investigating infectious disease, but in all studies were bacterial biofilm formation is a
possibility.
Page 131
117
CHAPTER 6
CONCLUSIONS AND SUMMARY OF RESULTS
S. aureus BCM and PCM differentially impacted inflammation and processes
associated with epithelialization in human keratinocytes. Phylogenetic characterization
of chronic wound biofilm communities revealed that chronic wounds contain a diverse
community of microorganisms. Among the most prevalent organisms in chronic wound
infections was S. aureus. Work described in this dissertation was one of the earlier
documented cases of phylogenetic characterization of bacterial populations in diabetic
foot ulcers, venous leg ulcers, and pressure ulcers using molecular methods. Molecular
methods are utilized more frequently to characterize chronic-wound bacterial
communities in clinical settings.
A novel in vitro biofilm-disease model was developed to study interactions
between S. aureus BCM and human keratinocytes. The model allowed for a direct
comparison between conditioned medium from S. aureus biofilm and planktonic cultures.
Metabolite profiling of BCM indicated that amino acids were selectively consumed.
Mixed-acid fermentation products were produced by S. aureus biofilm suggesting an
anoxic niche. This indicates an important role for anoxic metabolism in bacterial
biofilms and biofilm-based disease.
Aureusimine A and B were recently discovered to regulate virulence in S. aureus
[167]. The production of the two virulence factors correlated with biofilm formation,
anoxia, and were found to be present in a variety of Gram positive organisms. The
inhibition of the production of these molecules could be a potential therapeutic/diagnostic
Page 132
118
target for biofilm-based diseases. Additionally, activities induced in host cells by the
aureusimines could also be targeted for therapeutic intervention.
S. aureus BCM impacted the inflammatory response by stalling cytokine
production and suppressing MAPK phosphorylation in human keratinocytes. BCM also
inhibited epithelialization-related processes through disruption of the cytoskeleton and
induction of apoptosis. Cytoskeletal rearrangements and apoptosis were correlated with
the mobilization of intracellular calcium, suggesting a calcium-dependent mechanism.
With the in vitro biofilm-disease model, important elements of host-pathogen
relationships between mammalian cell lines and bacterial strains can be elucidated. Our
current model could be expanded to include multi-species biofilms and more complex
tissue cultures. Incorporation of specific strains of bacteria and mammalian cell types in
our model expands the utility of this model to other biofilm-related diseases. This work
highlights important host-pathogen interactions that may lead to discoveries associated
with the healing and prevention of biofilm-based infections.
Page 134
120
APPENDIX A
MS2 DATA FOR AUREUSIMINE A
Page 135
121
Highlighted peaks correspond to ions generated by MS2 fragmentation. MS2
spectra were averaged over low to high fragmentation energies (10-100 Volts) to obtain a
representative spectrum. All major ions are accounted for when fragment masses from
logical breaks in chemical bonds are calculated. The blue diamond represents the parent
ion.
NH
NH
+
CH3
CH3
O
OHOH
CH2 NH
N+
CH3
CH3
O
+
m/z 151.18mw 94.1
Page 136
122
NH
NH
+
CH3
CH3
O
OH
C14
H17
N2O
229.1341 Da
O15.9949 Da
NH
NH
+
CH3
CH3
O
OH NH
NH+
OH
m/z 175.2
NH
NH+
OH OHNH
+N
CH2
+
m/z 175.2 m/z 81.1mw 94.1
NH
NH+
OH OHNH
+N
CH2
+
m/z 175.2 m/z 81.1mw 94.1
NH
NH
+
CH3
CH3
O
OH
CH2
+
OH
NH
N+
CH-
CH3
CH3
O
+
mw 138.16m/z 107.13
NH
NH
+
CH3
CH3
O
OH
C7H
7O
107.0497 Da
C4H
3N
2O
95.0245 Da
C3H
7
43.0548 Da
Page 137
123
NH
NH
+
CH3
CH3
O
OH NH
+OH
m/z 146.1
NH
NH
+
CH3
CH3
O
OH
N
N+
O
OH CH3
CH3
+
m/z 201.2 mw 44.1
Page 138
124
NH
NH
+
CH3
CH3
O
OH
C6H
5O
93.034 DaC
8H
12N
2
136.1 Da
O15.9949 Da
NH
NH
+
CH3
CH3
O
OH
C13
H14
N2O
2
230.1055 Da CH3
15.0235 Da
Page 139
125
APPENDIX B
MS2 DATA FOR AUREUSIMINE B
Page 140
126
Highlighted peaks correspond to ions generated by MS2 fragmentation. MS2
spectra were averaged over low to high fragmentation energies (10-100 Volts) to obtain a
representative spectrum. All major ions are accounted for when fragment masses from
logical breaks in chemical bonds are calculated. The blue diamond represents the parent
ion.
NH
NH
+
CH3
CH3
O
C13
H14
N2O
214.1106 Da
CH3
15.0235 Da
Page 141
127
NH
NH
+
CH3
CH3
O
C10
H10
N2
158.0844 Da C4H
7
55.0548 Da
NH
NH+
m/z 159.1
NH
NH+
NH+
N
CH2
+
m/z 159.1 m/z 81.1mw 78.1
NH
NH
+
CH3
CH3
OCH2
+ NH
N+
CH-
CH3
CH3
O
+
m/z 91.13 mw 138.1
NH
NH
+
CH3
CH3
O
CH3
CH3
N
N+
O
+
m/z 185.2 mw 44
Page 142
128
NH
NH
+
CH3
CH3
O
C9H
9N
131.0735 Da C5H
8NO
98.0606 Da
NH
+
m/z 130.1
NH
NH
+
CH3
CH3
O
C6H
5
77.0391 DaC
7H
9N
2O
137.0715 Da
CH3
15.0235 Da
Page 143
129
NH
NH
+
CH3
CH3
O
C14
H17
N2
213.1392 Da
O15.9949 Da
NH
NH
+
CH3
CH3
O
C7H
7
91.0548 Da C4H
3N
2O
95.0245 Da C3H
7
43.0548 Da
Page 144
130
APPENDIX C
BCM/PCM MICROARRAY DATA
Page 145
131
RefSeq Transcript ID Gene Symbol OWA pval FC PCMvEPI FC BCMvEPI FC BCMvPCM
NM_005252 c-FOS 2.59E-03 1.01 43.58 42.97
NM_001964 EGR1 4.80E-03 -1.10 17.79 19.58
NM_000584 IL8 4.01E-07 6.14 64.43 10.49
NM_002089 CXCL2 3.08E-07 6.21 62.11 10.00
NM_001030287 ATF3 1.06E-03 1.42 13.63 9.61
NM_003670 BHLHE40 1.40E-03 1.44 13.58 9.46
NM_000594 TNF alpha 4.00E-05 3.05 27.73 9.10
NM_005524 HES1 8.00E-05 1.80 13.71 7.62
NM_002090 CXCL3 6.65E-04 1.82 12.23 6.72
NM_004417 DUSP1 4.82E-04 1.62 10.13 6.24
NM_000584 IL8 6.39E-07 10.59 59.10 5.58
NM_004417 DUSP1 1.05E-06 2.88 15.96 5.54
NM_005524 HES1 7.06E-05 1.70 7.26 4.28
NM_003407 ZFP36 4.99E-05 1.76 7.08 4.02
NM_000600 IL6 1.79E-03 1.06 3.40 3.20
NM_006290 TNFAIP3 1.06E-07 4.39 13.59 3.10
NM_005261 GEM 1.28E-05 5.93 18.02 3.04
NM_001040874 HIST2H2AA3 /// HIST2H2AA4 6.43E-03 -1.01 2.95 2.99
NM_001040874 HIST2H2AA3 /// HIST2H2AA4 7.78E-03 1.08 3.08 2.85
NM_020307 CCNL1 7.92E-03 1.03 2.86 2.78
NM_020317 C1orf63 1.14E-03 1.34 3.61 2.70
NM_014330 PPP1R15A 7.47E-05 3.42 8.87 2.59
NM_015675 GADD45B 6.74E-03 -1.06 2.30 2.44
NM_000499 CYP1A1 9.05E-03 1.12 2.63 2.35
NM_005066 SFPQ 1.74E-04 1.51 3.52 2.34
NM_005980 S100P 1.98E-03 1.29 2.86 2.21
--- H2BFS 4.65E-03 1.06 2.32 2.19
NM_015675 GADD45B 7.18E-03 1.01 2.18 2.15
NM_014330 PPP1R15A 4.04E-05 4.47 9.57 2.14
NM_001025366 VEGFA 1.12E-04 3.93 8.08 2.05
NM_002228 c-JUN 3.54E-05 1.78 3.64 2.05
NM_003164 STX5 4.89E-03 1.04 1.93 1.86
NM_018217 EDEM2 6.00E-03 1.13 2.09 1.86
NM_000759 CSF3 6.73E-05 1.54 2.84 1.84
NM_022772 EPS8L2 3.40E-03 1.11 2.05 1.84
NM_005851 CDK2AP2 6.25E-03 1.03 1.89 1.83
NM_021063 HIST1H2BD 9.86E-03 1.30 2.37 1.82
NM_002228 JUN 1.20E-03 1.29 2.30 1.79
NM_006462 RBCK1 4.46E-03 1.05 1.84 1.76
NM_000758 CSF2 5.36E-04 2.43 4.24 1.75
NM_000561 GSTM1 1.16E-03 1.08 1.87 1.73
NM_001127603 C9orf95 5.25E-03 1.25 2.12 1.69
NM_016086 STYXL1 3.26E-03 1.18 1.98 1.68
NM_003945 ATP6V0E1 9.09E-03 1.07 1.81 1.68
NM_004428 EFNA1 1.59E-04 3.84 6.44 1.68
NM_006290 TNFAIP3 1.06E-05 2.93 4.90 1.67
NM_012088 PGLS 8.60E-03 -1.04 1.61 1.67
NM_007350 PHLDA1 4.33E-03 1.13 1.88 1.66
NM_000520 HEXA 9.81E-03 1.09 1.81 1.65
NM_018075 ANO10 9.14E-03 -1.05 1.56 1.64
NM_017670 OTUB1 6.04E-03 1.14 1.86 1.64
NM_000848 GSTM2 2.98E-03 1.16 1.88 1.62
NM_001142464 ECSIT 3.26E-04 1.19 1.92 1.62
NM_004596 SNRPA 9.27E-03 -1.00 1.61 1.61
NM_080593 HIST1H2BK 8.52E-03 1.03 1.64 1.59
NM_000917 P4HA1 5.60E-03 1.23 1.95 1.59
NM_002229 JUNB 1.48E-05 2.31 3.65 1.58
NM_000612 IGF2 /// INS-IGF2 2.11E-04 1.46 2.31 1.58
NM_024112 C9orf16 6.34E-04 1.18 1.86 1.58
Page 146
132
NM_013349 NENF 6.15E-03 1.03 1.63 1.58
NM_007233 TP53TG1 8.16E-03 1.07 1.68 1.58
NM_000089 COL1A2 1.30E-03 1.08 1.70 1.57
NM_005529 HSPG2 4.02E-03 1.13 1.78 1.57
NM_001025234 TSPAN4 2.51E-03 1.02 1.60 1.56
NM_020529 NFKBIA 1.17E-04 2.35 3.65 1.55
NM_013402 FADS1 3.99E-03 1.02 1.58 1.55
NM_207340 ZDHHC24 8.63E-03 1.11 1.72 1.54
NM_006712 FASTK 5.53E-03 1.02 1.57 1.54
NM_016429 COPZ2 1.93E-03 1.08 1.63 1.52
NM_001155 ANXA6 8.45E-03 1.07 1.61 1.51
NM_001511 CXCL1 5.35E-04 13.86 20.81 1.50
NM_021178 CCNB1IP1 6.72E-03 1.04 1.56 1.50
NM_002016 FLG 6.67E-03 1.72 2.58 1.49
NM_001122 ADFP 4.71E-03 1.48 2.21 1.49
NM_001300 KLF6 9.10E-03 1.57 2.33 1.49
NM_005412 SHMT2 6.82E-03 1.07 1.58 1.48
NM_013402 FADS1 5.14E-03 1.12 1.65 1.48
NM_172341 PSENEN 5.63E-03 1.14 1.67 1.47
NM_001124 ADM 1.19E-04 2.53 3.67 1.45
NM_001101669 INPP4B 8.85E-03 1.11 1.61 1.45
NM_002831 PTPN6 1.49E-03 1.27 1.84 1.44
NM_003258 TK1 8.23E-03 1.15 1.64 1.43
NM_001122837 RAG1AP1 3.22E-03 1.08 1.53 1.42
NM_007350 PHLDA1 1.29E-04 1.15 1.63 1.42
NM_018999 KIAA1128 3.07E-03 1.09 1.54 1.42
NM_006623 PHGDH 4.57E-03 1.25 1.77 1.41
NM_016145 C19orf56 3.95E-03 1.08 1.52 1.41
NM_001040437 C6orf48 3.79E-04 1.18 1.66 1.41
NM_012323 MAFF 5.97E-04 2.56 3.61 1.41
NM_001136032 KLK11 5.16E-03 1.24 1.73 1.40
NM_001659 ARF3 6.61E-03 1.13 1.57 1.40
NM_002961 S100A4 3.41E-04 1.35 1.88 1.39
NM_000431 MVK 2.14E-03 1.29 1.80 1.39
NM_002228 JUN 2.46E-03 1.13 1.56 1.38
NM_000077 CDKN2A 2.61E-03 1.13 1.56 1.38
NM_001196 BID 5.27E-05 1.20 1.64 1.36
NM_022477 NDRG3 6.90E-03 1.17 1.58 1.35
NM_002032 FTH1 4.70E-03 1.31 1.78 1.35
NM_025079 ZC3H12A 2.73E-03 2.45 3.30 1.34
NM_001913 CUX1 1.56E-03 1.39 1.86 1.34
NM_003670 BHLHE40 2.39E-03 1.57 2.10 1.33
NM_003915 CPNE1 6.98E-03 1.22 1.61 1.32
NM_006462 RBCK1 4.82E-03 1.15 1.51 1.32
NM_000874 IFNAR2 1.68E-03 1.16 1.52 1.31
NM_012323 MAFF 9.37E-04 2.56 3.35 1.31
NM_002475 MYL6B 6.47E-03 1.32 1.72 1.30
NM_001018016 MUC1 1.67E-03 1.31 1.69 1.29
NM_006346 PIBF1 7.74E-03 1.46 1.89 1.29
NM_000695 ALDH3B2 1.78E-03 1.50 1.93 1.29
NM_014357 LCE2B 1.88E-03 2.32 2.98 1.29
NM_021922 FANCE 2.97E-03 1.25 1.60 1.28
NM_020412 CHMP1B 9.37E-04 1.71 2.18 1.28
NM_001130964 PLCD1 8.44E-03 1.27 1.59 1.25
NM_001551 IGBP1 4.07E-03 1.36 1.67 1.23
NM_004323 BAG1 1.63E-03 1.62 1.96 1.21
NM_000247 MICA 4.76E-03 1.29 1.53 1.19
NM_001013436 MPST 9.06E-03 1.47 1.75 1.19
NM_001880 ATF2 8.10E-03 1.51 1.79 1.18
NM_001130046 CCL20 2.94E-03 12.01 13.92 1.16
NM_002093 GSK3B 9.86E-03 1.51 1.72 1.14
NM_001098478 HLA-F 2.36E-03 1.37 1.56 1.14
NM_006121 KRT1 1.86E-03 1.81 2.02 1.12
NM_006931 SLC2A3 1.54E-03 2.28 2.54 1.11
NM_000045 ARG1 2.69E-03 1.92 2.14 1.11
NM_001172 ARG2 4.64E-03 1.52 1.68 1.11
NM_001042483 NUPR1 2.66E-03 2.58 2.86 1.11
NM_005730 CTDSP2 5.86E-03 1.48 1.63 1.10
NM_006026 H1FX 4.24E-03 1.59 1.72 1.08
NM_003897 IER3 1.94E-03 2.70 2.88 1.07
Page 147
133
NM_015721 GEMIN4 6.82E-03 -5.02 -4.72 1.07
NM_001015881 TSC22D3 4.20E-03 2.68 2.85 1.06
NM_024598 C16orf57 3.59E-03 1.45 1.54 1.06
NM_000314 PTEN /// PTENP1 5.05E-03 2.17 2.28 1.05
NM_001039199 TTPAL 8.80E-03 -2.25 -2.14 1.05
NM_016470 C20orf111 4.98E-03 2.87 2.98 1.04
NM_001136007 FXYD3 2.15E-03 2.40 2.49 1.04
NM_019058 DDIT4 1.58E-03 1.55 1.60 1.03
NM_004419 DUSP5 5.72E-03 2.88 2.96 1.03
NM_001008211 OPTN 9.58E-03 1.54 1.55 1.01
NM_001539 DNAJA1 6.71E-03 -2.36 -2.34 1.01
NM_022717 SNRNP35 4.83E-03 -1.85 -1.83 1.01
NM_018321 BXDC2 5.78E-03 -2.65 -2.64 1.01
NM_015014 RBM34 6.44E-03 -2.46 -2.45 1.00
NM_014976 PDCD11 5.99E-03 -1.51 -1.51 -1.00
NM_003290 TPM4 8.14E-03 -1.58 -1.59 -1.01
NM_014597 DNTTIP2 4.40E-03 -1.82 -1.86 -1.02
NM_001033059 AMD1 4.73E-03 -1.52 -1.56 -1.03
NM_017446 MRPL39 8.13E-03 -1.83 -1.91 -1.05
NM_001099638 ZNF146 4.43E-03 -1.49 -1.56 -1.05
NM_000378 WT1 7.23E-03 -2.27 -2.40 -1.05
NM_015036 ENDOD1 8.65E-03 -1.65 -1.75 -1.06
NM_002703 PPAT 4.93E-03 -2.11 -2.24 -1.06
NM_025065 BXDC5 9.31E-03 -1.51 -1.61 -1.07
NM_014452 TNFRSF21 2.61E-03 -1.41 -1.51 -1.08
NM_017897 OXSM 9.69E-03 -2.75 -2.95 -1.08
NM_024808 C13orf34 7.03E-03 -2.87 -3.10 -1.08
NM_023940 RASL11B 3.45E-03 -1.67 -1.80 -1.08
NM_014864 FAM20B 2.10E-03 -1.50 -1.63 -1.09
NM_015475 FAM98A 1.66E-03 -1.66 -1.81 -1.09
NM_001539 DNAJA1 6.59E-04 -1.45 -1.59 -1.09
NM_014793 LCMT2 3.25E-03 -2.95 -3.24 -1.10
NM_016037 UTP11L 3.61E-04 -1.53 -1.68 -1.10
NM_001102397 HNRNPR 3.69E-04 -1.51 -1.67 -1.10
NM_031218 ZNF93 1.05E-03 -1.41 -1.55 -1.10
NM_014777 URB2 9.62E-03 -2.37 -2.62 -1.11
NM_006527 SLBP 2.38E-03 -1.40 -1.56 -1.11
NM_005415 SLC20A1 2.33E-03 -1.53 -1.70 -1.11
NM_001135650 EEF1E1 9.23E-03 -1.88 -2.10 -1.12
NM_006784 WDR3 2.28E-03 -4.01 -4.48 -1.12
NM_006805 HNRNPA0 1.25E-03 -1.82 -2.04 -1.12
NM_000418 IL4R 2.45E-03 -2.09 -2.37 -1.13
NM_012341 GTPBP4 3.84E-03 -2.34 -2.66 -1.14
NM_016077 PTRH2 7.77E-04 -2.12 -2.41 -1.14
NM_032195 SON 1.82E-03 -1.54 -1.76 -1.14
NM_001035521 GTF3C2 6.49E-03 -1.50 -1.72 -1.14
NM_017810 ZNF434 1.78E-03 -1.90 -2.18 -1.15
NM_025141 TM2D3 3.81E-03 -1.44 -1.66 -1.15
NM_198514 NHLRC2 3.23E-03 -2.61 -3.02 -1.16
NM_022366 TFB2M 7.47E-03 -1.94 -2.25 -1.16
NM_015062 PPRC1 4.43E-03 -2.35 -2.73 -1.16
NM_001113378 FANCI 7.29E-03 -1.52 -1.78 -1.17
NM_021732 AVPI1 8.17E-03 7.17 6.13 -1.17
NM_000693 ALDH1A3 4.25E-04 -2.30 -2.69 -1.17
NM_000430 PAFAH1B1 7.66E-03 -1.91 -2.25 -1.18
NM_018072 HEATR1 3.18E-03 -1.48 -1.74 -1.18
NM_001099415 POM121 /// POM121C 7.29E-04 -1.58 -1.87 -1.18
NM_002915 RFC3 6.10E-03 -2.46 -2.90 -1.18
NM_018225 SMU1 1.01E-05 -1.30 -1.54 -1.19
NM_024094 DSCC1 9.57E-03 -1.45 -1.73 -1.19
NM_003086 SNAPC4 1.14E-03 -1.48 -1.76 -1.19
NM_006622 PLK2 1.09E-03 -1.53 -1.82 -1.19
NM_001135191 ASAP2 1.16E-03 -1.33 -1.59 -1.19
NM_002915 RFC3 7.65E-03 -3.24 -3.88 -1.20
NM_016448 DTL 5.23E-03 -2.77 -3.33 -1.20
NM_006372 SYNCRIP 2.75E-03 -1.30 -1.57 -1.20
NM_024831 TGS1 5.39E-03 -1.61 -1.94 -1.20
NM_001009182 SIP1 2.84E-03 -1.83 -2.20 -1.21
NM_017676 GIN1 4.59E-03 -3.33 -4.02 -1.21
NM_004760 STK17A 1.26E-03 -1.64 -1.99 -1.21
Page 148
134
NM_001554 CYR61 4.02E-03 -1.24 -1.50 -1.21
NM_003290 TPM4 7.11E-03 -1.36 -1.64 -1.21
NM_003246 THBS1 3.67E-05 -1.35 -1.64 -1.21
NM_012341 GTPBP4 7.62E-04 -2.35 -2.86 -1.21
NM_017955 CDCA4 8.20E-04 -1.33 -1.61 -1.21
NM_001085458 CTNND1 2.74E-03 -1.61 -1.96 -1.22
NM_003824 FADD 1.14E-03 -1.87 -2.28 -1.22
NM_004457 ACSL3 3.99E-03 -1.29 -1.58 -1.23
NM_006029 PNMA1 2.00E-03 -2.15 -2.63 -1.23
NM_005791 MPHOSPH10 4.45E-03 -1.91 -2.36 -1.23
NM_004508 IDI1 1.93E-04 -1.28 -1.58 -1.24
--- --- 4.21E-04 -1.22 -1.51 -1.24
NM_004111 FEN1 8.39E-04 -1.38 -1.71 -1.24
NM_019008 SMCR7L 2.82E-03 -1.76 -2.18 -1.24
NM_022720 DGCR8 1.09E-04 -1.45 -1.80 -1.24
NM_014613 FAF2 1.12E-03 -1.61 -1.99 -1.24
NM_017730 QRICH1 4.16E-04 -1.27 -1.57 -1.24
NM_006810 PDIA5 4.69E-03 -1.28 -1.60 -1.24
NM_002890 RASA1 1.88E-03 -1.46 -1.81 -1.24
NM_012207 HNRNPH3 1.47E-03 -1.71 -2.13 -1.25
NM_006306 SMC1A 5.31E-03 -1.27 -1.58 -1.25
NM_001135650 EEF1E1 3.42E-03 -1.28 -1.60 -1.25
NM_003309 TSPYL1 1.49E-04 -1.43 -1.79 -1.25
NM_016333 SRRM2 4.10E-04 -1.21 -1.53 -1.26
NM_003246 THBS1 9.35E-05 -1.34 -1.69 -1.26
NM_006963 ZNF22 4.83E-03 -2.17 -2.75 -1.27
NM_022720 DGCR8 2.99E-03 -1.66 -2.11 -1.27
NR_015350 KIAA0040 6.27E-04 -1.23 -1.58 -1.28
NM_003885 CDK5R1 6.60E-03 -3.19 -4.09 -1.28
NM_014706 SART3 2.57E-03 -1.74 -2.24 -1.28
NM_012245 SNW1 1.52E-04 -1.22 -1.57 -1.29
NM_002267 KPNA3 5.75E-03 -1.23 -1.58 -1.29
NM_024775 GEMIN6 7.69E-04 -2.35 -3.03 -1.29
NM_000430 PAFAH1B1 6.14E-04 -2.58 -3.34 -1.29
NM_001007239 KIAA0859 1.74E-03 -1.57 -2.03 -1.30
NM_004124 GMFB 6.24E-03 -1.24 -1.61 -1.30
NM_002890 RASA1 1.68E-03 -1.48 -1.92 -1.30
NM_003405 YWHAH 1.50E-04 -1.41 -1.83 -1.30
NM_014458 KLHL20 5.96E-03 -2.53 -3.29 -1.30
NM_018639 WSB2 1.96E-03 -1.15 -1.50 -1.30
NM_014825 URB1 2.01E-03 -1.69 -2.21 -1.30
NM_018993 RIN2 3.11E-04 -1.35 -1.76 -1.31
NM_006322 TUBGCP3 6.87E-03 -2.26 -2.95 -1.31
NM_001008895 CUL4A 9.39E-03 -1.27 -1.66 -1.31
NM_015338 ASXL1 4.86E-03 -1.67 -2.19 -1.31
NM_003859 DPM1 2.66E-03 -1.15 -1.51 -1.31
NM_001096 ACLY 2.87E-03 -1.21 -1.59 -1.32
NM_000254 MTR 4.69E-03 -1.74 -2.29 -1.32
NM_001025247 TAF5L 1.62E-03 -1.62 -2.13 -1.32
NM_005754 G3BP1 5.78E-04 -1.27 -1.68 -1.32
NM_005334 HCFC1 4.36E-05 -1.25 -1.65 -1.32
NM_014740 EIF4A3 8.78E-04 -1.19 -1.58 -1.32
NM_004508 IDI1 1.17E-03 -1.18 -1.56 -1.32
NM_001130849 CAB39 4.08E-05 -1.20 -1.59 -1.33
NM_001957 EDNRA 1.83E-03 -2.07 -2.75 -1.33
NM_000888 ITGB6 6.90E-03 -1.80 -2.41 -1.34
NM_022081 HPS4 2.81E-03 -1.25 -1.68 -1.35
NM_018380 DDX28 1.42E-03 -1.85 -2.49 -1.35
NM_001127321 CBX5 1.40E-03 -1.13 -1.52 -1.35
NM_001128918 MARK3 3.33E-03 -1.32 -1.79 -1.36
NM_001007024 GOSR1 8.45E-03 -2.01 -2.73 -1.36
NM_015131 WDR43 4.33E-05 -1.60 -2.18 -1.36
NM_002834 PTPN11 5.67E-04 -1.43 -1.94 -1.36
NM_007192 SUPT16H 4.89E-04 -1.47 -2.01 -1.37
NM_001018090 GCOM1 /// GRINL1A 9.74E-03 -1.37 -1.88 -1.37
NM_018117 BRWD2 5.23E-03 -1.32 -1.81 -1.37
NM_014504 RABGEF1 1.33E-03 -1.27 -1.75 -1.38
NM_001241 CCNT2 1.64E-03 -2.15 -2.96 -1.38
NM_018657 MYNN 5.55E-03 -1.45 -2.00 -1.38
NM_015957 APIP 2.59E-04 -1.33 -1.84 -1.38
Page 149
135
NM_005643 TAF11 3.25E-05 -1.32 -1.82 -1.38
NM_017736 THUMPD1 1.53E-03 -1.65 -2.29 -1.38
NM_007375 TARDBP 5.88E-03 -1.11 -1.54 -1.39
NM_001130678 EIF4E 2.32E-03 -1.21 -1.67 -1.39
NM_001100626 ERLIN1 4.06E-03 -1.12 -1.56 -1.39
NM_002911 UPF1 3.55E-04 -1.18 -1.64 -1.39
NM_014388 C1orf107 3.03E-03 -1.17 -1.63 -1.39
NM_004856 KIF23 1.41E-04 -2.14 -2.97 -1.39
NM_005429 VEGFC 7.88E-05 -1.22 -1.70 -1.39
NM_001031701 NT5DC3 2.61E-03 -1.26 -1.76 -1.40
NM_000373 UMPS 5.38E-04 -2.73 -3.81 -1.40
NM_198256 E2F6 4.20E-03 -1.44 -2.03 -1.41
NM_004697 PRPF4 2.67E-03 -2.45 -3.45 -1.41
NM_017953 ZNHIT6 8.23E-03 -2.18 -3.07 -1.41
NM_024644 C14orf169 3.38E-04 -3.28 -4.62 -1.41
NM_030755 TXNDC1 6.72E-03 -1.15 -1.63 -1.41
NM_000662 NAT1 2.36E-03 -2.90 -4.09 -1.41
NM_014166 MED4 6.22E-03 -1.36 -1.93 -1.42
NM_003800 RNGTT 9.58E-03 -1.10 -1.56 -1.42
NM_014941 MORC2 8.82E-03 -1.41 -2.00 -1.42
NM_004580 RAB27A 7.17E-03 -2.07 -2.94 -1.42
NM_003170 SUPT6H 5.67E-03 -1.08 -1.54 -1.42
NM_014388 C1orf107 9.08E-03 -1.57 -2.24 -1.43
NM_025222 WDR82 4.25E-03 -1.12 -1.60 -1.43
NM_018361 AGPAT5 1.61E-03 -1.82 -2.60 -1.43
NM_025076 UXS1 1.35E-05 -1.24 -1.78 -1.43
NM_001007239 KIAA0859 3.56E-04 -1.75 -2.52 -1.44
NM_003486 SLC7A5 4.37E-04 -1.12 -1.61 -1.44
NM_018469 TEX2 3.62E-04 -1.11 -1.59 -1.44
NM_001358 DHX15 3.65E-04 -1.14 -1.64 -1.44
NM_015462 NOL11 4.69E-04 -2.06 -2.96 -1.44
NM_001083914 CTBP2 6.53E-03 -1.21 -1.74 -1.44
NM_003925 MBD4 2.70E-03 -1.54 -2.21 -1.44
NM_003350 UBE2V2 8.92E-04 -1.26 -1.82 -1.44
NM_030628 INTS5 2.17E-03 -1.46 -2.11 -1.44
NM_001003690 MAD2L1BP 1.98E-03 -1.24 -1.79 -1.44
NM_017665 ZCCHC10 8.17E-03 -2.39 -3.48 -1.45
NM_199072 MDFIC 6.79E-03 -1.40 -2.03 -1.45
NM_014657 KIAA0406 1.85E-03 -2.12 -3.09 -1.46
NM_004549 NDUFC2 2.75E-04 -1.16 -1.68 -1.46
NM_002417 MKI67 2.46E-03 -1.10 -1.60 -1.46
NM_001085458 CTNND1 4.49E-05 -1.27 -1.85 -1.46
NM_000361 THBD 1.01E-04 -2.51 -3.66 -1.46
NM_014616 ATP11B 7.75E-03 -1.14 -1.66 -1.46
NM_000788 DCK 4.94E-03 -1.57 -2.29 -1.46
NM_001135943 MADD 9.27E-03 -1.05 -1.53 -1.46
NM_0043188 ASPH 1.48E-03 -1.23 -1.79 -1.46
NM_001085458 CTNND1 1.49E-03 -1.15 -1.68 -1.46
NM_003934 FUBP3 1.52E-03 -1.47 -2.14 -1.46
NM_014078 MRPL13 2.30E-04 -1.18 -1.73 -1.47
NM_018082 POLR3B 1.12E-03 -2.37 -3.51 -1.48
NM_024747 HPS6 3.07E-05 -2.80 -4.13 -1.48
NM_001033521 CSTF1 3.22E-03 -2.04 -3.01 -1.48
NM_001024808 BCL7A 1.66E-03 -1.31 -1.94 -1.48
NM_014751 MTSS1 3.01E-04 -1.24 -1.83 -1.48
NM_003600 AURKA 1.89E-03 -1.33 -1.98 -1.48
NM_001128844 SMARCA4 3.40E-03 -1.03 -1.54 -1.49
NM_001098424 DLG1 4.05E-03 -1.10 -1.64 -1.50
NM_001042510 ZNF706 6.43E-04 -1.15 -1.73 -1.50
NM_004953 EIF4G1 5.12E-04 -1.11 -1.67 -1.51
NM_022470 ZMAT3 3.01E-03 -1.04 -1.57 -1.51
NM_001005739 VPS54 3.64E-03 -2.09 -3.15 -1.51
NM_001042388 PPP4R1 2.85E-03 -1.14 -1.73 -1.51
NM_005926 MFAP1 6.93E-03 -1.27 -1.92 -1.51
NM_080686 BAT2 8.22E-04 -1.18 -1.78 -1.51
NM_005466 MED6 7.22E-05 -1.33 -2.01 -1.51
NM_000373 UMPS 2.15E-04 -2.41 -3.65 -1.51
NM_003615 SLC4A7 7.34E-05 -1.48 -2.24 -1.51
NM_024745 SHCBP1 8.11E-03 -1.95 -2.95 -1.51
NM_006624 ZMYND11 6.07E-03 -1.32 -1.99 -1.52
Page 150
136
NM_004161 RAB1A 1.58E-03 -1.16 -1.76 -1.52
NM_014820 TOMM70A 1.44E-03 -1.20 -1.83 -1.52
NM_002182 IL1RAP 6.90E-04 -1.40 -2.13 -1.52
NM_004729 ZBED1 1.03E-04 -1.31 -2.00 -1.52
NM_018380 DDX28 8.17E-05 -2.01 -3.07 -1.52
NM_000445 PLEC1 3.74E-03 -1.21 -1.84 -1.52
NM_020368 UTP3 1.19E-05 -1.68 -2.57 -1.53
NM_001128615 ARHGEF3 2.40E-03 -1.26 -1.92 -1.53
NM_007114 TMF1 2.17E-03 -1.35 -2.06 -1.53
NM_015073 SIPA1L3 1.88E-03 -1.11 -1.70 -1.53
NM_006267 RANBP2 7.93E-04 -1.44 -2.21 -1.54
NM_001009993 FAM168B 5.93E-03 1.00 -1.53 -1.54
NM_002956 CLIP1 1.04E-03 -1.27 -1.96 -1.54
NM_005607 PTK2 2.54E-03 -1.08 -1.66 -1.54
NM_012408 ZMYND8 2.37E-03 -2.26 -3.48 -1.54
NM_013286 RBM15B 3.56E-03 -1.30 -2.00 -1.54
NM_018994 FBXO42 3.22E-03 -1.27 -1.96 -1.54
NM_003198 TCEB3 2.21E-04 -2.50 -3.87 -1.55
--- --- 2.25E-03 -1.49 -2.31 -1.55
NM_024620 ZNF329 6.54E-03 -1.62 -2.52 -1.55
NM_006387 CHERP 3.80E-04 -1.79 -2.77 -1.55
NM_001457 FLNB 7.53E-03 -1.02 -1.59 -1.56
NM_003201 TFAM 3.55E-03 -1.74 -2.72 -1.56
NM_001100398 GARNL4 1.09E-03 -1.23 -1.93 -1.57
NM_030628 INTS5 2.57E-03 -1.89 -2.97 -1.57
NM_003640 IKBKAP 6.82E-04 -1.25 -1.97 -1.57
NM_003796 C19orf2 1.45E-03 -1.27 -1.99 -1.57
NM_016284 CNOT1 5.72E-04 -1.37 -2.15 -1.57
NM_017669 ERCC6L 7.17E-05 -2.00 -3.15 -1.57
NM_012207 HNRNPH3 7.80E-03 -1.09 -1.71 -1.58
NM_002748 MAPK6 (erk 3) 3.46E-03 -1.23 -1.95 -1.58
NM_020336 KIAA1219 4.05E-03 -1.59 -2.51 -1.58
NM_001007024 GOSR1 1.29E-05 -1.68 -2.65 -1.58
NM_012164 FBXW2 9.92E-03 -1.19 -1.88 -1.58
NM_012406 PRDM4 3.34E-03 -1.14 -1.80 -1.58
NM_012207 HNRNPH3 2.15E-03 -1.14 -1.80 -1.58
NM_006363 SEC23B 5.39E-03 -1.48 -2.34 -1.58
NM_003170 SUPT6H 5.02E-03 -1.05 -1.68 -1.59
NM_015283 DPY19L1 3.01E-03 -1.11 -1.78 -1.60
NM_003439 ZKSCAN1 3.61E-03 -2.09 -3.35 -1.60
NM_006565 CTCF 1.66E-03 -2.57 -4.13 -1.60
NM_002834 PTPN11 7.64E-03 -1.06 -1.70 -1.61
NM_001136115 FBXO28 7.44E-03 -1.39 -2.24 -1.61
NM_003463 PTP4A1 4.17E-03 -1.02 -1.65 -1.61
NM_001033085 HAT1 1.13E-03 -1.11 -1.79 -1.61
NM_004318 ASPH 2.29E-05 -1.25 -2.02 -1.61
NM_003584 DUSP11 1.49E-05 -1.56 -2.53 -1.62
NM_016248 AKAP11 4.89E-03 -1.60 -2.59 -1.62
NM_015110 SMC5 9.34E-03 -1.37 -2.21 -1.62
NM_005760 CEBPZ 7.48E-04 -1.49 -2.43 -1.63
NM_001241 CCNT2 5.17E-04 -1.84 -2.99 -1.63
NM_004973 JARID2 3.42E-04 -1.21 -1.97 -1.64
NM_003107 SOX4 4.07E-04 -1.40 -2.29 -1.64
NM_001130107 KLC1 4.03E-03 -1.22 -2.00 -1.65
NM_001624 AIM1 1.49E-03 -1.08 -1.79 -1.65
NM_022754 SFXN1 4.04E-03 -1.13 -1.88 -1.66
NM_002408 MGAT2 1.16E-03 -1.71 -2.84 -1.66
--- --- 7.20E-03 -1.05 -1.75 -1.66
NM_012346 NUP62 1.61E-03 -1.25 -2.08 -1.67
NM_018492 PBK 1.70E-03 -1.32 -2.20 -1.67
NM_015500 C2CD2 7.20E-04 -1.64 -2.74 -1.67
NM_015634 KIAA1279 1.45E-03 -1.71 -2.87 -1.67
NM_003590 CUL3 9.25E-04 -2.59 -4.34 -1.68
NM_001042426 CENPA 6.16E-04 -1.30 -2.20 -1.69
NM_001114978 TP63 5.51E-04 -1.15 -1.95 -1.70
NM_005680 TAF1B 6.29E-03 -1.16 -1.98 -1.71
NM_012406 PRDM4 8.36E-03 1.01 -1.70 -1.71
NM_025126 RNF34 3.66E-03 -1.66 -2.84 -1.71
NM_001137550 LRRFIP1 4.08E-03 -1.04 -1.78 -1.72
NM_016195 KIF20B 6.21E-04 -1.28 -2.20 -1.72
Page 151
137
NM_005724 TSPAN3 6.59E-03 1.01 -1.70 -1.72
NM_000376 VDR 3.46E-06 -1.52 -2.62 -1.73
NM_001128930 ENTPD4 7.39E-03 -2.05 -3.55 -1.74
NM_017542 POGK 4.67E-06 -2.28 -3.96 -1.74
NM_003129 SQLE 3.02E-03 -1.01 -1.76 -1.74
NM_015056 RRP1B 2.14E-03 -1.18 -2.07 -1.75
NM_015409 EP400 5.11E-05 -1.28 -2.23 -1.75
NM_003401 XRCC4 9.61E-05 -1.39 -2.43 -1.75
NM_016441 CRIM1 8.46E-03 -1.05 -1.84 -1.75
NM_019589 YLPM1 5.06E-03 -1.22 -2.14 -1.75
NM_000361 THBD 3.56E-05 -2.17 -3.82 -1.75
NM_003750 EIF3A 4.26E-03 -2.43 -4.28 -1.76
NM_002589 PCDH7 2.60E-04 -2.10 -3.70 -1.76
NM_001358 DHX15 6.63E-03 1.01 -1.75 -1.77
NM_016258 YTHDF2 1.14E-03 -1.31 -2.31 -1.77
NM_001717 BNC1 6.41E-03 -1.04 -1.84 -1.77
NM_001618 PARP1 6.49E-03 1.02 -1.75 -1.77
NM_001042635 NGDN 4.20E-03 -1.49 -2.65 -1.78
NM_001040020 FAM3C 8.51E-03 -1.13 -2.03 -1.79
NM_002589 PCDH7 8.54E-04 -1.69 -3.03 -1.79
NM_021960 MCL1 2.53E-03 -1.12 -2.00 -1.79
NM_004747 DLG5 2.01E-03 -1.05 -1.89 -1.80
NM_001100819 MOBKL3 5.01E-03 -1.50 -2.70 -1.80
NM_001025107 ADAR 6.62E-03 -1.03 -1.87 -1.81
NM_030621 DICER1 2.59E-04 -2.93 -5.31 -1.81
NM_024513 FYCO1 1.17E-03 -1.31 -2.38 -1.81
NM_000376 VDR 7.98E-04 -1.38 -2.52 -1.82
NM_015339 ADNP 1.28E-04 -1.97 -3.62 -1.84
NM_001130674 CALU 4.17E-03 -1.13 -2.08 -1.85
NM_017582 UBE2Q1 9.56E-03 -1.16 -2.15 -1.85
NM_002902 RCN2 1.64E-03 -1.07 -1.99 -1.85
NM_005737 ARL4C 8.49E-03 1.01 -1.84 -1.86
NM_001005476 PKP4 6.64E-03 -1.01 -1.88 -1.87
NM_016604 JMJD1B 1.03E-03 -1.34 -2.50 -1.87
NM_006822 RAB40B 5.79E-03 -1.36 -2.53 -1.87
NM_012167 FBXO11 2.03E-03 -1.29 -2.41 -1.87
NM_004705 PRKRIR 6.44E-04 -1.67 -3.12 -1.87
NM_002816 PSMD12 2.06E-03 -1.09 -2.04 -1.88
NM_018092 NETO2 1.35E-03 -1.68 -3.16 -1.88
NM_003794 SNX4 6.28E-03 -1.37 -2.58 -1.88
NM_024654 NOL9 3.01E-03 -1.10 -2.08 -1.89
NM_003045 SLC7A1 4.54E-03 -1.04 -1.96 -1.89
NM_015354 NUP188 6.39E-03 -1.25 -2.37 -1.89
NM_015134 MPRIP 7.14E-03 1.01 -1.89 -1.91
NM_000176 NR3C1 1.39E-04 -1.42 -2.71 -1.91
NM_152758 YTHDF3 1.70E-03 -1.48 -2.84 -1.91
NM_018200 HMG20A 7.30E-03 -1.19 -2.28 -1.92
NM_002938 RNF4 7.78E-03 1.01 -1.90 -1.92
NM_004346 CASP3 6.63E-03 -1.02 -1.96 -1.92
NM_198834 ACACA 7.24E-03 1.03 -1.89 -1.93
NM_017782 C10orf18 3.29E-03 -1.42 -2.76 -1.94
NM_001105515 ABCC4 7.23E-03 -1.07 -2.08 -1.94
NM_015134 MPRIP 9.28E-03 1.01 -1.92 -1.94
NM_013231 FLRT2 7.98E-04 -1.10 -2.14 -1.95
NM_006391 IPO7 4.00E-03 -1.08 -2.11 -1.96
NM_002408 MGAT2 7.07E-04 -1.70 -3.34 -1.97
NM_003470 USP7 2.60E-03 -1.42 -2.80 -1.97
NM_003681 PDXK 9.33E-03 -1.04 -2.06 -1.98
NM_000346 SOX9 4.23E-04 -1.68 -3.34 -1.99
NM_015315 LARP1 9.94E-03 1.06 -1.87 -1.99
NM_003898 SYNJ2 2.62E-03 -1.68 -3.37 -2.00
NM_003796 C19orf2 1.61E-04 -1.41 -2.83 -2.01
NM_005116 SLC23A2 6.34E-03 -1.18 -2.38 -2.02
NM_015342 PPWD1 5.29E-03 -1.32 -2.67 -2.02
NM_000179 MSH6 1.12E-03 -1.31 -2.66 -2.03
NM_000214 JAG1 7.81E-03 -1.08 -2.20 -2.03
NM_004776 B4GALT5 6.67E-04 -1.21 -2.46 -2.03
NM_002816 PSMD12 5.71E-04 -1.24 -2.52 -2.03
NM_001143667 ZBED5 5.69E-03 -1.49 -3.03 -2.04
NM_001142522 FBXO5 1.60E-03 -1.61 -3.27 -2.04
Page 152
138
NM_001083924 C1orf116 1.31E-03 -1.81 -3.70 -2.04
NM_001018009 SH3BP5 8.23E-03 -1.35 -2.78 -2.05
NM_032195 SON 2.15E-03 -1.21 -2.49 -2.06
NM_014866 SEC16A 1.99E-03 -1.25 -2.58 -2.07
NM_152260 RPUSD2 2.54E-03 -1.36 -2.81 -2.07
NM_003414 ZNF267 4.18E-03 -1.27 -2.63 -2.07
NM_006311 NCOR1 4.66E-03 -1.15 -2.40 -2.08
NM_178812 MTDH 5.19E-03 -1.05 -2.21 -2.10
NM_015048 SETD1B 1.64E-03 -1.16 -2.44 -2.11
NM_001100819 MOBKL3 1.67E-03 -1.20 -2.57 -2.13
NM_002834 PTPN11 3.40E-03 -1.24 -2.65 -2.14
NM_003325 HIRA 4.51E-03 -1.23 -2.62 -2.14
NM_001048166 STIL 4.93E-03 -1.40 -3.00 -2.14
NM_017798 YTHDF1 9.76E-03 1.04 -2.07 -2.15
NM_015158 KANK1 2.22E-04 -1.51 -3.28 -2.16
NM_003794 SNX4 3.58E-03 -1.23 -2.67 -2.17
NM_007034 DNAJB4 3.49E-03 -1.34 -2.91 -2.18
NM_006267 RANBP2 6.46E-03 -1.03 -2.27 -2.19
--- --- 3.76E-03 -1.39 -3.05 -2.20
NM_012164 FBXW2 5.04E-03 -1.20 -2.64 -2.20
NM_004645 COIL 7.63E-04 -2.20 -4.91 -2.24
NM_012334 MYO10 2.30E-06 -1.61 -3.62 -2.25
NM_002430 MN1 8.56E-04 -1.46 -3.31 -2.26
NM_003489 NRIP1 3.39E-04 -1.62 -3.68 -2.27
NM_004093 EFNB2 5.72E-04 -1.19 -2.74 -2.30
NM_032195 SON 7.93E-04 -1.13 -2.60 -2.30
NM_014264 PLK4 8.52E-03 -1.07 -2.47 -2.30
NM_014016 SACM1L 9.94E-03 -1.05 -2.42 -2.32
NM_018343 RIOK2 9.31E-04 -2.23 -5.19 -2.32
NM_005513 GTF2E1 1.75E-04 -1.56 -3.62 -2.32
NM_016604 JMJD1B 3.38E-03 -1.60 -3.72 -2.32
NM_001755 CBFB 6.18E-04 -1.63 -3.81 -2.35
NM_002296 LBR 9.91E-03 1.05 -2.23 -2.35
NM_199072 MDFIC 6.57E-03 -1.19 -2.79 -2.35
NM_001079673 FNDC3A 9.25E-03 1.01 -2.33 -2.36
NM_015070 ZC3H13 5.00E-03 -1.93 -4.58 -2.37
NM_004627 WRB 9.69E-04 -1.76 -4.26 -2.42
NM_014671 UBE3C 1.60E-03 -1.14 -2.79 -2.44
NM_005895 GOLGA3 2.21E-03 -1.14 -2.78 -2.44
NM_014633 CTR9 1.40E-03 -1.14 -2.82 -2.48
NM_006420 ARFGEF2 1.59E-03 -1.16 -2.88 -2.48
NM_014838 ZBED4 5.08E-03 -1.13 -2.83 -2.51
NR_024275 LOC151162 8.58E-03 1.02 -2.46 -2.51
NM_003590 CUL3 1.85E-03 -1.12 -2.84 -2.53
NM_007034 DNAJB4 6.85E-03 -1.20 -3.04 -2.53
NM_015113 ZZEF1 4.67E-03 -1.02 -2.58 -2.54
NM_015123 FRMD4B 7.37E-03 -1.17 -3.02 -2.58
NM_001008925 RCHY1 3.50E-03 -1.47 -3.82 -2.59
NM_018149 C17orf71 7.84E-05 -1.94 -5.09 -2.62
NM_012096 APPL1 6.16E-03 -1.13 -2.97 -2.63
NM_002417 MKI67 8.93E-03 1.05 -2.52 -2.64
NM_001135820 TMEM2 7.08E-03 1.07 -2.48 -2.65
NM_001127231 AUTS2 9.36E-03 -1.06 -2.81 -2.67
NM_004815 ARHGAP29 3.06E-03 -1.04 -2.78 -2.67
NM_017742 ZCCHC2 7.06E-03 -1.23 -3.30 -2.68
NM_003129 SQLE 3.53E-04 -1.44 -3.89 -2.70
NM_032139 ANKRD27 8.14E-03 -1.13 -3.06 -2.70
NM_006267 RANBP2 1.60E-03 -1.10 -3.04 -2.77
--- --- 6.84E-03 1.09 -2.56 -2.79
NM_024546 RNF219 5.28E-04 -1.69 -4.75 -2.81
NM_015168 ZC3H4 8.07E-05 -2.07 -5.85 -2.83
NM_014048 MKL2 4.30E-03 -1.33 -3.79 -2.84
NM_001004065 AKAP2 /// PALM2 /// PALM2-AKAP2 9.73E-03 1.10 -2.59 -2.86
NM_001412 EIF1AX 3.39E-03 -1.30 -3.76 -2.89
NM_001142546 LUZP1 8.48E-03 -1.02 -3.00 -2.93
NM_003797 EED 1.03E-03 -1.93 -5.75 -2.99
NM_005859 PURA 3.68E-03 -1.14 -3.41 -2.99
NM_001548 IFIT1 3.86E-04 -1.30 -3.92 -3.01
NM_005206 CRK 5.54E-03 1.07 -2.83 -3.03
NM_001102653 OTUD4 4.02E-03 -1.04 -3.17 -3.06
Page 153
139
NM_012161 FBXL5 3.85E-03 -1.14 -3.52 -3.09
NM_014319 LEMD3 8.32E-03 1.04 -2.99 -3.12
NM_001042369 TROVE2 8.56E-03 -1.00 -3.23 -3.21
NM_015156 RCOR1 7.38E-03 1.04 -3.11 -3.22
NM_025164 KIAA0999 2.95E-03 -1.19 -3.87 -3.25
NM_012416 RANBP6 2.66E-04 -1.86 -6.13 -3.30
NM_014918 CHSY1 2.32E-03 -1.22 -4.11 -3.36
NM_152301 MRFAP1L1 5.04E-03 -1.04 -3.53 -3.41
NM_014023 WDR37 4.94E-03 -1.26 -4.44 -3.51
NM_003478 CUL5 6.91E-03 -1.17 -4.14 -3.54
NM_015325 KIAA0947 9.34E-03 -1.01 -3.75 -3.70
NM_016436 PHF20 8.79E-03 -1.19 -4.44 -3.72
NM_021194 SLC30A1 8.59E-03 1.00 -3.78 -3.78
NM_001100594 SNRK 9.61E-03 1.06 -3.65 -3.88
NM_014705 DOCK4 9.72E-03 -1.20 -4.73 -3.93
NM_004973 JARID2 7.58E-03 -1.18 -4.68 -3.95
NM_001100590 KIAA0232 4.47E-03 -1.15 -4.62 -4.01
NM_145290 GPR125 9.66E-03 1.08 -3.77 -4.08
NM_007172 NUP50 5.36E-04 -1.26 -5.36 -4.27
NM_001079846 CREBBP 6.66E-03 1.07 -4.12 -4.40
NM_015045 WAPAL 2.42E-03 -1.42 -6.24 -4.40
NM_014602 PIK3R4 2.79E-03 -1.03 -4.59 -4.47
NM_001142597 CLP1 4.15E-03 1.02 -5.07 -5.19
NM_001003698 RREB1 4.17E-03 -1.06 -6.17 -5.84
NM_015322 FEM1B 8.06E-03 1.10 -5.91 -6.50
NM_018136 ASPM 6.90E-03 1.12 -7.67 -8.55
Page 154
140
APPENDIX D
CO-CULTURE MICROARRAY DATA
Page 155
141
P value Fold Change GENBANK_ACCESSION Gene Name
2.54E-04 12.67 NM_000104 CYTOCHROME P450, FAMILY 1, SUBFAMILY B, POLYPEPTIDE 1
5.26E-06 12.31 NM_000600 INTERLEUKIN 6 (INTERFERON, BETA 2)
4.95E-05 11.54 NM_005261 GTP BINDING PROTEIN OVEREXPRESSED IN SKELETAL MUSCLE
1.20E-05 11.41 NM_000584 INTERLEUKIN 8
3.48E-06 11.39 NM_000600 INTERLEUKIN 6 (INTERFERON, BETA 2)
4.79E-05 11.25 NM_006273 CHEMOKINE (C-C MOTIF) LIGAND 7
4.79E-09 9.83 NM_006850 INTERLEUKIN 24
3.71E-05 9.38 NM_001122 ADIPOSE DIFFERENTIATION-RELATED PROTEIN
1.20E-03 9.37 BC016934 SUPEROXIDE DISMUTASE 2, MITOCHONDRIAL
1.14E-03 9.06 NM_153607 ADULT RETINA PROTEIN
3.18E-06 8.12 NM_002422 MATRIX METALLOPEPTIDASE 3 (STROMELYSIN 1, PROGELATINASE)
7.98E-04 7.98 NM_007115 TUMOR NECROSIS FACTOR, ALPHA-INDUCED PROTEIN 6
4.99E-04 7.75 NM_000758 COLONY STIMULATING FACTOR 2 (GRANULOCYTE-MACROPHAGE)
3.74E-05 7.41 NM_006850 INTERLEUKIN 24
1.11E-03 6.97 NM_000576 INTERLEUKIN 1, BETA
1.08E-04 6.86 NM_004694 SOLUTE CARRIER FAMILY 16 (MONOCARBOXYLIC ACID TRANSPORTERS), MEMBER 6
1.01E-03 6.58 NM_005524 HAIRY AND ENHANCER OF SPLIT 1, (DROSOPHILA)
1.09E-03 6.40 NM_134260 RAR-RELATED ORPHAN RECEPTOR A
5.90E-04 6.36 NM_000640 INTERLEUKIN 13 RECEPTOR, ALPHA 2
5.24E-05 6.25 NM_005524 HAIRY AND ENHANCER OF SPLIT 1, (DROSOPHILA)
1.30E-03 6.18 NM_003064 SECRETORY LEUKOCYTE PEPTIDASE INHIBITOR
1.41E-04 5.92 NM_001040708
1.39E-05 5.82 NM_017644 KELCH-LIKE 24 (DROSOPHILA)
1.23E-04 5.77 NM_170744 UNC-5 HOMOLOG B (C. ELEGANS)
1.12E-04 5.69 BM129308 STANNIOCALCIN 1
2.29E-04 5.69 NM_000576 INTERLEUKIN 1, BETA
1.49E-05 5.51 NM_005524 HAIRY AND ENHANCER OF SPLIT 1, (DROSOPHILA)
6.19E-04 5.43 NM_152431 PIWI-LIKE 4 (DROSOPHILA)
6.68E-05 5.24 AW138903 NOTCH HOMOLOG 3 (DROSOPHILA)
1.00E-03 5.14 NM_138461 TRANSMEMBRANE 4 L SIX FAMILY MEMBER 19
1.78E-05 5.13 NM_005980 S100 CALCIUM BINDING PROTEIN P
3.73E-04 4.99 NM_001040619
6.49E-04 4.99 NM_014079 KRUPPEL-LIKE FACTOR 15
2.53E-07 4.91 NM_003900 SEQUESTOSOME 1
2.56E-05 4.66 NM_000574 CD55 ANTIGEN, DECAY ACCELERATING FACTOR FOR COMPLEMENT (CROMER BLOOD GROUP)
4.49E-05 4.65 THC2698311
2.62E-04 4.62 NM_006290 TUMOR NECROSIS FACTOR, ALPHA-INDUCED PROTEIN 3
1.36E-04 4.55 NM_005114 HEPARAN SULFATE (GLUCOSAMINE) 3-O-SULFOTRANSFERASE 1
1.87E-07 4.53 NM_001920 DECORIN
7.09E-04 4.52 NM_001200 BONE MORPHOGENETIC PROTEIN 2
5.62E-04 4.51 NM_002575 SERPIN PEPTIDASE INHIBITOR, CLADE B (OVALBUMIN), MEMBER 2
4.73E-04 4.50 NM_000574 CD55 ANTIGEN, DECAY ACCELERATING FACTOR FOR COMPLEMENT (CROMER BLOOD GROUP)
1.26E-03 4.46 NM_000963 PROSTAGLANDIN-ENDOPEROXIDE SYNTHASE 2 (PROSTAGLANDIN G/H SYNTHASE AND CYCLOOXYGENASE)
9.87E-04 4.44 AA969200 CD55 ANTIGEN, DECAY ACCELERATING FACTOR FOR COMPLEMENT (CROMER BLOOD GROUP)
5.78E-04 4.42 NM_000963 PROSTAGLANDIN-ENDOPEROXIDE SYNTHASE 2 (PROSTAGLANDIN G/H SYNTHASE AND CYCLOOXYGENASE)
1.53E-05 4.38 NM_002345 LUMICAN
1.05E-05 4.37 NM_000963 PROSTAGLANDIN-ENDOPEROXIDE SYNTHASE 2 (PROSTAGLANDIN G/H SYNTHASE AND CYCLOOXYGENASE)
2.08E-05 4.34 NM_000963 PROSTAGLANDIN-ENDOPEROXIDE SYNTHASE 2 (PROSTAGLANDIN G/H SYNTHASE AND CYCLOOXYGENASE)
4.26E-04 4.34 NM_002089 CHEMOKINE (C-X-C MOTIF) LIGAND 2
1.58E-05 4.29 CD743044 SUPEROXIDE DISMUTASE 2, MITOCHONDRIAL
5.78E-06 4.26 NM_000963 PROSTAGLANDIN-ENDOPEROXIDE SYNTHASE 2 (PROSTAGLANDIN G/H SYNTHASE AND CYCLOOXYGENASE)
3.97E-04 4.25 BQ004014 DECORIN
4.09E-04 4.22 NM_002421 MATRIX METALLOPEPTIDASE 1 (INTERSTITIAL COLLAGENASE)
2.87E-05 4.17 NM_001945 HEPARIN-BINDING EGF-LIKE GROWTH FACTOR
2.57E-04 4.17 NM_000963 PROSTAGLANDIN-ENDOPEROXIDE SYNTHASE 2 (PROSTAGLANDIN G/H SYNTHASE AND CYCLOOXYGENASE)
5.56E-04 4.13 NM_016354 SOLUTE CARRIER ORGANIC ANION TRANSPORTER FAMILY, MEMBER 4A1
3.06E-04 4.13 NM_004417 DUAL SPECIFICITY PHOSPHATASE 1
8.98E-04 4.10 NM_002421 MATRIX METALLOPEPTIDASE 1 (INTERSTITIAL COLLAGENASE)
4.28E-04 4.09 NM_002421 MATRIX METALLOPEPTIDASE 1 (INTERSTITIAL COLLAGENASE)
1.21E-04 4.08 NM_000963 PROSTAGLANDIN-ENDOPEROXIDE SYNTHASE 2 (PROSTAGLANDIN G/H SYNTHASE AND CYCLOOXYGENASE)
2.54E-04 4.05 NM_000963 PROSTAGLANDIN-ENDOPEROXIDE SYNTHASE 2 (PROSTAGLANDIN G/H SYNTHASE AND CYCLOOXYGENASE)
3.17E-04 4.05 NM_000963 PROSTAGLANDIN-ENDOPEROXIDE SYNTHASE 2 (PROSTAGLANDIN G/H SYNTHASE AND CYCLOOXYGENASE)
5.75E-04 4.02 ENST00000299502
2.28E-04 4.00 NM_002421 MATRIX METALLOPEPTIDASE 1 (INTERSTITIAL COLLAGENASE)
8.34E-04 4.00 NM_021724 NUCLEAR RECEPTOR SUBFAMILY 1, GROUP D, MEMBER 1
1.87E-04 3.99 NM_005168 RHO FAMILY GTPASE 3
Page 156
142
3.85E-04 3.95 NM_002421 MATRIX METALLOPEPTIDASE 1 (INTERSTITIAL COLLAGENASE)
4.52E-04 3.94 NM_002421 MATRIX METALLOPEPTIDASE 1 (INTERSTITIAL COLLAGENASE)
2.39E-05 3.94 NM_005168 RHO FAMILY GTPASE 3
5.88E-05 3.93 NM_005168 RHO FAMILY GTPASE 3
9.28E-04 3.93 NM_001024465 SUPEROXIDE DISMUTASE 2, MITOCHONDRIAL
2.40E-04 3.92 NM_002421 MATRIX METALLOPEPTIDASE 1 (INTERSTITIAL COLLAGENASE)
3.51E-05 3.91 BF760214 COLLAGEN, TYPE III, ALPHA 1 (EHLERS-DANLOS SYNDROME TYPE IV, AUTOSOMAL DOMINANT)
6.63E-04 3.90 NM_002421 MATRIX METALLOPEPTIDASE 1 (INTERSTITIAL COLLAGENASE)
3.55E-05 3.87 NM_018440 PHOSPHOPROTEIN ASSOCIATED WITH GLYCOSPHINGOLIPID MICRODOMAINS 1
2.58E-04 3.85 AI620901 WINGLESS-TYPE MMTV INTEGRATION SITE FAMILY, MEMBER 5A
8.96E-06 3.82 NM_000076 CYCLIN-DEPENDENT KINASE INHIBITOR 1C (P57, KIP2)
2.07E-04 3.82 NM_001025370 VASCULAR ENDOTHELIAL GROWTH FACTOR
6.64E-05 3.80 NM_005168 RHO FAMILY GTPASE 3
1.74E-04 3.80 AW276332 LUMICAN
2.52E-04 3.76 NM_002421 MATRIX METALLOPEPTIDASE 1 (INTERSTITIAL COLLAGENASE)
9.69E-05 3.76 NM_005168 RHO FAMILY GTPASE 3
8.25E-05 3.75 NM_005168 RHO FAMILY GTPASE 3
1.75E-04 3.75 NM_002090 CHEMOKINE (C-X-C MOTIF) LIGAND 3
3.23E-04 3.73 NM_001005404 YIPPEE-LIKE 2 (DROSOPHILA)
8.26E-04 3.72 NM_015009 PDZ DOMAIN CONTAINING RING FINGER 3
6.51E-04 3.71 NM_000146 FERRITIN, LIGHT POLYPEPTIDE
4.62E-05 3.71 NM_005168 RHO FAMILY GTPASE 3
3.15E-04 3.70 NM_014330 PROTEIN PHOSPHATASE 1, REGULATORY (INHIBITOR) SUBUNIT 15A
6.86E-06 3.66 NM_002994 CHEMOKINE (C-X-C MOTIF) LIGAND 5
1.06E-05 3.63 NM_003392 WINGLESS-TYPE MMTV INTEGRATION SITE FAMILY, MEMBER 5A
2.19E-04 3.63 NM_002421 MATRIX METALLOPEPTIDASE 1 (INTERSTITIAL COLLAGENASE)
2.78E-04 3.61 NM_173842 INTERLEUKIN 1 RECEPTOR ANTAGONIST
3.78E-05 3.61 NM_005168 RHO FAMILY GTPASE 3
4.94E-04 3.58 NM_005168 RHO FAMILY GTPASE 3
1.75E-05 3.56 NM_005168 RHO FAMILY GTPASE 3
2.92E-04 3.51 NM_182663 RAS ASSOCIATION (RALGDS/AF-6) DOMAIN FAMILY 5
5.95E-08 3.49 ENST00000339446
2.06E-05 3.44 NM_002982 CHEMOKINE (C-C MOTIF) LIGAND 2
3.44E-04 3.44 NM_002971 SPECIAL AT-RICH SEQUENCE BINDING PROTEIN 1 (BINDS TO NUCLEAR MATRIX/SCAFFOLD-ASSOCIATING DNA'S)
1.41E-05 3.38 NM_004177 SYNTAXIN 3A
3.54E-05 3.36 NM_003013 SECRETED FRIZZLED-RELATED PROTEIN 2
1.03E-04 3.32 NM_033035 THYMIC STROMAL LYMPHOPOIETIN
8.21E-04 3.32 NM_002982 CHEMOKINE (C-C MOTIF) LIGAND 2
2.55E-04 3.31 NM_002089 CHEMOKINE (C-X-C MOTIF) LIGAND 2
6.54E-04 3.28 NM_001706 B-CELL CLL/LYMPHOMA 6 (ZINC FINGER PROTEIN 51)
2.39E-05 3.28 NM_002982 CHEMOKINE (C-C MOTIF) LIGAND 2
4.54E-04 3.24 NM_001511 CHEMOKINE (C-X-C MOTIF) LIGAND 1 (MELANOMA GROWTH STIMULATING ACTIVITY, ALPHA)
1.75E-05 3.24 NM_002982 CHEMOKINE (C-C MOTIF) LIGAND 2
7.21E-06 3.23 NM_002006 FIBROBLAST GROWTH FACTOR 2 (BASIC)
1.47E-03 3.21 NM_002006 FIBROBLAST GROWTH FACTOR 2 (BASIC)
2.56E-05 3.19 NM_002982 CHEMOKINE (C-C MOTIF) LIGAND 2
4.27E-04 3.17 NM_002982 CHEMOKINE (C-C MOTIF) LIGAND 2
1.97E-05 3.17 NM_002982 CHEMOKINE (C-C MOTIF) LIGAND 2
7.32E-04 3.16 NM_002982 CHEMOKINE (C-C MOTIF) LIGAND 2
5.52E-04 3.16 NM_006813 PROLINE-RICH NUCLEAR RECEPTOR COACTIVATOR 1
2.49E-04 3.15 AI367654 CCAAT/ENHANCER BINDING PROTEIN (C/EBP), BETA
5.54E-05 3.14 NM_002006 FIBROBLAST GROWTH FACTOR 2 (BASIC)
1.52E-06 3.13 NM_016315 GULP, ENGULFMENT ADAPTOR PTB DOMAIN CONTAINING 1
3.59E-04 3.11 ENST00000381826
1.35E-03 3.11 NM_001025366 VASCULAR ENDOTHELIAL GROWTH FACTOR
2.42E-04 3.11 NM_001005404 YIPPEE-LIKE 2 (DROSOPHILA)
9.53E-05 3.10 NM_001025366 VASCULAR ENDOTHELIAL GROWTH FACTOR
5.65E-04 3.10 NM_002993 CHEMOKINE (C-X-C MOTIF) LIGAND 6 (GRANULOCYTE CHEMOTACTIC PROTEIN 2)
1.57E-04 3.10 NM_002982 CHEMOKINE (C-C MOTIF) LIGAND 2
2.56E-07 3.09 NM_018661 DEFENSIN, BETA 103A
1.02E-04 3.08 NM_002648 PIM-1 ONCOGENE
6.95E-05 3.06 NM_001025366 VASCULAR ENDOTHELIAL GROWTH FACTOR
9.32E-04 3.05 NM_021732 ARGININE VASOPRESSIN-INDUCED 1
2.29E-05 3.02 NM_001338 COXSACKIE VIRUS AND ADENOVIRUS RECEPTOR
7.67E-04 2.99 NM_000090 COLLAGEN, TYPE III, ALPHA 1 (EHLERS-DANLOS SYNDROME TYPE IV, AUTOSOMAL DOMINANT)
1.41E-04 2.97 AK054921 CEREBELLAR DEGENERATION-RELATED PROTEIN 1, 34KDA
1.15E-06 2.95 BC089388
1.03E-06 2.95 AK022913 UBIQUITIN SPECIFIC PEPTIDASE 36
9.60E-04 2.95 NM_007207 DUAL SPECIFICITY PHOSPHATASE 10
6.95E-05 2.94 NM_021229 NETRIN 4
Page 157
143
1.09E-03 2.93 ENST00000390271
6.29E-05 2.90 NM_017705 PROGESTIN AND ADIPOQ RECEPTOR FAMILY MEMBER V
1.00E-04 2.89 NM_003013 SECRETED FRIZZLED-RELATED PROTEIN 2
3.80E-04 2.89 NM_032784 R-SPONDIN 3 HOMOLOG (XENOPUS LAEVIS)
5.45E-04 2.89 NM_006931 SOLUTE CARRIER FAMILY 2 (FACILITATED GLUCOSE TRANSPORTER), MEMBER 3
1.30E-03 2.88 NM_181755 HYDROXYSTEROID (11-BETA) DEHYDROGENASE 1
6.32E-04 2.87 NM_001031746 CHROMOSOME 10 OPEN READING FRAME 72
3.88E-04 2.86 NM_001935 DIPEPTIDYL-PEPTIDASE 4 (CD26, ADENOSINE DEAMINASE COMPLEXING PROTEIN 2)
8.48E-04 2.86 THC2562557
1.01E-03 2.85 NM_004925 AQUAPORIN 3 (GILL BLOOD GROUP)
6.81E-04 2.83 NM_203391 GLYCEROL KINASE
1.21E-03 2.79 NM_016315 GULP, ENGULFMENT ADAPTOR PTB DOMAIN CONTAINING 1
4.04E-04 2.79 BC090920 SIMILAR TO F-BOX ONLY PROTEIN 25
1.02E-03 2.79 THC2575688
4.67E-05 2.79 NM_002006 FIBROBLAST GROWTH FACTOR 2 (BASIC)
1.46E-04 2.76 NM_005384 NUCLEAR FACTOR, INTERLEUKIN 3 REGULATED
8.52E-04 2.76 NM_001048226
1.30E-04 2.76 NM_033647 HELICASE (DNA) B
2.44E-05 2.75 NM_005194 CCAAT/ENHANCER BINDING PROTEIN (C/EBP), BETA
1.40E-05 2.74 NM_005194 CCAAT/ENHANCER BINDING PROTEIN (C/EBP), BETA
1.80E-04 2.74 NM_002581 PREGNANCY-ASSOCIATED PLASMA PROTEIN A, PAPPALYSIN 1
2.31E-04 2.73 NM_003064 SECRETORY LEUKOCYTE PEPTIDASE INHIBITOR
2.40E-04 2.73 NM_004925 AQUAPORIN 3 (GILL BLOOD GROUP)
8.54E-05 2.72 NM_001042483
1.19E-03 2.72 NM_007036 ENDOTHELIAL CELL-SPECIFIC MOLECULE 1
6.80E-06 2.72 NM_005194 CCAAT/ENHANCER BINDING PROTEIN (C/EBP), BETA
6.36E-04 2.70 NM_183422 TSC22 DOMAIN FAMILY, MEMBER 1
7.76E-05 2.70 NM_002006 FIBROBLAST GROWTH FACTOR 2 (BASIC)
7.32E-04 2.69 THC2642537
3.26E-04 2.67 NM_033397 KIAA1754
7.94E-05 2.65 NM_001338 COXSACKIE VIRUS AND ADENOVIRUS RECEPTOR
7.72E-06 2.64 NM_001338 COXSACKIE VIRUS AND ADENOVIRUS RECEPTOR
2.28E-04 2.62 NR_000041 RNA, U12 SMALL NUCLEAR
4.59E-04 2.62 NM_003897 IMMEDIATE EARLY RESPONSE 3
7.61E-05 2.61 NM_005194 CCAAT/ENHANCER BINDING PROTEIN (C/EBP), BETA
1.40E-03 2.61 NM_032573 COILED-COIL DOMAIN CONTAINING 62
9.81E-05 2.59 NM_005194 CCAAT/ENHANCER BINDING PROTEIN (C/EBP), BETA
2.93E-04 2.59 NM_001570 INTERLEUKIN-1 RECEPTOR-ASSOCIATED KINASE 2
1.25E-03 2.58 NM_000167 GLYCEROL KINASE
1.42E-03 2.57 BG950086 DUAL SPECIFICITY PHOSPHATASE 1
2.57E-04 2.57 NM_005194 CCAAT/ENHANCER BINDING PROTEIN (C/EBP), BETA
5.72E-06 2.57 NM_001957 ENDOTHELIN RECEPTOR TYPE A
3.91E-04 2.57 NM_002357 MAX DIMERIZATION PROTEIN 1
1.42E-04 2.56 NM_005194 CCAAT/ENHANCER BINDING PROTEIN (C/EBP), BETA
2.81E-04 2.55 BQ010172 MATRIX METALLOPEPTIDASE 2 (GELATINASE A, 72KDA GELATINASE, 72KDA TYPE IV COLLAGENASE)
1.65E-04 2.55 NM_012413 GLUTAMINYL-PEPTIDE CYCLOTRANSFERASE (GLUTAMINYL CYCLASE)
2.35E-04 2.55 NM_006504 PROTEIN TYROSINE PHOSPHATASE, RECEPTOR TYPE, E
1.30E-04 2.55 NM_006147 INTERFERON REGULATORY FACTOR 6
8.48E-05 2.55 NM_005194 CCAAT/ENHANCER BINDING PROTEIN (C/EBP), BETA
1.25E-03 2.55 AI915259 PLATELET-DERIVED GROWTH FACTOR RECEPTOR, BETA POLYPEPTIDE
4.46E-04 2.53 NM_000710 BRADYKININ RECEPTOR B1
9.93E-04 2.52 NM_003196 TRANSCRIPTION ELONGATION FACTOR A (SII), 3
5.83E-04 2.52 AL547890 GROWTH ARREST-SPECIFIC 5
6.36E-04 2.51 NM_000877 INTERLEUKIN 1 RECEPTOR, TYPE I
2.23E-04 2.50 NM_020422 PROMETHIN
5.65E-04 2.49 NM_181671 PHOSPHATIDYLINOSITOL TRANSFER PROTEIN, CYTOPLASMIC 1
7.07E-04 2.49 NM_001025370 VASCULAR ENDOTHELIAL GROWTH FACTOR
3.26E-04 2.49 AI669361 SOLUTE CARRIER FAMILY 38, MEMBER 2
6.44E-05 2.48 NM_020651 PELLINO HOMOLOG 1 (DROSOPHILA)
1.81E-04 2.48 NM_001042507
5.73E-05 2.48 NM_000618 INSULIN-LIKE GROWTH FACTOR 1 (SOMATOMEDIN C)
1.81E-04 2.47 AF349445 MAXI-K CHANNEL HSLO
1.81E-04 2.47 AF349445 POTASSIUM LARGE CONDUCTANCE CALCIUM-ACTIVATED CHANNEL, SUBFAMILY M, ALPHA MEMBER 1
6.58E-04 2.47 NM_000710 BRADYKININ RECEPTOR B1
5.14E-04 2.45 NM_152586 UBIQUITIN SPECIFIC PEPTIDASE 54
6.02E-04 2.44 NM_138411 HYPOTHETICAL PROTEIN LOC284361
6.02E-04 2.44 NM_138411 HYPOTHETICAL PROTEIN BC004941
2.32E-04 2.44 NM_000081 LYSOSOMAL TRAFFICKING REGULATOR
1.92E-04 2.44 NM_005194 CCAAT/ENHANCER BINDING PROTEIN (C/EBP), BETA
4.34E-04 2.44 NM_005194 CCAAT/ENHANCER BINDING PROTEIN (C/EBP), BETA
Page 158
144
2.65E-04 2.43 NM_019060 CHROMOSOME 1 OPEN READING FRAME 42
1.33E-03 2.42 NM_002970 SPERMIDINE/SPERMINE N1-ACETYLTRANSFERASE
1.16E-04 2.41 BC047030 URIDINE PHOSPHORYLASE 1
1.14E-03 2.41 NM_002166 INHIBITOR OF DNA BINDING 2, DOMINANT NEGATIVE HELIX-LOOP-HELIX PROTEIN
9.01E-05 2.41 NM_000759 COLONY STIMULATING FACTOR 3 (GRANULOCYTE)
1.15E-03 2.41 NR_002578 GROWTH ARREST-SPECIFIC 5
4.60E-04 2.41 NM_003004 SECRETED AND TRANSMEMBRANE 1
3.20E-05 2.40 AL834140
1.77E-04 2.39 S73202 ARGININOSUCCINATE SYNTHETASE PROTEIN
1.18E-04 2.36 NM_133372 KIAA1961 GENE
1.36E-03 2.36 NM_020529 NUCLEAR FACTOR OF KAPPA LIGHT POLYPEPTIDE GENE ENHANCER IN B-CELLS INHIBITOR, ALPHA
2.65E-06 2.35 NM_024867 KPL2 PROTEIN
1.02E-03 2.35 NM_001628 ALDO-KETO REDUCTASE FAMILY 1, MEMBER B1 (ALDOSE REDUCTASE)
6.64E-05 2.35 NM_006504 PROTEIN TYROSINE PHOSPHATASE, RECEPTOR TYPE, E
5.25E-04 2.34 NM_003991 ENDOTHELIN RECEPTOR TYPE B
8.74E-04 2.34 THC2565422
8.21E-04 2.34 NR_003605
3.25E-04 2.34 AL833749 HYPOTHETICAL LOC146439
4.15E-04 2.33 NM_004323 BCL2-ASSOCIATED ATHANOGENE
3.55E-04 2.33 NM_018566 YOD1 OTU DEUBIQUINATING ENZYME 1 HOMOLOG ( YEAST)
4.98E-04 2.32 AL109695 SOLUTE CARRIER ORGANIC ANION TRANSPORTER FAMILY, MEMBER 3A1
2.47E-04 2.32 NM_000575 INTERLEUKIN 1, ALPHA
6.51E-04 2.32 NM_018976 SOLUTE CARRIER FAMILY 38, MEMBER 2
3.27E-04 2.31 NM_133639 RAS HOMOLOG GENE FAMILY, MEMBER V
4.24E-04 2.31 NR_000039 RAB9, MEMBER RAS ONCOGENE FAMILY, PSEUDOGENE 1
8.69E-05 2.31 NM_018357 LA RIBONUCLEOPROTEIN DOMAIN FAMILY, MEMBER 6
7.20E-04 2.30 NM_005779 LIPOMA HMGIC FUSION PARTNER-LIKE 2
4.60E-04 2.30 BC094756 MYOTUBULARIN RELATED PROTEIN 11
1.64E-04 2.28 NM_003013 SECRETED FRIZZLED-RELATED PROTEIN 2
2.89E-05 2.28 NM_000050 ARGININOSUCCINATE SYNTHETASE
5.05E-04 2.27 NM_182767 SOLUTE CARRIER FAMILY 6, MEMBER 15
1.22E-03 2.27 AF011794 CELL CYCLE PROGRESSION 1
2.28E-04 2.26 NM_001042610
1.52E-04 2.26 AA573434 KRUPPEL-LIKE FACTOR 4 (GUT)
1.03E-03 2.25 NM_152405 JUNCTION-MEDIATING AND REGULATORY PROTEIN
1.35E-03 2.25 NM_001072 UDP GLUCURONOSYLTRANSFERASE 1 FAMILY, POLYPEPTIDE A6
2.61E-04 2.24 NM_012153 ETS HOMOLOGOUS FACTOR
1.17E-03 2.24 NM_000362 TIMP METALLOPEPTIDASE INHIBITOR 3 (SORSBY FUNDUS DYSTROPHY, PSEUDOINFLAMMATORY)
9.49E-04 2.23 NM_003662 PIRIN (IRON-BINDING NUCLEAR PROTEIN)
1.12E-03 2.22 NM_018433 JUMONJI DOMAIN CONTAINING 1A
7.36E-04 2.22 NM_002237 POTASSIUM VOLTAGE-GATED CHANNEL, SUBFAMILY G, MEMBER 1
1.10E-03 2.22 NM_017771 PX DOMAIN CONTAINING SERINE/THREONINE KINASE
5.22E-05 2.21 NM_080629 COLLAGEN, TYPE XI, ALPHA 1
4.58E-04 2.21 NM_000575 INTERLEUKIN 1, ALPHA
9.07E-05 2.21 NM_003670 BASIC HELIX-LOOP-HELIX DOMAIN CONTAINING, CLASS B, 2
1.46E-03 2.19 NM_005746 PRE-B-CELL COLONY ENHANCING FACTOR 1
8.11E-04 2.19 NM_001042413
1.06E-03 2.19 NM_018371 CHONDROITIN BETA1,4 N-ACETYLGALACTOSAMINYLTRANSFERASE
1.44E-04 2.19 NM_012257 HMG-BOX TRANSCRIPTION FACTOR 1
1.94E-04 2.18 NM_000575 INTERLEUKIN 1, ALPHA
6.41E-04 2.18 NM_015021
1.51E-04 2.18 NM_000575 INTERLEUKIN 1, ALPHA
9.16E-05 2.18 AW952039 ZINC FINGER PROTEIN 496
1.95E-04 2.17 NM_001408 CADHERIN, EGF LAG SEVEN-PASS G-TYPE RECEPTOR 2 (FLAMINGO HOMOLOG, DROSOPHILA)
4.25E-04 2.17 NM_003713 PHOSPHATIDIC ACID PHOSPHATASE TYPE 2B
9.71E-04 2.17 NM_004530 MATRIX METALLOPEPTIDASE 2 (GELATINASE A, 72KDA GELATINASE, 72KDA TYPE IV COLLAGENASE)
4.50E-04 2.17 NM_004071 CDC-LIKE KINASE 1
9.32E-04 2.16 NM_020422 PROMETHIN
1.30E-04 2.16 NM_002994 CHEMOKINE (C-X-C MOTIF) LIGAND 5
1.18E-04 2.15 NM_018976 SOLUTE CARRIER FAMILY 38, MEMBER 2
1.66E-04 2.15 NM_020962 LIKELY ORTHOLOG OF MOUSE NEIGHBOR OF PUNC E11
1.02E-03 2.14 NM_144697 CHROMOSOME 1 OPEN READING FRAME 51
4.90E-04 2.14 NM_000575 INTERLEUKIN 1, ALPHA
1.10E-03 2.14 NM_004530 MATRIX METALLOPEPTIDASE 2 (GELATINASE A, 72KDA GELATINASE, 72KDA TYPE IV COLLAGENASE)
1.34E-03 2.13 BC041893 TETRATRICOPEPTIDE REPEAT DOMAIN 17
2.93E-04 2.13 NM_001001661 ZINC FINGER PROTEIN 425
5.27E-04 2.12 NM_002032 FERRITIN, HEAVY POLYPEPTIDE 1
9.93E-04 2.12 NM_001800 CYCLIN-DEPENDENT KINASE INHIBITOR 2D (P19, INHIBITS CDK4)
8.87E-05 2.11 NM_018566 YOD1 OTU DEUBIQUINATING ENZYME 1 HOMOLOG ( YEAST)
5.86E-04 2.11 NM_005118 TUMOR NECROSIS FACTOR (LIGAND) SUPERFAMILY, MEMBER 15
Page 159
145
1.39E-03 2.11 NM_052885 SOLUTE CARRIER FAMILY 2 (FACILITATED GLUCOSE TRANSPORTER), MEMBER 13
5.84E-04 2.10 AK124426
1.43E-03 2.09 AB188491 OTU DOMAIN CONTAINING 1
1.29E-03 2.09 NM_021818 SALVADOR HOMOLOG 1 (DROSOPHILA)
6.48E-05 2.09 NM_004878 PROSTAGLANDIN E SYNTHASE
1.15E-03 2.09 NM_032412 PUTATIVE NUCLEAR PROTEIN ORF1-FL49
7.48E-04 2.08 NM_000575 INTERLEUKIN 1, ALPHA
3.58E-04 2.08 NM_001037132 NEURONAL CELL ADHESION MOLECULE
1.24E-03 2.08 THC2587036
6.46E-06 2.08 AI803364 HYPOTHETICAL PROTEIN MGC16037
3.77E-04 2.08 NM_019034 RAS HOMOLOG GENE FAMILY, MEMBER F (IN FILOPODIA)
3.67E-04 2.07 H45075 PROTEIN PHOSPHATASE 1, REGULATORY (INHIBITOR) SUBUNIT 3F
3.87E-04 2.07 NM_032521 PAR-6 PARTITIONING DEFECTIVE 6 HOMOLOG BETA (C. ELEGANS)
2.50E-04 2.07 NM_018252 CHROMOSOME 1 OPEN READING FRAME 75
3.89E-04 2.06 NM_004331 BCL2/ADENOVIRUS E1B 19KDA INTERACTING PROTEIN 3-LIKE
3.89E-04 2.06 CB123670
2.05E-04 2.06 NM_015526 CLIP-170-RELATED PROTEIN
1.81E-04 2.05 NM_032573 COILED-COIL DOMAIN CONTAINING 62
8.99E-05 2.05 NM_001007245 INTERFERON-RELATED DEVELOPMENTAL REGULATOR 1
2.20E-04 2.05 NM_032251 HYPOTHETICAL PROTEIN DKFZP434G0920
4.63E-04 2.05 BX537786 NUCLEAR RECEPTOR SUBFAMILY 1, GROUP D, MEMBER 2
6.03E-04 2.05 THC2742812
6.47E-04 2.04 NM_152756 KIAA1999 PROTEIN
7.49E-04 2.04 NM_001030273 ARYL HYDROCARBON RECEPTOR NUCLEAR TRANSLOCATOR-LIKE
1.33E-04 2.03 NM_004071 CDC-LIKE KINASE 1
5.27E-05 2.03 NM_001008219 AMYLASE, ALPHA 2A; PANCREATIC
5.27E-05 2.03 NM_001008219 AMYLASE, ALPHA 1A; SALIVARY
2.04E-04 2.03 NM_005126 NUCLEAR RECEPTOR SUBFAMILY 1, GROUP D, MEMBER 2
5.50E-04 2.03 NM_012090 MICROTUBULE-ACTIN CROSSLINKING FACTOR 1
9.19E-05 2.02 XM_928637 SIMILAR TO ACTIVATING TRANSCRIPTION FACTOR 4
5.21E-04 2.02 NM_003831 RIO KINASE 3 (YEAST)
1.05E-03 2.02 NM_001001417 TBC1 DOMAIN FAMILY, MEMBER 3
1.04E-04 2.02 NM_006948 STRESS 70 PROTEIN CHAPERONE, MICROSOME-ASSOCIATED, 60KDA
6.12E-04 2.01 NM_199330 HOMER HOMOLOG 2 (DROSOPHILA)
3.47E-04 2.01 NM_020387 RAB25, MEMBER RAS ONCOGENE FAMILY
3.01E-04 2.01 NM_005685 GTF2I REPEAT DOMAIN CONTAINING 1
7.73E-04 2.00 NM_007102 GUANYLATE CYCLASE ACTIVATOR 2B (UROGUANYLIN)
3.05E-04 2.00 THC2511310
7.66E-04 2.00 NM_002245 POTASSIUM CHANNEL, SUBFAMILY K, MEMBER 1
7.79E-04 2.00 NM_001206 KRUPPEL-LIKE FACTOR 9
3.61E-04 1.99 NM_012421 REARRANGED L-MYC FUSION
2.54E-04 1.98 NM_017933 HYPOTHETICAL PROTEIN FLJ20701
5.41E-04 1.98 BI521983
1.25E-03 1.98 NM_017712 PYROGLUTAMYL-PEPTIDASE I
8.57E-04 1.97 NM_001080467
9.46E-04 1.96 AK023572
5.23E-04 1.95 NM_203391 GLYCEROL KINASE
1.45E-03 1.95 NM_024422 DESMOCOLLIN 2
4.75E-07 1.95 NM_016621 PHD FINGER PROTEIN 21A
8.90E-04 1.94 NM_001896 CASEIN KINASE 2, ALPHA PRIME POLYPEPTIDE
4.17E-05 1.94 BF366211
8.22E-04 1.94 NM_004126 GUANINE NUCLEOTIDE BINDING PROTEIN (G PROTEIN), GAMMA 11
4.02E-04 1.94 NM_006912 RAS-LIKE WITHOUT CAAX 1
2.95E-04 1.93 NM_207309 UDP-N-ACTEYLGLUCOSAMINE PYROPHOSPHORYLASE 1-LIKE 1
6.40E-04 1.93 NM_014781 RB1-INDUCIBLE COILED-COIL 1
2.83E-04 1.93 NM_001042471
5.35E-04 1.93 AF258583 RAB24, MEMBER RAS ONCOGENE FAMILY
8.88E-04 1.92 NM_002771 PROTEASE, SERINE, 3 (MESOTRYPSIN)
6.32E-05 1.92 NM_006769 LIM DOMAIN ONLY 4
9.63E-04 1.92 NM_016531 KRUPPEL-LIKE FACTOR 3 (BASIC)
1.10E-03 1.92 AF117233 MAKORIN, RING FINGER PROTEIN, 1
1.29E-03 1.92 NM_016848 SHC (SRC HOMOLOGY 2 DOMAIN CONTAINING) TRANSFORMING PROTEIN 3
4.55E-04 1.91 NM_052937 PROTEIN-L-ISOASPARTATE (D-ASPARTATE) O-METHYLTRANSFERASE DOMAIN CONTAINING 1
1.08E-03 1.91 NM_006465 AT RICH INTERACTIVE DOMAIN 3B (BRIGHT- LIKE)
3.95E-04 1.90 ENST00000400104
1.16E-03 1.90 NM_001675 ACTIVATING TRANSCRIPTION FACTOR 4 (TAX-RESPONSIVE ENHANCER ELEMENT B67)
1.21E-03 1.90 NM_152352 CHROMOSOME 18 OPEN READING FRAME 19
9.35E-04 1.89 BQ009471 RING FINGER PROTEIN 130
1.46E-03 1.89 NM_001007245 INTERFERON-RELATED DEVELOPMENTAL REGULATOR 1
1.38E-03 1.88 NR_015377
Page 160
146
2.25E-04 1.88 NM_003442 ZINC FINGER PROTEIN 143 (CLONE PHZ-1)
9.35E-04 1.88 NM_138714 NUCLEAR FACTOR OF ACTIVATED T-CELLS 5, TONICITY-RESPONSIVE
9.34E-04 1.87 NM_014028 OSTEOPETROSIS ASSOCIATED TRANSMEMBRANE PROTEIN 1
2.81E-04 1.86 NM_025160 WD REPEAT DOMAIN 26
9.74E-04 1.85 NM_032095 PROTOCADHERIN GAMMA SUBFAMILY C, 3
9.74E-04 1.85 NM_032095 PROTOCADHERIN GAMMA SUBFAMILY B, 1
1.02E-03 1.85 NM_001675 ACTIVATING TRANSCRIPTION FACTOR 4 (TAX-RESPONSIVE ENHANCER ELEMENT B67)
6.62E-04 1.85 NM_182565 FAMILY WITH SEQUENCE SIMILARITY 100, MEMBER B
7.66E-04 1.85 NM_003254 TIMP METALLOPEPTIDASE INHIBITOR 1
9.72E-04 1.85 NM_004425 EXTRACELLULAR MATRIX PROTEIN 1
1.26E-03 1.85 NM_018420 SOLUTE CARRIER FAMILY 22 (ORGANIC CATION TRANSPORTER), MEMBER 15
1.47E-03 1.85 BX460543 CDC-LIKE KINASE 1
8.09E-04 1.85 NM_152230 INOSITOL POLYPHOSPHATE MULTIKINASE
4.25E-04 1.84 ENST00000357303
1.22E-03 1.84 NM_031477 YIPPEE-LIKE 3 (DROSOPHILA)
7.19E-04 1.84 NM_052858 MARVEL DOMAIN CONTAINING 3
8.35E-04 1.83 NM_001042413
3.43E-04 1.83 ENST00000337682
5.71E-04 1.82 NM_000855 GUANYLATE CYCLASE 1, SOLUBLE, ALPHA 2
1.02E-03 1.82 THC2740750
7.56E-04 1.82 NM_018963 BROMODOMAIN AND WD REPEAT DOMAIN CONTAINING 1
1.34E-03 1.82 NM_006371 CARTILAGE ASSOCIATED PROTEIN
4.73E-04 1.82 NM_001109 ADAM METALLOPEPTIDASE DOMAIN 8
1.39E-03 1.81 NM_015626 WD REPEAT AND SOCS BOX-CONTAINING 1
5.50E-04 1.81 NM_032258 TBC1 DOMAIN FAMILY, MEMBER 3
9.29E-05 1.81 NM_182851 CYCLIN B1 INTERACTING PROTEIN 1
1.23E-03 1.81 NM_004582 RAB GERANYLGERANYLTRANSFERASE, BETA SUBUNIT
4.55E-04 1.80 NM_153218 HYPOTHETICAL PROTEIN FLJ38725
1.11E-03 1.80 AK021668 FERM DOMAIN CONTAINING 4A
3.51E-05 1.80 NM_181795 PROTEIN KINASE (CAMP-DEPENDENT, CATALYTIC) INHIBITOR BETA
4.47E-04 1.79 NM_006526 ZINC FINGER PROTEIN 217
7.82E-04 1.79 NM_015972 HYPOTHETICAL PROTEIN MGC9850
7.82E-04 1.79 NM_015972 POLYMERASE (RNA) I POLYPEPTIDE D, 16KDA
4.98E-04 1.79 NM_016474 CHROMOSOME 3 OPEN READING FRAME 19
1.05E-03 1.78 NM_017664 ANKYRIN REPEAT DOMAIN 10
9.90E-04 1.78 NM_000396 CATHEPSIN K (PYCNODYSOSTOSIS)
5.53E-04 1.78 AB007870 NUCLEOPORIN LIKE 1
1.11E-03 1.78 AI470277 CYSTEINE-RICH SECRETORY PROTEIN LCCL DOMAIN CONTAINING 2
1.20E-03 1.77 NM_007314 V-ABL ABELSON MURINE LEUKEMIA VIRAL ONCOGENE HOMOLOG 2 (ARG, ABELSON-RELATED GENE)
9.87E-04 1.77 NM_000633 B-CELL CLL/LYMPHOMA 2
7.80E-05 1.77 NM_133484 TRAF FAMILY MEMBER-ASSOCIATED NFKB ACTIVATOR
6.14E-04 1.76 NM_032333 CHROMOSOME 10 OPEN READING FRAME 58
2.98E-05 1.75 NR_003500
3.66E-04 1.75 NM_178815 ADP-RIBOSYLATION FACTOR-LIKE 5B
4.30E-04 1.74 NM_002214 INTEGRIN, BETA 8
4.11E-06 1.74 NM_198459 DENN/MADD DOMAIN CONTAINING 2C
2.20E-04 1.74 NM_198581 ZINC FINGER CCCH-TYPE CONTAINING 6
4.53E-04 1.73 NM_016217 HEADCASE HOMOLOG (DROSOPHILA)
2.68E-04 1.72 NM_007289 MEMBRANE METALLO-ENDOPEPTIDASE (NEUTRAL ENDOPEPTIDASE, ENKEPHALINASE, CALLA, CD10)
1.14E-03 1.72 CR613361
3.78E-04 1.72 NM_015209 KAZRIN
1.46E-04 1.72 NM_147780 CATHEPSIN B
5.75E-04 1.71 NM_017747 ANKYRIN REPEAT AND KH DOMAIN CONTAINING 1
6.90E-04 1.70 BC063703 SLC7A5 PSEUDOGENE
6.90E-04 1.70 BC063703 KIAA0220-LIKE PROTEIN
2.27E-04 1.70 NM_001114938
8.43E-04 1.70 XR_018444
2.63E-04 1.70 NM_002214 INTEGRIN, BETA 8
4.40E-04 1.69 BI828537
3.03E-04 1.68 NM_058181 CHROMOSOME 21 OPEN READING FRAME 57
1.09E-03 1.68 XM_001718704
1.07E-03 1.68 NM_145807 HYPOTHETICAL PROTEIN BC018697
1.15E-03 1.68 ENST00000326470
4.86E-04 1.68 BC032312 TRANSFORMING GROWTH FACTOR BETA REGULATOR 1
7.03E-04 1.68 NP1252191
8.08E-04 1.68 NM_052885 SOLUTE CARRIER FAMILY 2 (FACILITATED GLUCOSE TRANSPORTER), MEMBER 13
1.19E-03 1.68 NM_021127 PHORBOL-12-MYRISTATE-13-ACETATE-INDUCED PROTEIN 1
5.09E-04 1.68 NM_002292 LAMININ, BETA 2 (LAMININ S)
7.93E-04 1.68 NM_014007 ZINC FINGER PROTEIN 297B
8.91E-04 1.67 NM_024552 LAG1 LONGEVITY ASSURANCE HOMOLOG 4 (S. CEREVISIAE)
Page 161
147
1.42E-03 1.67 XM_292021 HYPOTHETICAL LOC341346
2.20E-04 1.67 NM_007075 WD REPEAT DOMAIN 45
7.49E-04 1.67 NM_000201 INTERCELLULAR ADHESION MOLECULE 1 (CD54), HUMAN RHINOVIRUS RECEPTOR
2.35E-04 1.67 AJ420378 CARNITINE PALMITOYLTRANSFERASE 1A (LIVER)
5.50E-04 1.66 NM_031412 GABA(A) RECEPTOR-ASSOCIATED PROTEIN LIKE 1
7.19E-04 1.66 NM_181782 NUCLEAR RECEPTOR COACTIVATOR 7
1.03E-03 1.66 NM_018368 LMBR1 DOMAIN CONTAINING 1
8.21E-04 1.66 AF000984 DEAD (ASP-GLU-ALA-ASP) BOX POLYPEPTIDE 3, Y-LINKED
7.31E-04 1.66 NM_015322 FEM-1 HOMOLOG B (C. ELEGANS)
8.85E-04 1.66 BG108194 HYPOXIA-INDUCIBLE FACTOR 1, ALPHA SUBUNIT (BASIC HELIX-LOOP-HELIX TRANSCRIPTION FACTOR)
1.04E-03 1.65 BC010943 ONCOSTATIN M RECEPTOR
1.94E-04 1.65 NM_015308 FORMIN BINDING PROTEIN 4
1.29E-03 1.65 NM_004506 HEAT SHOCK TRANSCRIPTION FACTOR 2
1.61E-04 1.64 ENST00000373457
5.82E-04 1.64 NM_006079 CBP/P300-INTERACTING TRANSACTIVATOR, WITH GLU/ASP-RICH CARBOXY-TERMINAL DOMAIN, 2
1.17E-03 1.64 M32220
1.30E-03 1.64 NM_030627 CYTOPLASMIC POLYADENYLATION ELEMENT BINDING PROTEIN 4
5.52E-05 1.64 NM_000201 INTERCELLULAR ADHESION MOLECULE 1 (CD54), HUMAN RHINOVIRUS RECEPTOR
1.39E-03 1.64 XR_018025
9.29E-04 1.63 NM_007289 MEMBRANE METALLO-ENDOPEPTIDASE (NEUTRAL ENDOPEPTIDASE, ENKEPHALINASE, CALLA, CD10)
7.49E-04 1.63 NM_003850 SUCCINATE-COA LIGASE, ADP-FORMING, BETA SUBUNIT
7.00E-05 1.63 NM_000201 INTERCELLULAR ADHESION MOLECULE 1 (CD54), HUMAN RHINOVIRUS RECEPTOR
7.99E-04 1.62 ENST00000333156
7.47E-04 1.62 NM_032867 MICAL C-TERMINAL LIKE
8.64E-04 1.62 NM_181721 FORKHEAD BOX R1
8.81E-04 1.62 THC2583971
4.50E-06 1.62 NM_005667 RING FINGER PROTEIN 103
3.68E-05 1.62 NM_017881 CHROMOSOME 9 OPEN READING FRAME 95
1.04E-04 1.62 NM_181782 NUCLEAR RECEPTOR COACTIVATOR 7
4.17E-04 1.61 AA743218 PROTEIN PHOSPHATASE 1A (FORMERLY 2C), MAGNESIUM-DEPENDENT, ALPHA ISOFORM
6.43E-04 1.61 NM_000201 INTERCELLULAR ADHESION MOLECULE 1 (CD54), HUMAN RHINOVIRUS RECEPTOR
1.29E-03 1.61 NM_003999 ONCOSTATIN M RECEPTOR
7.64E-04 1.61 NM_018434 RING FINGER PROTEIN 130
8.39E-04 1.61 NM_020412 CHROMATIN MODIFYING PROTEIN 1B
1.36E-04 1.61 NM_181715 CREB REGULATED TRANSCRIPTION COACTIVATOR 2
1.38E-03 1.61 NM_015312
1.14E-03 1.60 NM_024101 MELANOPHILIN
4.13E-04 1.60 NM_181354 OXIDATION RESISTANCE 1
3.82E-04 1.60 AK127420 SIMILAR TO FLJ43276 PROTEIN
4.27E-04 1.60 NM_016525 UBIQUITIN ASSOCIATED PROTEIN 1
1.05E-03 1.60 NM_152350 CHROMOSOME 17 OPEN READING FRAME 45
1.06E-03 1.60 NM_033305 VACUOLAR PROTEIN SORTING 13A (YEAST)
1.17E-03 1.60 NM_138363 COILED-COIL DOMAIN CONTAINING 45
4.61E-04 1.60 NM_000201 INTERCELLULAR ADHESION MOLECULE 1 (CD54), HUMAN RHINOVIRUS RECEPTOR
1.08E-03 1.60 NM_000036 ADENOSINE MONOPHOSPHATE DEAMINASE 1 (ISOFORM M)
2.02E-04 1.59 NM_020731 ARYL-HYDROCARBON RECEPTOR REPRESSOR
2.02E-04 1.59 NM_020731 PROGRAMMED CELL DEATH 6
1.33E-04 1.59 AK128047 SEC31-LIKE 1 (S. CEREVISIAE)
1.14E-04 1.59 NM_001002233 RAB11 FAMILY INTERACTING PROTEIN 1 (CLASS I)
3.35E-04 1.59 NM_031412 GABA(A) RECEPTOR-ASSOCIATED PROTEIN LIKE 1
9.56E-04 1.59 NM_014765 TRANSLOCASE OF OUTER MITOCHONDRIAL MEMBRANE 20 HOMOLOG (YEAST)
2.58E-04 1.59 NM_005407 SAL-LIKE 2 (DROSOPHILA)
1.46E-03 1.58 NM_003295 TUMOR PROTEIN, TRANSLATIONALLY-CONTROLLED 1
1.30E-03 1.58 NM_004064 CYCLIN-DEPENDENT KINASE INHIBITOR 1B (P27, KIP1)
3.00E-04 1.57 NM_016304 CHROMOSOME 15 OPEN READING FRAME 15
9.33E-04 1.57 THC2537829
1.49E-03 1.57 NM_004064 CYCLIN-DEPENDENT KINASE INHIBITOR 1B (P27, KIP1)
3.48E-04 1.57 NM_181597 URIDINE PHOSPHORYLASE 1
5.28E-04 1.57 NM_001001555 GROWTH FACTOR RECEPTOR-BOUND PROTEIN 10
9.33E-04 1.57 NM_021127 PHORBOL-12-MYRISTATE-13-ACETATE-INDUCED PROTEIN 1
2.71E-04 1.56 NM_003162 STRIATIN, CALMODULIN BINDING PROTEIN
1.29E-03 1.56 BC040195
1.46E-03 1.55 NM_020370 G PROTEIN-COUPLED RECEPTOR 84
7.18E-04 1.55 NM_021003 PROTEIN PHOSPHATASE 1A (FORMERLY 2C), MAGNESIUM-DEPENDENT, ALPHA ISOFORM
2.65E-05 1.55 NM_181805 PROTEIN KINASE (CAMP-DEPENDENT, CATALYTIC) INHIBITOR GAMMA
7.98E-05 1.55 NM_174899 F-BOX PROTEIN 36
8.09E-04 1.55 NM_177550 SODIUM-COUPLED CITRATE TRANSPORTER
9.45E-05 1.55 AK093811 HYPOTHETICAL PROTEIN FLJ36492
5.30E-05 1.53 NM_000393 COLLAGEN, TYPE V, ALPHA 2
3.11E-04 1.53 NM_000201 INTERCELLULAR ADHESION MOLECULE 1 (CD54), HUMAN RHINOVIRUS RECEPTOR
Page 162
148
1.10E-03 1.52 NM_006623 PHOSPHOGLYCERATE DEHYDROGENASE
7.43E-04 1.52 NM_005587 MADS BOX TRANSCRIPTION ENHANCER FACTOR 2, POLYPEPTIDE A (MYOCYTE ENHANCER FACTOR 2A)
3.57E-07 1.51 NM_000861 HISTAMINE RECEPTOR H1
8.03E-04 1.51 NM_003565 UNC-51-LIKE KINASE 1 (C. ELEGANS)
8.19E-04 1.51 AF158383 ATPASE, (NA+)/K+ TRANSPORTING, BETA 4 POLYPEPTIDE
6.57E-04 1.50 NM_024420 PHOSPHOLIPASE A2, GROUP IVA (CYTOSOLIC, CALCIUM-DEPENDENT)
1.28E-03 1.50 NM_004428 EPHRIN-A1
5.67E-04 1.50 NM_001684 ATPASE, CA++ TRANSPORTING, PLASMA MEMBRANE 4
9.34E-04 -1.50 NM_054114 T-CELL ACTIVATION GTPASE ACTIVATING PROTEIN
4.74E-04 -1.50 NM_014063 DREBRIN-LIKE
1.28E-03 -1.51 AF130050 HYPOTHETICAL LOC654434
6.39E-04 -1.51 NM_000059 BREAST CANCER 2, EARLY ONSET
3.14E-04 -1.51 BC010526 HYPOTHETICAL LOC401127
6.86E-04 -1.51 NM_052893
8.49E-05 -1.51 THC2748419
1.37E-03 -1.51 NM_016819 8-OXOGUANINE DNA GLYCOSYLASE
3.31E-04 -1.51 NM_138408 CHROMOSOME 6 OPEN READING FRAME 51
1.20E-03 -1.52 BE388027 CHROMOSOME 9 OPEN READING FRAME 74
1.22E-03 -1.52 NM_002028 FARNESYLTRANSFERASE, CAAX BOX, BETA
1.21E-04 -1.52 NM_005891 ACETYL-COENZYME A ACETYLTRANSFERASE 2 (ACETOACETYL COENZYME A THIOLASE)
4.86E-04 -1.52 NM_025040 ZINC FINGER PROTEIN 614
7.15E-04 -1.52 NM_004091 E2F TRANSCRIPTION FACTOR 2
5.45E-04 -1.52 NM_017491 WD REPEAT DOMAIN 1
1.09E-03 -1.53 NM_025189 ZINC FINGER PROTEIN 430
7.78E-04 -1.53 AK124175 SIMILAR TO RPE-SPONDIN
6.61E-04 -1.53 AK097637 CDNA FLJ40318 FIS, CLONE TESTI2030556
1.06E-04 -1.53 NM_017443 POLYMERASE (DNA DIRECTED), EPSILON 3 (P17 SUBUNIT)
7.33E-04 -1.53 BC008667 PANTOTHENATE KINASE 2 (HALLERVORDEN-SPATZ SYNDROME)
7.33E-04 -1.53 BC008667 HYPOTHETICAL PROTEIN
5.74E-04 -1.53 NM_004687 MYOTUBULARIN RELATED PROTEIN 4
5.84E-05 -1.54 NM_002716 PROTEIN PHOSPHATASE 2 (FORMERLY 2A), REGULATORY SUBUNIT A (PR 65), BETA ISOFORM
8.33E-04 -1.54 ENST00000390253
3.69E-04 -1.54 AK025669 RING FINGER PROTEIN 169
2.04E-04 -1.54 NM_138463 TLC DOMAIN CONTAINING 1
4.19E-05 -1.54 NM_007126 VALOSIN-CONTAINING PROTEIN
1.27E-03 -1.54 THC2616573
7.92E-04 -1.54 NM_001040458
1.07E-03 -1.55 NR_015350
1.07E-03 -1.55 NM_004814 WD REPEAT DOMAIN 57 (U5 SNRNP SPECIFIC)
4.88E-04 -1.55 NM_024662 N-ACETYLTRANSFERASE 10
2.33E-04 -1.55 NM_015697 COENZYME Q2 HOMOLOG, PRENYLTRANSFERASE (YEAST)
1.01E-03 -1.55 NM_178517 PHOSPHATIDYLINOSITOL GLYCAN, CLASS W
1.26E-03 -1.55 NM_145865 ANKYRIN REPEAT AND STERILE ALPHA MOTIF DOMAIN CONTAINING 4B
1.12E-03 -1.56 NM_002947 REPLICATION PROTEIN A3, 14KDA
7.61E-04 -1.56 NM_138999 NEUROPILIN (NRP) AND TOLLOID (TLL)-LIKE 1
6.71E-04 -1.56 NM_152577 ZINC FINGER PROTEIN 645
5.84E-04 -1.57 NM_004393 DYSTROGLYCAN 1 (DYSTROPHIN-ASSOCIATED GLYCOPROTEIN 1)
1.15E-03 -1.57 NM_005968 HETEROGENEOUS NUCLEAR RIBONUCLEOPROTEIN M
9.46E-04 -1.57 NM_017794 KIAA1797
3.60E-04 -1.57 NM_012247 SELENOPHOSPHATE SYNTHETASE 1
1.23E-03 -1.58 NM_018098 EPITHELIAL CELL TRANSFORMING SEQUENCE 2 ONCOGENE
1.40E-03 -1.58 NM_033418 CHROMOSOME 1 OPEN READING FRAME 156
1.09E-03 -1.58 NM_031844 HETEROGENEOUS NUCLEAR RIBONUCLEOPROTEIN U (SCAFFOLD ATTACHMENT FACTOR A)
1.35E-03 -1.58 NM_144682 LIKLEY ORTHOLOG OF MOUSE SCHLAFEN 10
1.16E-03 -1.58 AF220264 CHROMOSOME 8 OPEN READING FRAME 17
1.40E-03 -1.58 X15667 GLUTATHIONE PEROXIDASE 1
3.23E-05 -1.58 NM_198461 LON PEPTIDASE N-TERMINAL DOMAIN AND RING FINGER 2
7.26E-05 -1.59 NM_144573 NEXILIN (F ACTIN BINDING PROTEIN)
6.88E-04 -1.59 NM_031944 MIX1 HOMEOBOX-LIKE 1 (XENOPUS LAEVIS)
1.13E-03 -1.59 NM_003029 SHC (SRC HOMOLOGY 2 DOMAIN CONTAINING) TRANSFORMING PROTEIN 1
8.26E-04 -1.59 BC037919
6.57E-05 -1.59 AK055372
4.42E-04 -1.59 NM_001079 ZETA-CHAIN (TCR) ASSOCIATED PROTEIN KINASE 70KDA
3.73E-05 -1.59 NM_177987 TUBULIN, BETA 8
1.08E-03 -1.59 NM_033238 PROMYELOCYTIC LEUKEMIA
5.19E-04 -1.60 NM_152754 SEMA DOMAIN, IMMUNOGLOBULIN DOMAIN (IG), SHORT BASIC DOMAIN, SECRETED, (SEMAPHORIN) 3D
1.17E-03 -1.60 NM_001077482
7.26E-04 -1.60 ENST00000382378
1.27E-03 -1.60 AK023683 CENTROSOMAL PROTEIN 135KDA
7.52E-04 -1.61 NM_004326 B-CELL CLL/LYMPHOMA 9
Page 163
149
6.14E-04 -1.61 NM_007126 VALOSIN-CONTAINING PROTEIN
1.39E-03 -1.61 NM_001039690 DECREASED EXPRESSION IN RENAL AND PROSTATE
3.63E-05 -1.61 NM_013293 TRANSFORMER-2 ALPHA
1.29E-03 -1.61 NM_006306 SMC1 STRUCTURAL MAINTENANCE OF CHROMOSOMES 1-LIKE 1 (YEAST)
1.48E-03 -1.61 NM_003029 SHC (SRC HOMOLOGY 2 DOMAIN CONTAINING) TRANSFORMING PROTEIN 1
1.17E-03 -1.62 NM_002945 REPLICATION PROTEIN A1, 70KDA
7.40E-04 -1.62 NM_021095 SOLUTE CARRIER FAMILY 5 (SODIUM-DEPENDENT VITAMIN TRANSPORTER), MEMBER 6
6.96E-05 -1.62 NM_000059 BREAST CANCER 2, EARLY ONSET
1.08E-04 -1.62 NM_015050 KIAA0082
3.08E-04 -1.62 NM_007137 ZINC FINGER PROTEIN 81 (HFZ20)
2.36E-04 -1.63 NM_181699 PROTEIN PHOSPHATASE 2 (FORMERLY 2A), REGULATORY SUBUNIT A (PR 65), BETA ISOFORM
1.29E-04 -1.63 NM_001111 ADENOSINE DEAMINASE, RNA-SPECIFIC
5.98E-05 -1.63 NM_014730 KIAA0152
1.20E-03 -1.64 AB040937 KIAA1504 PROTEIN
1.40E-04 -1.64 NM_013322 SORTING NEXIN 10
4.40E-04 -1.64 DarkCorner
9.31E-04 -1.65 THC2684874
2.16E-04 -1.65 NM_006716 DBF4 HOMOLOG (S. CEREVISIAE)
7.96E-04 -1.65 NM_000692 ALDEHYDE DEHYDROGENASE 1 FAMILY, MEMBER B1
5.93E-04 -1.65 NM_183001 SHC (SRC HOMOLOGY 2 DOMAIN CONTAINING) TRANSFORMING PROTEIN 1
3.70E-04 -1.66 NM_006809 TRANSLOCASE OF OUTER MITOCHONDRIAL MEMBRANE 34
8.63E-04 -1.66 CR592968 ROUND SPERMATID BASIC PROTEIN 1-LIKE
1.82E-04 -1.66 AK095359 HYPOTHETICAL PROTEIN LOC221362
6.86E-04 -1.66 NM_138287 DELTEX 3-LIKE (DROSOPHILA)
1.18E-03 -1.66 AL050122
8.47E-04 -1.66 THC2677118
1.62E-04 -1.67 ENST00000249776
1.19E-04 -1.67 NM_004499 HETEROGENEOUS NUCLEAR RIBONUCLEOPROTEIN A/B
9.12E-04 -1.67 NM_030577 HYPOTHETICAL PROTEIN MGC10993
1.26E-05 -1.67 NM_006099 PROTEIN INHIBITOR OF ACTIVATED STAT, 3
2.84E-04 -1.67 NM_153705 KDEL (LYS-ASP-GLU-LEU) CONTAINING 2
3.80E-04 -1.67 NM_015531 HYPOTHETICAL PROTEIN
2.05E-04 -1.68 NM_018319 TYROSYL-DNA PHOSPHODIESTERASE 1
1.88E-04 -1.68 NM_003029 SHC (SRC HOMOLOGY 2 DOMAIN CONTAINING) TRANSFORMING PROTEIN 1
1.07E-03 -1.68 NM_005348 HEAT SHOCK PROTEIN 90KDA ALPHA (CYTOSOLIC), CLASS A MEMBER 1
1.14E-04 -1.68 NM_003824 FAS (TNFRSF6)-ASSOCIATED VIA DEATH DOMAIN
1.19E-04 -1.69 BC011660
1.14E-03 -1.69 NM_032389 ZINC FINGER PROTEIN 289, ID1 REGULATED
3.61E-04 -1.69 AK095300 FERM, RHOGEF AND PLECKSTRIN DOMAIN PROTEIN 2
3.61E-04 -1.69 AK095300 CDNA FLJ37981 FIS, CLONE CTONG2010566
5.89E-04 -1.69 ENST00000379156
1.77E-04 -1.70 THC2638232
2.67E-06 -1.70 NM_001559 INTERLEUKIN 12 RECEPTOR, BETA 2
5.18E-04 -1.70 AK095108 CHROMOBOX HOMOLOG 5 (HP1 ALPHA HOMOLOG, DROSOPHILA)
5.65E-04 -1.70 NM_003115 UDP-N-ACTEYLGLUCOSAMINE PYROPHOSPHORYLASE 1
1.65E-04 -1.71 NM_018320 RING FINGER PROTEIN 121
4.48E-04 -1.71 NM_003029 SHC (SRC HOMOLOGY 2 DOMAIN CONTAINING) TRANSFORMING PROTEIN 1
6.73E-04 -1.71 AK057261 MITOCHONDRIAL RIBOSOMAL PROTEIN L38
5.30E-04 -1.71 NM_025077 HYPOTHETICAL PROTEIN FLJ13949
8.87E-04 -1.71 NM_005184 CALMODULIN 1 (PHOSPHORYLASE KINASE, DELTA)
1.17E-03 -1.72 NM_000446 PARAOXONASE 1
2.49E-04 -1.72 NM_080873 ANKYRIN REPEAT AND SOCS BOX-CONTAINING 11
1.10E-04 -1.72 AB007937 SYNDECAN 3 (N-SYNDECAN)
8.87E-04 -1.72 NM_022731 NUCLEAR CASEIN KINASE AND CYCLIN-DEPENDENT KINASE SUBSTRATE 1
4.89E-05 -1.72 NM_017882 CEROID-LIPOFUSCINOSIS, NEURONAL 6, LATE INFANTILE, VARIANT
3.42E-05 -1.74 NM_017785 HYPOTHETICAL PROTEIN FLJ20364
1.42E-03 -1.74 NM_001078166
5.33E-04 -1.74 NM_003016 SPLICING FACTOR, ARGININE/SERINE-RICH 2
7.67E-04 -1.74 NM_015426 WD REPEAT DOMAIN 51A
1.33E-04 -1.75 NM_018294 CWF19-LIKE 1, CELL CYCLE CONTROL (S. POMBE)
1.19E-05 -1.75 NM_001316 CSE1 CHROMOSOME SEGREGATION 1-LIKE (YEAST)
1.21E-03 -1.75 NM_001111 ADENOSINE DEAMINASE, RNA-SPECIFIC
3.07E-04 -1.75 AF426262 CHROMOSOME 21 OPEN READING FRAME 85
3.07E-04 -1.75 AF426262 MCM3 MINICHROMOSOME MAINTENANCE DEFICIENT 3 (S. CEREVISIAE) ASSOCIATED PROTEIN ANTISENSE
3.95E-04 -1.75 NM_002875 RAD51 HOMOLOG (RECA HOMOLOG, E. COLI) (S. CEREVISIAE)
5.71E-04 -1.75 NM_006001 TUBULIN, ALPHA 2
3.27E-04 -1.75 ENST00000390369
1.45E-03 -1.76 NM_014657 KIAA0406 GENE PRODUCT
4.36E-04 -1.76 NM_017785 HYPOTHETICAL PROTEIN FLJ20364
1.02E-04 -1.76 NM_025077 HYPOTHETICAL PROTEIN FLJ13949
Page 164
150
6.29E-04 -1.76 NM_017613 DOWNSTREAM NEIGHBOR OF SON
1.40E-03 -1.76 NM_024625 ZINC FINGER CCCH-TYPE, ANTIVIRAL 1
1.34E-03 -1.76 NM_005517 HIGH-MOBILITY GROUP NUCLEOSOMAL BINDING DOMAIN 2
8.12E-04 -1.77 NM_004265 FATTY ACID DESATURASE 2
4.70E-04 -1.77 NM_015340 LEUCYL-TRNA SYNTHETASE 2, MITOCHONDRIAL
7.16E-04 -1.77 ENST00000375806
8.99E-04 -1.78 NM_203467 PEPTIDYLPROLYL ISOMERASE (CYCLOPHILIN)-LIKE 5
5.89E-04 -1.78 NM_002828 PROTEIN TYROSINE PHOSPHATASE, NON-RECEPTOR TYPE 2
1.33E-03 -1.78 XR_019306
1.02E-03 -1.79 NM_017785 HYPOTHETICAL PROTEIN FLJ20364
7.30E-04 -1.79 NM_004688 N-MYC (AND STAT) INTERACTOR
2.52E-05 -1.79 NM_198468 CHROMOSOME 6 OPEN READING FRAME 167
1.14E-04 -1.80 NM_032166 THREE PRIME REPAIR EXONUCLEASE 1
9.65E-04 -1.80 NM_017785 HYPOTHETICAL PROTEIN FLJ20364
1.44E-03 -1.80 NM_021067 DNA REPLICATION COMPLEX GINS PROTEIN PSF1
1.46E-04 -1.81 NM_001017963 HEAT SHOCK PROTEIN 90KDA ALPHA (CYTOSOLIC), CLASS A MEMBER 1
1.33E-03 -1.81 NM_032456 BH-PROTOCADHERIN (BRAIN-HEART)
9.34E-04 -1.81 NM_005914 MCM4 MINICHROMOSOME MAINTENANCE DEFICIENT 4 (S. CEREVISIAE)
1.28E-04 -1.81 NM_024808 FLJ22624 PROTEIN
3.58E-04 -1.82 NM_000251 MUTS HOMOLOG 2, COLON CANCER, NONPOLYPOSIS TYPE 1 (E. COLI)
1.29E-03 -1.82 NM_014859 KIAA0672 GENE PRODUCT
1.15E-04 -1.82 AT_T_3
2.12E-05 -1.83 NM_003368 UBIQUITIN SPECIFIC PEPTIDASE 1
1.33E-03 -1.83 NM_001211 BUB1 BUDDING UNINHIBITED BY BENZIMIDAZOLES 1 HOMOLOG BETA (YEAST)
5.85E-04 -1.85 NM_032525 TUBULIN, BETA 6
1.32E-03 -1.86 AT_ssH_AB_3
5.09E-05 -1.86 NM_032704 TUBULIN, ALPHA, UBIQUITOUS
5.17E-05 -1.86 NM_145175 FAMILY WITH SEQUENCE SIMILARITY 84, MEMBER A
1.49E-03 -1.87 NM_001040152
1.01E-03 -1.87 NM_014109 ATPASE FAMILY, AAA DOMAIN CONTAINING 2
9.72E-06 -1.87 NM_002266 KARYOPHERIN ALPHA 2 (RAG COHORT 1, IMPORTIN ALPHA 1)
1.06E-03 -1.87 NR_022014
2.59E-04 -1.88 D31765 PROCESSING OF PRECURSOR 1, RIBONUCLEASE P/MRP SUBUNIT (S. CEREVISIAE)
1.04E-03 -1.88 NM_006084 INTERFERON-STIMULATED TRANSCRIPTION FACTOR 3, GAMMA 48KDA
1.10E-03 -1.88 NM_005441 CHROMATIN ASSEMBLY FACTOR 1, SUBUNIT B (P60)
1.50E-03 -1.89 NM_006176 NEUROGRANIN (PROTEIN KINASE C SUBSTRATE, RC3)
1.32E-03 -1.90 NM_000251 MUTS HOMOLOG 2, COLON CANCER, NONPOLYPOSIS TYPE 1 (E. COLI)
1.21E-04 -1.91 NM_018944 CHROMOSOME 21 OPEN READING FRAME 45
1.98E-05 -1.91 NM_017955 CELL DIVISION CYCLE ASSOCIATED 4
7.98E-04 -1.92 AK091439 TRANSMEMBRANE PROTEIN 48
1.41E-03 -1.92 NM_001999 FIBRILLIN 2 (CONGENITAL CONTRACTURAL ARACHNODACTYLY)
6.45E-05 -1.92 NM_198188 ASTROTACTIN 2
1.66E-04 -1.92 DB363547 LOC440111
1.09E-03 -1.93 AW168145
2.03E-04 -1.93 NM_002692 POLYMERASE (DNA DIRECTED), EPSILON 2 (P59 SUBUNIT)
2.21E-04 -1.93 NM_017785 HYPOTHETICAL PROTEIN FLJ20364
1.32E-03 -1.93 NM_032015 RING FINGER PROTEIN 26
4.14E-05 -1.93 NM_018697 LANC LANTIBIOTIC SYNTHETASE COMPONENT C-LIKE 2 (BACTERIAL)
9.19E-04 -1.94 THC2572108
3.53E-04 -1.94 NM_139266 SIGNAL TRANSDUCER AND ACTIVATOR OF TRANSCRIPTION 1, 91KDA
8.20E-04 -1.94 NM_000251 MUTS HOMOLOG 2, COLON CANCER, NONPOLYPOSIS TYPE 1 (E. COLI)
4.06E-05 -1.94 NM_006187 2'-5'-OLIGOADENYLATE SYNTHETASE 3, 100KDA
1.45E-03 -1.94 NM_032525 TUBULIN, BETA 6
1.43E-03 -1.95 NM_020810 TRM5 TRNA METHYLTRANSFERASE 5 HOMOLOG (S. CEREVISIAE)
8.18E-04 -1.95 NM_001101 ACTIN, BETA
8.78E-04 -1.95 NM_006086 MELANOCORTIN 1 RECEPTOR (ALPHA MELANOCYTE STIMULATING HORMONE RECEPTOR)
4.46E-04 -1.96 BF761348
8.87E-04 -1.97 XR_019461
1.41E-03 -1.97 NM_024094 DEFECTIVE IN SISTER CHROMATID COHESION HOMOLOG 1 (S. CEREVISIAE)
2.41E-04 -1.98 NM_017955 CELL DIVISION CYCLE ASSOCIATED 4
1.55E-04 -1.98 NM_015907 LEUCINE AMINOPEPTIDASE 3
5.42E-04 -1.99 NM_017554 POLY (ADP-RIBOSE) POLYMERASE FAMILY, MEMBER 14
2.98E-04 -1.99 AK074711 HEDGEHOG INTERACTING PROTEIN
1.53E-04 -1.99 XR_017251
5.02E-04 -1.99 NM_003141 TRIPARTITE MOTIF-CONTAINING 21
6.89E-04 -1.99 NM_005441 CHROMATIN ASSEMBLY FACTOR 1, SUBUNIT B (P60)
5.22E-04 -1.99 NM_000251 MUTS HOMOLOG 2, COLON CANCER, NONPOLYPOSIS TYPE 1 (E. COLI)
1.13E-03 -2.00 NM_007086 WD REPEAT AND HMG-BOX DNA BINDING PROTEIN 1
2.88E-04 -2.00 NM_022836 DNA CROSS-LINK REPAIR 1B (PSO2 HOMOLOG, S. CEREVISIAE)
1.35E-03 -2.00 NM_006597 HEAT SHOCK 70KDA PROTEIN 8
Page 165
151
5.08E-04 -2.00 NM_001490 GLUCOSAMINYL (N-ACETYL) TRANSFERASE 1, CORE 2 (BETA-1,6-N-ACETYLGLUCOSAMINYLTRANSFERASE)
9.04E-05 -2.00 NM_139266 SIGNAL TRANSDUCER AND ACTIVATOR OF TRANSCRIPTION 1, 91KDA
1.13E-04 -2.00 NM_005441 CHROMATIN ASSEMBLY FACTOR 1, SUBUNIT B (P60)
6.32E-04 -2.00 NM_139266 SIGNAL TRANSDUCER AND ACTIVATOR OF TRANSCRIPTION 1, 91KDA
4.81E-05 -2.02 NM_003642 HISTONE ACETYLTRANSFERASE 1
4.96E-04 -2.02 NM_006087 TUBULIN, BETA 4
3.11E-04 -2.04 NM_139266 SIGNAL TRANSDUCER AND ACTIVATOR OF TRANSCRIPTION 1, 91KDA
7.03E-04 -2.04 NM_007295 BREAST CANCER 1, EARLY ONSET
8.12E-05 -2.05 NM_001031684 SPLICING FACTOR, ARGININE/SERINE-RICH 7, 35KDA
1.93E-04 -2.05 AF193046 FIBRILLIN 2 (CONGENITAL CONTRACTURAL ARACHNODACTYLY)
5.66E-05 -2.05 AK027667 HYPOTHETICAL PROTEIN FLJ14761
1.10E-03 -2.05 NM_000251 MUTS HOMOLOG 2, COLON CANCER, NONPOLYPOSIS TYPE 1 (E. COLI)
1.03E-03 -2.05 NM_007295 BREAST CANCER 1, EARLY ONSET
1.15E-03 -2.06 NM_032704 TUBULIN, ALPHA, UBIQUITOUS
1.38E-03 -2.06 NM_005517 HIGH-MOBILITY GROUP NUCLEOSOMAL BINDING DOMAIN 2
1.27E-03 -2.06 NM_001024847 TRANSFORMING GROWTH FACTOR, BETA RECEPTOR II (70/80KDA)
5.20E-04 -2.07 NM_007295 BREAST CANCER 1, EARLY ONSET
1.09E-03 -2.07 NM_139266 SIGNAL TRANSDUCER AND ACTIVATOR OF TRANSCRIPTION 1, 91KDA
1.85E-04 -2.07 NM_138287 DELTEX 3-LIKE (DROSOPHILA)
2.00E-04 -2.07 AA065042 CHROMOSOME 21 OPEN READING FRAME 45
1.57E-04 -2.08 NM_139266 SIGNAL TRANSDUCER AND ACTIVATOR OF TRANSCRIPTION 1, 91KDA
2.57E-04 -2.08 NM_018186 CHROMOSOME 1 OPEN READING FRAME 112
4.88E-04 -2.09 NM_006074 TRIPARTITE MOTIF-CONTAINING 22
6.95E-04 -2.09 NM_005441 CHROMATIN ASSEMBLY FACTOR 1, SUBUNIT B (P60)
9.63E-04 -2.10 NM_139266 SIGNAL TRANSDUCER AND ACTIVATOR OF TRANSCRIPTION 1, 91KDA
1.36E-03 -2.10 BU731317 HEAT SHOCK 70KDA PROTEIN 8
5.56E-04 -2.10 NM_015474 SAM DOMAIN AND HD DOMAIN 1
2.67E-04 -2.11 NM_173084 TRIPARTITE MOTIF-CONTAINING 59
4.86E-04 -2.12 NM_024094 DEFECTIVE IN SISTER CHROMATID COHESION HOMOLOG 1 (S. CEREVISIAE)
7.68E-04 -2.12 THC2611110
1.03E-03 -2.13 NM_198468 CHROMOSOME 6 OPEN READING FRAME 167
4.52E-05 -2.13 NM_032043 BRCA1 INTERACTING PROTEIN C-TERMINAL HELICASE 1
8.82E-04 -2.14 NM_000251 MUTS HOMOLOG 2, COLON CANCER, NONPOLYPOSIS TYPE 1 (E. COLI)
2.44E-05 -2.14 NM_001618 POLY (ADP-RIBOSE) POLYMERASE FAMILY, MEMBER 1
1.25E-04 -2.15 NM_001042762
1.43E-03 -2.15 BC019599
2.14E-04 -2.15 NM_014502 PRP19/PSO4 PRE-MRNA PROCESSING FACTOR 19 HOMOLOG (S. CEREVISIAE)
7.16E-05 -2.15 NM_001618 POLY (ADP-RIBOSE) POLYMERASE FAMILY, MEMBER 1
6.99E-04 -2.16 THC2762149
1.49E-03 -2.17 NM_007295 BREAST CANCER 1, EARLY ONSET
8.16E-04 -2.18 NM_001618 POLY (ADP-RIBOSE) POLYMERASE FAMILY, MEMBER 1
1.02E-03 -2.18 NM_002388 MCM3 MINICHROMOSOME MAINTENANCE DEFICIENT 3 (S. CEREVISIAE)
2.10E-04 -2.18 NM_139266 SIGNAL TRANSDUCER AND ACTIVATOR OF TRANSCRIPTION 1, 91KDA
9.05E-05 -2.18 AK055960 SIMILAR TO HIGH MOBILITY GROUP PROTEIN 4 (HMG-4) (HIGH MOBILITY GROUP PROTEIN 2A) (HMG-2A)
1.07E-04 -2.18 NM_022770 HYPOTHETICAL PROTEIN FLJ13912
4.71E-04 -2.18 NM_182751 MCM10 MINICHROMOSOME MAINTENANCE DEFICIENT 10 (S. CEREVISIAE)
6.36E-04 -2.18 NM_002130 3-HYDROXY-3-METHYLGLUTARYL-COENZYME A SYNTHASE 1 (SOLUBLE)
9.43E-04 -2.18 NM_001042762
4.63E-04 -2.19 NM_001618 POLY (ADP-RIBOSE) POLYMERASE FAMILY, MEMBER 1
3.07E-05 -2.19 XM_497547 SIMILAR TO HIGH-MOBILITY GROUP BOX 3
4.64E-04 -2.20 NM_018042 LIKELY ORTHOLOG OF MOUSE SCHLAFEN 3
2.56E-04 -2.21 NM_139266 SIGNAL TRANSDUCER AND ACTIVATOR OF TRANSCRIPTION 1, 91KDA
6.73E-05 -2.21 CR749256 X-RAY REPAIR COMPLEMENTING DEFECTIVE REPAIR IN CHINESE HAMSTER CELLS 2
3.28E-04 -2.22 NM_001618 POLY (ADP-RIBOSE) POLYMERASE FAMILY, MEMBER 1
5.46E-04 -2.22 NM_001155 ANNEXIN A6
6.40E-04 -2.24 NM_033219 TRIPARTITE MOTIF-CONTAINING 14
1.34E-04 -2.26 NM_182625 HYPOTHETICAL PROTEIN FLJ40869
1.40E-03 -2.26 NM_153026 PRICKLE-LIKE 1 (DROSOPHILA)
1.07E-04 -2.26 NM_001618 POLY (ADP-RIBOSE) POLYMERASE FAMILY, MEMBER 1
1.98E-04 -2.26 NM_006088 TUBULIN, BETA 2C
9.88E-04 -2.27 NM_000059 BREAST CANCER 2, EARLY ONSET
5.80E-05 -2.28 NM_001618 POLY (ADP-RIBOSE) POLYMERASE FAMILY, MEMBER 1
2.49E-04 -2.29 NM_002592 PROLIFERATING CELL NUCLEAR ANTIGEN
2.76E-04 -2.32 NM_139266 SIGNAL TRANSDUCER AND ACTIVATOR OF TRANSCRIPTION 1, 91KDA
8.56E-04 -2.32 NM_016195 M-PHASE PHOSPHOPROTEIN 1
8.25E-05 -2.33 THC2738878
7.79E-04 -2.34 NM_006000 TUBULIN, ALPHA 1 (TESTIS SPECIFIC)
7.68E-04 -2.36 AK027859 HYPOTHETICAL PROTEIN MGC11266
3.41E-04 -2.36 NM_152562 CELL DIVISION CYCLE ASSOCIATED 2
5.17E-04 -2.38 NM_198965 PARATHYROID HORMONE-LIKE HORMONE
Page 166
152
3.27E-05 -2.39 NM_001618 POLY (ADP-RIBOSE) POLYMERASE FAMILY, MEMBER 1
5.82E-04 -2.39 NM_003173 SUPPRESSOR OF VARIEGATION 3-9 HOMOLOG 1 (DROSOPHILA)
2.88E-04 -2.39 NM_002592 PROLIFERATING CELL NUCLEAR ANTIGEN
6.52E-05 -2.40 NM_001618 POLY (ADP-RIBOSE) POLYMERASE FAMILY, MEMBER 1
2.08E-04 -2.41 NM_004111 FLAP STRUCTURE-SPECIFIC ENDONUCLEASE 1
5.79E-04 -2.41 NM_002592 PROLIFERATING CELL NUCLEAR ANTIGEN
7.74E-04 -2.42 NM_001618 POLY (ADP-RIBOSE) POLYMERASE FAMILY, MEMBER 1
1.42E-04 -2.42 AK091289 ZINC FINGER PROTEIN 367
2.00E-04 -2.43 NM_001071 THYMIDYLATE SYNTHETASE
5.68E-04 -2.43 XR_018533
1.16E-03 -2.45 AB040957 KIAA1524
1.98E-04 -2.45 NM_002592 PROLIFERATING CELL NUCLEAR ANTIGEN
7.93E-05 -2.46 NM_057749 CYCLIN E2
2.39E-04 -2.46 NM_002592 PROLIFERATING CELL NUCLEAR ANTIGEN
5.64E-05 -2.46 NM_020890 KIAA1524
1.28E-03 -2.47 NM_018154 ASF1 ANTI-SILENCING FUNCTION 1 HOMOLOG B (S. CEREVISIAE)
6.54E-04 -2.50 THC2677432
9.16E-04 -2.51 NM_017414 UBIQUITIN SPECIFIC PEPTIDASE 18
2.69E-04 -2.51 NM_002017 FRIEND LEUKEMIA VIRUS INTEGRATION 1
1.23E-04 -2.51 NM_004111 FLAP STRUCTURE-SPECIFIC ENDONUCLEASE 1
5.87E-04 -2.52 NM_002915 REPLICATION FACTOR C (ACTIVATOR 1) 3, 38KDA
8.88E-04 -2.53 NM_017912 HECT DOMAIN AND RLD 6
2.20E-04 -2.54 NM_002592 PROLIFERATING CELL NUCLEAR ANTIGEN
5.68E-05 -2.54 NM_002592 PROLIFERATING CELL NUCLEAR ANTIGEN
3.84E-05 -2.55 NM_002592 PROLIFERATING CELL NUCLEAR ANTIGEN
2.51E-04 -2.56 NM_002592 PROLIFERATING CELL NUCLEAR ANTIGEN
1.34E-03 -2.56 NM_032704 TUBULIN, ALPHA, UBIQUITOUS
6.93E-05 -2.58 NM_002534 2',5'-OLIGOADENYLATE SYNTHETASE 1, 40/46KDA
1.17E-03 -2.59 XR_018797
5.81E-04 -2.59 NM_002592 PROLIFERATING CELL NUCLEAR ANTIGEN
2.68E-04 -2.61 NM_000958 PROSTAGLANDIN E RECEPTOR 4 (SUBTYPE EP4)
2.02E-04 -2.62 NM_001549 INTERFERON-INDUCED PROTEIN WITH TETRATRICOPEPTIDE REPEATS 3
3.35E-06 -2.62 AA865794 BREAST CANCER 1, EARLY ONSET
6.64E-04 -2.63 NM_001813 CENTROMERE PROTEIN E, 312KDA
1.45E-03 -2.64 NM_018492 PDZ BINDING KINASE
2.46E-04 -2.64 NM_005915 MCM6 MINICHROMOSOME MAINTENANCE DEFICIENT 6 (MIS5 HOMOLOG, S. POMBE) (S. CEREVISIAE)
5.66E-04 -2.68 X98261 ZW10 INTERACTOR ANTISENSE
5.66E-04 -2.68 X98261 ZW10 INTERACTOR
7.15E-04 -2.68 NM_001753 CAVEOLIN 1, CAVEOLAE PROTEIN, 22KDA
1.16E-03 -2.71 NM_194298 SOLUTE CARRIER FAMILY 16 (MONOCARBOXYLIC ACID TRANSPORTERS), MEMBER 9
2.71E-04 -2.73 NM_198433 AURORA KINASE A
1.01E-03 -2.76 NM_002417 ANTIGEN IDENTIFIED BY MONOCLONAL ANTIBODY KI-67
7.24E-04 -2.77 DB356469 TUBULIN, ALPHA, UBIQUITOUS
4.02E-04 -2.78 NM_001753 CAVEOLIN 1, CAVEOLAE PROTEIN, 22KDA
1.06E-03 -2.81 NM_005573 LAMIN B1
8.73E-04 -2.82 NM_024094 DEFECTIVE IN SISTER CHROMATID COHESION HOMOLOG 1 (S. CEREVISIAE)
5.44E-04 -2.83 NM_001753 CAVEOLIN 1, CAVEOLAE PROTEIN, 22KDA
2.37E-05 -2.91 NM_031458 POLY (ADP-RIBOSE) POLYMERASE FAMILY, MEMBER 9
1.31E-03 -2.95 NM_001753 CAVEOLIN 1, CAVEOLAE PROTEIN, 22KDA
5.77E-06 -2.96 AW291149 THYMOPOIETIN
7.78E-04 -2.98 NM_004336 BUB1 BUDDING UNINHIBITED BY BENZIMIDAZOLES 1 HOMOLOG (YEAST)
2.76E-04 -2.98 NM_173529 CHROMOSOME 18 OPEN READING FRAME 54
1.16E-03 -3.00 NM_001753 CAVEOLIN 1, CAVEOLAE PROTEIN, 22KDA
5.34E-04 -3.04 BF195408 CARBOXYPEPTIDASE, VITELLOGENIC-LIKE
1.13E-04 -3.11 NM_017669 FLJ20105 PROTEIN
1.56E-04 -3.23 AL359052 INTEGRIN, BETA-LIKE 1 (WITH EGF-LIKE REPEAT DOMAINS)
5.99E-04 -3.25 NM_016192 TRANSMEMBRANE PROTEIN WITH EGF-LIKE AND TWO FOLLISTATIN-LIKE DOMAINS 2
2.31E-06 -3.28 NM_003276 THYMOPOIETIN
6.43E-04 -3.29 NM_016448 DENTICLELESS HOMOLOG (DROSOPHILA)
8.87E-04 -3.31 NM_006417 INTERFERON-INDUCED PROTEIN 44
1.45E-05 -3.32 NM_017957 EPSIN 3
5.07E-04 -3.39 XR_019065
1.48E-04 -3.45 NM_016448 DENTICLELESS HOMOLOG (DROSOPHILA)
5.22E-04 -3.48 BC007360 HYPOTHETICAL PROTEIN MGC16121
1.47E-04 -3.51 NM_016448 DENTICLELESS HOMOLOG (DROSOPHILA)
9.46E-04 -3.54 NM_016448 DENTICLELESS HOMOLOG (DROSOPHILA)
1.55E-04 -3.60 NM_016448 DENTICLELESS HOMOLOG (DROSOPHILA)
9.33E-04 -3.66 NM_016448 DENTICLELESS HOMOLOG (DROSOPHILA)
1.13E-05 -3.72 NM_016448 DENTICLELESS HOMOLOG (DROSOPHILA)
9.44E-04 -3.81 NM_016448 DENTICLELESS HOMOLOG (DROSOPHILA)
Page 167
153
9.85E-04 -3.90 NM_016817 2'-5'-OLIGOADENYLATE SYNTHETASE 2, 69/71KDA
5.25E-05 -3.94 NM_005733 KINESIN FAMILY MEMBER 20A
1.33E-03 -3.97 NM_017631 HYPOTHETICAL PROTEIN FLJ10787
8.83E-05 -3.99 NM_005733 KINESIN FAMILY MEMBER 20A
3.91E-05 -4.01 NM_005733 KINESIN FAMILY MEMBER 20A
7.46E-05 -4.14 NM_005733 KINESIN FAMILY MEMBER 20A
4.01E-04 -4.15 NM_016817 2'-5'-OLIGOADENYLATE SYNTHETASE 2, 69/71KDA
1.26E-03 -4.17 NM_005733 KINESIN FAMILY MEMBER 20A
1.10E-03 -4.36 NM_005733 KINESIN FAMILY MEMBER 20A
1.34E-03 -4.37 NM_030919 CHROMOSOME 20 OPEN READING FRAME 129
2.23E-05 -4.43 NM_017631 HYPOTHETICAL PROTEIN FLJ10787
1.37E-04 -4.99 NM_006408 ANTERIOR GRADIENT 2 HOMOLOG (XENOPUS LAEVIS)
2.96E-05 -5.11 NM_001548 INTERFERON-INDUCED PROTEIN WITH TETRATRICOPEPTIDE REPEATS 1
4.55E-05 -5.24 NM_005733 KINESIN FAMILY MEMBER 20A
4.70E-04 -5.37 THC2731029
6.53E-06 -5.57 NM_016448 DENTICLELESS HOMOLOG (DROSOPHILA)
1.71E-04 -5.76 NM_005733 KINESIN FAMILY MEMBER 20A
1.32E-03 -5.94 NM_018177 NEDD4 BINDING PROTEIN 2
Page 168
154
APPENDIX E
FIBROBLAST MORPHOLOGY AND APOPTOSIS
Page 169
155
EPI BCM
Figure Appdx. 1. CSLM of primary human fibroblasts reveal that fibroblasts undergo a similar disruption of the
cytoskeleton as human keratinocytes when exposed to BCM. Green, F-actin, blue, nuclei. 100x oil objective, bars
represent 15 µm.
EPI BCM
Figure Appdx. 2. TUNEL staining reveals that apoptosis is induced in human foreskin fibroblasts after 24 hours of
exposure to BCM (green fluorescing nuclei).
Page 170
156
APPENDIX F
THE SMALL GTPASE GEM AND CELL MORPHOLOGY
Page 171
157
Introduction
The RGK (Rem, Rem2, Rad, Gem/Kir) subfamily of Ras related GTPases are
regulated by both transcriptional and post transcriptional mechanisms in response to
environmental stimuli. RGK family members are associated with cytoskeletal re-
arrangements including cell sprouting and formation of lamellipodia and filopodia.
Intracellular levels of Gem have been found to have dramatic effects on the architecture
of the cytoskeleton [227]. RGK family members differ from other Ras like GTPases in
several ways. Firstly, RGK family members display an extended C-terminal residue
containing a calmodulin binding region linking these proteins to intracellular calcium
levels [228]. Secondly, RGK family members contain significant modifications in the
catalytic domain responsible for GTP hydrolysis lending RGK members extremely low
intrinsic GTPase activity [229]. Two functions have been described for Gem, including
inhibition of voltage-gated calcium channel activity and inhibition of Rho kinase
mediated cytoskeletal reorganization [230, 231]. These activities are attributed to the
direct association of Gem with the calcium channel β-unit or Rho kinase- β through
distinct mechanisms. PKC dependant phosphorylation of Gem mediates the inhibition of
Rho kinase and thus cytoskeletal architecture [232]. Gem is also regulated through sub-
cellular localization. Gem is thought to act upon cytoskeletal organization through
interactions in the cytosol and thus can be regulated through either binding by regulatory
partners in the cytosol, or through sequestration in the nucleus [233]. The calcium
dependent nature of Gem in addition to its role in cytoskeletal re-arrangements makes
Gem an interesting target for responses observed in BCM treated keratinocytes.
Page 172
158
Materials and Methods
Microarray
See Chapter 5.
RT-qPCR
See Chapter 4. Validated qPCR primer sets for Gem were purchased from SA
Biosciences (Frederick, MD).
Gem Immunostaining
The GEM (H-85) polyclonal antibody was purchased from Santa Cruz
Biotechnology (Santa Cruz, CA). Cell preparations and staining protocols were based on
manufacturer’s recommendations. The secondary goat anti-rabbit IgG-FITC antibody
was used at a 1:100 dilution for detection of GEM (H-85) following the manufacturer’s
instructions. Cells were mounted using Vectashield® H-1000 (Vector Laboratories,
Burlingame, CA) and imaged using a Leica TCS-SP2 AOBS confocal microscope.
Protein Kinase C Detection
Fim-1 diacetate was purchased from Invitrogen Corporation (Carlsbad, CA) and
the manufacturer’s instructions were followed. Cells were imaged by epifluorescent
microscopy using a 100x oil objective.
shRNA Interference
A SureSilencing shRNA kit with a GFP marker for human GEM was purchased
from SA Biosciences (Frederick, MD) and the manufacturer’s instructions were followed.
Page 173
159
Results and Discussion
Microarray analysis of HFKs in co-culture with S. aureus biofilm revealed several
genes related to cytoskeletal organization to be upregulated (Figure Appdx. 3). Among
these genes was Gem, which was the third most highly upregulated gene in the co-culture
model (+11.54 fold) and the 17th
most highly upregulated gene in keratinocytes exposed
to conditioned medium (+18.01 fold, relative to control cells).
3.99
2.08
2.31 Gem
11.54
Figure Appdx. 3. A. Genes associated with lamellipodia formation are listed on the left while genes associated with
filopodia are listed on the right. B. Genes associated with stress fiber formation are listed on top and genes associated
with stress fiber loss are listed on the bottom. Microarray analysis reveled genes associated with cytoskeletal
organization are expressed in HFKs exposed to S. aureus biofilm for 24 hours in the co-culture model. Many genes
involved in filopodia formation and a key gene involved in stress fiber loss were induced relative to control cells.
Image adapted from [234].
Expression of Gem was confirmed by RT-qPCR over the course of 24 hours
(Figure Appdx. 4). Gem expression was increased relative to control cells at all time
points peaking after 12 hours of exposure to BCM.
Page 174
160
Figure Appdx. 4. RT-qPCR analysis of GEM expression revealed that GEM expression increases in keratinocytes
exposed to BCM, peaking at 12 hours. GEM expression levels normalized to the housekeeping gene GAPDH. Error
bars represent standard deviation of the mean of three experiments.
Immunostaining experiments revealed that Gem accumulated in BCM treated
keratinocytes initially sequestered in the nucleus and later in the cytoplasm (Figure
Appdx. 5). The effects of Gem on the cytoskeleton have been determined to be mediated
through interactions in the cytosol. However, the temporal localization of Gem does not
match with the rapid disruption of the cytoskeleton observed in BCM treated
keratinocytes. Morphology changes were observed in keratinocytes exposed to BCM
within hours while Gem was not observed in the cytosol until 24 hours of exposure to
BCM. More evidence is needed to determine the exact role of Gem in this system.
Page 175
161
0hr 12hr 24hr
Figure Appdx. 5. Immonostaining using an antibody specific to GEM (green) reveals that the GEM protein is not
highly expressed in un-stimulated cells (0hrs). After 12 hours of contact with BCM, GEM appears to be predominately
associated with the nuclear compartment (arrow, 12hr). After 24 hours of exposure to BCM, the GEM protein seems to
be predominant in the cytoplasm. Nuclei counterstained for clarity (blue). 60x oil objective, bar represents 40 µm.
Over expression of Gem has been shown to induce abnormal morphologies which are
similar to the morphologies observed in BCM treated keratinocytes [235] (Figure Appdx.
6).
Figure Appdx. 6. Abnormal cell morphologies were observed by Ward, et al, in cells were Gem was over expressed
(right image) [235]. These abnormal morphologies were similar to the morphologies observed in BCM treated
keratinocytes. The Rho Kinase inhibitor Y-27632 produced similar effects on the cytoskeleton to those of Gem.
PKC mediated phosphorylation of Gem has been linked to its ability to inhibit
Rho kinase and subsequent re-organization of the cytoskeleton. The PKC specific stain
Fim-1 diacetate was used to probe live cells for PKC activity (Figure Appdx. 7). BCM
treated keratinocytes showed much more intense Fim-1 staining than control cells,
indicating that PKC was activated. The activation of PKC may or may not correlate with
Page 176
162
Gem activity in BCM treated keratinocytes and further experiments will be needed to
determine the relationship between PKC signaling, Gem, and cytoskeletal organization.
EPI BCM
Figure Appdx. 7. Staining using a PKC specific dye revealed that PKC is activated in BCM treated keratinocytes after
24 hours but not in control cells. Bar represents 20 µm.
Short hairpin RNAs (shRNAs) were used to knock down Gem expression in
HFKs (Figure Appdx. 8). Keratinocytes were transiently transfected with plasmids
containing both shRNA sequences against Gem and a GFP marker. Cell morphologies
were observed after 240 minutes of exposure to BCM. Non-transfected cells displayed
the expected morphology while transfected cells appeared to have less of a cytoskeletal
re-organization. However, without a quantitative measurement of morphological
changes, these results are subjective to interpretation.
Page 177
163
Figure Appdx. 8. shRNA knockdown of GEM by transient transfection (green fluorescing cells). Keratinocytes
treated with BCM for 240 minutes post transfection. Enlarged images show that fluorescing cells do not contain as
many dendritic like extensions as neighboring cells that were not transfected. Bar represents 40 µm.
Page 178
164
APPENDIX G
PEROXISOME AND LYSOSOME DEPLETION IN KERATINOCYTES
TREATED WITH BCM
Page 179
165
EPI PCM BCM
Figure Appdx. 9. Peroxisomes (green) were detected by immunostaining and imaging by CSLM. EPI and PCM
treated keratinocytes show uniformly distributed peroxisomes while BCM treated keratinocytes showed no
peroxisomes in any cell with the rare exception of rounded, detaching cells with no nuclei (see crosshairs in BCM
image) after a 24 hour exposure. The actin cytoskeleton (Red) and nuclei (Blue) were counterstained for clarity. 100x
oil objective, bar represents 20 µm.
EPI BCM
Figure Appdx. 10. Lysosomes were stained with LysoTracker Red. Cells were stained after 24 hours of exposure to
BCM. Bar represents 15 µm.
Page 180
166
APPENDIX H
UNKNOWN CELL TYPES PRESENT IN HFK CULTURE RESISTANT TO ILL
EFFECTS OF BCM
Page 181
167
Primary cell lines are never 100% pure cultures and often contain assorted cell
types (i.e. fibroblasts, melanocytes) with the cell type of interest being dominant. While
performing TUNEL assays on HFKs cultures after extended exposure to BCM, cell types
with a specific morphology were found to be resistant to BCM induced apoptosis and
cytoskeletal disruption (Figure Appdx. 11). These cells had a long and slender
appearance and were full of dense granules. The same cell types were not observed in
BCM treated HaCaT keratinocytes.
Figure Appdx. 11. TUNEL staining after 48 hours of exposure to BCM revealed several cells with a distinct
morphology that were not undergoing apoptosis (arrows). 60x oil objective.
Upon closer examination of the cytoskeletal architecture of these cells, it was
discovered that there were in fact two types of cells, long and slender cells, and round and
flat cells (Figure Appdx. 12). Each cell type contained dense granules and their
cytoskeletons remained intact, relative to neighboring keratinocytes.
Page 182
168
A B
C D
Figure Appdx. 12. Staining of cytoskeletal components (F-actin, green, β-tubulin, red, nuclei, blue) revealed two
distinct morphologies of “biofilm resistant” cells. The “biofilm resistant” cells were found to be either long and skinny
or round and flat. Keratinocytes visible in “A” and “C” can be seen with the expected morphology after exposure to
BCM. 100x oil objective, bars represent 15 µm.
The PKC specific stain Fim-1 diacetate revealed that PKC was not activated in
these “biofilm resistant” cells (Figure Appdx. 13). The lack of PKC activation together
with the absence of dendritic like extensions in these cells may indicate a role for PKC in
the cytoskeletal re-arrangements observed in keratinocytes exposed to BCM.
Page 183
169
Figure Appdx. 13. PKC staining reveals that PKC is not activated in either the long and skinny (left) or the round and
flat (right) biofilm resistant cells. 100x oil objective, bar represents 20 µm.
Treatment of HFKs with BCM for 24 hours followed by the removal of BCM and
addition of fresh EPI growth medium for an additional 96 hours revealed that the cell
culture was re-populated with different cell types with a morphology that resembled
fibroblasts (Figure Appdx. 14). After 24 hours in fresh EPI, there were still many cells
that detached from the culture well. This was likely due to apoptotic keratinocytes which
were still attached to the culture well eventually detaching. By 72 hours, cells with long
extended morphologies were beginning to re-populate the culture well. After 96 hours in
fresh EPI growth medium, colonies of both fibroblast like cells and keratinocytes could
be observed.
Page 184
170
0 hr 24 hr 48hr
72hr 96hr
Figure Appdx. 14. HFKs were treated with BCM for 24 hours. Cells were then placed in fresh EPI growth medium
and incubated for an additional 96 hours with the medium being replaced every 24 hours. Images above are from the
same area in a single culture dish. After 24 hours in fresh EPI, many cells detach. These are likely cells undergoing
apoptosis. An unknown cell type repopulates the dish after 96 hours with microcolonies of keratinocytes present as
well. Bar=40 um.
Interestingly, no cells were found to contain the dense granules observed in
“biofilm resistant” cells. This may be due to the removal of specific biofilm secreted
factors responsible for the formation and maintenance of these structures. The dense
granules could theoretically be microsomes. Microsomes are vesicles derived from the
endoplasmic reticulum whose dense appearance is derived from the proteins contained
within; most notably from heme groups contained within cytochrome P450 family
members. Microsomes present in keratinocytes contain CYP1A1 and CYP1B1 in
addition to other XMEs [236]. The possibility of xenobiotic metabolism in these
Page 185
171
“biofilm resistant” cells is interesting given the expression of several XMEs in BCM
treated keratinocytes, including CYP1A1 and CYP1B1.
Page 186
172
REFERENCES CITED
Page 187
173
1. Martin, P., Wound healing--aiming for perfect skin regeneration. Science, 1997.
276(5309): p. 75-81.
2. Singer, A.J. and R.A. Clark, Cutaneous wound healing. N Engl J Med, 1999.
341(10): p. 738-46.
3. Deuel, T.F., et al., Chemotaxis of monocytes and neutrophils to platelet-derived
growth factor. J Clin Invest, 1982. 69(4): p. 1046-9.
4. Newman, S.L., J.E. Henson, and P.M. Henson, Phagocytosis of senescent
neutrophils by human monocyte-derived macrophages and rabbit inflammatory
macrophages. J Exp Med, 1982. 156(2): p. 430-42.
5. Duffield, J.S., The inflammatory macrophage: a story of Jekyll and Hyde. Clin
Sci (Lond), 2003. 104(1): p. 27-38.
6. Serhan, C.N. and J. Savill, Resolution of inflammation: the beginning programs
the end. Nat Immunol, 2005. 6(12): p. 1191-7.
7. Clark, R.A., et al., Collagen matrices attenuate the collagen-synthetic response of
cultured fibroblasts to TGF-beta. J Cell Sci, 1995. 108 ( Pt 3): p. 1251-61.
8. Gurtner, G.C., et al., Wound repair and regeneration. Nature, 2008. 453(7193): p.
314-21.
9. Salo, T., et al., Expression of matrix metalloproteinase-2 and -9 during early
human wound healing. Lab Invest, 1994. 70(2): p. 176-82.
10. Gipson, I.K., S.J. Spurr-Michaud, and A.S. Tisdale, Hemidesmosomes and
anchoring fibril collagen appear synchronously during development and wound
healing. Dev Biol, 1988. 126(2): p. 253-62.
11. Kurkinen, M., et al., Sequential appearance of fibronectin and collagen in
experimental granulation tissue. Lab Invest, 1980. 43(1): p. 47-51.
12. Welch, M.P., G.F. Odland, and R.A. Clark, Temporal relationships of F-actin
bundle formation, collagen and fibronectin matrix assembly, and fibronectin
receptor expression to wound contraction. J Cell Biol, 1990. 110(1): p. 133-45.
13. Lovvorn, H.N., 3rd, et al., Relative distribution and crosslinking of collagen
distinguish fetal from adult sheep wound repair. J Pediatr Surg, 1999. 34(1): p.
218-23.
Page 188
174
14. Li, J., J. Chen, and R. Kirsner, Pathophysiology of acute wound healing. Clin
Dermatol, 2007. 25(1): p. 9-18.
15. Falanga, V., Wound healing and its impairment in the diabetic foot. Lancet, 2005.
366(9498): p. 1736-43.
16. Meluleni, G.J., et al., Mucoid Pseudomonas aeruginosa growing in a biofilm in
vitro are killed by opsonic antibodies to the mucoid exopolysaccharide capsule
but not by antibodies produced during chronic lung infection in cystic fibrosis
patients. J Immunol, 1995. 155(4): p. 2029-38.
17. Kristian, S.A., et al., Biofilm formation induces C3a release and protects
Staphylococcus epidermidis from IgG and complement deposition and from
neutrophil-dependent killing. J Infect Dis, 2008. 197(7): p. 1028-35.
18. Jesaitis, A.J., et al., Compromised host defense on Pseudomonas aeruginosa
biofilms: characterization of neutrophil and biofilm interactions. J Immunol,
2003. 171(8): p. 4329-39.
19. Foster, T.J., Immune evasion by staphylococci. Nat Rev Microbiol, 2005. 3(12): p.
948-58.
20. Donlan, R.M. and J.W. Costerton, Biofilms: survival mechanisms of clinically
relevant microorganisms. Clin Microbiol Rev, 2002. 15(2): p. 167-93.
21. Leid, J.G., et al., Human leukocytes adhere to, penetrate, and respond to
Staphylococcus aureus biofilms. Infect Immun, 2002. 70(11): p. 6339-45.
22. Edwards, J.V., et al., Protease inhibition by oleic acid transfer from chronic
wound dressings to albumin. Int J Pharm, 2007. 340(1-2): p. 42-51.
23. Diegelmann, R.F., Excessive neutrophils characterize chronic pressure ulcers.
Wound Repair Regen, 2003. 11(6): p. 490-5.
24. Akgul, C., D.A. Moulding, and S.W. Edwards, Molecular control of neutrophil
apoptosis. FEBS Lett, 2001. 487(3): p. 318-22.
25. Glynn, P.C., E. Henney, and I.P. Hall, The selective CXCR2 antagonist SB272844
blocks interleukin-8 and growth-related oncogene-alpha-mediated inhibition of
spontaneous neutrophil apoptosis. Pulm Pharmacol Ther, 2002. 15(2): p. 103-10.
26. Higley, H.R., et al., Extravasation of macromolecules and possible trapping of
transforming growth factor-beta in venous ulceration. Br J Dermatol, 1995.
132(1): p. 79-85.
Page 189
175
27. Grinnell, F., C.H. Ho, and A. Wysocki, Degradation of fibronectin and
vitronectin in chronic wound fluid: analysis by cell blotting, immunoblotting, and
cell adhesion assays. J Invest Dermatol, 1992. 98(4): p. 410-6.
28. Tarnuzzer, R.W. and G.S. Schultz, Biochemical analysis of acute and chronic
wound environments. Wound Repair Regen, 1996. 4(3): p. 321-5.
29. McCawley, L.J. and L.M. Matrisian, Matrix metalloproteinases: they're not just
for matrix anymore! Curr Opin Cell Biol, 2001. 13(5): p. 534-40.
30. Loot, M.A., et al., Fibroblasts derived from chronic diabetic ulcers differ in their
response to stimulation with EGF, IGF-I, bFGF and PDGF-AB compared to
controls. Eur J Cell Biol, 2002. 81(3): p. 153-60.
31. Stojadinovic, O., et al., Molecular pathogenesis of chronic wounds: the role of
beta-catenin and c-myc in the inhibition of epithelialization and wound healing.
Am J Pathol, 2005. 167(1): p. 59-69.
32. Waikel, R.L., et al., Deregulated expression of c-Myc depletes epidermal stem
cells. Nat Genet, 2001. 28(2): p. 165-8.
33. Krampert, M., et al., Activities of the matrix metalloproteinase stromelysin-2
(MMP-10) in matrix degradation and keratinocyte organization in wounded skin.
Mol Biol Cell, 2004. 15(12): p. 5242-54.
34. Sauer, K., et al., Pseudomonas aeruginosa displays multiple phenotypes during
development as a biofilm. J Bacteriol, 2002. 184(4): p. 1140-54.
35. Resch, A., et al., Differential gene expression profiling of Staphylococcus aureus
cultivated under biofilm and planktonic conditions. Appl Environ Microbiol,
2005. 71(5): p. 2663-76.
36. Stewart, P.S. and J.W. Costerton, Antibiotic resistance of bacteria in biofilms.
Lancet, 2001. 358(9276): p. 135-8.
37. Zhu, J., et al., Quorum-sensing regulators control virulence gene expression in
Vibrio cholerae. Proc Natl Acad Sci U S A, 2002. 99(5): p. 3129-34.
38. Cotter, P.A. and S. Stibitz, c-di-GMP-mediated regulation of virulence and
biofilm formation. Curr Opin Microbiol, 2007. 10(1): p. 17-23.
39. Fux, C.A., et al., Survival strategies of infectious biofilms. Trends Microbiol,
2005. 13(1): p. 34-40.
Page 190
176
40. Wolcott, R.D., J.P. Kennedy, and S.E. Dowd, Regular debridement is the main
tool for maintaining a healthy wound bed in most chronic wounds. J Wound Care,
2009. 18(2): p. 54-6.
41. James, G.A., et al., Biofilms in chronic wounds. Wound Repair Regen, 2008.
16(1): p. 37-44.
42. Lin, Y.T., C.T. Wang, and B.L. Chiang, Role of bacterial pathogens in atopic
dermatitis. Clin Rev Allergy Immunol, 2007. 33(3): p. 167-77.
43. Kuehnert, M.J., et al., Prevalence of Staphylococcus aureus nasal colonization in
the United States, 2001-2002. J Infect Dis, 2006. 193(2): p. 172-9.
44. Kristian, S.A., et al., The ability of biofilm formation does not influence virulence
of Staphylococcus aureus and host response in a mouse tissue cage infection
model. Microb Pathog, 2004. 36(5): p. 237-45.
45. Yarwood, J.M., et al., Quorum sensing in Staphylococcus aureus biofilms. J
Bacteriol, 2004. 186(6): p. 1838-50.
46. Caiazza, N.C. and G.A. O'Toole, Alpha-toxin is required for biofilm formation by
Staphylococcus aureus. J Bacteriol, 2003. 185(10): p. 3214-7.
47. Guggenheim, B., et al., In vitro modeling of host-parasite interactions: the
'subgingival' biofilm challenge of primary human epithelial cells. BMC
Microbiol, 2009. 9: p. 280.
48. Stathopoulou, P.G., et al., Epithelial cell pro-inflammatory cytokine response
differs across dental plaque bacterial species. J Clin Periodontol. 37(1): p. 24-9.
49. Haugwitz, U., et al., Pore-forming Staphylococcus aureus alpha-toxin triggers
epidermal growth factor receptor-dependent proliferation. Cell Microbiol, 2006.
8(10): p. 1591-600.
50. Kenzel, S., et al., Role of p38 and early growth response factor 1 in the
macrophage response to group B streptococcus. Infect Immun, 2009. 77(6): p.
2474-81.
51. Li, X., et al., Epithelial Cell Gene Expression Induced by Intracellular
Staphylococcus aureus. Int J Microbiol, 2009. 2009: p. 753278.
52. Moreilhon, C., et al., Live Staphylococcus aureus and bacterial soluble factors
induce different transcriptional responses in human airway cells. Physiol
Genomics, 2005. 20(3): p. 244-55.
Page 191
177
53. Peterson, M.L., et al., The innate immune system is activated by stimulation of
vaginal epithelial cells with Staphylococcus aureus and toxic shock syndrome
toxin 1. Infect Immun, 2005. 73(4): p. 2164-74.
54. Sun, Y., et al., Staphylococcus aureus-induced corneal inflammation is dependent
on Toll-like receptor 2 and myeloid differentiation factor 88. Infect Immun, 2006.
74(9): p. 5325-32.
55. Veldkamp, K.E., et al., Modulation of neutrophil chemokine receptors by
Staphylococcus aureus supernate. Infect Immun, 2000. 68(10): p. 5908-13.
56. Dowd, S.E., et al., Survey of bacterial diversity in chronic wounds using
pyrosequencing, DGGE, and full ribosome shotgun sequencing. BMC Microbiol,
2008. 8: p. 43.
57. Sibbald, R.G., et al., Preparing the wound bed 2003: focus on infection and
inflammation. Ostomy Wound Manage, 2003. 49(11): p. 23-51.
58. Dowd, S.E., et al., Polymicrobial nature of chronic diabetic foot ulcer biofilm
infections determined using bacterial tag encoded FLX amplicon pyrosequencing
(bTEFAP). PLoS One, 2008. 3(10): p. e3326.
59. Miller, L.S., Toll-like receptors in skin. Adv Dermatol, 2008. 24: p. 71-87.
60. Lebre, M.C., et al., Human keratinocytes express functional Toll-like receptor 3,
4, 5, and 9. J Invest Dermatol, 2007. 127(2): p. 331-41.
61. Albanesi, C., et al., Keratinocytes in inflammatory skin diseases. Curr Drug
Targets Inflamm Allergy, 2005. 4(3): p. 329-34.
62. Takeda, K. and S. Akira, Toll-like receptors in innate immunity. Int Immunol,
2005. 17(1): p. 1-14.
63. Basham, T.Y. and T.C. Merigan, Recombinant interferon-gamma increases HLA-
DR synthesis and expression. J Immunol, 1983. 130(4): p. 1492-4.
64. Tokura, Y., et al., Superantigenic staphylococcal exotoxins induce T-cell
proliferation in the presence of Langerhans cells or class II-bearing keratinocytes
and stimulate keratinocytes to produce T-cell-activating cytokines. J Invest
Dermatol, 1994. 102(1): p. 31-8.
65. Meng, X., et al., Transgenic TNF-alpha causes apoptosis in epidermal
keratinocytes after subcutaneous injection of TNF-alpha DNA plasmid. J Invest
Dermatol, 1999. 113(5): p. 856-7.
Page 192
178
66. Van Antwerp, D.J., et al., Suppression of TNF-alpha-induced apoptosis by NF-
kappaB. Science, 1996. 274(5288): p. 787-9.
67. Victor, F.C. and A.B. Gottlieb, TNF-alpha and apoptosis: implications for the
pathogenesis and treatment of psoriasis. J Drugs Dermatol, 2002. 1(3): p. 264-75.
68. Bashir, M.M., M.R. Sharma, and V.P. Werth, TNF-alpha production in the skin.
Arch Dermatol Res, 2009. 301(1): p. 87-91.
69. Amiot, F., et al., Lipopolysaccharide-induced cytokine cascade and lethality in LT
alpha/TNF alpha-deficient mice. Mol Med, 1997. 3(12): p. 864-75.
70. Dinarello, C.A., Immunological and inflammatory functions of the interleukin-1
family. Annu Rev Immunol, 2009. 27: p. 519-50.
71. Sims, J.E. and D.E. Smith, The IL-1 family: regulators of immunity. Nat Rev
Immunol. 10(2): p. 89-102.
72. Dinarello, C.A., Biologic basis for interleukin-1 in disease. Blood, 1996. 87(6): p.
2095-147.
73. Kupper, T.S., Immune and inflammatory processes in cutaneous tissues.
Mechanisms and speculations. J Clin Invest, 1990. 86(6): p. 1783-9.
74. Delaleu, N. and M. Bickel, Interleukin-1 beta and interleukin-18: regulation and
activity in local inflammation. Periodontol 2000, 2004. 35: p. 42-52.
75. Cacabelos, R., et al., Brain interleukin-1 beta in Alzheimer's disease and vascular
dementia. Methods Find Exp Clin Pharmacol, 1994. 16(2): p. 141-51.
76. Chomarat, P., et al., Balance of IL-1 receptor antagonist/IL-1 beta in rheumatoid
synovium and its regulation by IL-4 and IL-10. J Immunol, 1995. 154(3): p. 1432-
9.
77. Kornman, K.S., et al., The interleukin-1 genotype as a severity factor in adult
periodontal disease. J Clin Periodontol, 1997. 24(1): p. 72-7.
78. Rabinovitch, A., An update on cytokines in the pathogenesis of insulin-dependent
diabetes mellitus. Diabetes Metab Rev, 1998. 14(2): p. 129-51.
79. Shabo, Y., et al., The myeloid blood cell differentiation-inducing protein MGI-2A
is interleukin-6. Blood, 1988. 72(6): p. 2070-3.
Page 193
179
80. Gauldie, J., et al., Interferon beta 2/B-cell stimulatory factor type 2 shares identity
with monocyte-derived hepatocyte-stimulating factor and regulates the major
acute phase protein response in liver cells. Proc Natl Acad Sci U S A, 1987.
84(20): p. 7251-5.
81. Kishimoto, T., Interleukin-6: from basic science to medicine--40 years in
immunology. Annu Rev Immunol, 2005. 23: p. 1-21.
82. Ishihara, K. and T. Hirano, IL-6 in autoimmune disease and chronic inflammatory
proliferative disease. Cytokine Growth Factor Rev, 2002. 13(4-5): p. 357-68.
83. Harada, A., et al., Essential involvement of interleukin-8 (IL-8) in acute
inflammation. J Leukoc Biol, 1994. 56(5): p. 559-64.
84. Rosenkilde, M.M. and T.W. Schwartz, The chemokine system -- a major
regulator of angiogenesis in health and disease. APMIS, 2004. 112(7-8): p. 481-
95.
85. Sheridan, J.W. and D. Metcalf, Studies on the bone marrow colony stimulating
factor (CSF): relation of tissue CSF to serum CSF. J Cell Physiol, 1972. 80(1): p.
129-40.
86. Hamilton, J.A., GM-CSF in inflammation and autoimmunity. Trends Immunol,
2002. 23(8): p. 403-8.
87. Armitage, J.O., Emerging applications of recombinant human granulocyte-
macrophage colony-stimulating factor. Blood, 1998. 92(12): p. 4491-508.
88. Braunstein, S., et al., GM-CSF activates regenerative epidermal growth and
stimulates keratinocyte proliferation in human skin in vivo. J Invest Dermatol,
1994. 103(4): p. 601-4.
89. Kupper, T.S., et al., Keratinocyte derived T-cell growth factor (KTGF) is identical
to granulocyte macrophage colony stimulating factor (GM-CSF). J Invest
Dermatol, 1988. 91(2): p. 185-8.
90. Medzhitov, R., Toll-like receptors and innate immunity. Nat Rev Immunol, 2001.
1(2): p. 135-45.
91. Cobb, M.H. and E.J. Goldsmith, How MAP kinases are regulated. J Biol Chem,
1995. 270(25): p. 14843-6.
Page 194
180
92. Lang, R., M. Hammer, and J. Mages, DUSP meet immunology: dual specificity
MAPK phosphatases in control of the inflammatory response. J Immunol, 2006.
177(11): p. 7497-504.
93. Kyriakis, J.M. and J. Avruch, Mammalian mitogen-activated protein kinase signal
transduction pathways activated by stress and inflammation. Physiol Rev, 2001.
81(2): p. 807-69.
94. Pearson, G., et al., Mitogen-activated protein (MAP) kinase pathways: regulation
and physiological functions. Endocr Rev, 2001. 22(2): p. 153-83.
95. Liu, J. and A. Lin, Role of JNK activation in apoptosis: a double-edged sword.
Cell Res, 2005. 15(1): p. 36-42.
96. Park, J.M., et al., Macrophage apoptosis by anthrax lethal factor through p38
MAP kinase inhibition. Science, 2002. 297(5589): p. 2048-51.
97. Xia, Z., et al., Opposing effects of ERK and JNK-p38 MAP kinases on apoptosis.
Science, 1995. 270(5240): p. 1326-31.
98. Matsubayashi, Y., et al., ERK activation propagates in epithelial cell sheets and
regulates their migration during wound healing. Curr Biol, 2004. 14(8): p. 731-5.
99. Sharma, G.D., J. He, and H.E. Bazan, p38 and ERK1/2 coordinate cellular
migration and proliferation in epithelial wound healing: evidence of cross-talk
activation between MAP kinase cascades. J Biol Chem, 2003. 278(24): p. 21989-
97.
100. Efimova, T., A.M. Broome, and R.L. Eckert, A regulatory role for p38 delta
MAPK in keratinocyte differentiation. Evidence for p38 delta-ERK1/2 complex
formation. J Biol Chem, 2003. 278(36): p. 34277-85.
101. Niyonsaba, F., et al., The human beta-defensins (-1, -2, -3, -4) and cathelicidin
LL-37 induce IL-18 secretion through p38 and ERK MAPK activation in primary
human keratinocytes. J Immunol, 2005. 175(3): p. 1776-84.
102. Kippenberger, S., et al., Signaling of mechanical stretch in human keratinocytes
via MAP kinases. J Invest Dermatol, 2000. 114(3): p. 408-12.
103. Garmyn, M., et al., Human keratinocytes respond to osmotic stress by p38 map
kinase regulated induction of HSP70 and HSP27. J Invest Dermatol, 2001.
117(5): p. 1290-5.
Page 195
181
104. Johnson, G.L. and R. Lapadat, Mitogen-activated protein kinase pathways
mediated by ERK, JNK, and p38 protein kinases. Science, 2002. 298(5600): p.
1911-2.
105. Derijard, B., et al., JNK1: a protein kinase stimulated by UV light and Ha-Ras
that binds and phosphorylates the c-Jun activation domain. Cell, 1994. 76(6): p.
1025-37.
106. Kyriakis, J.M. and J. Avruch, Sounding the alarm: protein kinase cascades
activated by stress and inflammation. J Biol Chem, 1996. 271(40): p. 24313-6.
107. Pombo, C.M., et al., The stress-activated protein kinases are major c-Jun amino-
terminal kinases activated by ischemia and reperfusion. J Biol Chem, 1994.
269(42): p. 26546-51.
108. Angel, P., A. Szabowski, and M. Schorpp-Kistner, Function and regulation of
AP-1 subunits in skin physiology and pathology. Oncogene, 2001. 20(19): p.
2413-23.
109. Karin, M., Z. Liu, and E. Zandi, AP-1 function and regulation. Curr Opin Cell
Biol, 1997. 9(2): p. 240-6.
110. Javelaud, D., et al., Disruption of basal JNK activity differentially affects key
fibroblast functions important for wound healing. J Biol Chem, 2003. 278(27): p.
24624-8.
111. Ramet, M., et al., JNK signaling pathway is required for efficient wound healing
in Drosophila. Dev Biol, 2002. 241(1): p. 145-56.
112. Han, J., et al., A MAP kinase targeted by endotoxin and hyperosmolarity in
mammalian cells. Science, 1994. 265(5173): p. 808-11.
113. Lee, J.C., et al., A protein kinase involved in the regulation of inflammatory
cytokine biosynthesis. Nature, 1994. 372(6508): p. 739-46.
114. Klemke, R.L., et al., Regulation of cell motility by mitogen-activated protein
kinase. J Cell Biol, 1997. 137(2): p. 481-92.
115. Kyriakis, J.M. and J. Avruch, Protein kinase cascades activated by stress and
inflammatory cytokines. Bioessays, 1996. 18(7): p. 567-77.
116. Ip, Y.T. and R.J. Davis, Signal transduction by the c-Jun N-terminal kinase
(JNK)--from inflammation to development. Curr Opin Cell Biol, 1998. 10(2): p.
205-19.
Page 196
182
117. Marshall, C.J., Specificity of receptor tyrosine kinase signaling: transient versus
sustained extracellular signal-regulated kinase activation. Cell, 1995. 80(2): p.
179-85.
118. Yang, C.S., et al., Differential regulation of interleukin-12 and tumour necrosis
factor-alpha by phosphatidylinositol 3-kinase and ERK 1/2 pathways during
Mycobacterium tuberculosis infection. Clin Exp Immunol, 2006. 143(1): p. 150-
60.
119. Farley, S.M., et al., Fas ligand-induced proinflammatory transcriptional
responses in reconstructed human epidermis. Recruitment of the epidermal
growth factor receptor and activation of MAP kinases. J Biol Chem, 2008.
283(2): p. 919-28.
120. Kloft, N., et al., Pore-forming toxins activate MAPK p38 by causing loss of
cellular potassium. Biochem Biophys Res Commun, 2009. 385(4): p. 503-6.
121. Yates, S. and T.E. Rayner, Transcription factor activation in response to
cutaneous injury: role of AP-1 in reepithelialization. Wound Repair Regen, 2002.
10(1): p. 5-15.
122. Muller, R., et al., Induction of c-fos gene and protein by growth factors precedes
activation of c-myc. Nature, 1984. 312(5996): p. 716-20.
123. Abate, C., et al., Dimerization and DNA binding alter phosphorylation of Fos and
Jun. Proc Natl Acad Sci U S A, 1993. 90(14): p. 6766-70.
124. Akiba, H., et al., CD27, a member of the tumor necrosis factor receptor
superfamily, activates NF-kappaB and stress-activated protein kinase/c-Jun N-
terminal kinase via TRAF2, TRAF5, and NF-kappaB-inducing kinase. J Biol
Chem, 1998. 273(21): p. 13353-8.
125. Dziarski, R., Y.P. Jin, and D. Gupta, Differential activation of extracellular
signal-regulated kinase (ERK) 1, ERK2, p38, and c-Jun NH2-terminal kinase
mitogen-activated protein kinases by bacterial peptidoglycan. J Infect Dis, 1996.
174(4): p. 777-85.
126. Barton, G.M. and R. Medzhitov, Toll-like receptor signaling pathways. Science,
2003. 300(5625): p. 1524-5.
127. Kopp, E.B. and S. Ghosh, NF-kappa B and rel proteins in innate immunity. Adv
Immunol, 1995. 58: p. 1-27.
Page 197
183
128. Stein, B., et al., Cross-coupling of the NF-kappa B p65 and Fos/Jun transcription
factors produces potentiated biological function. EMBO J, 1993. 12(10): p. 3879-
91.
129. Sun, S.C., et al., Human T-cell leukemia virus type I Tax activation of NF-kappa
B/Rel involves phosphorylation and degradation of I kappa B alpha and RelA
(p65)-mediated induction of the c-rel gene. Mol Cell Biol, 1994. 14(11): p. 7377-
84.
130. Baldwin, A.S., Jr., The NF-kappa B and I kappa B proteins: new discoveries and
insights. Annu Rev Immunol, 1996. 14: p. 649-83.
131. Barnes, P.J. and M. Karin, Nuclear factor-kappaB: a pivotal transcription factor
in chronic inflammatory diseases. N Engl J Med, 1997. 336(15): p. 1066-71.
132. Arthur, J.S., MSK activation and physiological roles. Front Biosci, 2008. 13: p.
5866-79.
133. Dent, P., et al., Stress and radiation-induced activation of multiple intracellular
signaling pathways. Radiat Res, 2003. 159(3): p. 283-300.
134. Hoffmann, A. and D. Baltimore, Circuitry of nuclear factor kappaB signaling.
Immunol Rev, 2006. 210: p. 171-86.
135. Schmitz, R., et al., TNFAIP3 (A20) is a tumor suppressor gene in Hodgkin
lymphoma and primary mediastinal B cell lymphoma. J Exp Med, 2009. 206(5):
p. 981-9.
136. Gon, Y., et al., A20 inhibits toll-like receptor 2- and 4-mediated interleukin-8
synthesis in airway epithelial cells. Am J Respir Cell Mol Biol, 2004. 31(3): p.
330-6.
137. Bond, M., et al., Synergistic upregulation of metalloproteinase-9 by growth
factors and inflammatory cytokines: an absolute requirement for transcription
factor NF-kappa B. FEBS Lett, 1998. 435(1): p. 29-34.
138. Bond, M., A.H. Baker, and A.C. Newby, Nuclear factor kappaB activity is
essential for matrix metalloproteinase-1 and -3 upregulation in rabbit dermal
fibroblasts. Biochem Biophys Res Commun, 1999. 264(2): p. 561-7.
139. Li, Z.W., et al., The IKKbeta subunit of IkappaB kinase (IKK) is essential for
nuclear factor kappaB activation and prevention of apoptosis. J Exp Med, 1999.
189(11): p. 1839-45.
Page 198
184
140. Camerer, E., et al., Binding of factor VIIa to tissue factor on keratinocytes induces
gene expression. J Biol Chem, 2000. 275(9): p. 6580-5.
141. Pettit, E.J. and F.S. Fay, Cytosolic free calcium and the cytoskeleton in the control
of leukocyte chemotaxis. Physiol Rev, 1998. 78(4): p. 949-67.
142. Sharpe, G.R., J.I. Gillespie, and J.R. Greenwell, An increase in intracellular free
calcium is an early event during differentiation of cultured human keratinocytes.
FEBS Lett, 1989. 254(1-2): p. 25-8.
143. Wakita, H., et al., Staphylococcal enterotoxin B upregulates expression of ICAM-
1 molecules on IFN-gamma-treated keratinocytes and keratinocyte cell lines. J
Invest Dermatol, 1995. 105(4): p. 536-42.
144. Etienne, S., et al., MHC class II engagement in brain endothelial cells induces
protein kinase A-dependent IL-6 secretion and phosphorylation of cAMP
response element-binding protein. J Immunol, 1999. 163(7): p. 3636-41.
145. Travers, J.B., D.A. Norris, and D.Y. Leung, The keratinocyte as a target for
staphylococcal bacterial toxins. J Investig Dermatol Symp Proc, 2001. 6(3): p.
225-30.
146. Al-Daccak, R., N. Mooney, and D. Charron, MHC class II signaling in antigen-
presenting cells. Curr Opin Immunol, 2004. 16(1): p. 108-13.
147. Hornig-Do, H.T., et al., Human epidermal keratinocytes accumulate superoxide
due to low activity of Mn-SOD, leading to mitochondrial functional impairment. J
Invest Dermatol, 2007. 127(5): p. 1084-93.
148. Gethin, G.T., S. Cowman, and R.M. Conroy, The impact of Manuka honey
dressings on the surface pH of chronic wounds. Int Wound J, 2008. 5(2): p. 185-
94.
149. Greener, B., et al., Proteases and pH in chronic wounds. J Wound Care, 2005.
14(2): p. 59-61.
150. Sen, C.K., Wound healing essentials: Let there be oxygen. Wound Repair and
Regeneration, 2009. 17(1): p. 1-18.
151. Park, M.K., R.A.M. Myers, and L. Marzella, Oxygen-tensions and infections -
Modulation of microbial growth, activity of antimicrobial agents, and
immunological resonses. Clinical Infectious Diseases, 1992. 14(3): p. 720-740.
Page 199
185
152. Kranke, P., et al., Hyperbaric oxygen therapy for chronic wounds. Cochrane
Database Syst Rev, 2004(2): p. CD004123.
153. Thackham, J.A., D.L. McElwain, and R.J. Long, The use of hyperbaric oxygen
therapy to treat chronic wounds: A review. Wound Repair Regen, 2008. 16(3): p.
321-30.
154. Sander, A.L., et al., In vivo effect of hyperbaric oxygen on wound angiogenesis
and epithelialization. Wound Repair and Regeneration, 2009. 17(2): p. 179-184.
155. Yoon, S.S., et al., Pseudomonas aeruginosa anaerobic respiration in biofilms:
relationships to cystic fibrosis pathogenesis. Dev Cell, 2002. 3(4): p. 593-603.
156. Rani, S.A., et al., Spatial patterns of DNA replication, protein synthesis, and
oxygen concentration within bacterial biofilms reveal diverse physiological
states. J Bacteriol, 2007. 189(11): p. 4223-33.
157. Davey, M.E. and A. O'Toole G, Microbial biofilms: from ecology to molecular
genetics. Microbiol Mol Biol Rev, 2000. 64(4): p. 847-67.
158. Cotter, J.J., et al., Oxygen-mediated regulation of biofilm development is
controlled by the alternative sigma factor {sigma}B in Staphylococcus
epidermidis. Applied and Environmental Microbiology, 2009. 75(1): p. 261-264.
159. Cramton, S.E., et al., Anaerobic conditions induce expression of polysaccharide
intercellular adhesin in Staphylococcus aureus and Staphylococcus epidermidis.
Infection and Immunity, 2001. 69(6): p. 4079-4085.
160. Fuchs, S., et al., Anaerobic gene expression in Staphylococcus aureus. Journal of
Bacteriology, 2007. 189(11): p. 4275-4289.
161. Bowler, P.G., B.I. Duerden, and D.G. Armstrong, Wound microbiology and
associated approaches to wound management. Clin Microbiol Rev, 2001. 14(2):
p. 244-69.
162. Price, L.B., et al., Community analysis of chronic wound bacteria using 16S rRNA
gene-based pyrosequencing: impact of diabetes and antibiotics on chronic wound
microbiota. PLoS One, 2009. 4(7): p. e6462.
163. Davies, C.E., et al., Use of 16S ribosomal DNA PCR and denaturing gradient gel
electrophoresis for analysis of the microfloras of healing and nonhealing chronic
venous leg ulcers. J Clin Microbiol, 2004. 42(8): p. 3549-57.
Page 200
186
164. Olaru, F. and L.E. Jensen, Chemokine expression by human keratinocyte cell lines
after activation of Toll-like receptors. Exp Dermatol.
165. Charvat, S., et al., Ras-transfection up-regulated HaCaT cell migration: inhibition
by Marimastat. Clin Exp Metastasis, 1999. 17(8): p. 677-85.
166. Fukano, Y., et al., Characterization of an in vitro model for evaluating the
interface between skin and percutaneous biomaterials. Wound Repair Regen,
2006. 14(4): p. 484-91.
167. Wyatt, M.A., et al., Staphylococcus aureus Nonribosomal Peptide Secondary
Metabolites Regulate Virulence. Science.
168. Hemmi, H., et al., A Toll-like receptor recognizes bacterial DNA. Nature, 2000.
408(6813): p. 740-5.
169. Molne, L., L.V. Collins, and A. Tarkowski, Inflammatogenic properties of
bacterial DNA following cutaneous exposure. J Invest Dermatol, 2003. 121(2): p.
294-9.
170. Dalton, S.J., et al., Mechanisms of chronic skin ulceration linking lactate,
transforming growth factor-beta, vascular endothelial growth factor, collagen
remodeling, collagen stability, and defective angiogenesis. J Invest Dermatol,
2007. 127(4): p. 958-68.
171. Niinikoski, J., Effect of oxygen supply on wound healing and formation of
experimental granulation tissue. Acta Physiol Scand Suppl, 1969. 334: p. 1-72.
172. Hunt, T.K. and M.P. Pai, The effect of varying ambient oxygen tensions on wound
metabolism and collagen synthesis. Surg Gynecol Obstet, 1972. 135(4): p. 561-7.
173. Knighton, D.R., I.A. Silver, and T.K. Hunt, Regulation of wound-healing
angiogenesis-effect of oxygen gradients and inspired oxygen concentration.
Surgery, 1981. 90(2): p. 262-70.
174. Hohn, D.C., et al., Effect of O2 tension on microbicidal function of leukocytes in
wounds and in vitro. Surg Forum, 1976. 27(62): p. 18-20.
175. Mader, J.T., et al., A mechanism for the amelioration by hyperbaric oxygen of
experimental staphylococcal osteomyelitis in rabbits. J Infect Dis, 1980. 142(6):
p. 915-22.
176. Gordillo, G.M. and C.K. Sen, Revisiting the essential role of oxygen in wound
healing. Am J Surg, 2003. 186(3): p. 259-63.
Page 201
187
177. Blackman, E., et al., Topical wound oxygen therapy in the treatment of severe
diabetic foot ulcers: a prospective controlled study. Ostomy Wound Manage.
56(6): p. 24-31.
178. Zhang, J. and S. Kashket, Cytotoxic effects of short-chain carboxylic acids on
human gingival epithelial cells. Oral Microbiol Immunol, 1997. 12(6): p. 345-9.
179. Sorkin, B.C. and R. Niederman, Short chain carboxylic acids decrease human
gingival keratinocyte proliferation and increase apoptosis and necrosis. J Clin
Periodontol, 1998. 25(4): p. 311-5.
180. Rippke, F., et al., Stratum corneum pH in atopic dermatitis: impact on skin
barrier function and colonization with Staphylococcus Aureus. Am J Clin
Dermatol, 2004. 5(4): p. 217-23.
181. Lenz, A.P., et al., Localized gene expression in Pseudomonas aeruginosa
biofilms. Appl Environ Microbiol, 2008. 74(14): p. 4463-71.
182. Sturn, A., J. Quackenbush, and Z. Trajanoski, Genesis: cluster analysis of
microarray data. Bioinformatics, 2002. 18(1): p. 207-8.
183. Dennis, G., Jr., et al., DAVID: Database for Annotation, Visualization, and
Integrated Discovery. Genome Biol, 2003. 4(5): p. P3.
184. Moreland, J.G., et al., Organism-specific neutrophil-endothelial cell interactions
in response to Escherichia coli, Streptococcus pneumoniae, and Staphylococcus
aureus. J Immunol, 2004. 172(1): p. 426-32.
185. Kumar, A., J. Zhang, and F.S. Yu, Innate immune response of corneal epithelial
cells to Staphylococcus aureus infection: role of peptidoglycan in stimulating
proinflammatory cytokine secretion. Invest Ophthalmol Vis Sci, 2004. 45(10): p.
3513-22.
186. van Langevelde, P., et al., Antibiotic-induced release of lipoteichoic acid and
peptidoglycan from Staphylococcus aureus: quantitative measurements and
biological reactivities. Antimicrob Agents Chemother, 1998. 42(12): p. 3073-8.
187. Callegan, M.C., et al., Corneal virulence of Staphylococcus aureus: roles of
alpha-toxin and protein A in pathogenesis. Infect Immun, 1994. 62(6): p. 2478-
82.
Page 202
188
188. Dommisch, H., et al., Protease-activated receptor 2 mediates human beta-
defensin 2 and CC chemokine ligand 20 mRNA expression in response to
proteases secreted by Porphyromonas gingivalis. Infect Immun, 2007. 75(9): p.
4326-33.
189. Yao, L., et al., Prevention of endothelial cell cytokine induction by a
Staphylococcus aureus lipoprotein. FEMS Immunol Med Microbiol, 2000. 28(4):
p. 301-5.
190. Bantel, H., et al., alpha-Toxin is a mediator of Staphylococcus aureus-induced
cell death and activates caspases via the intrinsic death pathway independently of
death receptor signaling. J Cell Biol, 2001. 155(4): p. 637-48.
191. Dieckgraefe, B.K. and D.M. Weems, Epithelial injury induces egr-1 and fos
expression by a pathway involving protein kinase C and ERK. Am J Physiol,
1999. 276(2 Pt 1): p. G322-30.
192. De Sousa, L.P., et al., Plasminogen/plasmin regulates c-fos and egr-1 expression
via the MEK/ERK pathway. Biochem Biophys Res Commun, 2005. 329(1): p.
237-45.
193. Lee, K.H. and J.R. Kim, Hepatocyte growth factor induced up-regulations of
VEGF through Egr-1 in hepatocellular carcinoma cells. Clin Exp Metastasis,
2009. 26(7): p. 685-92.
194. Granet, C., et al., MAPK and SRC-kinases control EGR-1 and NF-kappa B
inductions by changes in mechanical environment in osteoblasts. Biochem
Biophys Res Commun, 2001. 284(3): p. 622-31.
195. Mishra, J.P., et al., Differential involvement of calmodulin-dependent protein
kinase II-activated AP-1 and c-Jun N-terminal kinase-activated EGR-1 signaling
pathways in tumor necrosis factor-alpha and lipopolysaccharide-induced CD44
expression in human monocytic cells. J Biol Chem, 2005. 280(29): p. 26825-37.
196. Eder, J., Tumour necrosis factor alpha and interleukin 1 signalling: do MAPKK
kinases connect it all? Trends Pharmacol Sci, 1997. 18(9): p. 319-22.
197. Niyonsaba, F., et al., The human antimicrobial peptide dermcidin activates
normal human keratinocytes. Br J Dermatol, 2009. 160(2): p. 243-9.
198. Menzies, B.E. and A. Kenoyer, Signal transduction and nuclear responses in
Staphylococcus aureus-induced expression of human beta-defensin 3 in skin
keratinocytes. Infect Immun, 2006. 74(12): p. 6847-54.
Page 203
189
199. Li, Q., et al., Staphylococcus aureus lipoproteins trigger human corneal epithelial
innate response through toll-like receptor-2. Microb Pathog, 2008. 44(5): p. 426-
34.
200. Chung, W.O. and B.A. Dale, Innate immune response of oral and foreskin
keratinocytes: utilization of different signaling pathways by various bacterial
species. Infect Immun, 2004. 72(1): p. 352-8.
201. Esen, M., et al., Mechanisms of Staphylococcus aureus induced apoptosis of
human endothelial cells. Apoptosis, 2001. 6(6): p. 431-9.
202. Baldari, C.T., et al., Anthrax toxins: A paradigm of bacterial immune suppression.
Trends Immunol, 2006. 27(9): p. 434-40.
203. Shan, L., P. He, and J. Sheen, Intercepting host MAPK signaling cascades by
bacterial type III effectors. Cell Host Microbe, 2007. 1(3): p. 167-74.
204. Brodsky, I.E. and R. Medzhitov, Targeting of immune signalling networks by
bacterial pathogens. Nat Cell Biol, 2009. 11(5): p. 521-6.
205. Swanson, H.I., Cytochrome P450 expression in human keratinocytes: an aryl
hydrocarbon receptor perspective. Chem Biol Interact, 2004. 149(2-3): p. 69-79.
206. Umannova, L., et al., Tumor necrosis factor-alpha potentiates genotoxic effects of
benzo[a]pyrene in rat liver epithelial cells through upregulation of cytochrome
P450 1B1 expression. Mutat Res, 2008. 640(1-2): p. 162-9.
207. Fujii-Kuriyama, Y. and J. Mimura, Molecular mechanisms of AhR functions in the
regulation of cytochrome P450 genes. Biochem Biophys Res Commun, 2005.
338(1): p. 311-7.
208. Barouki, R. and Y. Morel, Repression of cytochrome P450 1A1 gene expression
by oxidative stress: mechanisms and biological implications. Biochem Pharmacol,
2001. 61(5): p. 511-6.
209. Morgan, E.T., Regulation of cytochrome p450 by inflammatory mediators: why
and how? Drug Metab Dispos, 2001. 29(3): p. 207-12.
210. Renton, K.W., Alteration of drug biotransformation and elimination during
infection and inflammation. Pharmacol Ther, 2001. 92(2-3): p. 147-63.
211. McMillan, B.J. and C.A. Bradfield, The aryl hydrocarbon receptor sans
xenobiotics: endogenous function in genetic model systems. Mol Pharmacol,
2007. 72(3): p. 487-98.
Page 204
190
212. Katiyar, S.K., et al., Inhibition of UVB-induced oxidative stress-mediated
phosphorylation of mitogen-activated protein kinase signaling pathways in
cultured human epidermal keratinocytes by green tea polyphenol (-)-
epigallocatechin-3-gallate. Toxicol Appl Pharmacol, 2001. 176(2): p. 110-7.
213. Simon, H.U., A. Haj-Yehia, and F. Levi-Schaffer, Role of reactive oxygen species
(ROS) in apoptosis induction. Apoptosis, 2000. 5(5): p. 415-8.
214. Darr, D. and I. Fridovich, Free radicals in cutaneous biology. J Invest Dermatol,
1994. 102(5): p. 671-5.
215. Trenam, C.W., D.R. Blake, and C.J. Morris, Skin inflammation: reactive oxygen
species and the role of iron. J Invest Dermatol, 1992. 99(6): p. 675-82.
216. Malaplate-Armand, C., et al., Astroglial CYP1B1 up-regulation in
inflammatory/oxidative toxic conditions: IL-1beta effect and protection by N-
acetylcysteine. Toxicol Lett, 2003. 138(3): p. 243-51.
217. Fradette, C. and P. Du Souich, Effect of hypoxia on cytochrome P450 activity and
expression. Curr Drug Metab, 2004. 5(3): p. 257-71.
218. Kirker, K.R., et al., Loss of viability and induction of apoptosis in human
keratinocytes exposed to Staphylococcus aureus biofilms in vitro. Wound Repair
Regen, 2009. 17(5): p. 690-9.
219. Rosenshine, I., et al., Signal transduction between enteropathogenic Escherichia
coli (EPEC) and epithelial cells: EPEC induces tyrosine phosphorylation of host
cell proteins to initiate cytoskeletal rearrangement and bacterial uptake. EMBO
J, 1992. 11(10): p. 3551-60.
220. Zhou, D., et al., A Salmonella inositol polyphosphatase acts in conjunction with
other bacterial effectors to promote host cell actin cytoskeleton rearrangements
and bacterial internalization. Mol Microbiol, 2001. 39(2): p. 248-59.
221. Jung, K.Y., et al., Involvement of staphylococcal protein A and cytoskeletal actin
in Staphylococcus aureus invasion of cultured human oral epithelial cells. J Med
Microbiol, 2001. 50(1): p. 35-41.
222. Mempel, M., et al., Invasion of human keratinocytes by Staphylococcus aureus
and intracellular bacterial persistence represent haemolysin-independent
virulence mechanisms that are followed by features of necrotic and apoptotic
keratinocyte cell death. Br J Dermatol, 2002. 146(6): p. 943-51.
Page 205
191
223. Nuzzo, I., et al., Apoptosis of human keratinocytes after bacterial invasion. FEMS
Immunol Med Microbiol, 2000. 27(3): p. 235-40.
224. Alexander, E.H., et al., Staphylococcus aureus - induced tumor necrosis factor -
related apoptosis - inducing ligand expression mediates apoptosis and caspase-8
activation in infected osteoblasts. BMC Microbiol, 2003. 3: p. 5.
225. Kahl, B.C., et al., Staphylococcus aureus RN6390 replicates and induces
apoptosis in a pulmonary epithelial cell line. Infect Immun, 2000. 68(9): p. 5385-
92.
226. Gniadecki, R. and B. Gajkowska, Intracellular calcium pool emptying induces
DNA synthesis in HaCaT keratinocytes. Exp Dermatol, 2003. 12(4): p. 453-9.
227. Piddini, E., et al., The Ras-like GTPase Gem is involved in cell shape remodelling
and interacts with the novel kinesin-like protein KIF9. EMBO J, 2001. 20(15): p.
4076-87.
228. Fischer, R., et al., Calmodulin binds to and inhibits GTP binding of the ras-like
GTPase Kir/Gem. J Biol Chem, 1996. 271(41): p. 25067-70.
229. Cohen, L., et al., Transcriptional activation of a ras-like gene (kir) by oncogenic
tyrosine kinases. Proc Natl Acad Sci U S A, 1994. 91(26): p. 12448-52.
230. Aresta, S., et al., A novel Rho GTPase-activating-protein interacts with Gem, a
member of the Ras superfamily of GTPases. Biochem J, 2002. 367(Pt 1): p. 57-65.
231. Beguin, P., et al., Regulation of Ca2+ channel expression at the cell surface by
the small G-protein kir/Gem. Nature, 2001. 411(6838): p. 701-6.
232. Ward, Y., et al., Phosphorylation of critical serine residues in Gem separates
cytoskeletal reorganization from down-regulation of calcium channel activity.
Mol Cell Biol, 2004. 24(2): p. 651-61.
233. Beguin, P., et al., 14-3-3 and calmodulin control subcellular distribution of
Kir/Gem and its regulation of cell shape and calcium channel activity. J Cell Sci,
2005. 118(Pt 9): p. 1923-34.
234. Sorokina, E.M. and J. Chernoff, Rho-GTPases: new members, new pathways. J
Cell Biochem, 2005. 94(2): p. 225-31.
235. Ward, Y., et al., The GTP binding proteins Gem and Rad are negative regulators
of the Rho-Rho kinase pathway. J Cell Biol, 2002. 157(2): p. 291-302.
Page 206
192
236. Baron, J.M., et al., Expression of multiple cytochrome p450 enzymes and
multidrug resistance-associated transport proteins in human skin keratinocytes. J
Invest Dermatol, 2001. 116(4): p. 541-8.