39
1 Impact of the San Antonio River Walk Study Conducted By: Steve Nivin, Ph.D. 210-517-3609 [email protected] April 2014

1
Impact of the San Antonio River Walk Study Conducted By:
Steve Nivin, Ph.D.
210-517-3609
April 2014

2
I. Executive Summary
The San Antonio River Walk has a long and storied history and is a key part of
the cultural fabric of the community contributing greatly to the quality of life of local
residents. As one of the leading tourist attractions in the state, it is also an important
driver of the local economy. The impact of the River Walk on the San Antonio
community has long been observed, and it is the purpose of this study to put some
numbers to these impacts.
In order to accomplish this, surveys of visitors to the River Walk were conducted
on six different occasions over a year-long period spanning 2012 and 2013. The effort
resulted in 702 surveys of local residents (i.e., those living within Bexar County) and
non-resident visitors (i.e., those traveling from outside Bexar County) to the River Walk.
The results of the analysis indicate that the River Walk attracted about 9.3 million
non-resident visitors whose main reason for coming to the area was to visit the River
Walk over the twelve-month time period of this study.1 Additionally, it is estimated that
1 This does not include local residents visiting the River Walk or others who travel to San Antonio for other reasons and visit the River Walk as part of their trip.

3
residents made about 2.2 millions trips to the River Walk2 resulting in a total of about
11.5 million visitors. This is most likely a conservative estimate because it does not
include those visitors who visited the River Walk but whose primary purpose in traveling
to the area was for some other reason. These non-resident visitors mostly come from
around Texas, but some come from around the world. They spend about $2.4 billion each
year, which supports more than 31,000 jobs. The people in these jobs earn incomes and
benefits of over $1 billion. The economic impact is about $3.1 billion per year, as shown
in Table 1. This economic activity results in about $173 million flowing to various state
and local government agencies, and almost $201 million in revenues being generated for
the federal government.
Table 1. Annual Economic Impact of San Antonio River Walk (2014 $) Impact Type Employment Income Output Direct Effect 21,294 $571,718,278 $1,807,908,085 Indirect Effect 5,086 $231,329,230 $690,928,900 Induced Effect 4,698 $198,146,016 $597,066,199 Total Effect 31,077 $1,001,193,524 $3,095,903,185
The rest of this report briefly outlines the history of the River Walk and then
provides the results of the analysis in more depth. The last section contains a detailed
discussion of the methodology.
II. A Brief History of the San Antonio River Walk3
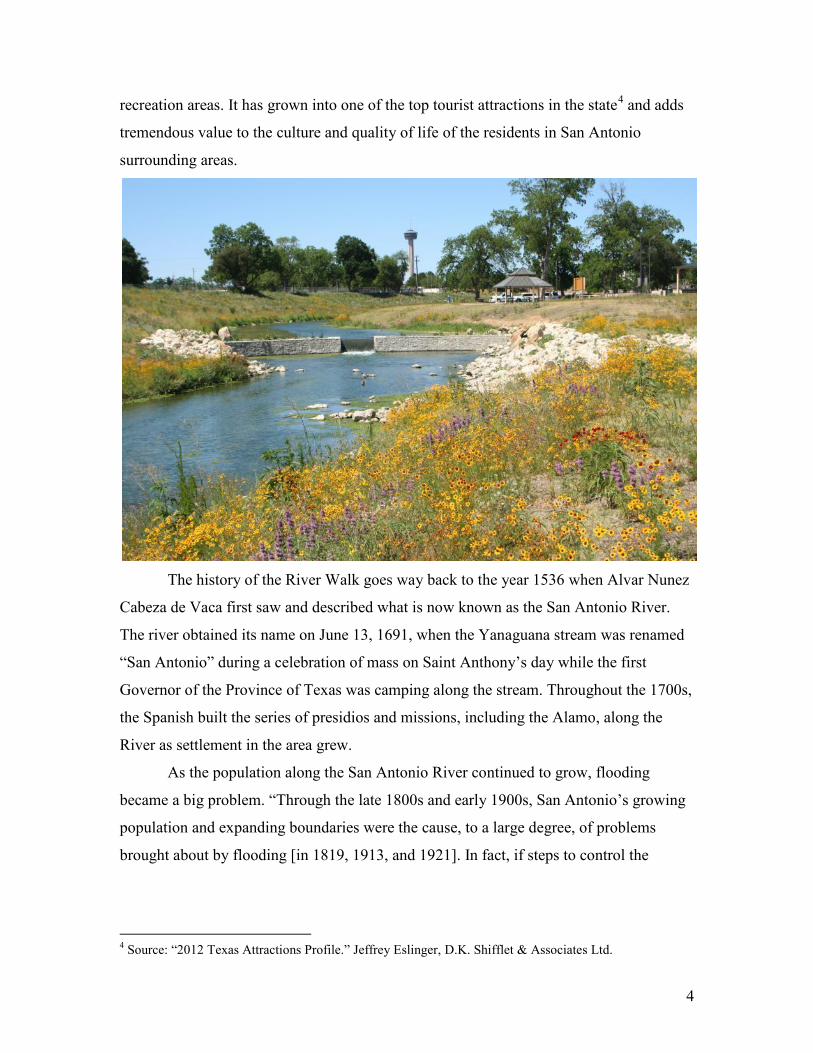
The San Antonio River Walk, also known as Paseo del Rio, contains 2,020 acres
of public lands with the San Antonio River running through it. This is substantially larger
than Central Park in New York City (843 acres), Golden Gate Park in San Francisco
(1,017 acres), and the Chicago lakeside parks (1,440 acres). The River Walk is a mix of
restaurants, shops, entertainment venues, businesses, museums, historical sites, and
2 These are not unique visits. As noted in the following discussion, many of the local residents noted that they visited the River Walk several times per year. 3 Unless otherwise noted, the information in this section is sourced from the websites of the San Antonio Convention and Visitors’ Bureau, the San Antonio River Authority, and the Paseo del Rio Association.
4
recreation areas. It has grown into one of the top tourist attractions in the state4 and adds
tremendous value to the culture and quality of life of the residents in San Antonio
surrounding areas.
The history of the River Walk goes way back to the year 1536 when Alvar Nunez
Cabeza de Vaca first saw and described what is now known as the San Antonio River.
The river obtained its name on June 13, 1691, when the Yanaguana stream was renamed
“San Antonio” during a celebration of mass on Saint Anthony’s day while the first
Governor of the Province of Texas was camping along the stream. Throughout the 1700s,
the Spanish built the series of presidios and missions, including the Alamo, along the
River as settlement in the area grew.
As the population along the San Antonio River continued to grow, flooding
became a big problem. “Through the late 1800s and early 1900s, San Antonio’s growing
population and expanding boundaries were the cause, to a large degree, of problems
brought about by flooding [in 1819, 1913, and 1921]. In fact, if steps to control the
4 Source: “2012 Texas Attractions Profile.” Jeffrey Eslinger, D.K. Shifflet & Associates Ltd.
5
flooding had not been taken in the 1920’s, later commercial development along the river
would not have been possible.”5
With flood controls in place, Robert H. Hugman, proposed his design for the
initial creation of “The Shops of Romula and Aragon” on June 28, 1929. The ideas were
stalled by the Great Depression, but activity on development of the river began in earnest
shortly after the economy recovered. In 1937, the Texas Legislature created the San
Antonio River Authority with the main purpose of the conservation and development of
the San Antonio River Watershed. On October 25, 1938, a special election was held in
which the voters approved a tax of 0.015 cents per $100 valuation to raise $75,000 in
order to leverage $325,000 in Works Project Administration funding for development of
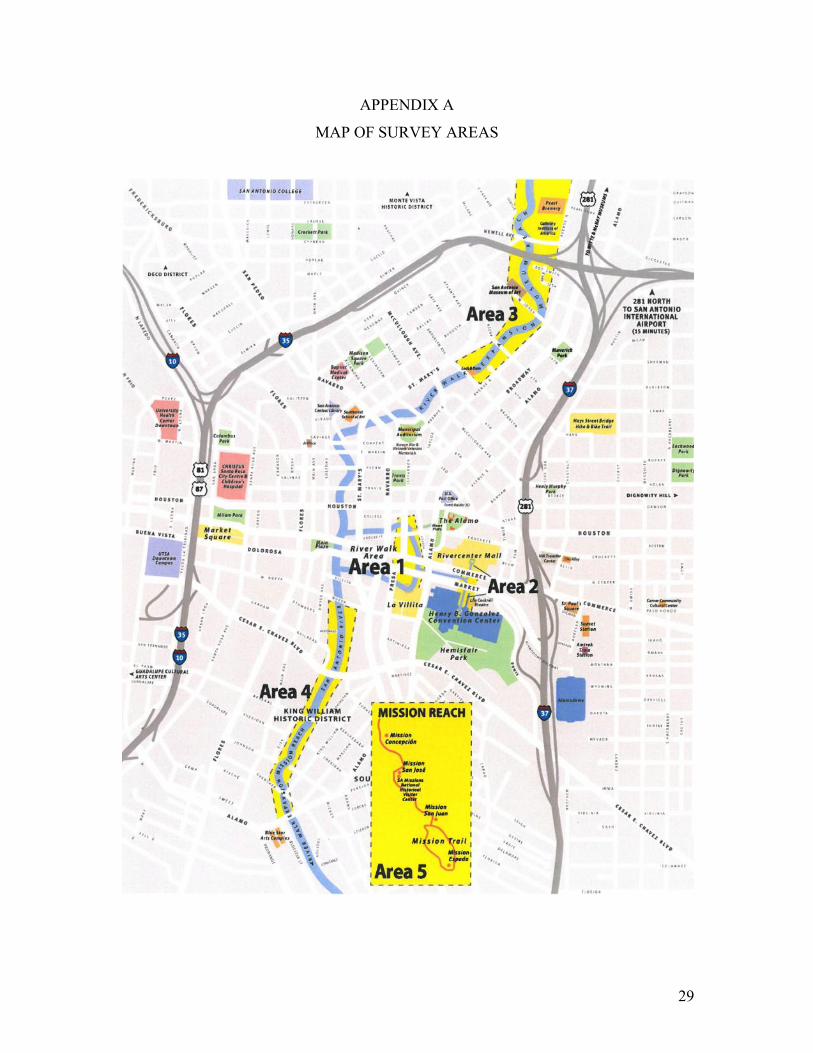
the river around what is now known as the horseshoe area of the River Walk (identified
as Area 1 on the map found in the appendix). On October 25, 1939, the project, designed
by Mr. Hugman, finally began and was completed in 1941.
On March 28, 1962, the City of San Antonio City Council passed an ordinance
that created a River Walk District and seven member River Walk Advisory Commission.
The ordinance was developed by David Straus and his staff at the San Antonio Chamber
of Commerce and was based on similar ordinances from Carmel, California and New
Orleans’ Vieux Carre Commission. Following this lead, the San Antonio Chapter of the
American Institute of Architects created a plan for the Paseo del Rio. In 1964, the Paseo
del Rio Association was formed.
With this foundation in place, continued improvements to the River Walk have
been made through the years and development along the river has grown fairly quickly.
Major improvements to the River Walk were most recently made with the $358.3 million
San Antonio River Improvements Project, which includes two significant reaches; the
Museum Reach and Mission Reach. The project was funded with money from Bexar
County, City of San Antonio, San Antonio Water System, U.S.A. Corps of Engineers,
and private donors, with the San Antonio River Authority serving as project manager and
ultimately overseeing operations and maintenance once construction is complete.
Construction on the Museum Reach improvements began in 2007, and the Mission Reach
improvements began in 2008. In May 2008, voters approved for a portion of the Bexar
5 Source: http://www.thesanantonioriverwalk.com/history/history-of-the-river-walk

6
County Hotel Occupancy Tax and Car Rental Tax to help pay for improvements to the
Museum Reach, Mission Reach and flood control. On May 30, 2009, the Museum Reach
opened. Phase I of the Mission Reach was opened in 2010, Phase 2 in 2011, and Phase 3
in 2013. The Museum Reach extended the River Walk 1.33 miles from Lexington
Avenue north passing the San Antonio Museum of Art to Josephine Street. This
extension has been a major catalyst to much economic development in the area,
especially in and around the Pearl Brewery at the northern end of the Museum Reach.
The Mission Reach is an eight-mile stretch of the San Antonio River that extends to
Mission Espada. These improvements restored the river to its more natural state and
created a beautiful linear park environment with fifteen miles of hike and bike trails and
numerous other park amenities along the river.
With the vision and collaborative efforts of many individuals and organizations,
the San Antonio River Walk has grown into a crown jewel of the community that attracts
millions of visitors each year and adds tremendously to the quality of life of the area
residents.

7
III. Purpose of This Project
It is with this long and storied history in mind that this study is undertaken. The
main purpose of this study is to assist in measuring the impact of the River Walk on the
City of San Antonio and Bexar County. This would include overall visitation,
demographics, and economic impact. In studying such a historic treasure that is so
deeply woven into the fabric and culture of the community, it is difficult to capture and
quantify all of the benefits the River Walk bestows, but this study does measure a large
portion of the economic impact derived from the spending of visitors to the River Walk
over a one-year period of time. However, the scope of this report was not intended to
capture a wealth of private sector investment along the banks and/or adjacent to the River
Walk, the increased property values of these areas, and the jobs associated to
development projects such as the Pearl District, etc. which have a connectivity to the
River Walk.
The following section will summarize the results of the analysis with the
methodologies used discussed in the latter sections.
IV. Results
IV.1. Socioeconomics and Demographics of Visitors to the River Walk
The following series of tables summarizes the results of the surveys. Across all of
the results, residents refer to people residing in Bexar County and non-residents refer to
those who reside outside of Bexar
County. Of the 702 surveys
completed, residents completed
19.4% of the surveys completed
with the balance of the surveys
(80.6%) being completed by
visitors from outside Bexar
County. Based on the zip code

8
data collected, 60% of the visitors completing survey were from Texas but outside Bexar
County, 40% were from outside Texas with 4% of those visitors coming from another
country.6 While most of the international visitors came from Mexico, others visited from
Puerto Rico, Italy, France, Estonia, Lithuania, Canada, Trinidad, and the United
Kingdom. Of all visitors to the River Walk, including both Bexar County residents and
visitors from outside the county, almost two-thirds of the visitors to the River Walk were
from Texas. Visitors from California made up the second-largest proportion of visitors,
followed by visitors from Arizona, Oklahoma, and Minnesota (See Chart 1).
About two-thirds (71.85%) of residents visit the River Walk more than twice per
year, and 43.37% of non-resident visitors make multiple visits to the River Walk (Table
10). On the other end of the frequency scale, 33.15% of non-residents were visiting the
River Walk for the first time, indicating that the River Walk does a good job of attracting
both repeat and new visitors. The high satisfaction scores shown in Table 19 also support
this. Including those locals who visit at least two times per year to the River Walk, over
6 A table showing all of the zip codes representing the residence of the visitors from outside Bexar County is provided in the appendix. Not everyone who completed surveys provided viable zip codes.
0.0%
10.0%
20.0%
30.0%
40.0%
50.0%
60.0%
70.0%
Texas California Arizona Oklahoma Minnesota Other
69.4%
3.1% 1.6% 1.6% 1.5%
22.9%
Chart 1: Proportion of River Walk Visitors from Various States
(Based on Home State of Survey Respondent)
Includes resident and non-resident visitors

9
85% of the locals make at least two visits to the River Walk each year. Again, given the
high satisfaction scores of the residents, the River Walk appears to enhance the quality of
life of the residents who use it.
Most of these visitors get to the River Walk and/or San Antonio by private car –
71.43% for residents and 70.50% for non-residents (Table 9). Of the residents, the time of
year in which they typically visit the River Walk is fairly evenly distributed throughout
the four seasons (Table 11). On the other hand, non-residents tend to visit more often in
the Spring (31.67%) and Summer (35.31%). This is not too surprising since these are
times of high travel during the year. Upon arrival, the non-resident visitors were more
likely to stay in a hotel on the River Walk (41.79%) or a hotel elsewhere in downtown
(20.80%), as shown in Table 14. The largest proportion of the visitors (32.17%) stayed
two nights, and 22.79% of them
stayed more than three nights (Table
15). While 8.46% of the visitors were
day trippers, the results indicate that
the majority of non-resident visitors to
the River Walk stay in the area for at
least two nights. Almost all of them
also tend to bring others with them, as
do the resident visitors (Tables 17, 17A, 17B, and 17C).
The demographics of the resident and non-resident visitors are somewhat similar
with a slight majority of both being female (Table 3) and middle-aged (Table 2).
However, fitting with the demographics of San Antonio and Bexar county, the highest
proportion of resident visitors were Hispanic/Latin American (50.00%) with only 33.22%
of non-resident visitors being Hispanic/Latin American. The majority (51.32%) of non-
resident visitors were Caucasian/White compared to 32.09% for the resident visitors
(Table 4). Almost half of the resident visitors (45.59%) were married compared to about
two-thirds of the non-resident visitors (64.13%), as shown in Table 5. About two-thirds
of the visitors, regardless of their residence, were employed full-time (Table 6). Of the
resident visitors, 11.11% were unemployed, almost twice that of the non-resident visitors,
while 18.72% of the non-resident visitors indicated they stayed at home (i.e., retired),
10
which is a bit more than the resident visitors at 8.89%. This is indicative of the fact that
the non-resident visitors have to have the income to pay for travel expenses and have to
have the time to travel. This is also supported by the data shown in Tables 7 and 8
indicating that the non-resident visitors tend to have higher incomes and educational
levels than do the resident visitors.
As shown in Table 12A, the main reasons for residents to visit the River Walk
appear to be entertainment/special events (23.76%), recreation (17.33%), restaurants/bars
(13.37%), and to bring visitors (12.87%). When they do visit the River Walk, the resident
visitors tend to go to the Historic River Bend (38.46%) and the Southern Channel
(32.17%) most often followed by the Museum Reach (18.18%) and Mission Reach
(11.19%), as shown in Table 16. This pattern fits with some of the other results (e.g.,
bringing visitors and attending special events), which would attract most visitors to the
Historic River Bend and the Southern Channel. Additionally, the Museum Reach and
Mission Reach areas are
relatively new, so as more
people learn about these
areas of the River Walk,
the proportion of people
who visit them may
increase. Among the non-
resident visitors, the
results in Table 12B show
that the largest proportion
of them (31.28%) cited the main reason for coming to San Antonio was to visit the River
Walk, followed by vacation (27.69%), and to visit friends and family (18.29%). Among
the residents, the largest number of visitors indicated the quality of experience (30.11%)
attracted them to the River Walk followed by the uniqueness of the amenity (27.96%).
The results were somewhat similar for the non-resident visitors with 30.99% indicating
the uniqueness is what attracted them, while 24.97% were attracted by the quality of the
experience. The proximity to their hotel played a bigger role in their visiting the River
Walk than it did with the resident visitors – 25.22% and 15.59%, respectively (Table 13).

11
In learning about the River Walk and its events and attractions (Table 18), word-
of-mouth from family and friends is the biggest source of information for both residents
(26.15%) and non-residents (39.01%). The internet is also a key source of information
with 19.13% of non-residents indicating they got information from the internet compared
to 10.55% for residents. There is some disparity in sources of information, however, with
locals more likely to get
information from the newspaper
(12.84%), radio (11.01%),
magazines (8.72%), and television
(12.39%), which makes sense
given their access to these local
venues. On the other hand, visitors
from out-of-town are more likely
to get information from hotel staff
(5.22%) and convention materials (3.73%), although these are still sources of information
for a small number of local visitors. Somewhat counter-intuitively, a similar proportion of
residents (7.34%) compared to the non-resident visitors (7.33%) indicated brochures were
a source of information.
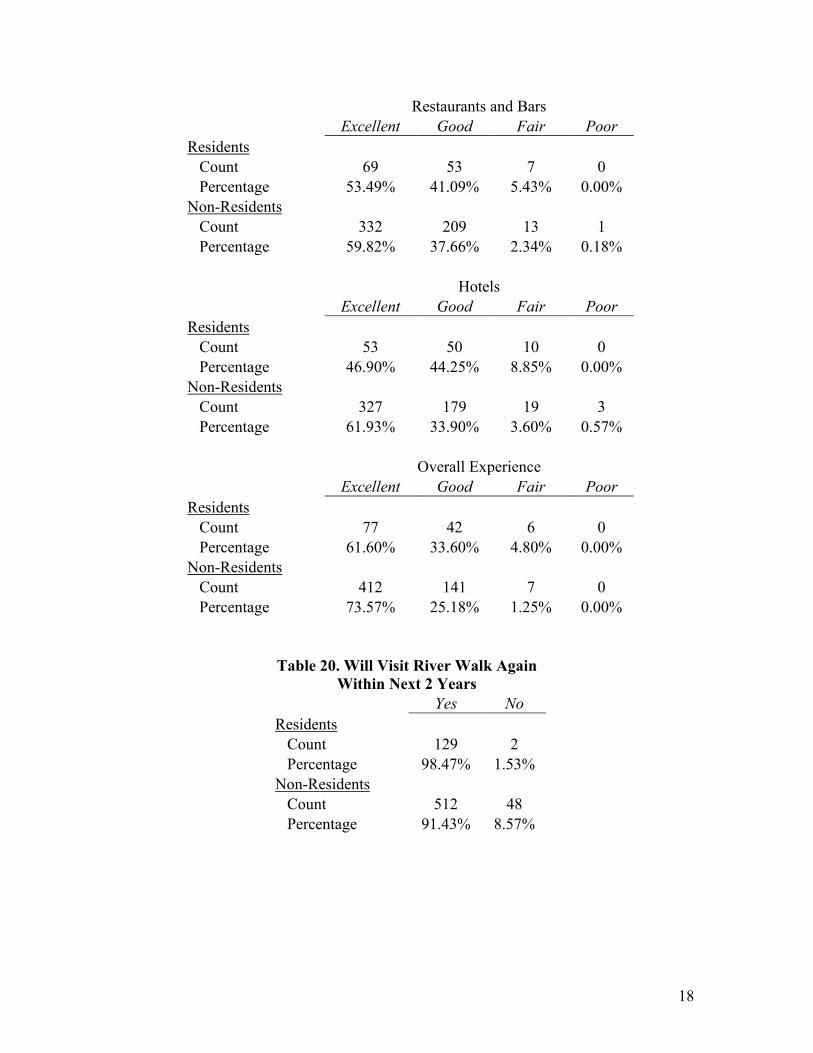
The River Walk provides an outstanding experience, as evidenced by the fact that
close to 90% of both the resident and non-resident visitors indicated at least a satisfaction
level of good across all of the attractions and amenities at the River Walk (Table 19). In
fact, with the exception of the shopping experience, all of the amenities had a higher
proportion of visitors rate their satisfaction as excellent. The highest level of satisfaction
among the residents appears to be with the entertainment and special events (55.81%
rating excellent) followed by restaurants and bars (53.49% rating excellent). The non-
resident visitors found the greatest satisfaction with the hotels (61.93% rating excellent)
followed closely by restaurants and bars with 59.82% giving a rating of excellent.
Interestingly, the ratings of the overall experience are higher than any of the individual
amenities with 61.60% of the resident and 73.57% of the non-resident visitors expressing
the highest levels of satisfaction. This provides some evidence that while the satisfaction
levels of the various attractions individually are slightly lower, their combination leads to

12
a more enjoyable experience for the visitor. In other words, the total experience is greater
than the sum of its parts.
As might be expected by the high levels of satisfaction with the River Walk,
almost all of the visitors indicated that they would be returning to the River Walk within
the next 2 years (Table 20). Of the non-residents who indicated they would not be
returning (only 8.57%), the biggest reasons given were that it was too far from their home
or they were just going to expand their travel experiences to other sites.
Table 2. Age of Visitors <18 18 to 25 26 to 35 36 to 45 46 to 55 56 to 65 >65 Residents Count 3 24 24 30 29 17 9 Percentage 2.21% 17.65% 17.65% 22.06% 21.32% 12.50% 6.62% Non-Residents Count 12 85 99 137 115 72 45 Percentage 2.12% 15.04% 17.52% 24.25% 20.35% 12.74% 7.96%
Table 3. Gender of Visitors Male Female Residents Count 66 70 Percentage 48.53% 51.47% Non-Residents Count 235 329 Percentage 41.67% 58.33%
Table 4. Race and Ethnicity of Visitors7
Caucasion/White African-
American/Black Asian/Pacific
Islander Indian/Native
American Hispanic/Latin
American Other Residents Count 43 16 5 3 67 0 Percentage 32.09% 11.94% 3.73% 2.24% 50.00% 0.00% Non-Residents Count 292 46 26 9 189 7 Percentage 51.32% 8.08% 4.57% 1.58% 33.22% 1.23% San Antonio Percentage 72.60% 6.90% 2.40% 0.90% 63.20% 13.70%
7 Source of data for San Antonio is the U.S. Census American FactFinder.

13
Table 5. Living Arrangement of Visitors Single Married Separated Divorced Widowed Domestic Partner Residents Count 45 62 7 12 5 5 Percentage 33.09% 45.59% 5.15% 8.82% 3.68% 3.68% Non-Residents Count 140 363 6 26 12 19 Percentage 24.73% 64.13% 1.06% 4.59% 2.12% 3.36%
Table 6. Employment Status of Visitors Full-time Part-time Unemployed Stay at Home Residents Count 89 19 15 12 Percentage 65.93% 14.07% 11.11% 8.89% Non-Residents Count 365 59 32 105 Percentage 65.06% 10.52% 5.70% 18.72%
Table 7. Gross Annual Household Income of Visitors
<$20,000
$20,000 to
$39,999
$40,000 to
$59,000
$60,000 to
$79,999
$80,000 to
$99,999
$100,000 to
$119,999 >$120,000 Residents Count 26 47 26 16 3 6 6 Percentage 20.00% 36.15% 20.00% 12.31% 2.31% 4.62% 4.62% Non-Residents Count 71 104 95 93 60 46 68 Percentage 13.22% 19.37% 17.69% 17.32% 11.17% 8.57% 12.66%
Table 8. Educational Level of Visitors
<12th 9th to 12th, No Diploma
High School
Some College,
No Degree Associate's
Degree Bachelor's
Degree Graduate/Professional
Degree Residents Count 10 8 20 44 9 29 15 Percentage 7.41% 5.93% 14.81% 32.59% 6.67% 21.48% 11.11% Non-Residents Count 36 24 82 128 52 130 105 Percentage 6.46% 4.31% 14.72% 22.98% 9.34% 23.34% 18.85%

14
Table 9. Mode of Transportation to the River Walk or San Antonio Private car Bus Taxi Airline By Foot Other Residents Count 100 23 3 2 9 3 Percentage 71.43% 16.43% 2.14% 1.43% 6.43% 2.14% Non-Residents Count 392 24 2 121 3 14 Percentage 70.50% 4.32% 0.36% 21.76% 0.54% 2.52%
Table 10. Frequency of Visits to River Walk First Time Once Twice >Twice Residents Count 5 15 18 97 Percentage 3.70% 11.11% 13.33% 71.85% Non-Residents Count 185 38 93 242 Percentage 33.15% 6.81% 16.67% 43.37%
Table 11. Time of Year for Visit(s) Winter Spring Summer Fall Residents Count 85 90 72 69 Percentage 26.90% 28.48% 22.78% 21.84% Non-Residents Count 147 235 262 98 Percentage 19.81% 31.67% 35.31% 13.21%
Table 12A. Primary Reason for Visiting River Walk (Residents Only)
Count Percent Entertainment/Special Events 48 23.76% Recreation 35 17.33% Restaurants/Bars 27 13.37% Bring Visitors 26 12.87% Shopping 22 10.89% Business 15 7.43% Other 13 6.44% Hotel 2 0.99%

15
Table 12B. Primary Reason for Visiting San Antonio (Non-residents Only)
Visit River Walk Visit
Friends/Family Vacation Business Convention Other Count 183 107 162 34 21 54 Percent 31.28% 18.29% 27.69% 5.81% 3.59% 9.23%
Table 13. Reason(s) for Choosing to Visit the River Walk
Proximity to Home/Hotel Uniqueness
Quality of Experience
Value of Experience Other
Residents Count 29 52 56 30 19 Percentage 15.59% 27.96% 30.11% 16.13% 10.22% Non-Residents Count 201 247 199 114 36 Percentage 25.22% 30.99% 24.97% 14.30% 4.52%
Table 14. Where Staying While in San Antonio (Non-residents Only)
Hotel on
River Walk Hotel
Downtown Hotel Elsewhere in
San Antonio Friends/Family Own
House Not Applicable Other Count 229 114 86 46 5 46 22 Percent 41.79% 20.80% 15.69% 8.39% 0.91% 8.39% 4.01%
Table 15. Length of Stay by Non-residents in San Antonio (# Nights) None 1 2 3 >3 Count 46 105 175 94 124 Percent 8.46% 19.30% 32.17% 17.28% 22.79%
Table 16. Area of the River Walk Visiting (Residents Only8) Historic River Bend Museum Reach Southern Channel Mission Reach Count 55 26 46 16 Percent 38.46% 18.18% 32.17% 11.19%
8 Only residents were asked about the areas of the River Walk they were visiting because it would have taken too much time to explain the location of the different areas to out-of-town visitors, so in order to expedite the survey process and try to maximize the numbers of respondents, out-of-town visitors were not asked this question.

16
Table 17. Visiting River Walk Alone or With Others Visiting Alone Visiting With Others Residents Count 18 116 Percentage 13.43% 86.57% Non-Residents Count 32 522 Percentage 5.78% 94.22%
Table 17A. Number of Others Visiting With (Not Including Self) 1 2 3 4 >4 Residents Count 26 32 23 21 13 Percentage 22.61% 27.83% 20.00% 18.26% 11.30% Non-Residents Count 164 75 85 72 134 Percentage 30.94% 14.15% 16.04% 13.58% 25.28%
Table 17B. Number of People in Immediate Family (Non-residents) 1 2 3 4 >4 Count 169 96 66 61 89 Percentage 35.14% 19.96% 13.72% 12.68% 18.50%
Table 17C. Resident Companions From Outside Bexar County 1 2 3 4 >4 Count 26 21 10 12 6 Percent 34.67% 28.00% 13.33% 16.00% 8.00%

17
Table 18. Source of Information About River Walk Residents Non-Residents Count Percentage Count Percentage Family/Friends 57 26.15% 314 39.01% Internet 23 10.55% 154 19.13% Magazine 19 8.72% 64 7.95% Brochures 16 7.34% 59 7.33% TV 27 12.39% 56 6.96% Other 17 7.80% 46 5.71% Hotel Staff 3 1.38% 42 5.22% Convention Materials 4 1.83% 30 3.73% Newspaper 28 12.84% 23 2.86% Radio 24 11.01% 17 2.11%
Table 19. Rating of River Walk Attractions Entertainment and Special Events Excellent Good Fair Poor Residents Count 72 47 10 0 Percentage 55.81% 36.43% 7.75% 0.00% Non-Residents Count 312 209 13 1 Percentage 58.32% 39.07% 2.43% 0.19% Museums Excellent Good Fair Poor Residents Count 58 49 17 0 Percentage 46.77% 39.52% 13.71% 0.00% Non-Residents Count 260 219 23 0 Percentage 51.79% 43.63% 4.58% 0.00% Shopping Excellent Good Fair Poor Residents Count 50 66 12 1 Percentage 38.76% 51.16% 9.30% 0.78% Non-Residents Count 271 234 32 4 Percentage 50.09% 43.25% 5.91% 0.74%
18
Restaurants and Bars Excellent Good Fair Poor Residents Count 69 53 7 0 Percentage 53.49% 41.09% 5.43% 0.00% Non-Residents Count 332 209 13 1 Percentage 59.82% 37.66% 2.34% 0.18% Hotels Excellent Good Fair Poor Residents Count 53 50 10 0 Percentage 46.90% 44.25% 8.85% 0.00% Non-Residents Count 327 179 19 3 Percentage 61.93% 33.90% 3.60% 0.57% Overall Experience Excellent Good Fair Poor Residents Count 77 42 6 0 Percentage 61.60% 33.60% 4.80% 0.00% Non-Residents Count 412 141 7 0 Percentage 73.57% 25.18% 1.25% 0.00%
Table 20. Will Visit River Walk Again Within Next 2 Years
Yes No Residents Count 129 2 Percentage 98.47% 1.53% Non-Residents Count 512 48 Percentage 91.43% 8.57%
19
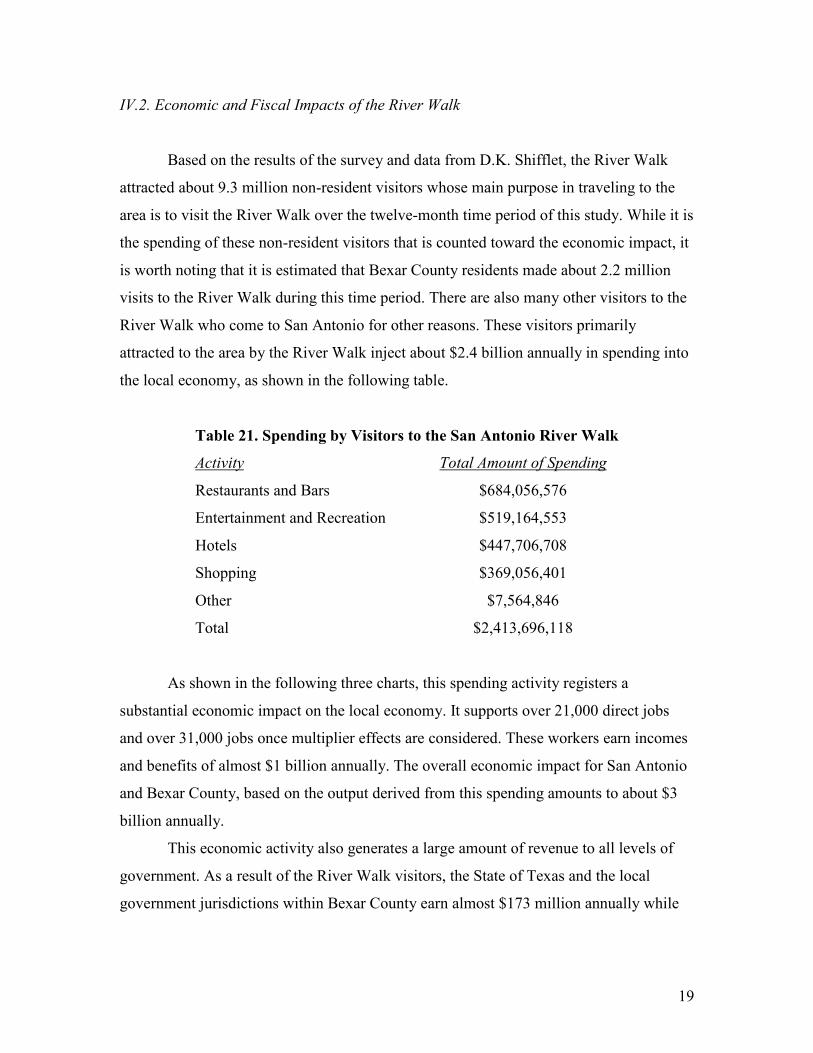
IV.2. Economic and Fiscal Impacts of the River Walk
Based on the results of the survey and data from D.K. Shifflet, the River Walk
attracted about 9.3 million non-resident visitors whose main purpose in traveling to the
area is to visit the River Walk over the twelve-month time period of this study. While it is
the spending of these non-resident visitors that is counted toward the economic impact, it
is worth noting that it is estimated that Bexar County residents made about 2.2 million
visits to the River Walk during this time period. There are also many other visitors to the
River Walk who come to San Antonio for other reasons. These visitors primarily
attracted to the area by the River Walk inject about $2.4 billion annually in spending into
the local economy, as shown in the following table.
Table 21. Spending by Visitors to the San Antonio River Walk
Activity Total Amount of Spending
Restaurants and Bars $684,056,576
Entertainment and Recreation $519,164,553
Hotels $447,706,708
Shopping $369,056,401
Other $7,564,846
Total $2,413,696,118
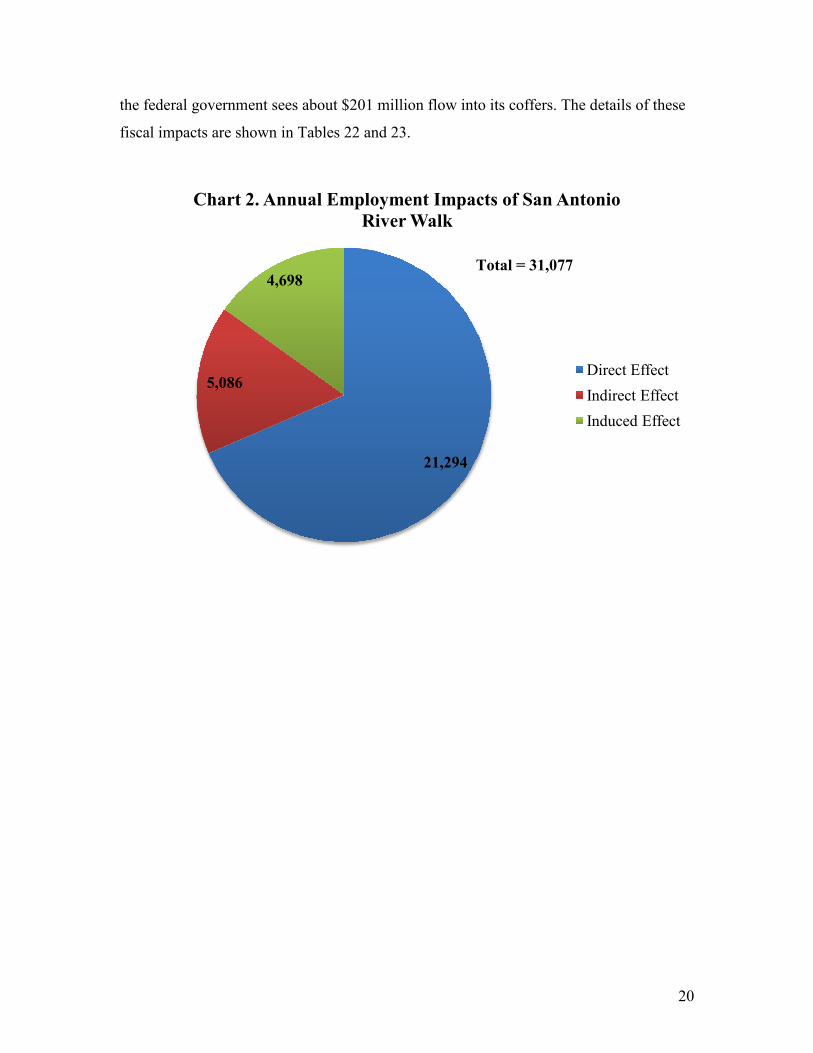
As shown in the following three charts, this spending activity registers a
substantial economic impact on the local economy. It supports over 21,000 direct jobs
and over 31,000 jobs once multiplier effects are considered. These workers earn incomes
and benefits of almost $1 billion annually. The overall economic impact for San Antonio
and Bexar County, based on the output derived from this spending amounts to about $3
billion annually.
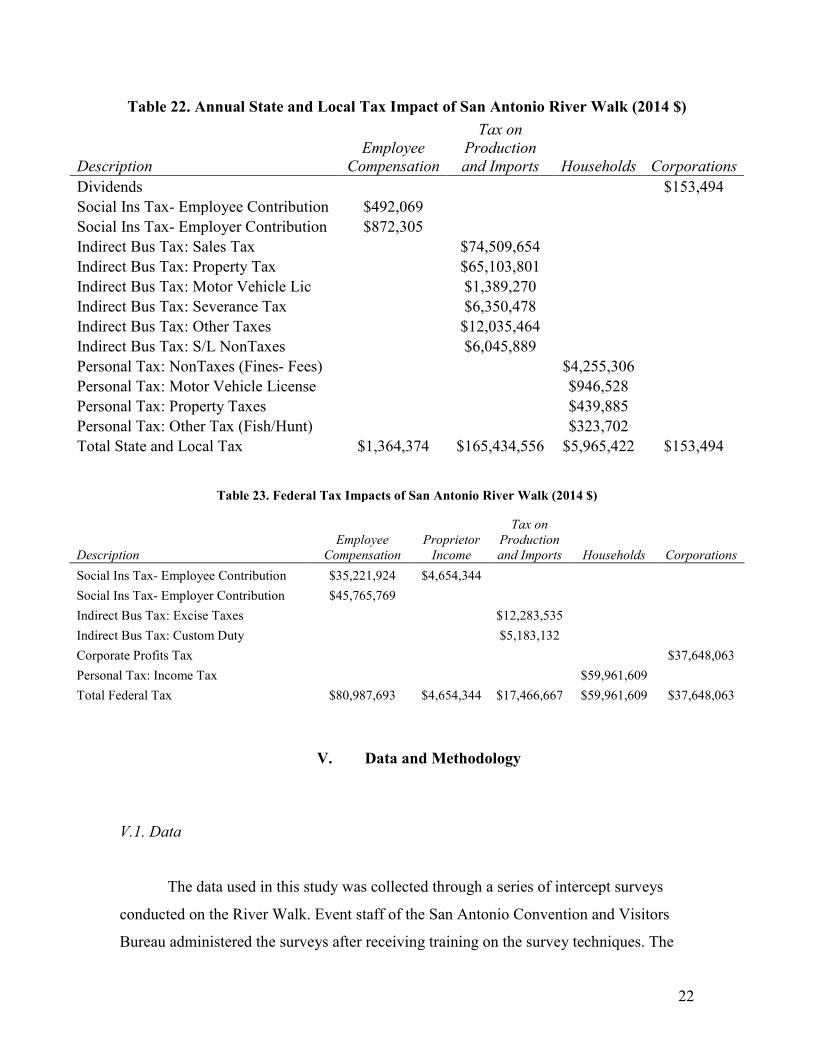
This economic activity also generates a large amount of revenue to all levels of
government. As a result of the River Walk visitors, the State of Texas and the local
government jurisdictions within Bexar County earn almost $173 million annually while
20
the federal government sees about $201 million flow into its coffers. The details of these
fiscal impacts are shown in Tables 22 and 23.
21,294
5,086
4,698
Chart 2. Annual Employment Impacts of San Antonio River Walk
Direct Effect Indirect Effect Induced Effect
Total = 31,077

21
$571,718,278 $231,329,230
$198,146,016
Chart 3. Annual Income Impacts of San Antonio River Walk (2014 $)
Direct Effect Indirect Effect Induced Effect
Total = $1,001,193,524
$1,807,908,085 $690,928,900
$597,066,199
Chart 4. Annual Output Impacts from San Antonio River Walk (2014 $)
Direct Effect Indirect Effect Induced Effect
Total = $3,095,903,185
22
Table 22. Annual State and Local Tax Impact of San Antonio River Walk (2014 $)
Description Employee
Compensation
Tax on Production and Imports Households Corporations
Dividends
$153,494 Social Ins Tax- Employee Contribution $492,069
Social Ins Tax- Employer Contribution $872,305 Indirect Bus Tax: Sales Tax
$74,509,654
Indirect Bus Tax: Property Tax
$65,103,801 Indirect Bus Tax: Motor Vehicle Lic
$1,389,270
Indirect Bus Tax: Severance Tax
$6,350,478 Indirect Bus Tax: Other Taxes
$12,035,464
Indirect Bus Tax: S/L NonTaxes
$6,045,889 Personal Tax: NonTaxes (Fines- Fees)
$4,255,306
Personal Tax: Motor Vehicle License
$946,528 Personal Tax: Property Taxes
$439,885
Personal Tax: Other Tax (Fish/Hunt)
$323,702 Total State and Local Tax $1,364,374 $165,434,556 $5,965,422 $153,494
Table 23. Federal Tax Impacts of San Antonio River Walk (2014 $)
Description Employee
Compensation Proprietor
Income
Tax on Production and Imports Households Corporations
Social Ins Tax- Employee Contribution $35,221,924 $4,654,344 Social Ins Tax- Employer Contribution $45,765,769
Indirect Bus Tax: Excise Taxes
$12,283,535 Indirect Bus Tax: Custom Duty
$5,183,132
Corporate Profits Tax
$37,648,063 Personal Tax: Income Tax
$59,961,609
Total Federal Tax $80,987,693 $4,654,344 $17,466,667 $59,961,609 $37,648,063
V. Data and Methodology
V.1. Data
The data used in this study was collected through a series of intercept surveys
conducted on the River Walk. Event staff of the San Antonio Convention and Visitors
Bureau administered the surveys after receiving training on the survey techniques. The
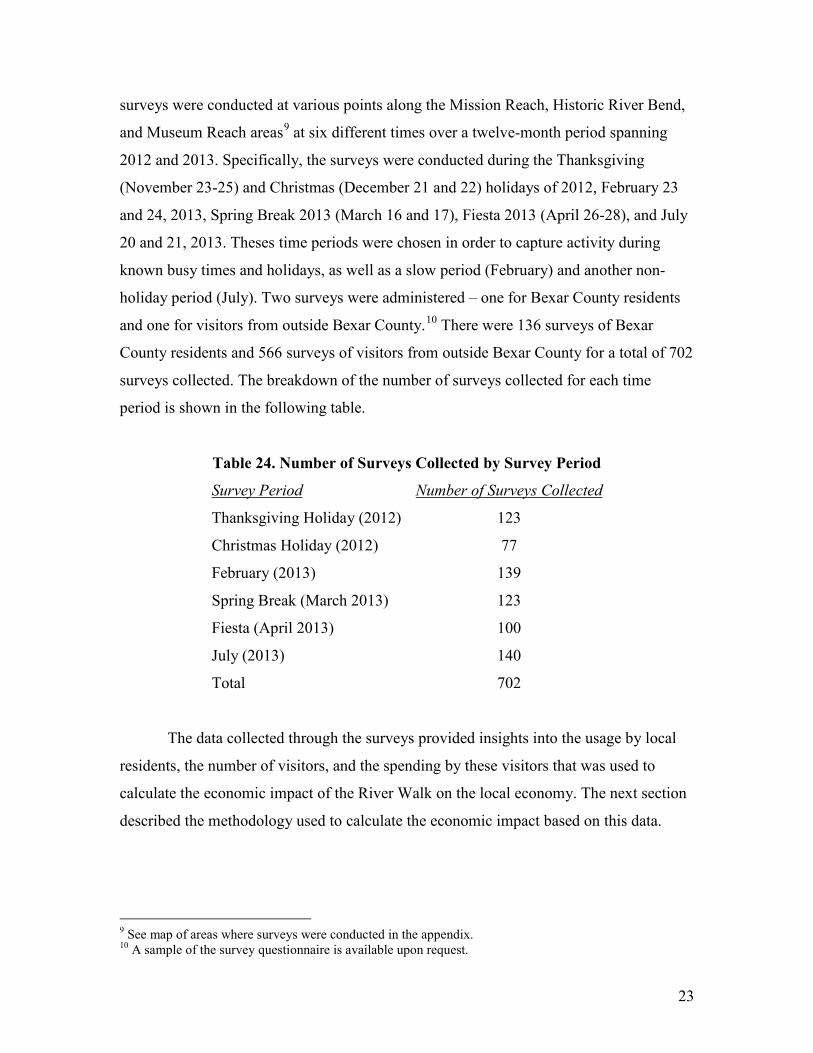
23
surveys were conducted at various points along the Mission Reach, Historic River Bend,
and Museum Reach areas9 at six different times over a twelve-month period spanning
2012 and 2013. Specifically, the surveys were conducted during the Thanksgiving
(November 23-25) and Christmas (December 21 and 22) holidays of 2012, February 23
and 24, 2013, Spring Break 2013 (March 16 and 17), Fiesta 2013 (April 26-28), and July
20 and 21, 2013. Theses time periods were chosen in order to capture activity during
known busy times and holidays, as well as a slow period (February) and another non-
holiday period (July). Two surveys were administered – one for Bexar County residents
and one for visitors from outside Bexar County.10 There were 136 surveys of Bexar
County residents and 566 surveys of visitors from outside Bexar County for a total of 702
surveys collected. The breakdown of the number of surveys collected for each time
period is shown in the following table.
Table 24. Number of Surveys Collected by Survey Period
Survey Period Number of Surveys Collected
Thanksgiving Holiday (2012) 123
Christmas Holiday (2012) 77
February (2013) 139
Spring Break (March 2013) 123
Fiesta (April 2013) 100
July (2013) 140
Total 702
The data collected through the surveys provided insights into the usage by local
residents, the number of visitors, and the spending by these visitors that was used to
calculate the economic impact of the River Walk on the local economy. The next section
described the methodology used to calculate the economic impact based on this data.
9 See map of areas where surveys were conducted in the appendix. 10 A sample of the survey questionnaire is available upon request.

24
The number of visitors was calculated based on the data provided by D.K. Shifflet
& Associates Ltd indicating that there are 29.8 million visitors to San Antonio.11 Based
on the survey results, 31.28% of the visitors traveled to Bexar County for the primary
purpose of visiting the River Walk. Using these two numbers to estimate the number of
visitors the River Walk attracts each year requires the assumption that the results of the
survey conducted on the River Walk are representative of all visitors to San Antonio and
Bexar County. The D.K. Shifflet data cover all of San Antonio, so a comparison of these
two data sets will provide some sense of the comparability. While the questions are not
exactly the same, we can do some reasonable comparisons. For instance, according to
data from the River Walk survey, 77.26% of the people came to San Antonio for vacation
(including those whose primary purpose was to visit the River Walk and visit friends and
family), and 80% of the people in the D.K. Shifflet report indicated they came to San
Antonio for vacation purposes (including getaway weekends and to visit friends and
relatives). The results of the River Walk survey indicate an average party size of about
2.52 people, and the D.K. Shifflet numbers indicate an average party size for all visitors
to San Antonio of 2.44. Thus, it seems reasonable to make the aforementioned
assumption. This provides an estimate that the River Walk attracts about 9.3 million
visitors to the area. This does not include the local residents who visit the River Walk or
non-resident visitors who are visiting for business purposes or who might be visiting the
area on vacation but whose primary purpose was not to visit the River Walk.
Even though the
aforementioned estimate of
the number of non-resident
visitors to the River Walk
may be conservative, we can
use that number combined
with the results of the survey
indicating that 19.4% of the
respondents were resident
visitors to estimate the
11 “2011-2012 San Antonio Overnight Leisure Visitor Profile,” D.K. Shifflet & Associates Ltd.

25
number of residents who visit the River Walk. Based on these calculations, residents of
Bexar County make about 2.2 million visits to the River Walk resulting in about a total of
eleven million visitors. The 2.2 million visits by residents is more than the population of
Bexar County, but it should be kept in mind that many of these residents stated in the
surveys that they visited the River Walk several times during a year.
In order to estimate the amount of spending by the visitors that would count
toward economic impact, all survey respondents were asked how much they spent. Only
the spending by those visitors whose primary reason for traveling to the area was counted
toward the economic impact. Data was also collected on the number of people in each
party, indicating about 2.5 people in each group visiting the River Walk12 resulting in
about 3.5 million parties visiting the River Walk. The number of parties was multiplied
by the amount of spending in various categories of activities: entertainment and
recreation, restaurants and bars, shopping, hotels, and other (mainly parking). This
spending activity was then run through the IMPLAN input-output model for Bexar
County in order to calculate the economic impact, as described below.
V.2. Economic Impact Concepts
Economic impact is based on the concept that a new dollar flowing into the area
causes an expansion of the economy. The economic activity of many businesses
generates exports outside of the region13, which brings this money flowing back into the
local economy. These businesses use this revenue to pay their workers’ salaries and
benefits, purchase inputs from local suppliers, and pay government taxes and fees. The
direct economic impact is derived from the production activity of the businesses and the
salaries and benefits they are then able to pay their workers. As already alluded to, this
also generates additional economic activity often times referred to as the multiplier
effects.
12 The questions allowed the respondent to reply that they had greater than four in their party. In this case, it was assumed that there were five people in these parties. 13 These exports include retail and hotel spending, for example, by visitors from outside the city. In this manner, many services are also exported.
26

27
The multiplier effects can be separated into two effects: the indirect effect and the
induced effect. The indirect effect results from the company purchasing inputs (physical
goods or services) from its local suppliers. Of course, this then sets off additional
spending by the supplier in its purchases of inputs and payment of salaries and benefits to
its employees. The induced effect is derived from the spending of the employees of the
company resulting from the incomes they receive. This is where the economic impact
really begins to spread throughout the economy as workers spend their incomes to buy
the various goods and services that they need and desire.
All of this economic activity also benefits the government at various levels as the
spending by businesses, their employees, and others generate tax revenues and fees. For
instance, these activities will generate excise, income, and property tax revenues, social
security contributions, and various license fees.
Of course, not all of this economic activity is captured within the local economy.
There are leakages as businesses and individual consumers purchase goods and services
outside of the local economy causing some money to leak or flow out of the local
economy. This is also the case as federal and state taxes and fees are paid resulting from
these activities. These leakages are accounted for in the model and are not counted as part
of the economic impact. In fact, they reduce the impact of these activities.

28
V.3. The Model
In order to estimate these impacts, the IMPLAN input-output model for the Bexar
County area was used. This model is based off “the ‘Input-Output Study of the U.S.
economy’ by the [U.S.] Bureau of Economic Analysis,”14 and is adapted for the Bexar
County economy using data specific to the region from the Bureau of Economic
Analysis. The IMPLAN model measures the interactions across 440 industries.
Input-output analysis was introduced by Wassily Leontief for which he later
received the Nobel Prize in economics in 1973.15 An input-output model describes the
economic interactions or trade flows among businesses, households, and governments
and shows how changes in one area of the economy impact other areas. The multipliers
that result from these models are the expressions of these interactions.
There are generally three basic multipliers used to measure the overall impacts.
The output multiplier measures the direct, indirect, and induced changes in output across
the economy resulting from a change in economic activity within the local economy. The
employment multiplier measures the direct, indirect, and induced changes in full-time
equivalent employment across the economy resulting from this change in economic
activity. Finally, the earnings multiplier measures the direct, indirect, and induced
changes in earnings (including benefits) across the economy resulting from the change in
economic activity. Like the proverbial ripples resulting from a rock being thrown in a
pond, the multiplier effects will register successive rounds of effects until eventually the
leakage from each round halts the process.
14 IMPLAN Professional® Version 2.0 User’s Guide, p. 98. 15 For an example of his seminal work, see: Leontief, Wassily et al., Studies in the Structure of the American Economy: Theoretical and Empirical Explorations in Input-Output Analysis, New York: Oxford University Press, 1953.
29
APPENDIX A
MAP OF SURVEY AREAS

30

31
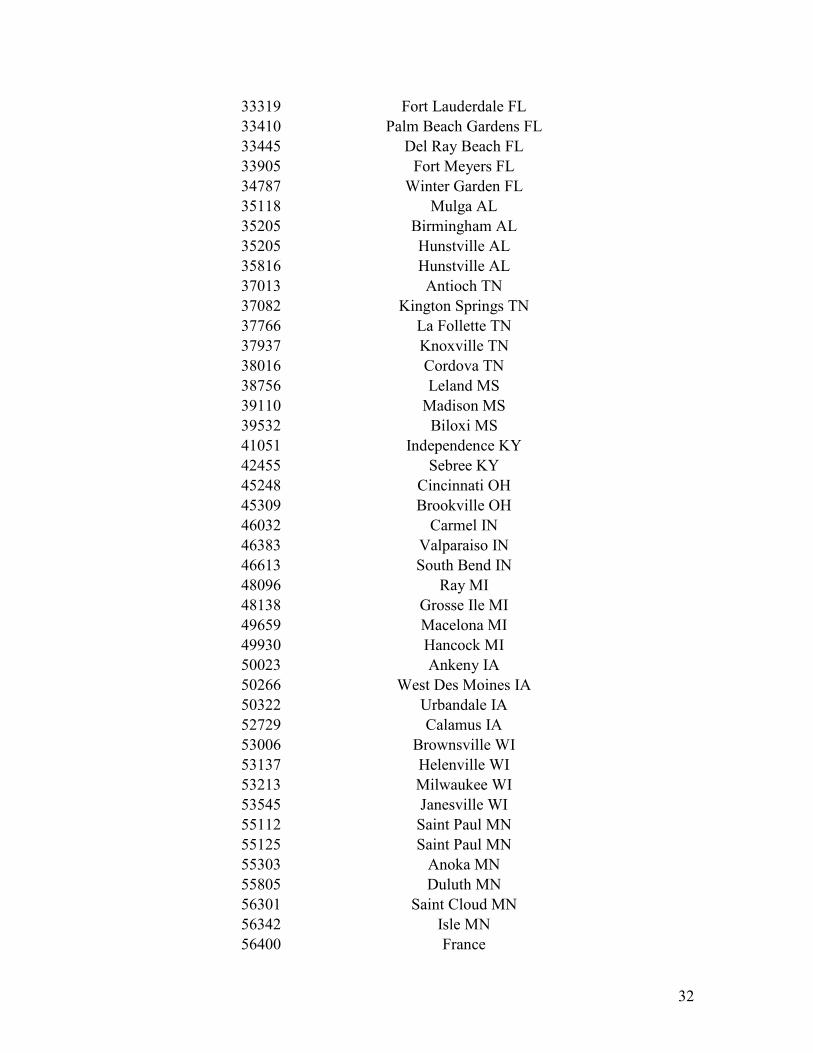
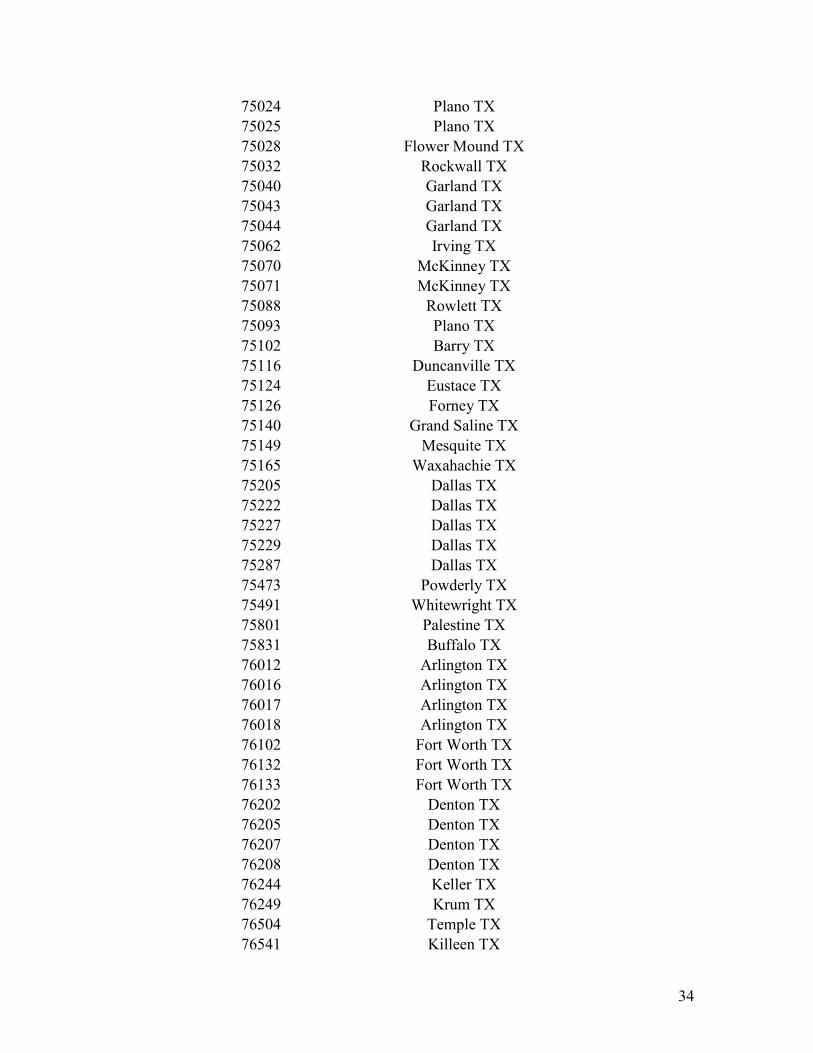
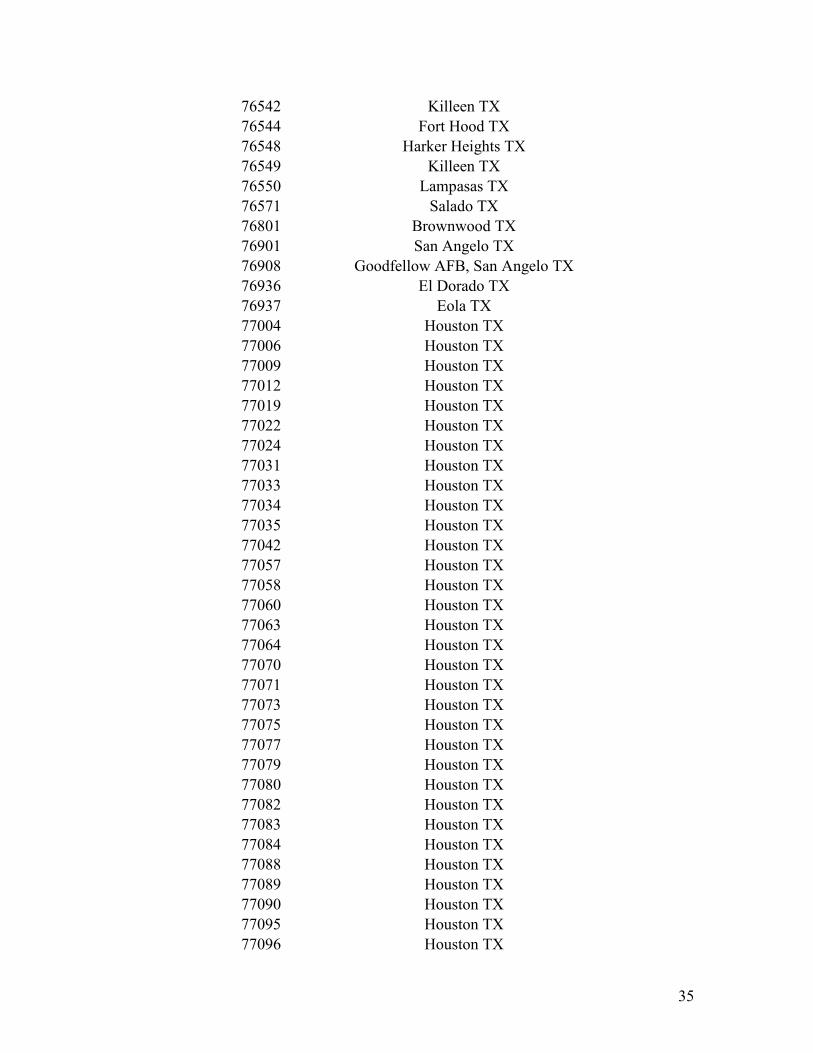
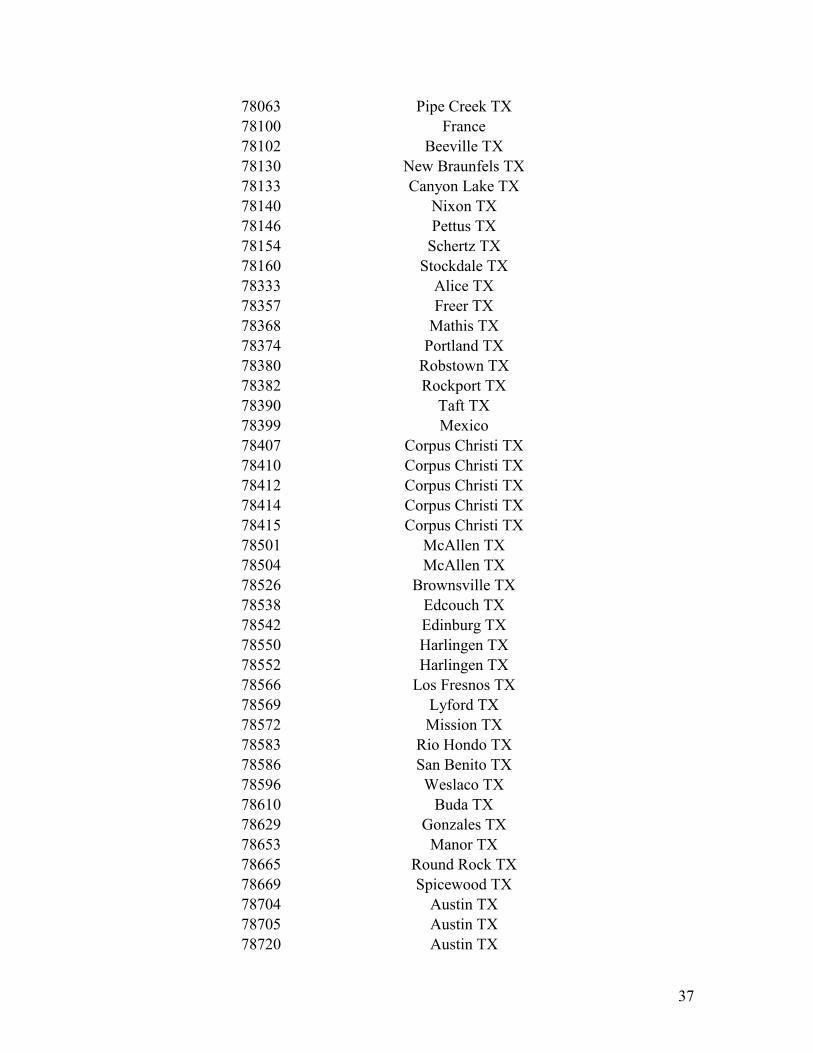
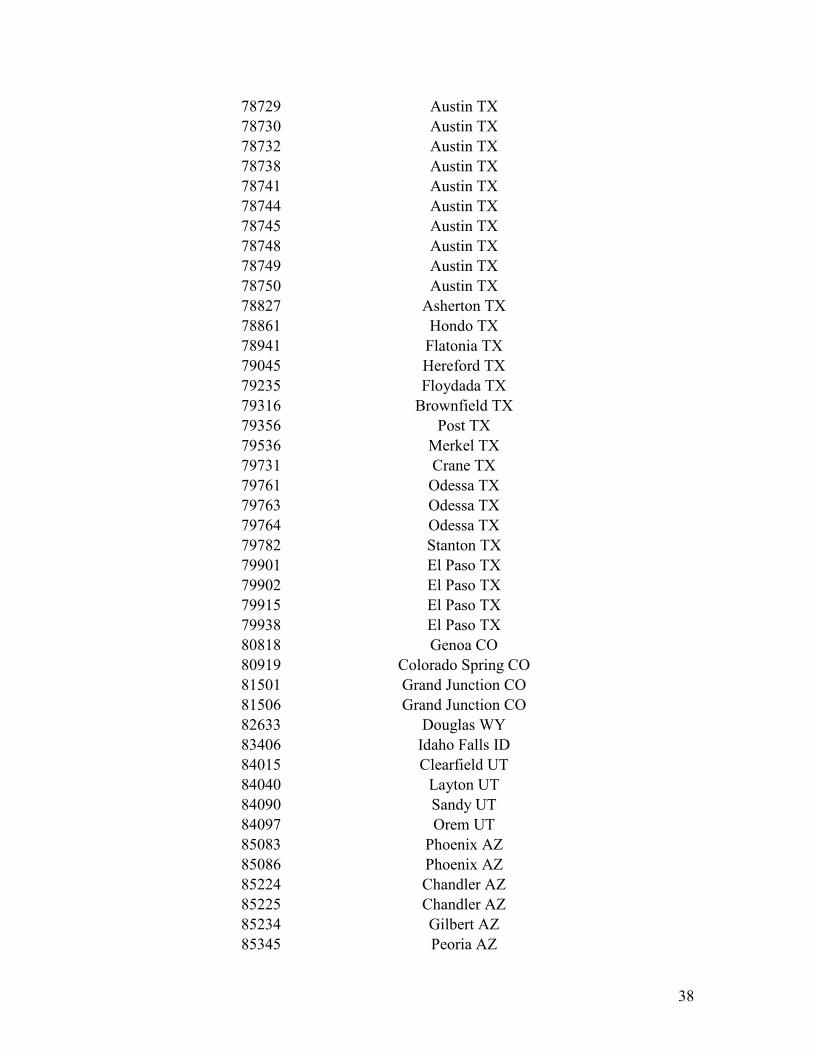
APPENDIX B
Table B1. Home Locations of Non-Resident Visitors to the River Walk
Zip Code Location 00961 Puerto Rico 02043 Hingham MA 02800 Mexico 04488 Stetson ME 07604 Hasbrouck Heights NJ 09740 Mexico 10601 White Plains NY 10950 Monroe NY 11379 Middle Village NY 14072 Grand Island NY 14830 Corning NY 15068 Arnold PA 16801 State College PA 17519 East Earl PA 19317 Chadds Ford PA 20003 Washington DC 20121 Centreville Va 20650 Leonardtown MA 20850 Rockville MD 21042 Ellicott City MD 22033 Fairfax VA 23510 Norfolk VA 27207 Bear Creek NC 27376 West End NC 27455 Greensboro NC 29012 Italy 29445 Goose Creek SC 29456 Ladson SC 29680 Simpsonville SC 29691 Walhalla SC 29709 Chesterfield SC 30017 Grayson GA 30078 Snellvile GA 30127 Powder Springs GA 31771 Norman Park GA 32578 Niceville FL 32779 Longwood FL
32
33319 Fort Lauderdale FL 33410 Palm Beach Gardens FL 33445 Del Ray Beach FL 33905 Fort Meyers FL 34787 Winter Garden FL 35118 Mulga AL 35205 Birmingham AL 35205 Hunstville AL 35816 Hunstville AL 37013 Antioch TN 37082 Kington Springs TN 37766 La Follette TN 37937 Knoxville TN 38016 Cordova TN 38756 Leland MS 39110 Madison MS 39532 Biloxi MS 41051 Independence KY 42455 Sebree KY 45248 Cincinnati OH 45309 Brookville OH 46032 Carmel IN 46383 Valparaiso IN 46613 South Bend IN 48096 Ray MI 48138 Grosse Ile MI 49659 Macelona MI 49930 Hancock MI 50023 Ankeny IA 50266 West Des Moines IA 50322 Urbandale IA 52729 Calamus IA 53006 Brownsville WI 53137 Helenville WI 53213 Milwaukee WI 53545 Janesville WI 55112 Saint Paul MN 55125 Saint Paul MN 55303 Anoka MN 55805 Duluth MN 56301 Saint Cloud MN 56342 Isle MN 56400 France

33
56441 Crosby MN 57006 Brookings SD 57702 Rapid City SD 59102 Billings MT 59714 Belgrade MT 60445 Midlothian IL 60611 Chicago IL 60622 Chicago IL 62223 Belleville IL 63139 Saint Louis MO 63304 Saint Charles MO 65712 Mount Vernon MO 66059 Mexico 66206 Leawood KS 68105 Omaha NE 68133 Papillion NE 68135 Omaha NE 68307 Avoca NE 68326 Carleton NE 70001 Metairie LA 70118 New Orleans LA 70244 Mexico 70356 Gibson LA 70394 Raceland LA 70714 Baker LA 70726 Denham Springs LA 70808 Baton Rouge LA 71011 Mexico 72734 Gentry AR 72923 Barling AR 73069 Norman OK 73098 Wynnewood OK 73104 Oklahoma City OK 73130 Oklahoma City OK 74006 Bartlesville OK 74048 Nowata OK 74055 Owasso OK 74407 Estonia 75006 Carrollton TX 75010 Carrollton TX 75021 Denison TX 75022 Flower Mound TX 75023 Plano TX
34
75024 Plano TX 75025 Plano TX 75028 Flower Mound TX 75032 Rockwall TX 75040 Garland TX 75043 Garland TX 75044 Garland TX 75062 Irving TX 75070 McKinney TX 75071 McKinney TX 75088 Rowlett TX 75093 Plano TX 75102 Barry TX 75116 Duncanville TX 75124 Eustace TX 75126 Forney TX 75140 Grand Saline TX 75149 Mesquite TX 75165 Waxahachie TX 75205 Dallas TX 75222 Dallas TX 75227 Dallas TX 75229 Dallas TX 75287 Dallas TX 75473 Powderly TX 75491 Whitewright TX 75801 Palestine TX 75831 Buffalo TX 76012 Arlington TX 76016 Arlington TX 76017 Arlington TX 76018 Arlington TX 76102 Fort Worth TX 76132 Fort Worth TX 76133 Fort Worth TX 76202 Denton TX 76205 Denton TX 76207 Denton TX 76208 Denton TX 76244 Keller TX 76249 Krum TX 76504 Temple TX 76541 Killeen TX
35
76542 Killeen TX 76544 Fort Hood TX 76548 Harker Heights TX 76549 Killeen TX 76550 Lampasas TX 76571 Salado TX 76801 Brownwood TX 76901 San Angelo TX 76908 Goodfellow AFB, San Angelo TX 76936 El Dorado TX 76937 Eola TX 77004 Houston TX 77006 Houston TX 77009 Houston TX 77012 Houston TX 77019 Houston TX 77022 Houston TX 77024 Houston TX 77031 Houston TX 77033 Houston TX 77034 Houston TX 77035 Houston TX 77042 Houston TX 77057 Houston TX 77058 Houston TX 77060 Houston TX 77063 Houston TX 77064 Houston TX 77070 Houston TX 77071 Houston TX 77073 Houston TX 77075 Houston TX 77077 Houston TX 77079 Houston TX 77080 Houston TX 77082 Houston TX 77083 Houston TX 77084 Houston TX 77088 Houston TX 77089 Houston TX 77090 Houston TX 77095 Houston TX 77096 Houston TX

36
77301 Conroe TX 77304 Conroe TX 77327 Cleveland TX 77339 Kingwood TX 77340 Huntsville TX 77345 Katy TX 77346 Humble TX 77356 Montgomery TX 77365 Porter TX 77382 Spring TX 77386 Spring TX 77388 Spring TX 77389 Spring TX 77429 Cypress TX 77432 Danevang TX 77433 Cypress TX 77459 Missouri City TX 77475 Sheridan TX 77477 Stafford TX 77479 Sugar Land TX 77494 Katy TX 77504 Pasadena TX 77511 Alvin 77520 Baytown TX 77535 Dayton TX 77546 Friendswood TX 77554 Galveston TX 77571 La Porte TX 77581 Pearland TX 77584 Pearland TX 77591 Texas City TX 77656 Silsebee TX 77662 Vidor TX 77707 Beaumont TX 77806 Bryan TX 77841 College Station TX 77845 College Station TX 77901 Victoria TX 77904 Houston TX 77961 Francitas TX 78019 Encinal TX 78022 Geore West TX 78028 Kerrville TX
37
78063 Pipe Creek TX 78100 France 78102 Beeville TX 78130 New Braunfels TX 78133 Canyon Lake TX 78140 Nixon TX 78146 Pettus TX 78154 Schertz TX 78160 Stockdale TX 78333 Alice TX 78357 Freer TX 78368 Mathis TX 78374 Portland TX 78380 Robstown TX 78382 Rockport TX 78390 Taft TX 78399 Mexico 78407 Corpus Christi TX 78410 Corpus Christi TX 78412 Corpus Christi TX 78414 Corpus Christi TX 78415 Corpus Christi TX 78501 McAllen TX 78504 McAllen TX 78526 Brownsville TX 78538 Edcouch TX 78542 Edinburg TX 78550 Harlingen TX 78552 Harlingen TX 78566 Los Fresnos TX 78569 Lyford TX 78572 Mission TX 78583 Rio Hondo TX 78586 San Benito TX 78596 Weslaco TX 78610 Buda TX 78629 Gonzales TX 78653 Manor TX 78665 Round Rock TX 78669 Spicewood TX 78704 Austin TX 78705 Austin TX 78720 Austin TX
38
78729 Austin TX 78730 Austin TX 78732 Austin TX 78738 Austin TX 78741 Austin TX 78744 Austin TX 78745 Austin TX 78748 Austin TX 78749 Austin TX 78750 Austin TX 78827 Asherton TX 78861 Hondo TX 78941 Flatonia TX 79045 Hereford TX 79235 Floydada TX 79316 Brownfield TX 79356 Post TX 79536 Merkel TX 79731 Crane TX 79761 Odessa TX 79763 Odessa TX 79764 Odessa TX 79782 Stanton TX 79901 El Paso TX 79902 El Paso TX 79915 El Paso TX 79938 El Paso TX 80818 Genoa CO 80919 Colorado Spring CO 81501 Grand Junction CO 81506 Grand Junction CO 82633 Douglas WY 83406 Idaho Falls ID 84015 Clearfield UT 84040 Layton UT 84090 Sandy UT 84097 Orem UT 85083 Phoenix AZ 85086 Phoenix AZ 85224 Chandler AZ 85225 Chandler AZ 85234 Gilbert AZ 85345 Peoria AZ

39
85388 Surprise AZ 86004 Flagstaff AZ 87002 Belen NM 87124 Rio Rancho NM 87710 Angel Fire NM 88005 Las Cruces NM 88011 Las Cruces NM 88081 Chaparral NM 88310 Alamogrodo NM 89149 Las Vegas NV 89701 Carson City NV 90135 Italy 90266 Manhattan Beach CA 90315 Lithuania 90815 Long Beach CA 92101 San Diego CA 92345 Hesperia CA 92346 Highland CA 92698 Aliso Viejo CA 93309 Bakersfield CA 93644 Oakhurtst CA 94404 San Mateo CA 94450 France 94501 Alameda CA 94510 Benicia CA 95135 San Jose CA 95833 Sacramento CA 95842 Sacramento CA 98007 Bellevue WA 98020 Edmonds WA 98031 Kent WA 98198 Seattle WA 98258 Lake Stevens WA 98272 Monroe WA 98541 Elma WA
Not provided Bellerive, Switzerland Not provided Canada Not provided United Kingdom/England Not provided Mexico Not provided Other Country Not provided Trinidad


