Date: 01.11.2012 Page 1 : 53 Report no: 12-039 Version : 1 Dock.ref: BIOWATER-AQUATEAM REPORT MPR WASTE TO SYSTEM 39 Impact of treating waste from the MPR desalination unit in the water treatment plant of Nyhamna Results from desktop and bench scale studies Aquateam – Norwegian Water Technology Centre Report no: 12-039 Project no: O-12074 Project manager: Bjørn Rusten, Dr. ing Co-workers: Gang Xin, PhD Eilen Arctander Vik, PhD Alizada Bruskeland, M.Sc Jon Siljudalen, M.Sc* * Biowater Technology
Transcript
Date: 01.11.2012 Page 1 : 53 Report no: 12-039 Version : 1 Dock.ref: BIOWATER-AQUATEAM REPORT MPR WASTE TO SYSTEM
39
Impact of treating waste from the MPR desalination unit in the water treatment plant of
Nyhamna Results from desktop and bench scale
studies
Aquateam – Norwegian Water Technology Centre
Report no: 12-039
Project no: O-12074
Project manager: Bjørn Rusten, Dr. ing Co-workers: Gang Xin, PhD
Eilen Arctander Vik, PhD Alizada Bruskeland, M.Sc
Jon Siljudalen, M.Sc*
* Biowater Technology
Date: 01.11.2012 Page 2 : 53 Report no: 12-039 Version : 1 Dock.ref: BIOWATER-AQUATEAM REPORT MPR WASTE TO SYSTEM
39
Aquateam RAPPORT P.O.Box. 6875 Rodeløkka Report number: 12-039 0504 Oslo Norway Availability: Restricted Telephon: +47 22 35 81 00 Telefax: +47 22 35 81 10 Tittel Date
Impact of treating MPR waste in the water treatment plant of Nyhamna. Results from desktop and bench scale studies.
01.11.2012
Number of pages
53
Author (s) sign. Responsible sign.
Gang Xin
Bjørn Rusten
Eilen Arctander Vik
Alizada Bruskeland Project number
Jon Siljudalen O-12074
Client (s)
Shell Contact person (s)
Walbert Schulpen
Abstract Summary is given at page 4 and 5
Key word - English Key word - Norwegian
- Biological water treatment - Biologisk rensing - Gas/condensate water - Vann fra gass/kondensat anlegg - MEG desalination wastewater removal - Rensing av avløpsvann fra MEG avsaltning - MBBR technology - MBBR teknologi - Ormen Lange Onshore plant - Ormen Lange Landanlegg
Date: 01.11.2012 Page 3 : 53 Report no: 12-039 Version : 1 Dock.ref: BIOWATER-AQUATEAM REPORT MPR WASTE TO SYSTEM
39
Table of Contents Table of Contents .................................................................................................................. 3 Summary ............................................................................................................................... 4 1. Background .................................................................................................................... 6 2. Nyhamna ........................................................................................................................ 6
2.1. Process description ................................................................................................. 6 2.2. The MEG system .................................................................................................... 7 2.3. The Water treatment plant ....................................................................................... 8
2.3.1. Process description .......................................................................................... 8 2.3.2. Existing discharge permit for system 39 ........................................................... 9 2.3.3. Existing violations of the discharge permit .......................................................10 2.3.4. Historical performance ....................................................................................11
3. Desalination of Nyhamna MEG .....................................................................................14 3.1. The composition of MEG ........................................................................................14 3.2. The MPR Glycolex desalination unit .......................................................................17
3.2.1. The MEG desalination process .......................................................................17 3.2.2. Test results from MPR treatment of Rich and Lean MEG ................................20 3.2.3. Options for handling the wastewater from the MPR unit ..................................22
3.3. MPR waste composition and flow rate ....................................................................22 3.3.1. Risk of H2S production ....................................................................................23 3.3.2. Possibilities for formation of H2S and exposure to workers ..............................24
4. Laboratory study handling the waste in the MBBR system ............................................25 4.1. Materials and methods ...........................................................................................25
4.1.1. Experimental setup .........................................................................................25 4.1.2. Reactor design ................................................................................................27 4.1.3. Chemical stock solutions .................................................................................27 4.1.4. Seeding procedure ..........................................................................................28 4.1.5. Sampling and analysis ....................................................................................28 4.1.6. OUR test setup and operation .........................................................................29
4.2. DAF tests and sludge production............................................................................30 4.2.1. Screening tests ...............................................................................................31
4.3. DAF tests ...............................................................................................................31 4.4. Results and discussions .........................................................................................32
4.4.1. Performance of the water treatment plant........................................................32 4.4.2. Is MPR waste toxic to the biological system at Nyhamna? ..............................39 4.4.3. Real MPR waste vs. synthetic MPR waste ......................................................41 4.4.4. Chemical requirements in DAF ........................................................................43
4.5. Sludge production ..................................................................................................46 4.5.1. Biological sludge .............................................................................................46 4.5.2. Microbial community characteristics in the reactors .........................................47 4.5.3. Chemical sludge ..............................................................................................49
4.6. Toxicity ...................................................................................................................49 5. Conclusions and recommendations for further work ......................................................52 6. References ....................................................................................................................53
Date: 01.11.2012 Page 4 : 53 Report no: 12-039 Version : 1 Dock.ref: BIOWATER-AQUATEAM REPORT MPR WASTE TO SYSTEM
39
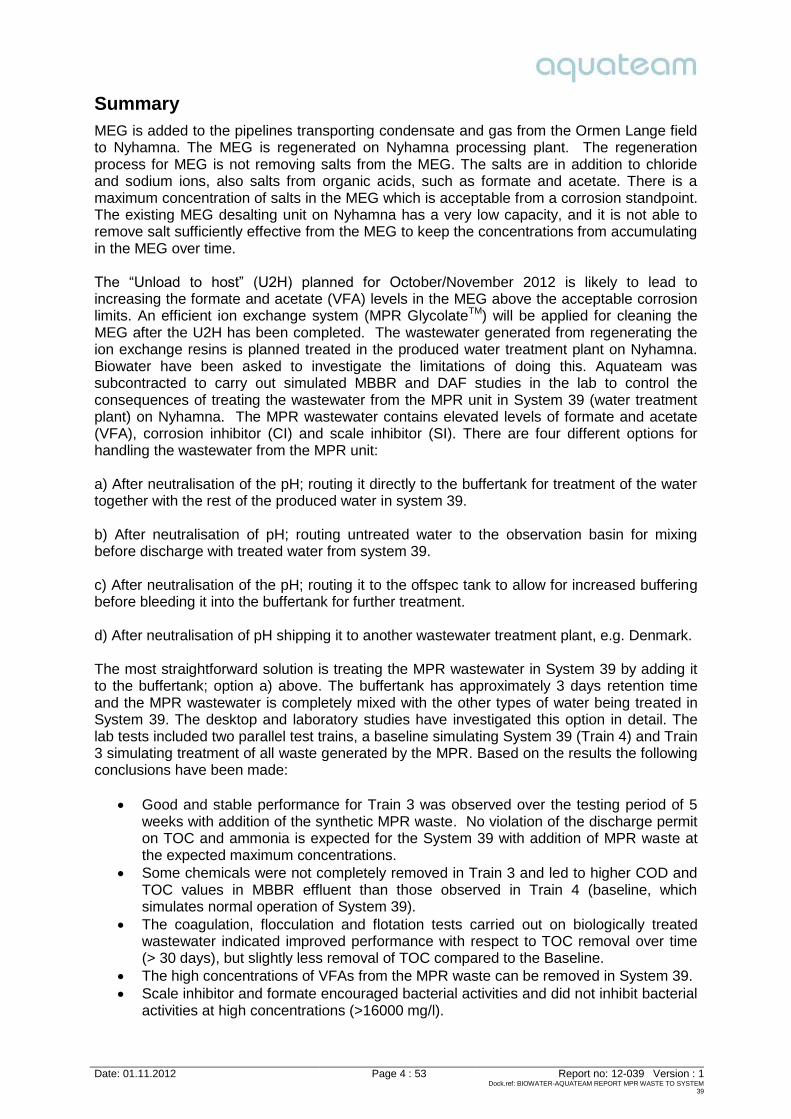
Summary MEG is added to the pipelines transporting condensate and gas from the Ormen Lange field to Nyhamna. The MEG is regenerated on Nyhamna processing plant. The regeneration process for MEG is not removing salts from the MEG. The salts are in addition to chloride and sodium ions, also salts from organic acids, such as formate and acetate. There is a maximum concentration of salts in the MEG which is acceptable from a corrosion standpoint. The existing MEG desalting unit on Nyhamna has a very low capacity, and it is not able to remove salt sufficiently effective from the MEG to keep the concentrations from accumulating in the MEG over time. The “Unload to host” (U2H) planned for October/November 2012 is likely to lead to increasing the formate and acetate (VFA) levels in the MEG above the acceptable corrosion limits. An efficient ion exchange system (MPR GlycolateTM) will be applied for cleaning the MEG after the U2H has been completed. The wastewater generated from regenerating the ion exchange resins is planned treated in the produced water treatment plant on Nyhamna. Biowater have been asked to investigate the limitations of doing this. Aquateam was subcontracted to carry out simulated MBBR and DAF studies in the lab to control the consequences of treating the wastewater from the MPR unit in System 39 (water treatment plant) on Nyhamna. The MPR wastewater contains elevated levels of formate and acetate (VFA), corrosion inhibitor (CI) and scale inhibitor (SI). There are four different options for handling the wastewater from the MPR unit: a) After neutralisation of the pH; routing it directly to the buffertank for treatment of the water together with the rest of the produced water in system 39. b) After neutralisation of pH; routing untreated water to the observation basin for mixing before discharge with treated water from system 39. c) After neutralisation of the pH; routing it to the offspec tank to allow for increased buffering before bleeding it into the buffertank for further treatment. d) After neutralisation of pH shipping it to another wastewater treatment plant, e.g. Denmark. The most straightforward solution is treating the MPR wastewater in System 39 by adding it to the buffertank; option a) above. The buffertank has approximately 3 days retention time and the MPR wastewater is completely mixed with the other types of water being treated in System 39. The desktop and laboratory studies have investigated this option in detail. The lab tests included two parallel test trains, a baseline simulating System 39 (Train 4) and Train 3 simulating treatment of all waste generated by the MPR. Based on the results the following conclusions have been made:
Good and stable performance for Train 3 was observed over the testing period of 5 weeks with addition of the synthetic MPR waste. No violation of the discharge permit on TOC and ammonia is expected for the System 39 with addition of MPR waste at the expected maximum concentrations.
Some chemicals were not completely removed in Train 3 and led to higher COD and TOC values in MBBR effluent than those observed in Train 4 (baseline, which simulates normal operation of System 39).
The coagulation, flocculation and flotation tests carried out on biologically treated wastewater indicated improved performance with respect to TOC removal over time (> 30 days), but slightly less removal of TOC compared to the Baseline.
The high concentrations of VFAs from the MPR waste can be removed in System 39. Scale inhibitor and formate encouraged bacterial activities and did not inhibit bacterial
activities at high concentrations (>16000 mg/l).
Date: 01.11.2012 Page 5 : 53 Report no: 12-039 Version : 1 Dock.ref: BIOWATER-AQUATEAM REPORT MPR WASTE TO SYSTEM
39
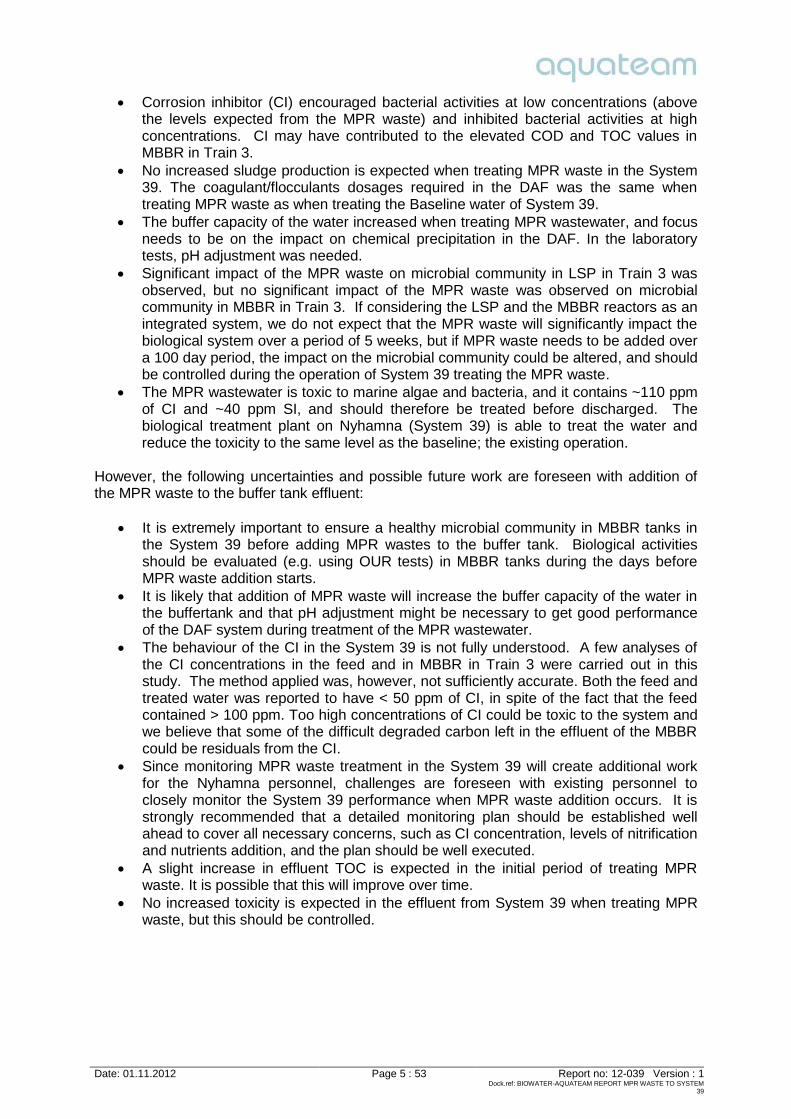
Corrosion inhibitor (CI) encouraged bacterial activities at low concentrations (above the levels expected from the MPR waste) and inhibited bacterial activities at high concentrations. CI may have contributed to the elevated COD and TOC values in MBBR in Train 3.
No increased sludge production is expected when treating MPR waste in the System 39. The coagulant/flocculants dosages required in the DAF was the same when treating MPR waste as when treating the Baseline water of System 39.
The buffer capacity of the water increased when treating MPR wastewater, and focus needs to be on the impact on chemical precipitation in the DAF. In the laboratory tests, pH adjustment was needed.
Significant impact of the MPR waste on microbial community in LSP in Train 3 was observed, but no significant impact of the MPR waste was observed on microbial community in MBBR in Train 3. If considering the LSP and the MBBR reactors as an integrated system, we do not expect that the MPR waste will significantly impact the biological system over a period of 5 weeks, but if MPR waste needs to be added over a 100 day period, the impact on the microbial community could be altered, and should be controlled during the operation of System 39 treating the MPR waste.
The MPR wastewater is toxic to marine algae and bacteria, and it contains ~110 ppm of CI and ~40 ppm SI, and should therefore be treated before discharged. The biological treatment plant on Nyhamna (System 39) is able to treat the water and reduce the toxicity to the same level as the baseline; the existing operation.
However, the following uncertainties and possible future work are foreseen with addition of the MPR waste to the buffer tank effluent:
It is extremely important to ensure a healthy microbial community in MBBR tanks in the System 39 before adding MPR wastes to the buffer tank. Biological activities should be evaluated (e.g. using OUR tests) in MBBR tanks during the days before MPR waste addition starts.
It is likely that addition of MPR waste will increase the buffer capacity of the water in the buffertank and that pH adjustment might be necessary to get good performance of the DAF system during treatment of the MPR wastewater.
The behaviour of the CI in the System 39 is not fully understood. A few analyses of the CI concentrations in the feed and in MBBR in Train 3 were carried out in this study. The method applied was, however, not sufficiently accurate. Both the feed and treated water was reported to have < 50 ppm of CI, in spite of the fact that the feed contained > 100 ppm. Too high concentrations of CI could be toxic to the system and we believe that some of the difficult degraded carbon left in the effluent of the MBBR could be residuals from the CI.
Since monitoring MPR waste treatment in the System 39 will create additional work for the Nyhamna personnel, challenges are foreseen with existing personnel to closely monitor the System 39 performance when MPR waste addition occurs. It is strongly recommended that a detailed monitoring plan should be established well ahead to cover all necessary concerns, such as CI concentration, levels of nitrification and nutrients addition, and the plan should be well executed.
A slight increase in effluent TOC is expected in the initial period of treating MPR waste. It is possible that this will improve over time.
No increased toxicity is expected in the effluent from System 39 when treating MPR waste, but this should be controlled.
Date: 01.11.2012 Page 6 : 53 Report no: 12-039 Version : 1 Dock.ref: BIOWATER-AQUATEAM REPORT MPR WASTE TO SYSTEM
39
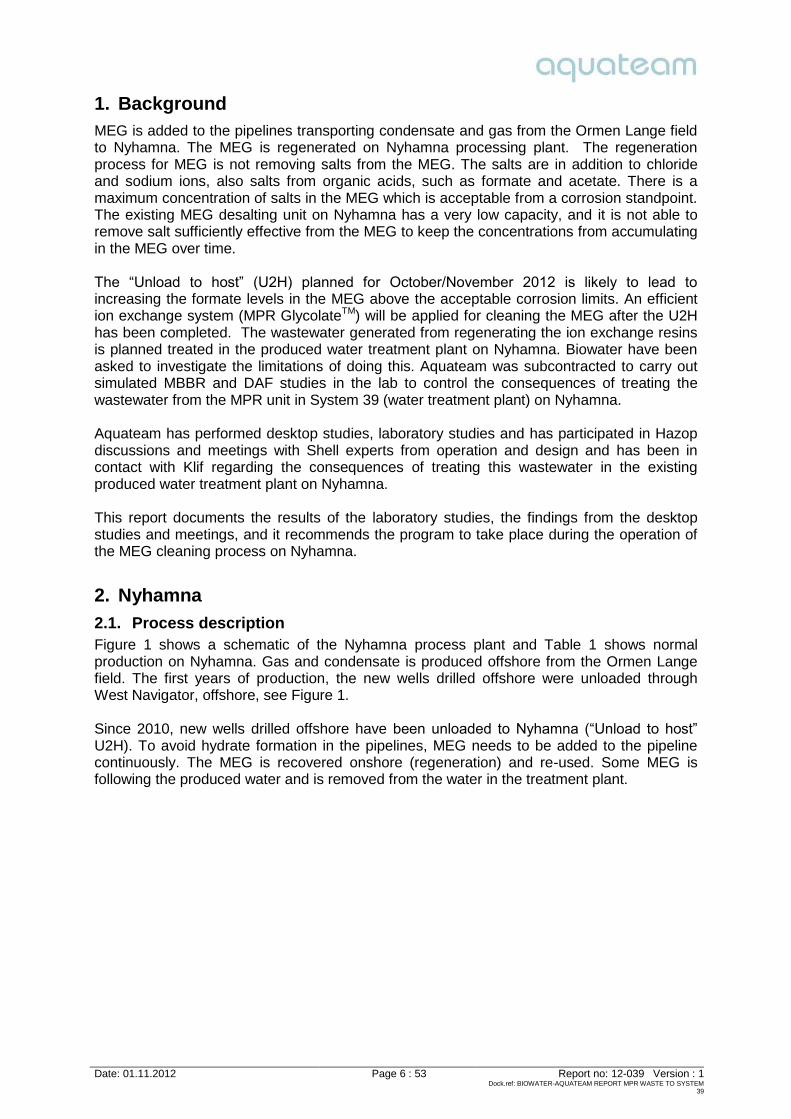
1. Background MEG is added to the pipelines transporting condensate and gas from the Ormen Lange field to Nyhamna. The MEG is regenerated on Nyhamna processing plant. The regeneration process for MEG is not removing salts from the MEG. The salts are in addition to chloride and sodium ions, also salts from organic acids, such as formate and acetate. There is a maximum concentration of salts in the MEG which is acceptable from a corrosion standpoint. The existing MEG desalting unit on Nyhamna has a very low capacity, and it is not able to remove salt sufficiently effective from the MEG to keep the concentrations from accumulating in the MEG over time. The “Unload to host” (U2H) planned for October/November 2012 is likely to lead to increasing the formate levels in the MEG above the acceptable corrosion limits. An efficient ion exchange system (MPR GlycolateTM) will be applied for cleaning the MEG after the U2H has been completed. The wastewater generated from regenerating the ion exchange resins is planned treated in the produced water treatment plant on Nyhamna. Biowater have been asked to investigate the limitations of doing this. Aquateam was subcontracted to carry out simulated MBBR and DAF studies in the lab to control the consequences of treating the wastewater from the MPR unit in System 39 (water treatment plant) on Nyhamna. Aquateam has performed desktop studies, laboratory studies and has participated in Hazop discussions and meetings with Shell experts from operation and design and has been in contact with Klif regarding the consequences of treating this wastewater in the existing produced water treatment plant on Nyhamna. This report documents the results of the laboratory studies, the findings from the desktop studies and meetings, and it recommends the program to take place during the operation of the MEG cleaning process on Nyhamna.
2. Nyhamna
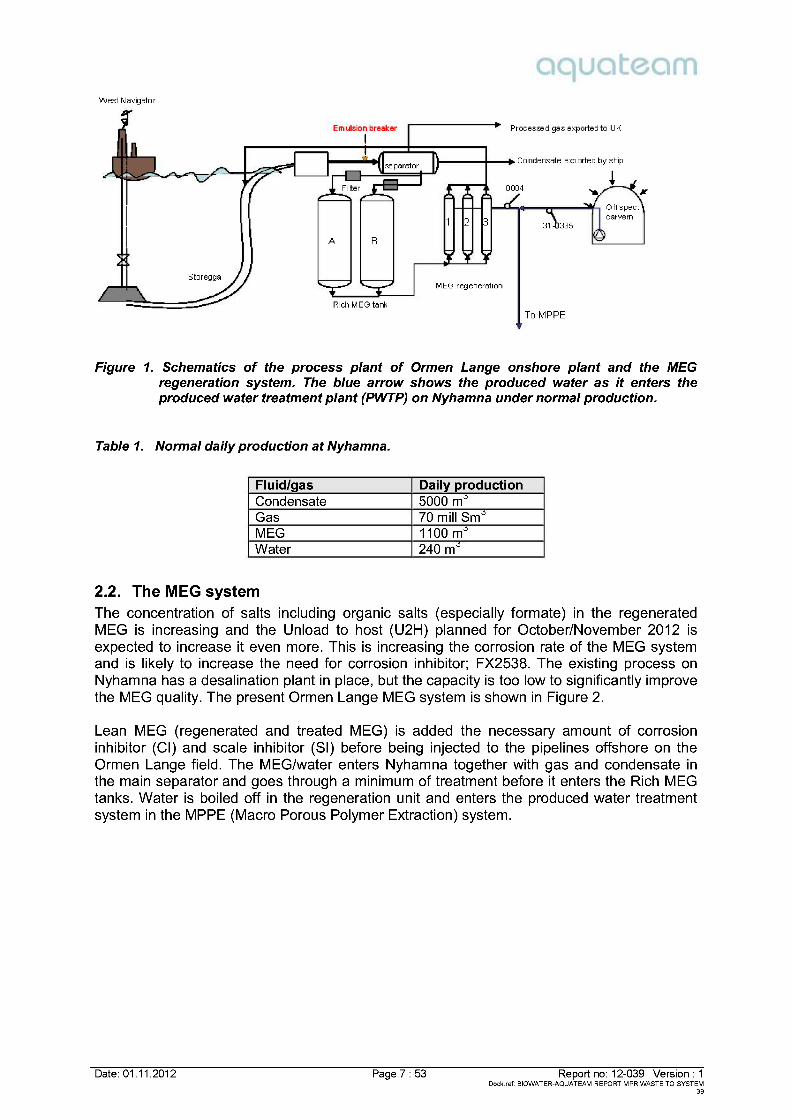
2.1. Process description Figure 1 shows a schematic of the Nyhamna process plant and Table 1 shows normal production on Nyhamna. Gas and condensate is produced offshore from the Ormen Lange field. The first years of production, the new wells drilled offshore were unloaded through West Navigator, offshore, see Figure 1. Since 2010, new wells drilled offshore have been unloaded to Nyhamna (“Unload to host” U2H). To avoid hydrate formation in the pipelines, MEG needs to be added to the pipeline continuously. The MEG is recovered onshore (regeneration) and re-used. Some MEG is following the produced water and is removed from the water in the treatment plant.
Date: 01.11.2012 Page 7 : 53 Report no: 12-039 Version : 1Dock.ref: BIOWATER-AQUATEAM REPORT MPR WASTE TO SYSTEM
39
Figure 1. Schematics of the process plant of Ormen Lange onshore plant and the MEGregeneration system . The blue arrow shows the produced water as it enters theproduced water treatment plant (PWTP) on Nyhamna under normal production .
Table 1. Normal daily production at Nyhamna .
Fluid/gas Daily productionCondensate 5000 m3
Gas 70 mill Sm3
MEG 1100 m3
Water 240 m3
2.2. The MEG systemThe concentration of salts including organic salts (especially formate) in the regeneratedMEG is increasing and the Unload to host (U2H) planned for October/November 2012 isexpected to increase it even more. This is increasing the corrosion rate of the MEG systemand is likely to increase the need for corrosion inhibitor; FX2538. The existing process onNyhamna has a desalination plant in place, but the capacity is too low to significantly improvethe MEG quality. The present Ormen Lange MEG system is shown in Figure 2.
Lean MEG (regenerated and treated MEG) is added the necessary amount of corrosioninhibitor (CI) and scale inhibitor (SI) before being injected to the pipelines offshore on theOrmen Lange field. The MEG/water enters Nyhamna together with gas and condensate inthe main separator and goes through a minimum of treatment before it enters the Rich MEGtanks. Water is boiled off in the regeneration unit and enters the produced water treatmentsystem in the MPPE (Macro Porous Polymer Extraction) system.
Date: 01.11.2012 Page 8 : 53 Report no: 12-039 Version : 1 Dock.ref: BIOWATER-AQUATEAM REPORT MPR WASTE TO SYSTEM
39
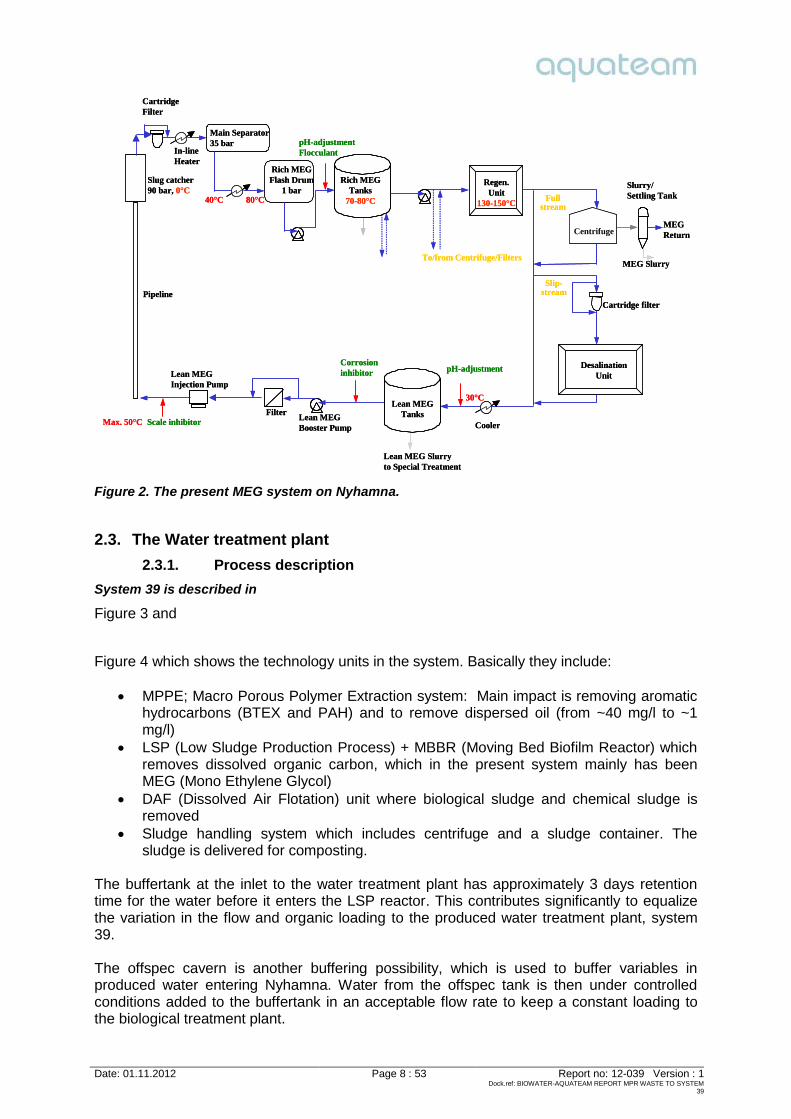
Figure 2. The present MEG system on Nyhamna.
2.3. The Water treatment plant
2.3.1. Process description
System 39 is described in
Figure 3 and
Figure 4 which shows the technology units in the system. Basically they include:
MPPE; Macro Porous Polymer Extraction system: Main impact is removing aromatic hydrocarbons (BTEX and PAH) and to remove dispersed oil (from ~40 mg/l to ~1 mg/l)
LSP (Low Sludge Production Process) + MBBR (Moving Bed Biofilm Reactor) which removes dissolved organic carbon, which in the present system mainly has been MEG (Mono Ethylene Glycol)
DAF (Dissolved Air Flotation) unit where biological sludge and chemical sludge is removed
Sludge handling system which includes centrifuge and a sludge container. The sludge is delivered for composting.
The buffertank at the inlet to the water treatment plant has approximately 3 days retention time for the water before it enters the LSP reactor. This contributes significantly to equalize the variation in the flow and organic loading to the produced water treatment plant, system 39. The offspec cavern is another buffering possibility, which is used to buffer variables in produced water entering Nyhamna. Water from the offspec tank is then under controlled conditions added to the buffertank in an acceptable flow rate to keep a constant loading to the biological treatment plant.
Main Separator35 bar
CartridgeFilter
Rich MEGTanks
70-80°C
Regen.Unit
130-150°C
Centrifuge
Slurry/Settling Tank
pH-adjustment
Lean MEGTanks
Lean MEG Slurryto Special Treatment
pH-adjustmentFlocculant
Cartridge filter
DesalinationUnit
MEG Slurry
MEGReturn
80°C
To/from Centrifuge/Filters
Rich MEGFlash Drum
1 bar
In-line Heater
Lean MEGBooster Pump
Lean MEGInjection Pump
Filter
Corrosion inhibitor
Cooler
40°C
30°C
Max. 50°C
Full stream
Slip-stream
Scale inhibitor
Pipeline
Slug catcher90 bar, 0°C
Date: 01.11.2012 Page 9 : 53 Report no: 12-039 Version : 1Dock.ref: BIOWATER-AQUATEAM REPORT MPR WASTE TO SYSTEM
39
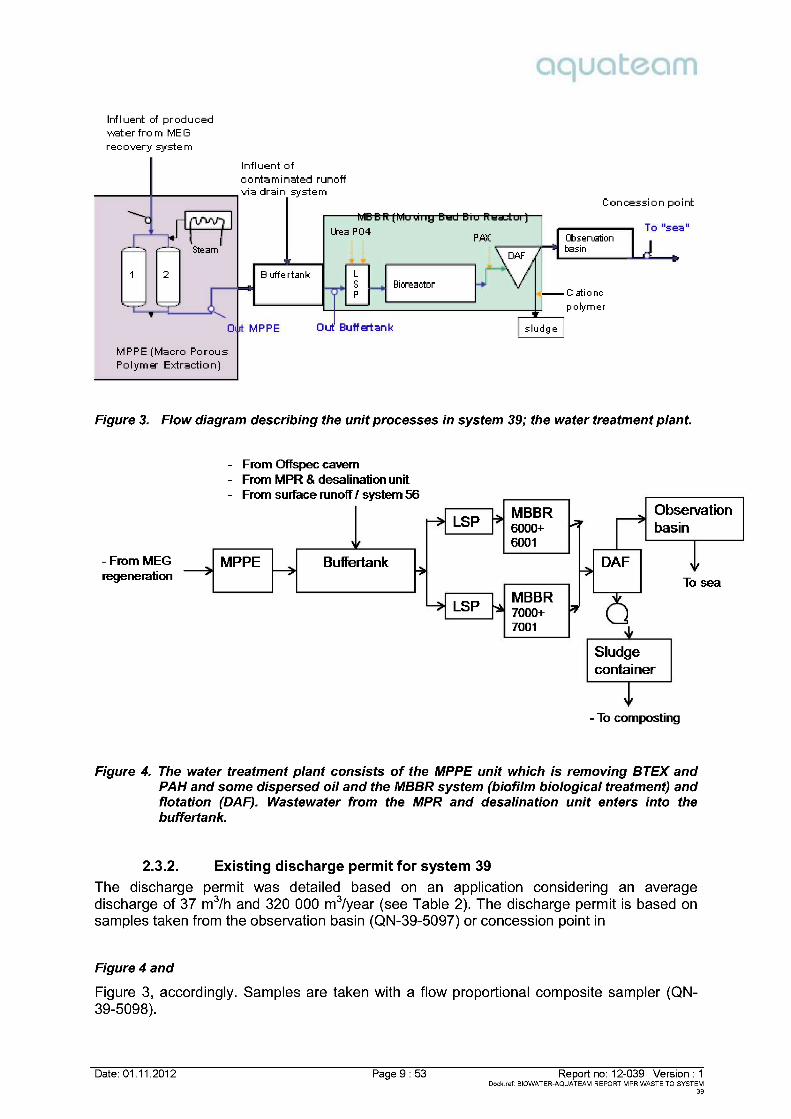
Figure 3. Flow diagram describing the unit processes in system 39; the water treatment plant.
Figure 4. The water treatment plant consists of the MPPE unit which is removing BTEX andPAH and some dispersed oil and the MBBR system (biofil m biological treatment) andflo tation (DAF). Wastewater from the MPR and desalination unit enters into thebuffertank.
2.3.2. Existing discharge permit for system 39The discharge permit was detailed based on an application considering an averagedischarge of 37 m3/h and 320 000 m3/year (see Table 2). The discharge permit is based onsamples taken from the observation basin (QN-39-5097) or concession point in
Figure 4 and
Figure 3, accordingly. Samples are taken with a flow proportional composite sampler (QN-39-5098).
Date: 01.11.2012 Page 10 : 53 Report no: 12-039 Version : 1 Dock.ref: BIOWATER-AQUATEAM REPORT MPR WASTE TO SYSTEM
39
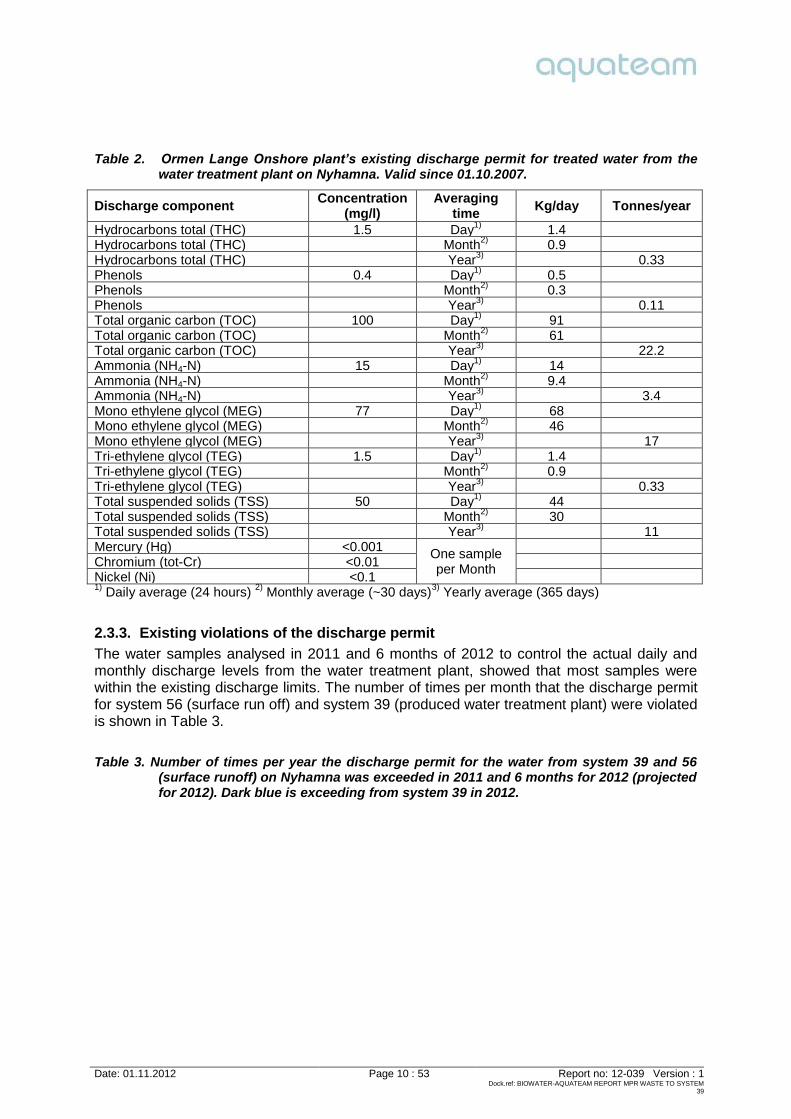
Table 2. Ormen Lange Onshore plant’s existing discharge permit for treated water from the water treatment plant on Nyhamna. Valid since 01.10.2007.
Chromium (tot-Cr) <0.01 Nickel (Ni) <0.1 1) Daily average (24 hours) 2) Monthly average (~30 days)3) Yearly average (365 days)
2.3.3. Existing violations of the discharge permit
The water samples analysed in 2011 and 6 months of 2012 to control the actual daily and monthly discharge levels from the water treatment plant, showed that most samples were within the existing discharge limits. The number of times per month that the discharge permit for system 56 (surface run off) and system 39 (produced water treatment plant) were violated is shown in Table 3.
Table 3. Number of times per year the discharge permit for the water from system 39 and 56 (surface runoff) on Nyhamna was exceeded in 2011 and 6 months for 2012 (projected for 2012). Dark blue is exceeding from system 39 in 2012.
Date: 01.11.2012 Page 11 : 53 Report no: 12-039 Version : 1Dock.ref: BIOWATER-AQUATEAM REPORT MPR WASTE TO SYSTEM
39
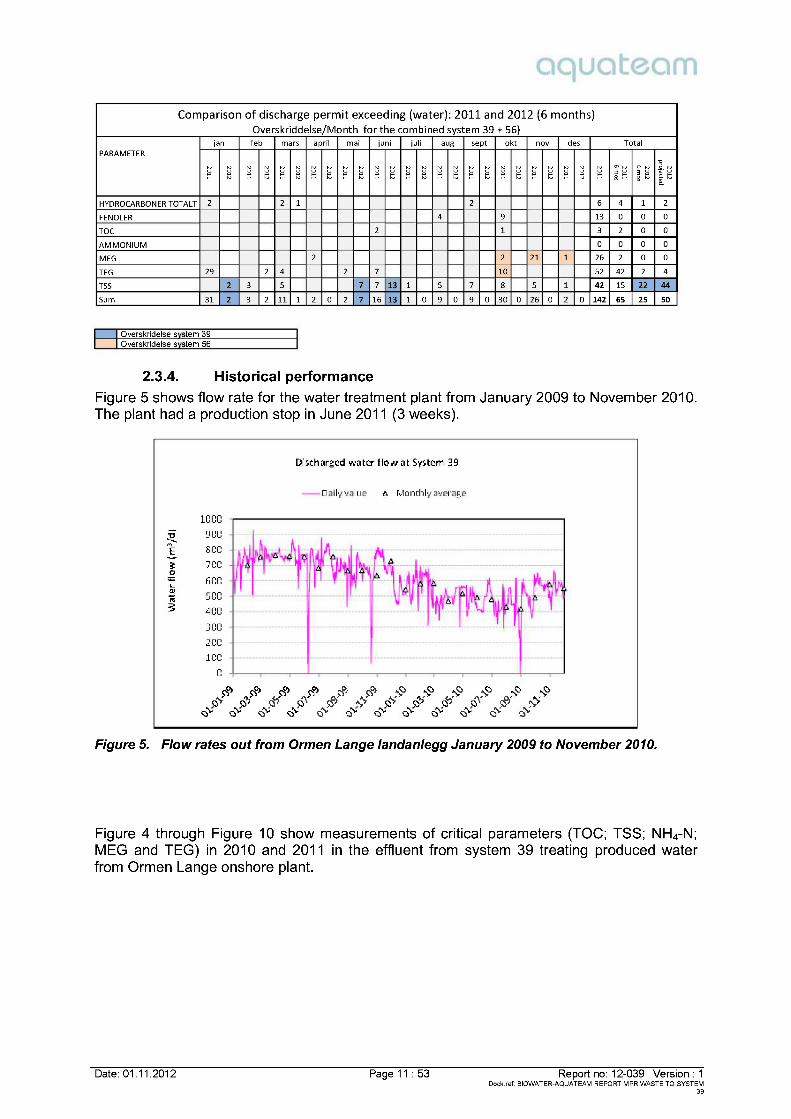
2.3.4. Historical performanceFigure 5 shows flow rate for the water treatment plant from January 2009 to November 2010.The plant had a production stop in June 2011 (3 weeks).
Figu re 5. Flow rates out from Ormen Lange landanlegg January 2009 to November 2010.
Figure 4 through Figure 10 show measurements of critical parameters (TOC; TSS; NH4-N;MEG and TEG) in 2010 and 2011 in the effluent from system 39 treating produced waterfrom Ormen Lange onshore plant.
Comparisonof dischargepermit exceeding (water): 2011and 2012(6 months)Overskriddelse/Monthfor the combined system39+56)
PARAMETERjan feb mars april mai juni juli aug sept okt nov des Total
Date: 01.11.2012 Page 12 : 53 Report no: 12-039 Version : 1Dock.ref: BIOWATER-AQUATEAM REPORT MPR WASTE TO SYSTEM
39
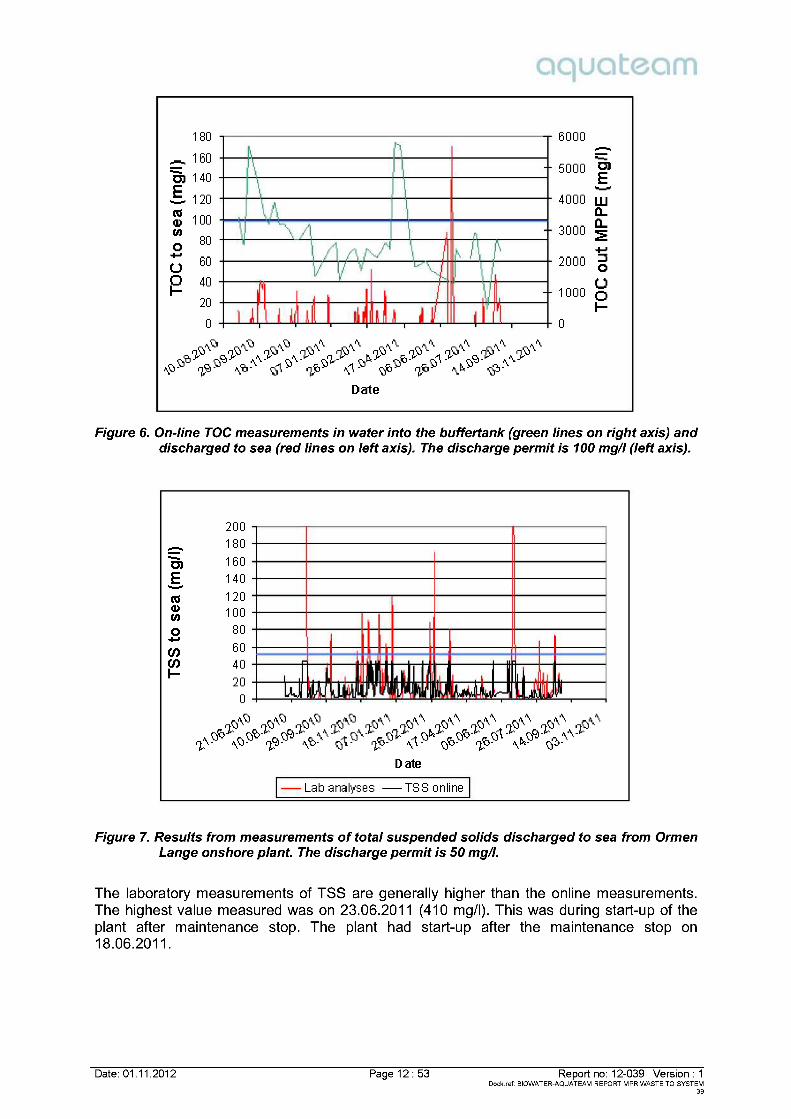
Figure 6. On-line TOC measurements in water into the buffertank (green lines on right axis) anddischarged to sea (red lines on left axis). The discharge permit is 100 mg/l (left axis).
Figure 7. Results from measurements of total suspended solids discharged to sea from OrmenLange onshore plant . The discharge permit is 50 mg/l.
The laboratory measurements of TSS are generally higher than the online measurements.The highest value measured was on 23.06.2011 (410 mg/l). This was during start-up of theplant after maintenance stop. The plant had start-up after the maintenance stop on18.06.2011.
Date: 01.11.2012 Page 13 : 53 Report no: 12-039 Version : 1Dock.ref: BIOWATER-AQUATEAM REPORT MPR WASTE TO SYSTEM
39
Figure 8. Results of ammonia (NH4-N) measurements (August 2009 to September 2011) out ofsystem 39 Ormen Lange onshore plant . The discharge permit is 15 mg/l. Ammoniaconcentrations are given as mg N/l in the figure.
Figure 9. MEG concentrations in effluent water. The discharge permit is 77 mg/l.
0
5
10
15
20
25
MEG(mg/l)
Date
MEG (39-5098)
Date: 01.11.2012 Page 14 : 53 Report no: 12-039 Version : 1Dock.ref: BIOWATER-AQUATEAM REPORT MPR WASTE TO SYSTEM
39
Figure 10. TEG concentrations in discharge water. The discharge permit is 1.5 mg/l.
3. Desalination of Nyhamna MEG3.1. The compositi on of MEG
00
100
200
300
400
500
600
700
800
900
1000
Organicsaltconcentration(mg/l)
Rich MEG
Acetate, H3CCOO- Formate, HCOO-
Date: 01.11.2012 Page 15 : 53 Report no: 12-039 Version : 1 Dock.ref: BIOWATER-AQUATEAM REPORT MPR WASTE TO SYSTEM
39
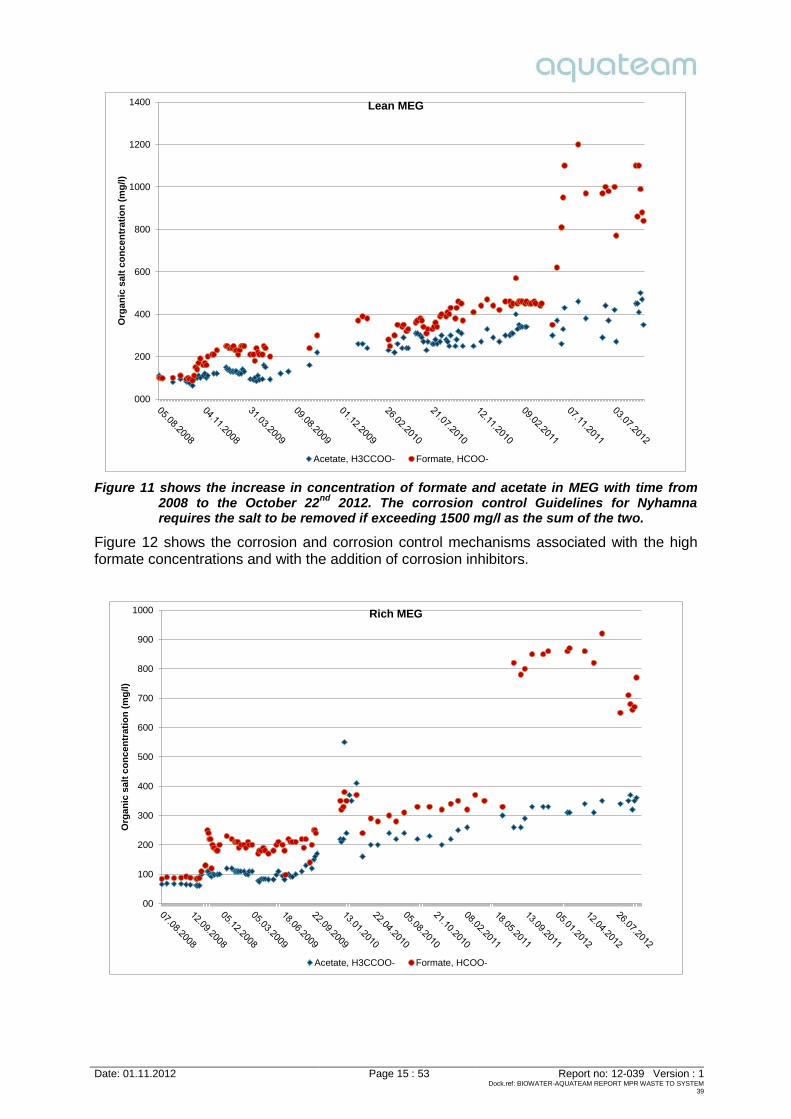
Figure 11 shows the increase in concentration of formate and acetate in MEG with time from 2008 to the October 22nd 2012. The corrosion control Guidelines for Nyhamna requires the salt to be removed if exceeding 1500 mg/l as the sum of the two.
Figure 12 shows the corrosion and corrosion control mechanisms associated with the high formate concentrations and with the addition of corrosion inhibitors.
000
200
400
600
800
1000
1200
1400
Org
an
ic s
alt
co
nce
ntr
ati
on
(m
g/l)
Lean MEG
Acetate, H3CCOO- Formate, HCOO-
00
100
200
300
400
500
600
700
800
900
1000
Org
an
ic s
alt
co
nce
ntr
ati
on
(m
g/l)
Rich MEG
Acetate, H3CCOO- Formate, HCOO-
Date: 01.11.2012 Page 16 : 53 Report no: 12-039 Version : 1Dock.ref: BIOWATER-AQUATEAM REPORT MPR WASTE TO SYSTEM
39
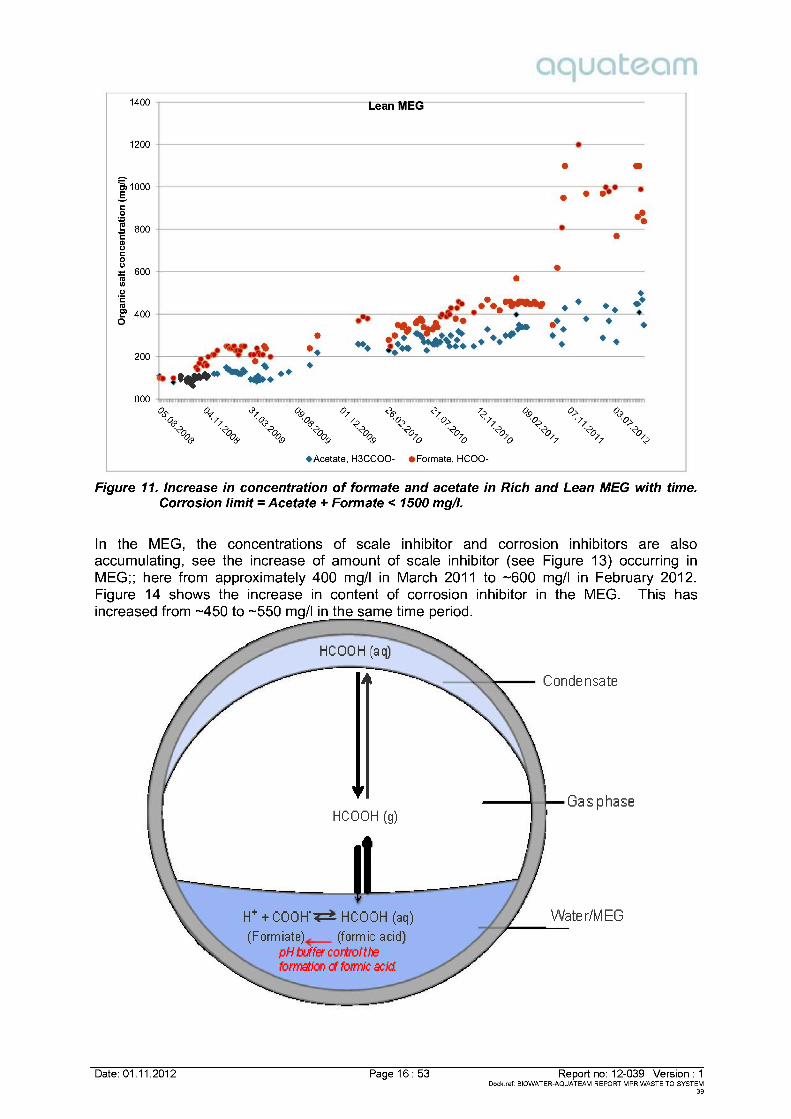
Figure 11. Increase in concentration of formate and acetate in Rich and Lean MEG with time .Corrosion limit = Acetate + Formate < 1500 mg/l.
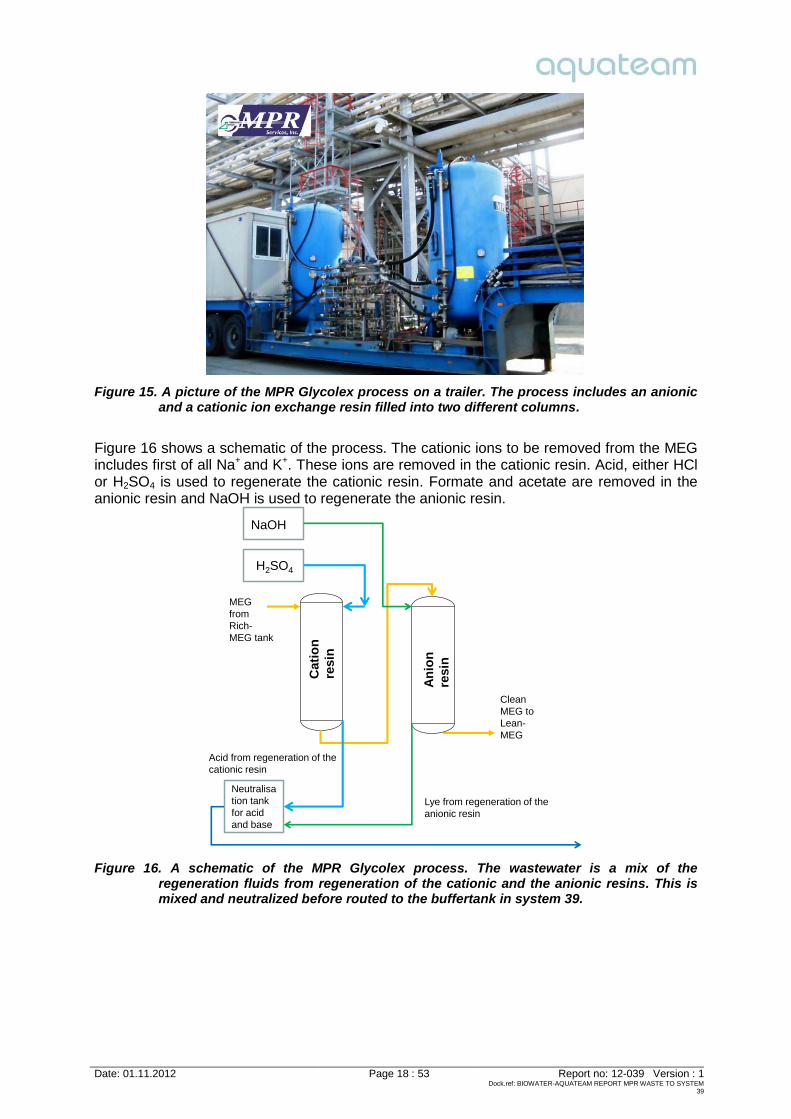
In the MEG, the concentrations of scale inhibitor and corrosion inhibitors are alsoaccumulating, see the increase of amount of scale inhibitor (see Figure 13) occurring inMEG;; here from approximately 400 mg/l in March 2011 to ~600 mg/l in February 2012.Figure 14 shows the increase in content of corrosion inhibitor in the MEG. This hasincreased from ~450 to ~550 mg/l in the same time period.
000
200
400
600
800
1000
1200
1400
Organicsaltconcentration(mg/l)
Lean MEG
Acetate, H3CCOO- Formate, HCOO-
Date: 01.11.2012 Page 17 : 53 Report no: 12-039 Version : 1 Dock.ref: BIOWATER-AQUATEAM REPORT MPR WASTE TO SYSTEM
39
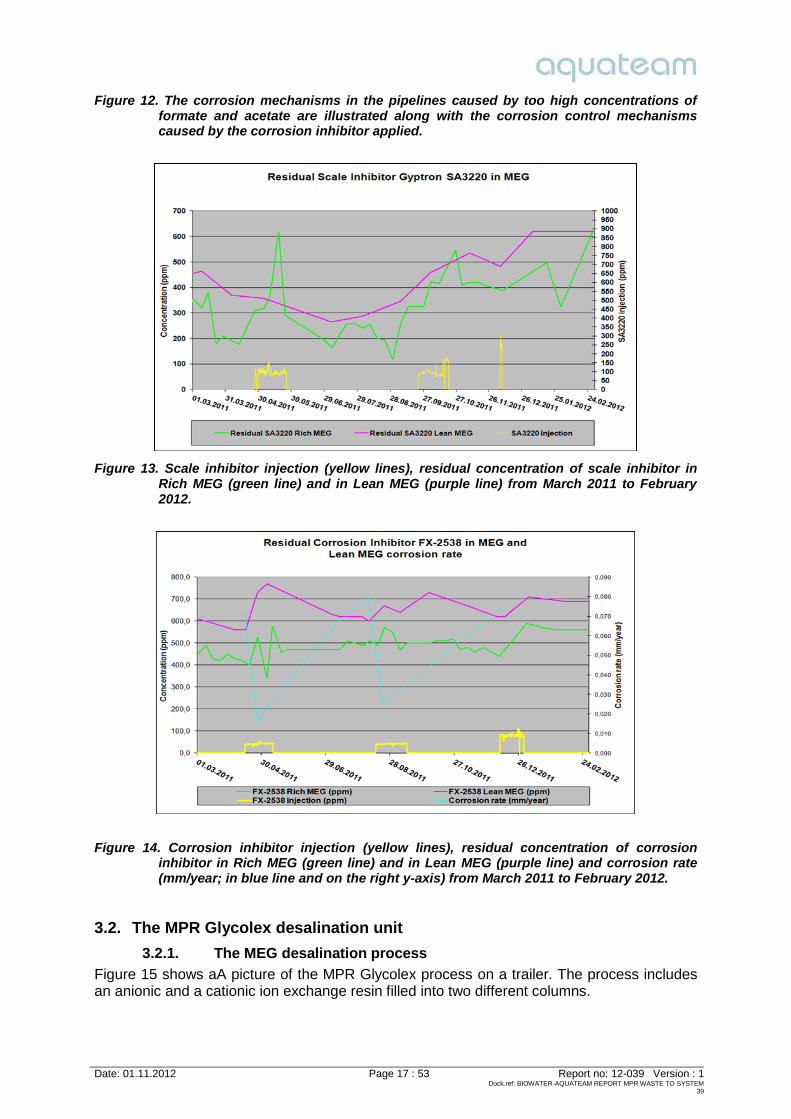
Figure 12. The corrosion mechanisms in the pipelines caused by too high concentrations of formate and acetate are illustrated along with the corrosion control mechanisms caused by the corrosion inhibitor applied.
Figure 13. Scale inhibitor injection (yellow lines), residual concentration of scale inhibitor in Rich MEG (green line) and in Lean MEG (purple line) from March 2011 to February 2012.
Figure 14. Corrosion inhibitor injection (yellow lines), residual concentration of corrosion inhibitor in Rich MEG (green line) and in Lean MEG (purple line) and corrosion rate (mm/year; in blue line and on the right y-axis) from March 2011 to February 2012.
3.2. The MPR Glycolex desalination unit
3.2.1. The MEG desalination process
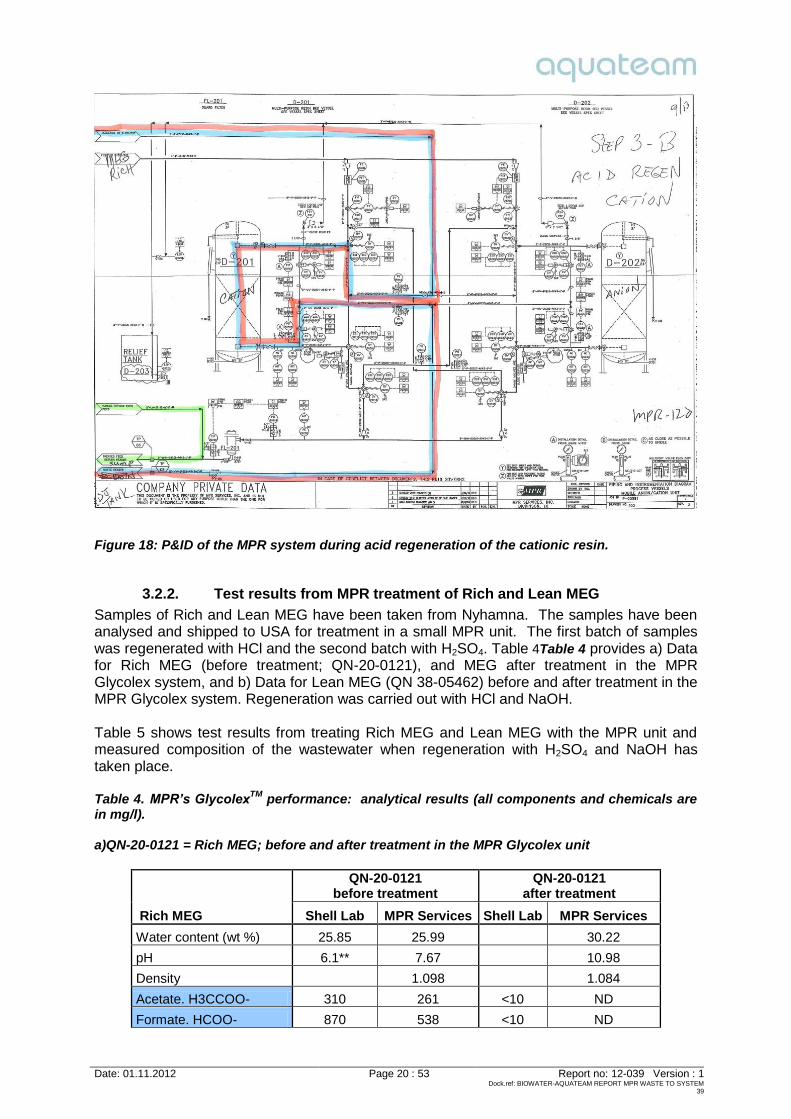
Figure 15 shows aA picture of the MPR Glycolex process on a trailer. The process includes an anionic and a cationic ion exchange resin filled into two different columns.
Date: 01.11.2012 Page 18 : 53 Report no: 12-039 Version : 1 Dock.ref: BIOWATER-AQUATEAM REPORT MPR WASTE TO SYSTEM
39
Figure 15. A picture of the MPR Glycolex process on a trailer. The process includes an anionic and a cationic ion exchange resin filled into two different columns.
Figure 16 shows a schematic of the process. The cationic ions to be removed from the MEG includes first of all Na+ and K+. These ions are removed in the cationic resin. Acid, either HCl or H2SO4 is used to regenerate the cationic resin. Formate and acetate are removed in the anionic resin and NaOH is used to regenerate the anionic resin.
Figure 16. A schematic of the MPR Glycolex process. The wastewater is a mix of the regeneration fluids from regeneration of the cationic and the anionic resins. This is mixed and neutralized before routed to the buffertank in system 39.
MEG from Rich-MEG tank
Cat
ion
resi
n
An
ion
re
sin
CleanMEG to Lean-MEG
NaOH
H2SO4
Acid from regeneration of thecationic resin
Lye from regeneration of theanionic resin
Neutralisation tank for acid and base
Date: 01.11.2012 Page 19 : 53 Report no: 12-039 Version : 1 Dock.ref: BIOWATER-AQUATEAM REPORT MPR WASTE TO SYSTEM
39
Figure 17. P&ID of the MPR plant during normal MEG desalination operational mode.
The P&ID for normal operation for MEG desalination is shown in Figure 17 and the P&ID for regeneration is shown in Figure 18. Wastewater is generated during the regeneration process, and the regeneration fluid is collected in a tank where neutralization of the fluid to an acceptable pH for further processing is carried out. This water needs to be handled on Nyhamna or shipped for handling outside the plant.
Date: 01.11.2012 Page 20 : 53 Report no: 12-039 Version : 1 Dock.ref: BIOWATER-AQUATEAM REPORT MPR WASTE TO SYSTEM
39
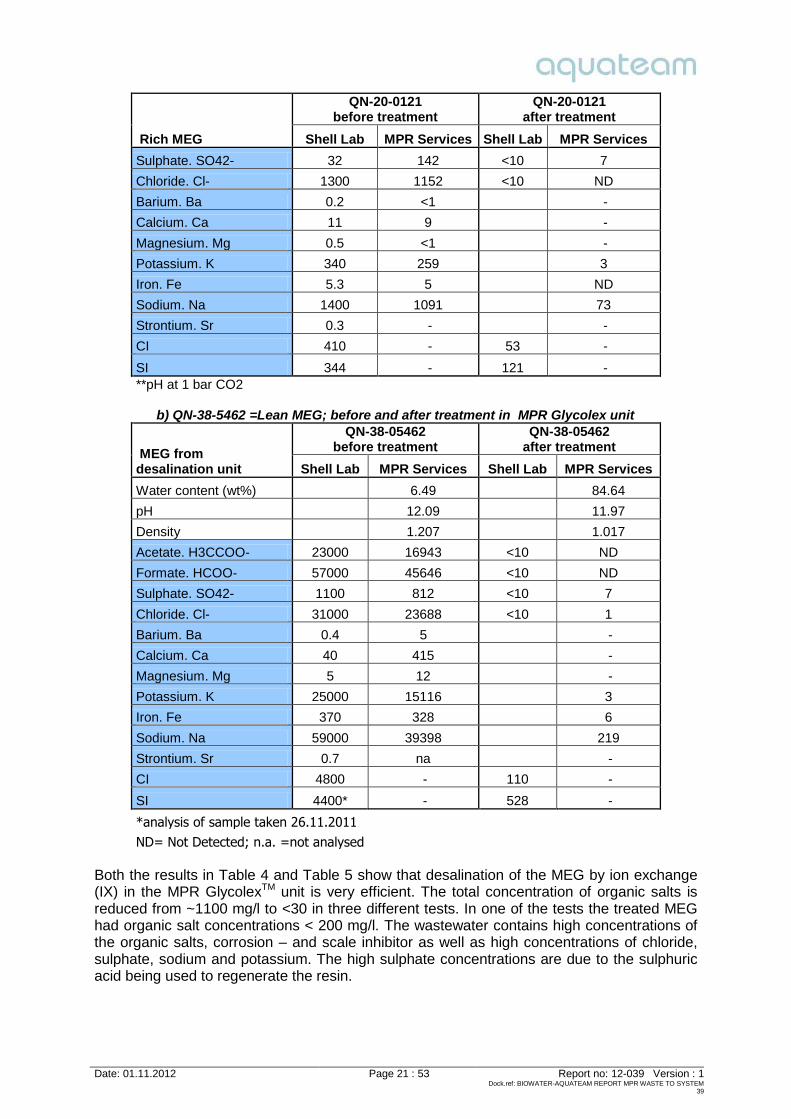
Figure 18: P&ID of the MPR system during acid regeneration of the cationic resin.
3.2.2. Test results from MPR treatment of Rich and Lean MEG
Samples of Rich and Lean MEG have been taken from Nyhamna. The samples have been analysed and shipped to USA for treatment in a small MPR unit. The first batch of samples was regenerated with HCl and the second batch with H2SO4. Table 4Table 4 provides a) Data for Rich MEG (before treatment; QN-20-0121), and MEG after treatment in the MPR Glycolex system, and b) Data for Lean MEG (QN 38-05462) before and after treatment in the MPR Glycolex system. Regeneration was carried out with HCl and NaOH. Table 5 shows test results from treating Rich MEG and Lean MEG with the MPR unit and measured composition of the wastewater when regeneration with H2SO4 and NaOH has taken place. Table 4. MPR’s Glycolex
TM performance: analytical results (all components and chemicals are in mg/l). a)QN-20-0121 = Rich MEG; before and after treatment in the MPR Glycolex unit
Rich MEG
QN-20-0121 before treatment
QN-20-0121 after treatment
Shell Lab MPR Services Shell Lab MPR Services
Water content (wt %) 25.85 25.99 30.22
pH 6.1** 7.67 10.98
Density 1.098 1.084
Acetate. H3CCOO- 310 261 <10 ND
Formate. HCOO- 870 538 <10 ND
Date: 01.11.2012 Page 21 : 53 Report no: 12-039 Version : 1 Dock.ref: BIOWATER-AQUATEAM REPORT MPR WASTE TO SYSTEM
39
Rich MEG
QN-20-0121 before treatment
QN-20-0121 after treatment
Shell Lab MPR Services Shell Lab MPR Services
Sulphate. SO42- 32 142 <10 7
Chloride. Cl- 1300 1152 <10 ND
Barium. Ba 0.2 <1 -
Calcium. Ca 11 9 -
Magnesium. Mg 0.5 <1 -
Potassium. K 340 259 3
Iron. Fe 5.3 5 ND
Sodium. Na 1400 1091 73
Strontium. Sr 0.3 - -
CI 410 - 53 -
SI 344 - 121 - **pH at 1 bar CO2
b) QN-38-5462 =Lean MEG; before and after treatment in MPR Glycolex unit
MEG from desalination unit
QN-38-05462 before treatment
QN-38-05462 after treatment
Shell Lab MPR Services Shell Lab MPR Services
Water content (wt%) 6.49 84.64
pH 12.09 11.97
Density 1.207 1.017
Acetate. H3CCOO- 23000 16943 <10 ND
Formate. HCOO- 57000 45646 <10 ND
Sulphate. SO42- 1100 812 <10 7
Chloride. Cl- 31000 23688 <10 1
Barium. Ba 0.4 5 -
Calcium. Ca 40 415 -
Magnesium. Mg 5 12 -
Potassium. K 25000 15116 3
Iron. Fe 370 328 6
Sodium. Na 59000 39398 219
Strontium. Sr 0.7 na -
CI 4800 - 110 -
SI 4400* - 528 -
*analysis of sample taken 26.11.2011 ND= Not Detected; n.a. =not analysed
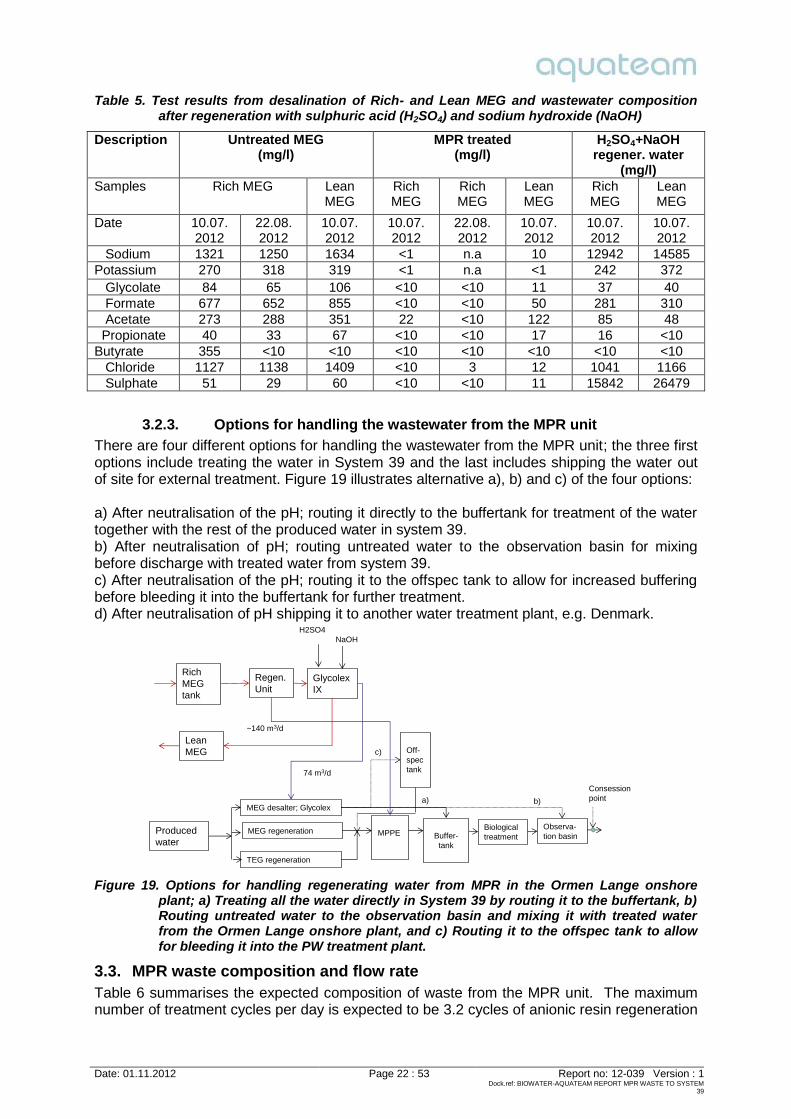
Both the results in Table 4 and Table 5 show that desalination of the MEG by ion exchange (IX) in the MPR GlycolexTM unit is very efficient. The total concentration of organic salts is reduced from ~1100 mg/l to <30 in three different tests. In one of the tests the treated MEG had organic salt concentrations < 200 mg/l. The wastewater contains high concentrations of the organic salts, corrosion – and scale inhibitor as well as high concentrations of chloride, sulphate, sodium and potassium. The high sulphate concentrations are due to the sulphuric acid being used to regenerate the resin.
Date: 01.11.2012 Page 22 : 53 Report no: 12-039 Version : 1 Dock.ref: BIOWATER-AQUATEAM REPORT MPR WASTE TO SYSTEM
39
Table 5. Test results from desalination of Rich- and Lean MEG and wastewater composition after regeneration with sulphuric acid (H2SO4) and sodium hydroxide (NaOH)
3.2.3. Options for handling the wastewater from the MPR unit
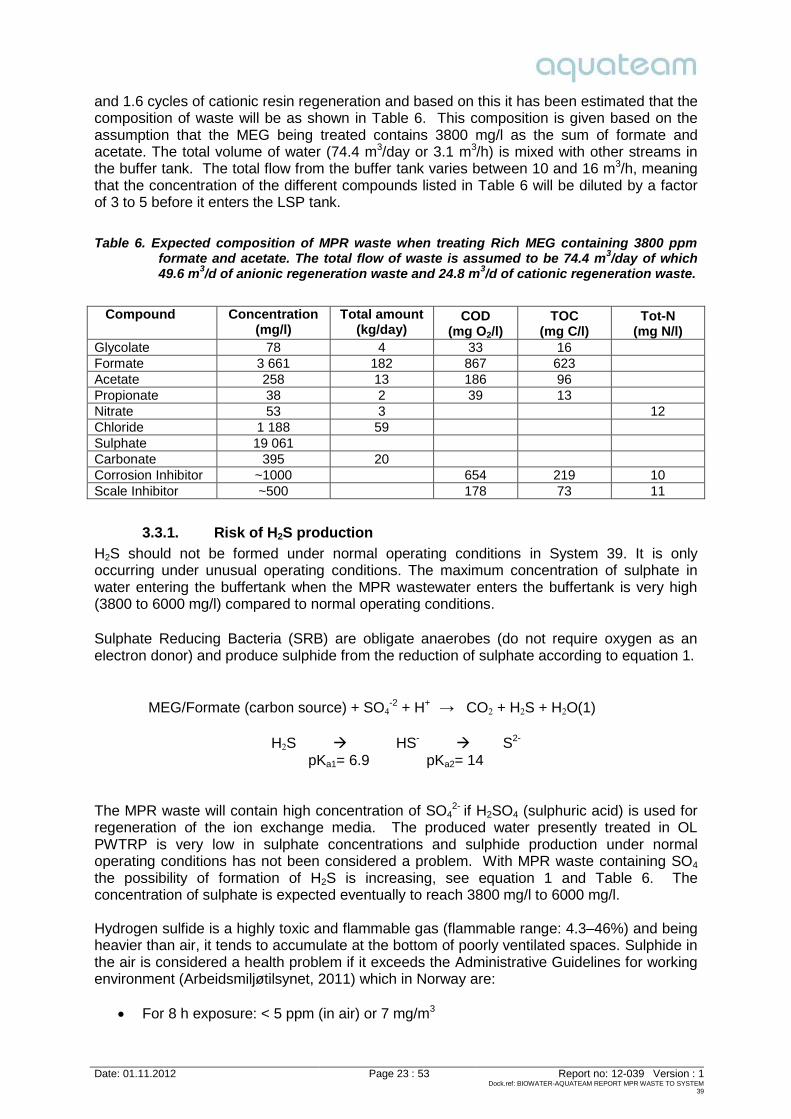
There are four different options for handling the wastewater from the MPR unit; the three first options include treating the water in System 39 and the last includes shipping the water out of site for external treatment. Figure 19 illustrates alternative a), b) and c) of the four options: a) After neutralisation of the pH; routing it directly to the buffertank for treatment of the water together with the rest of the produced water in system 39. b) After neutralisation of pH; routing untreated water to the observation basin for mixing before discharge with treated water from system 39. c) After neutralisation of the pH; routing it to the offspec tank to allow for increased buffering before bleeding it into the buffertank for further treatment. d) After neutralisation of pH shipping it to another water treatment plant, e.g. Denmark.
Figure 19. Options for handling regenerating water from MPR in the Ormen Lange onshore plant; a) Treating all the water directly in System 39 by routing it to the buffertank, b) Routing untreated water to the observation basin and mixing it with treated water from the Ormen Lange onshore plant, and c) Routing it to the offspec tank to allow for bleeding it into the PW treatment plant.
3.3. MPR waste composition and flow rate Table 6 summarises the expected composition of waste from the MPR unit. The maximum number of treatment cycles per day is expected to be 3.2 cycles of anionic resin regeneration
Produced water
MEG desalter; Glycolex
MEG regeneration
TEG regeneration
MPPE Buffer-tank
Biological treatment
Observa-tion basin
Consession pointa) b)
Off-spec tank
c)
Rich MEG tank
Regen.Unit
Lean MEG
Glycolex IX
H2SO4NaOH
74 m3/d
~140 m3/d
Date: 01.11.2012 Page 23 : 53 Report no: 12-039 Version : 1 Dock.ref: BIOWATER-AQUATEAM REPORT MPR WASTE TO SYSTEM
39
and 1.6 cycles of cationic resin regeneration and based on this it has been estimated that the composition of waste will be as shown in Table 6. This composition is given based on the assumption that the MEG being treated contains 3800 mg/l as the sum of formate and acetate. The total volume of water (74.4 m3/day or 3.1 m3/h) is mixed with other streams in the buffer tank. The total flow from the buffer tank varies between 10 and 16 m3/h, meaning that the concentration of the different compounds listed in Table 6 will be diluted by a factor of 3 to 5 before it enters the LSP tank.
Table 6. Expected composition of MPR waste when treating Rich MEG containing 3800 ppm formate and acetate. The total flow of waste is assumed to be 74.4 m3/day of which 49.6 m3/d of anionic regeneration waste and 24.8 m3/d of cationic regeneration waste.
H2S should not be formed under normal operating conditions in System 39. It is only occurring under unusual operating conditions. The maximum concentration of sulphate in water entering the buffertank when the MPR wastewater enters the buffertank is very high (3800 to 6000 mg/l) compared to normal operating conditions. Sulphate Reducing Bacteria (SRB) are obligate anaerobes (do not require oxygen as an electron donor) and produce sulphide from the reduction of sulphate according to equation 1.
The MPR waste will contain high concentration of SO4
2- if H2SO4 (sulphuric acid) is used for regeneration of the ion exchange media. The produced water presently treated in OL PWTRP is very low in sulphate concentrations and sulphide production under normal operating conditions has not been considered a problem. With MPR waste containing SO4 the possibility of formation of H2S is increasing, see equation 1 and Table 6. The concentration of sulphate is expected eventually to reach 3800 mg/l to 6000 mg/l. Hydrogen sulfide is a highly toxic and flammable gas (flammable range: 4.3–46%) and being heavier than air, it tends to accumulate at the bottom of poorly ventilated spaces. Sulphide in the air is considered a health problem if it exceeds the Administrative Guidelines for working environment (Arbeidsmiljøtilsynet, 2011) which in Norway are:
For 8 h exposure: < 5 ppm (in air) or 7 mg/m3
Date: 01.11.2012 Page 24 : 53 Report no: 12-039 Version : 1Dock.ref: BIOWATER-AQUATEAM REPORT MPR WASTE TO SYSTEM
39
� For short term, acute exposure: <10 ppm or 14 mg/m3
3.3.2. Possibilities for format ion of H2S and exposure to workersIn a biological active system with no oxygen present, organic carbon, anaerobic bacteria andsulphate present, the possibility for formation of sulphide is always present. Keeping thesystem aerobic (having oxygen present) will prevent H2S formation. Keeping pH high (>7.5)will limit the presence of H2S in water and limit mass transfer to air. At sites with low amountof carbon (e.g. in the DAF unit), this will also limit the potential for H2S formation. In the DAF,oxygen rich dispersed water is added to the unit to enhance the flotation process.
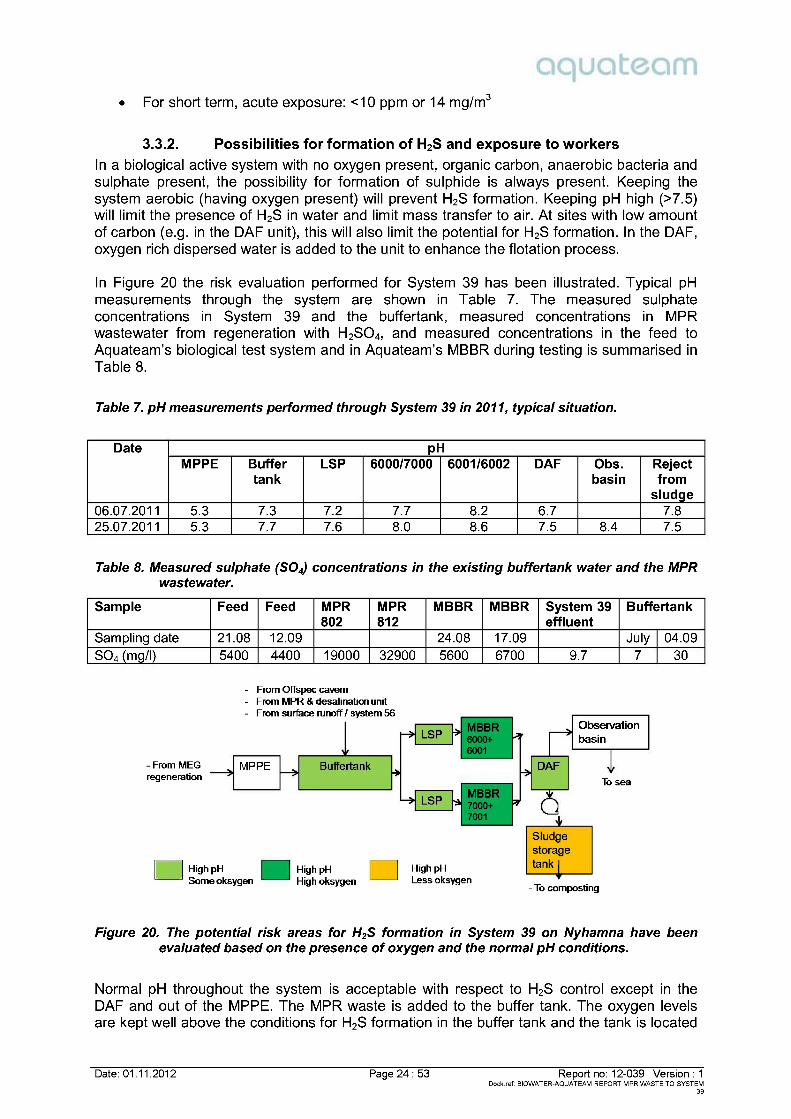
In Figure 20 the risk evaluation performed for System 39 has been illustrated. Typical pHmeasurements through the system are shown in Table 7. The measured sulphateconcentrations in System 39 and the buffertank, measured concentrations in MPRwastewater from regeneration with H2SO4, and measured concentrations in the feed toAquateam’s biological test system and in Aquateam’s MBBR during testing is summarised inTable 8.
Table 7. pH measurements performed through System 39 in 2011, typical situation.
Table 8. Measured sulphate (SO4) concentrations in the existing buffertank water and the MPRwastewater.
Sample Feed Feed MPR802
MPR812
MBBR MBBR System 39effluent
Buffertank
Sampling date 21.08 12.09 24.08 17.09 July 04.09SO4 (mg/l) 5400 4400 19000 32900 5600 6700 9.7 7 30
Figure 20. The potential risk areas for H2S format ion in System 39 on Nyhamna have beenevaluated based on the presence of oxygen and the normal pH conditions.
Normal pH throughout the system is acceptable with respect to H2S control except in theDAF and out of the MPPE. The MPR waste is added to the buffer tank. The oxygen levelsare kept well above the conditions for H2S formation in the buffer tank and the tank is located
Date: 01.11.2012 Page 25 : 53 Report no: 12-039 Version : 1 Dock.ref: BIOWATER-AQUATEAM REPORT MPR WASTE TO SYSTEM
39
outdoor. The pH value is increasing through LSP and MBBR and the oxygen concentrations are kept high and thus the H2S formation is under control. The only place where H2S formation can take place under normal operating conditions is in the sludge storage tank, see Figure 20. Under normal conditions, pH is kept high and the sludge is added oxygen to keep the sludge aerobic. As long as the sludge storage tank is operated in this mode, sulphide production and H2S formation is kept under control. At Nyhamna in System 39, problems with H2S have been experienced in spite of the low sulphate concentrations in the water. In biological treatment plants, even with low sulphate in water, sulphur will accumulate in the biomass (sludge) and typically problems with H2S are occurring in connection to shut-down of the plant, stops of the aeration system, anaerobic conditions in the sludge storage etc. Problems with H2S to the surroundings typically occur during plant start-ups, typically when the aerators are starting. The H2S which has been accumulating in the water masses is then suddenly released in a concentrated dosage in the off gas. You are basically not able to oxidize the H2S fast enough before H2S is stripped off. If there is a stop in the DAF with biomass present in the DAF tank, the H2S which has been generated during the stop will be stripped off during the start-up and when the dispersion water with microgas bubbles is added. If there has been a shut-down of the aeration in one or several reactors, or in one part of the reactor, a batch wise emission of H2S will take place when the aeration is initiated. It is typically these kind of happenings which are generating so high levels of H2S that it kills the biology in biological filters for odour removal. If you have a normal flow through the plant and DAF is working as normal, but there are zones in the biological reactor which is low in oxygen so that H2S is generated, then it is possible also to get H2S into the DAF unit. In the biology the pH will keep it in HS- ions. With the reduced pH in the DAF unit you will have H2S and the air bubbles in dispersion water will ensure that H2S is stripped off. It is only small amounts of the previously generated H2S which will be oxidized before it is stripped off. The aerobic conditions in the DAF are ensuring no additional formation of H2S, but they cannot limit emissions of H2S which previously has been formed in the unit. There must be established operational routines related to unforeseen happenings in the treatment plant to ensure managing increased emissions of H2S. If the plant has open basins outside, it is probably sufficient that personnel keep a certain distance to the basin until the aeration has removed all H2S. Alternatively it is necessary to dose a mix of lime and iron to remove the H2S from the water before the aeration is started. It is assumed that the operators are required to carry H2S alarms.
4. Laboratory study handling the waste in the MBBR system
4.1. Materials and methods
4.1.1. Experimental setup
One train (Train 3; Please note that Train 1 and Train 2 were for the parallel methanol study.) was set up in August for testing effects of MPR waste on the biological system at Nyhamna. Later a baseline train (Train 4) was set up after completion of Train 1 in the methanol study (see a separate report from Aquateam). Figure 21Figure 21 illustrates the schematics of the two trains. Both trains were seeded with biofilm carriers from System 39 but from different batches, Train 3 with a batch from late July and Train 4 with a batch from early September. Both trains were running at 26-30oC in a temperature controlled cabinet. All the reactors were aerated. Due to the high operating temperature and high air flow for aeration the amount of
Date: 01.11.2012 Page 26 : 53 Report no: 12-039 Version : 1 Dock.ref: BIOWATER-AQUATEAM REPORT MPR WASTE TO SYSTEM
39
evaporation in the reactors can be significant, compared to the small flow for each train (1 l/d). This may increase hydraulic retention times in the reactors and concentrate COD and TOC in the effluent. In order to reduce the amount of evaporation covers with 2-m tubing (for cooling vapour from the reactors and sending condensed water back to the reactor) were used. Figure 22 shows two pictures taken during testing.
Figure 21. Experimental setup. (Train 4 on the top and Train 3 at the bottom). Parameters for analysis at each sampling point shown on top of the graph.
Figure 22. Pictures taken during testing.
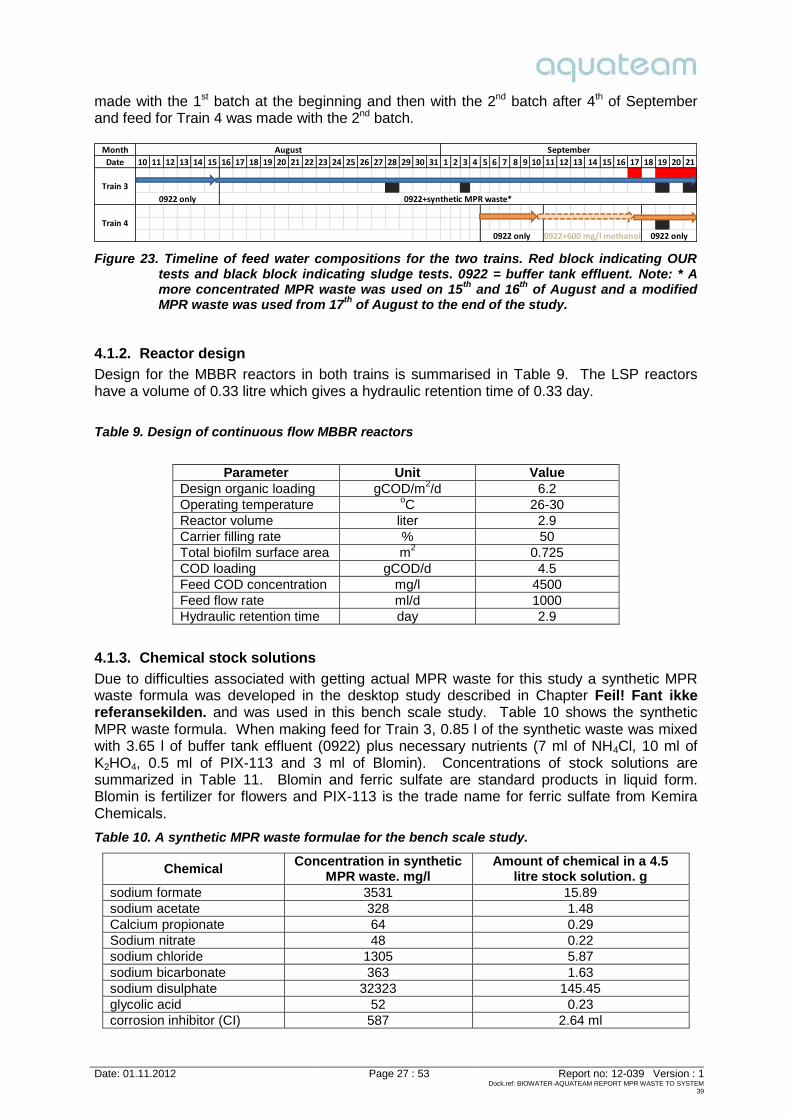
A test program shown in Figure 23 was executed for the testing after discussing with Shell. Two batches of wastewater from 0922 (buffer tank) were delivered from Nyhamna to Aquateam: 1st batch in late July and 2nd batch in early September. Feed for Train 3 was
LSP0.33 literworking volume
MBBR2.9 literworking volume
Buffer tank effluent + nutrients MBBR efluent
LSP0.33 literworking volume
MBBR2.9 literworking volume
MBBR efluent
COD, TOC, TN, P, VFAs, pH
COD, TOC, TSS, VSS,
VFAs, pH and DO
COD, TOC, TSS, VSS,
carrier biomass, VFAs, TN, NO3, NO2, NH4, P, pH
and DO
MPR waste +
buffer tank effluent + nutrients
Date: 01.11.2012 Page 27 : 53 Report no: 12-039 Version : 1 Dock.ref: BIOWATER-AQUATEAM REPORT MPR WASTE TO SYSTEM
39
made with the 1st batch at the beginning and then with the 2nd batch after 4th of September and feed for Train 4 was made with the 2nd batch.
Figure 23. Timeline of feed water compositions for the two trains. Red block indicating OUR tests and black block indicating sludge tests. 0922 = buffer tank effluent. Note: * A more concentrated MPR waste was used on 15th and 16th of August and a modified MPR waste was used from 17th of August to the end of the study.
4.1.2. Reactor design
Design for the MBBR reactors in both trains is summarised in Table 9. The LSP reactors have a volume of 0.33 litre which gives a hydraulic retention time of 0.33 day.
Table 9. Design of continuous flow MBBR reactors
Parameter Unit Value
Design organic loading gCOD/m2/d 6.2 Operating temperature oC 26-30 Reactor volume liter 2.9 Carrier filling rate % 50 Total biofilm surface area m2 0.725 COD loading gCOD/d 4.5 Feed COD concentration mg/l 4500 Feed flow rate ml/d 1000 Hydraulic retention time day 2.9
4.1.3. Chemical stock solutions
Due to difficulties associated with getting actual MPR waste for this study a synthetic MPR waste formula was developed in the desktop study described in Chapter Feil! Fant ikke referansekilden. and was used in this bench scale study. Table 10 shows the synthetic MPR waste formula. When making feed for Train 3, 0.85 l of the synthetic waste was mixed with 3.65 l of buffer tank effluent (0922) plus necessary nutrients (7 ml of NH4Cl, 10 ml of K2HO4, 0.5 ml of PIX-113 and 3 ml of Blomin). Concentrations of stock solutions are summarized in Table 11. Blomin and ferric sulfate are standard products in liquid form. Blomin is fertilizer for flowers and PIX-113 is the trade name for ferric sulfate from Kemira Chemicals.
Table 10. A synthetic MPR waste formulae for the bench scale study.
Date: 01.11.2012 Page 28 : 53 Report no: 12-039 Version : 1 Dock.ref: BIOWATER-AQUATEAM REPORT MPR WASTE TO SYSTEM
39
Chemical Concentration in synthetic
MPR waste. mg/l Amount of chemical in a 4.5
litre stock solution. g scaling inhibitor (SI) 217 0.98 ml
Table 11. Necessary stock solutions for nutrient supply.
Chemical/Product Concentration
NH4Cl 250 g/l
K2HPO4 50 g/l
Blomin See declaration on bottle
Ferric sulphate (PIX-113) 177 g Fe/l and 167 g S/l
4.1.4. Seeding procedure
In both trains the LSP reactor was filled with 50 ml of 0922 and then was added with LSP water from Nyhamna to overflow. Each of the MBBR reactors was filled with 1.45 l of biofilm carriers from Nyhamna (reactor 6000) plus 300 ml of 0922 and then was added with MBBR water from the tank 6000 to overflow.
4.1.5. Sampling and analysis
Water samples, either filtered or unfiltered, were taken from the reactors directly. Glass microfiber filters with 1.2 micron pore size were used for filtering samples. Materials/devices used for monitoring different parameters are summarised in Table 12.
Table 12. Summary of testing kits and devices used in this study
Parameter Test kit/device Manufacturer Category No. / model No.
COD Test kits Hach 314, 014, 514, 414 TOC Test kits Hach 385, 386 Total N Test kits Hach 238 Phosphate Test kits Hach 348 Nitrate Test kits Hach 339 Nitrite Test kits Hach 341 Ammonium Test kits Hach 303 TSS/VSS Glass microfiber filter Whatman 1822-055 pH, DO, temperature and conductivity
Multimeter plus probes WTW 3430 (meter)
The determination of volatile fatty acids (VFAs); i.e. glycolate, acetate, formate and propionate, have been carried out with ion chromatography (IC). The instrumentation setup and chromatographic conditions are listed in Table 13.
Table 13. Ion Chromatographic setup and chromatographic conditions.
IC system Dionex ICS 2000 RFIC with automated sampler Dionex 2000 AS Sample loop volume 20 l Columns Analytical: IonPac AS15, 4x250 mm
Guard: IonPac AG15, 4x50 mm Eluent KOH gradient with following program:
0-13 min hold at 10 mM KOH 13-16 min increase to 60 mM KOH 16-19.2 min hold at 60 mM KOH
Date: 01.11.2012 Page 29 : 53 Report no: 12-039 Version : 1 Dock.ref: BIOWATER-AQUATEAM REPORT MPR WASTE TO SYSTEM
39
4.1.6. OUR test setup and operation
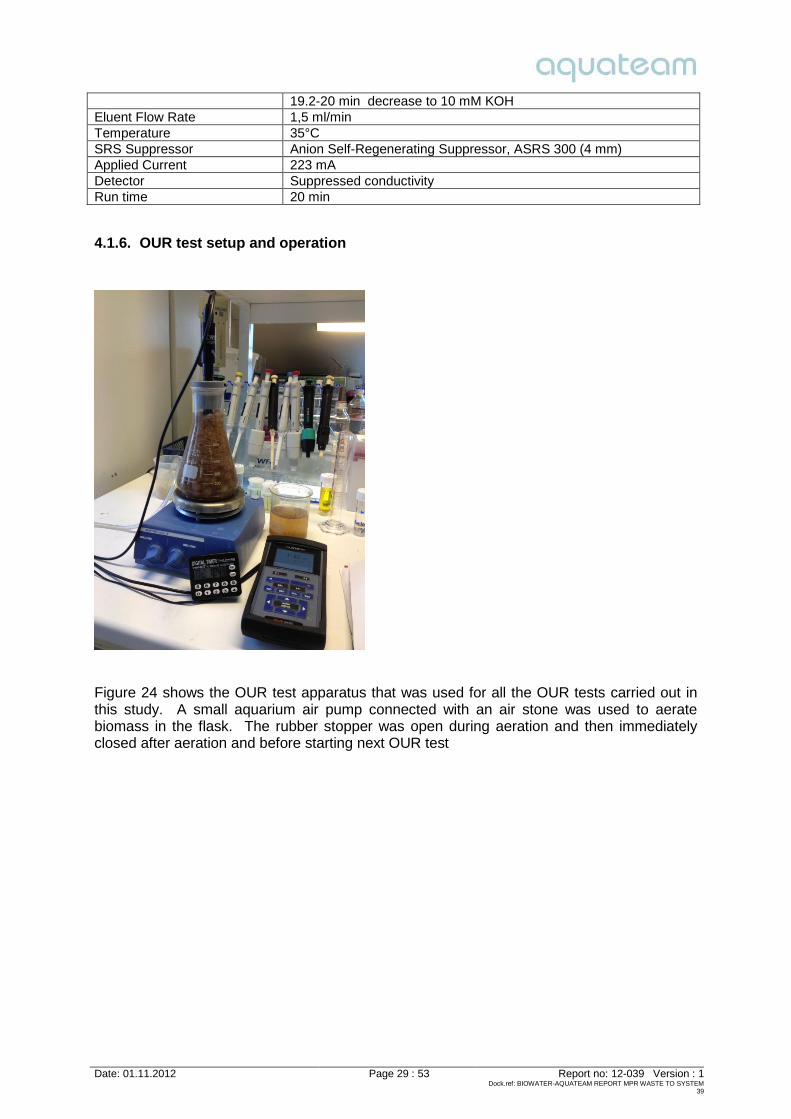
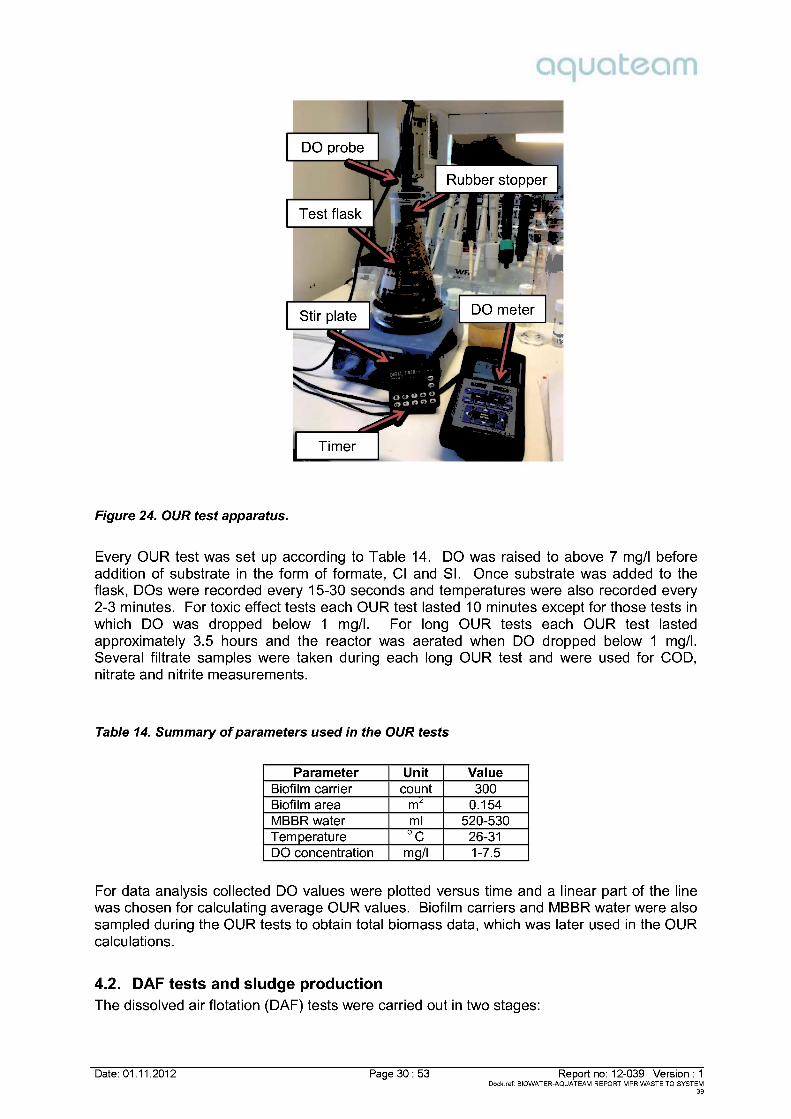
Figure 24 shows the OUR test apparatus that was used for all the OUR tests carried out in this study. A small aquarium air pump connected with an air stone was used to aerate biomass in the flask. The rubber stopper was open during aeration and then immediately closed after aeration and before starting next OUR test
19.2-20 min decrease to 10 mM KOH Eluent Flow Rate 1,5 ml/min Temperature 35°C SRS Suppressor Anion Self-Regenerating Suppressor, ASRS 300 (4 mm) Applied Current 223 mA Detector Suppressed conductivity Run time 20 min
Date: 01.11.2012 Page 30 : 53 Report no: 12-039 Version : 1Dock.ref: BIOWATER-AQUATEAM REPORT MPR WASTE TO SYSTEM
39
Figure 24. OUR test apparatus.
Every OUR test was set up according to Table 14. DO was raised to above 7 mg/l beforeaddition of substrate in the form of formate, CI and SI. Once substrate was added to theflask, DOs were recorded every 15-30 seconds and temperatures were also recorded every2-3 minutes. For toxic effect tests each OUR test lasted 10 minutes except for those tests inwhich DO was dropped below 1 mg/l. For long OUR tests each OUR test lastedapproximately 3.5 hours and the reactor was aerated when DO dropped below 1 mg/l.Several filtrate samples were taken during each long OUR test and were used for COD,nitrate and nitrite measurements.
Table 14. Summary of parameters used in the OUR tests
Parameter Unit ValueBiofilm carrier count 300Biofilm area m2 0.154MBBR water ml 520-530Temperature o C 26-31DO concentration mg/l 1-7.5
For data analysis collected DO values were plotted versus time and a linear part of the linewas chosen for calculating average OUR values. Biofilm carriers and MBBR water were alsosampled during the OUR tests to obtain total biomass data, which was later used in the OURcalculations.
4.2. DAF tests and slud ge productionThe dissolved air flotation (DAF) tests were carried out in two stages:
Test flask
DO probe
Stir plate DO meter
Timer
Rubber stopper
Date: 01.11.2012 Page 31 : 53 Report no: 12-039 Version : 1 Dock.ref: BIOWATER-AQUATEAM REPORT MPR WASTE TO SYSTEM
39
Screening the amount of coagulant needed for efficient separation of the biosolids from the water
DAF tests for the most promising chemical dosage
4.2.1. Screening tests
At the Ormen Lange produced water treatment plant, approximately 400 ppmv of PAX-18 and 2 ppm of Coreshell (polymer) is used under normal operational conditions in the plant. In the screening tests pH and PAX dosage has been the two primary variables tested. pH was adjusted to vary between 5 and 9 using a NaHCO3 solution, NaOH or HCl and the dosage of the PAX was varied within the range from 50 – 600 mg/l. For each test, a certain dose of the flocculants was added to 100 ml of test solution. The solution was stirred at 800 rpm for 30 seconds, and then the polymer was added at 350-400 rpm for another 15 to 30 seconds. Stirring was turned off and the solution was allowed 6 min for static settling. The approximate volumes of flocs were noted for each test before 30 ml of supernatant was sampled. Each sample was measured for pH and COD and selected samples were analysed for TSS. From the screening tests, it was decided which tests to be included in flotation tests, which was carried out in a 1 L beaker.
.
Figure 25. Test set-up used for screening tests of flocculants. Left: during mixing and right during settling.
4.3. DAF tests The flotation tests were conducted in 1 L testing jars. The coagulant was dosed to 800 ml of initial solution. The solution was placed on fast stirring for 30 sec and the polymer was added and slow stirring continued for 10 min. At the end of the slow mixing period, 200 ml of DI water saturated with air at 4 bar was injected to the testing jar from the bottom inlet valve. The solution was placed still for 10 min for separation, after which the volume of sludge in each test jar was recorded. Supernatant was collected (from the sampling port close to the point of injecting water saturated with air) from each jar for measurement of pH, filtered and unfiltered COD, and TSS.
Date: 01.11.2012 Page 32 : 53 Report no: 12-039 Version : 1 Dock.ref: BIOWATER-AQUATEAM REPORT MPR WASTE TO SYSTEM
39
Figure 26. Test set-up for coagulation, flocculation and flotation tests. Here during flotation.
4.4. Results and discussions
4.4.1. Performance of the water treatment plant
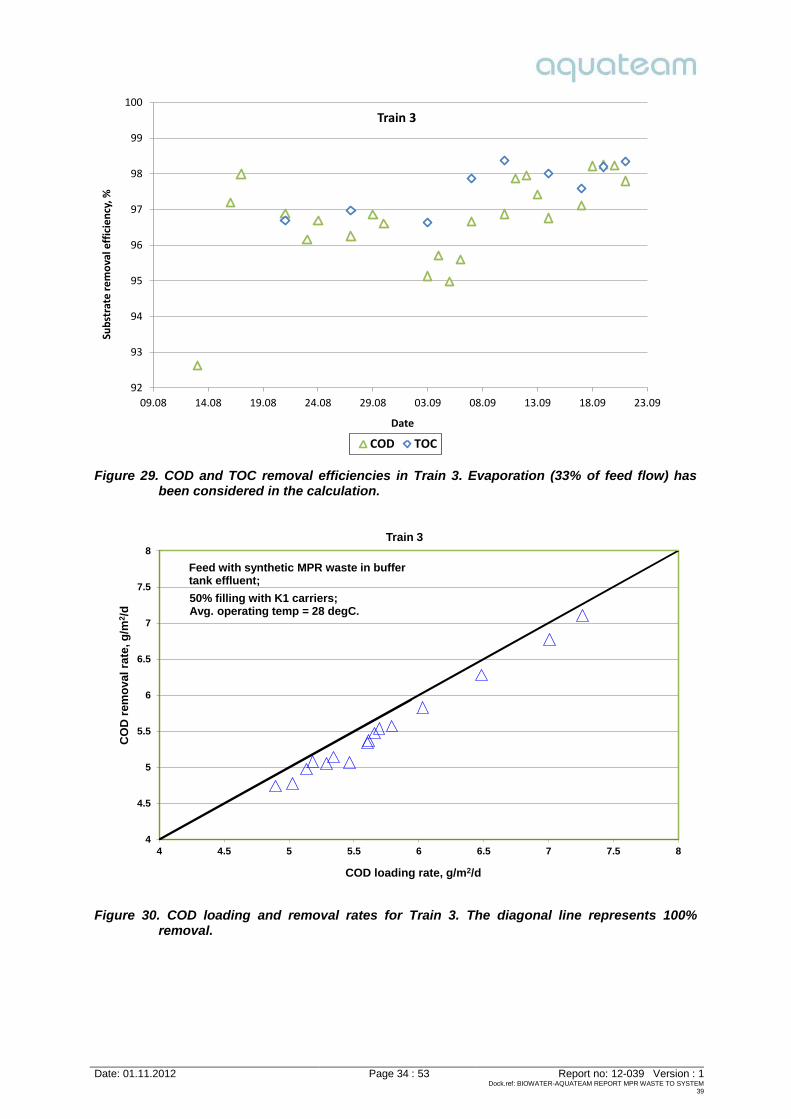
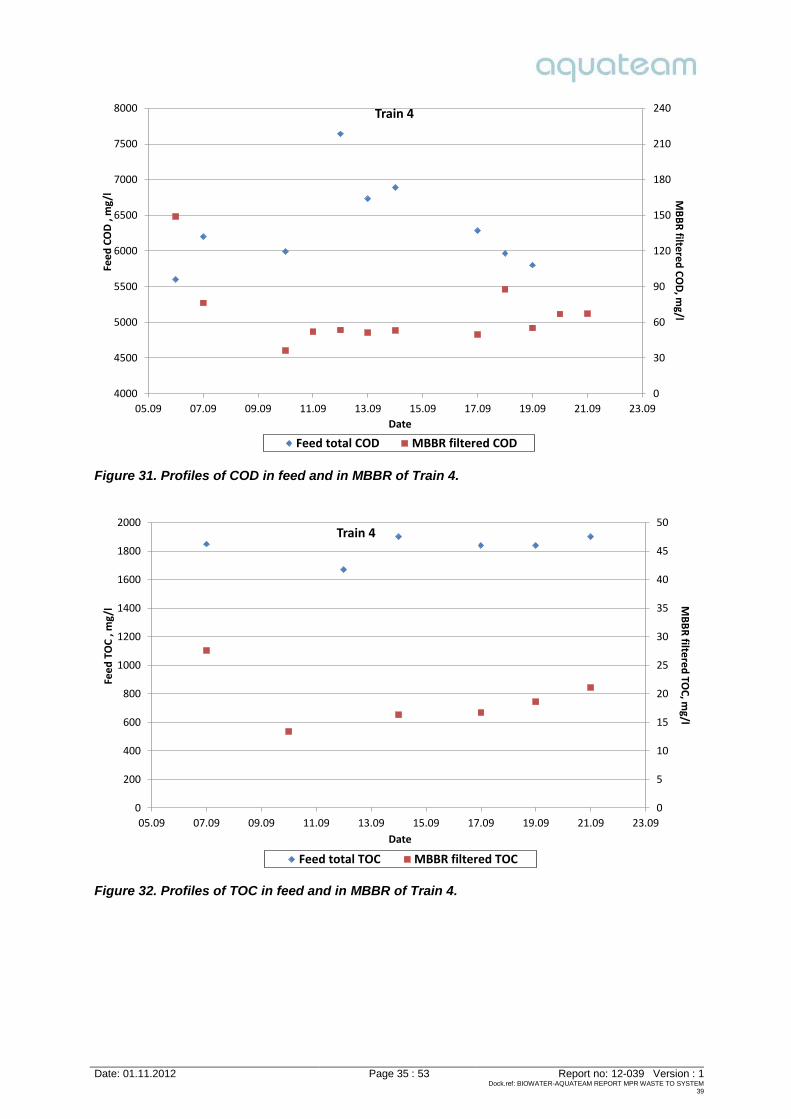
COD and TOC results Testing results from Train 3 and Train 4 are summarised in Figure 27 to Figure 34. In Train 3 MBBR filtered COD varied between 120-280 mg/l during the test period after starting adding the synthetic MPR waste in buffer tank effluent (Figure 27) and the variation of MBBR filtered COD was not significantly affected by the switch to the 2nd batch of buffer tank effluent on 6th of September. MBBR filtered TOC for Train 3 was below 70 mg/l for all the samples (Figure 28). Removal efficiencies for COD and TOC in Train 3 were above 95% all the time (Figure 29). Low ammonia concentrations were also observed in MBBR reactor as shown in Table 15. All those results indicate that with the synthetic MPR waste addition performance of Train 3 was good and stable. No violation of the discharge permit for TOC and ammonia is expected for the System 39 with addition of MPR waste at the tested concentration. However, the performance of Train 3 was not as good as that of Train 4, which was fed with buffer tank effluent only. Lower COD (below 70 mg/l most of time as shown in Figure 31) and TOC (below 25 mg/l as shown in Figure 32) were observed for MBBR filtered samples from Train 4. COD removal rates were closer to COD loading rates in Train 4 (Figure 34) than that in Train 3 (Figure 30). Those results suggest that some chemicals in the synthetic MPR waste were not completely removed in Train 3, resulting in higher COD and TOC in MBBR tank than for Train 4. Meantime, no inhibitory effects were observed in Train 3 with elevated COD/TOC in MBBR over the 5-week testing period.
Date: 01.11.2012 Page 33 : 53 Report no: 12-039 Version : 1 Dock.ref: BIOWATER-AQUATEAM REPORT MPR WASTE TO SYSTEM
39
Figure 27. Profiles of COD in feed and in MBBR of Train 3.
Figure 28. Profiles of TOC in feed and in MBBR of Train 3.
50% filling with K1 carriers;Avg. operating temp = 28 degC.
Date: 01.11.2012 Page 37 : 53 Report no: 12-039 Version : 1Dock.ref: BIOWATER-AQUATEAM REPORT MPR WASTE TO SYSTEM
39
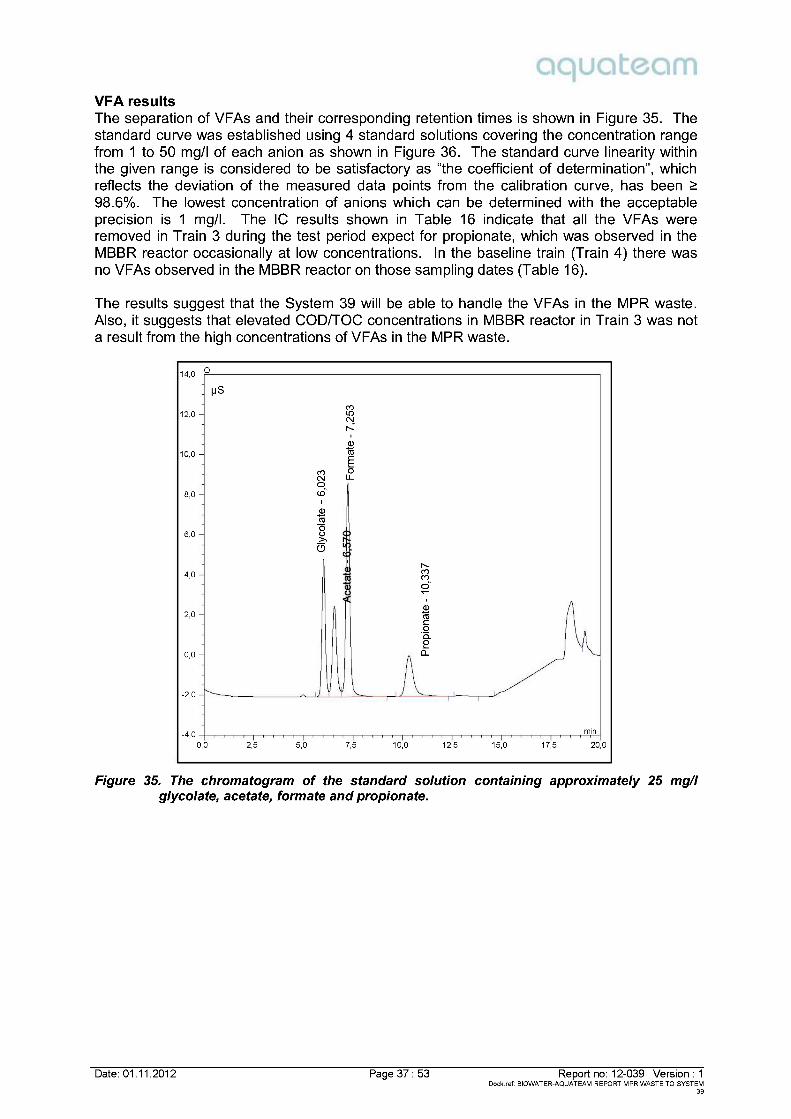
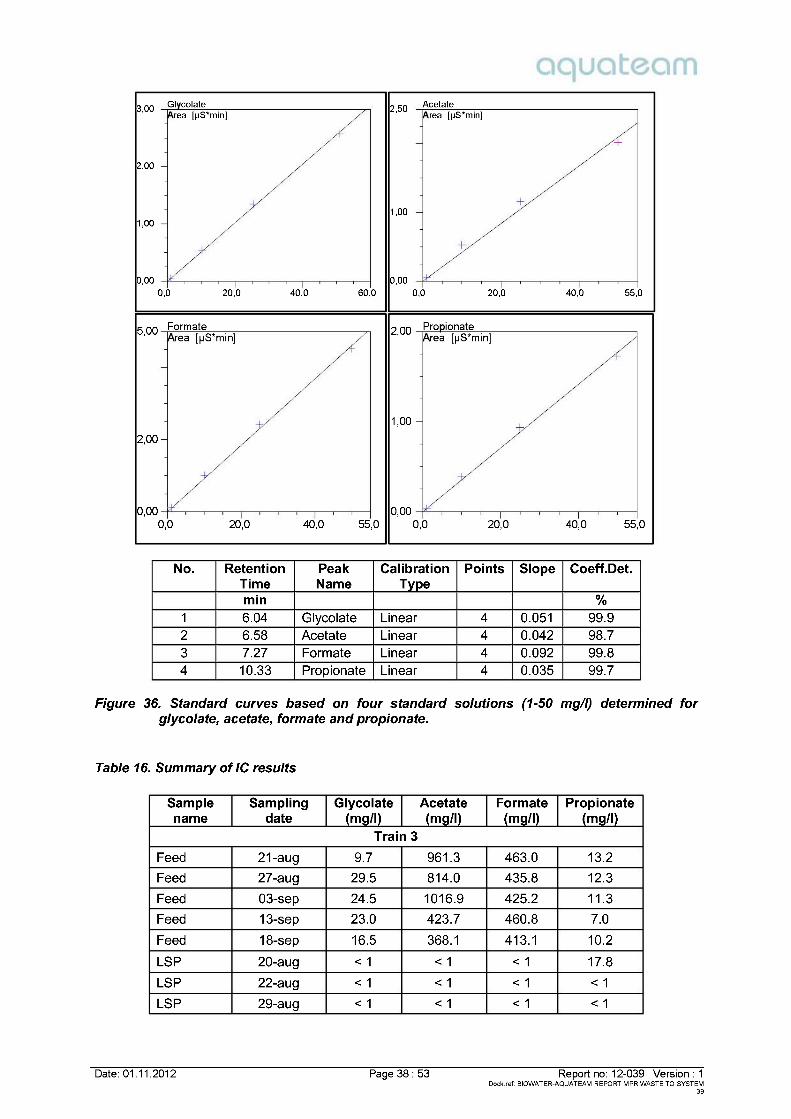
VFA resultsThe separation of VFAs and their corresponding retention times is shown in Figure 35. Thestandard curve was established using 4 standard solutions covering the concentration rangefrom 1 to 50 mg/l of each anion as shown in Figure 36. The standard curve linearity withinthe given range is considered to be satisfactory as “the coefficient of determination”, whichreflects the deviation of the measured data points from the calibration curve, has been �98.6%. The lowest concentration of anions which can be determined with the acceptableprecision is 1 mg/l. The IC results shown in Table 16 indicate that all the VFAs wereremoved in Train 3 during the test period expect for propionate, which was observed in theMBBR reactor occasionally at low concentrations. In the baseline train (Train 4) there wasno VFAs observed in the MBBR reactor on those sampling dates (Table 16).
The results suggest that the System 39 will be able to handle the VFAs in the MPR waste.Also, it suggests that elevated COD/TOC concentrations in MBBR reactor in Train 3 was nota result from the high concentrations of VFAs in the MPR waste.
Figure 35. The chromatogram of the standard solution containing approximately 25 mg/ lglycolate, acetate, formate and propionate .
0,0 2,5 5,0 7,5 10,0 12,5 15,0 17,5 20,0-4,0
-2,0
0,0
2,0
4,0
6,0
8,0
10,0
12,0
14,0 O
µS
min
Glycolate-6,023
Acetate-6,570
Formate-7,253
Propionate-10,337
Date: 01.11.2012 Page 38 : 53 Report no: 12-039 Version : 1Dock.ref: BIOWATER-AQUATEAM REPORT MPR WASTE TO SYSTEM
39
Figure 36. Standard curve s based on four standard solutions (1-50 mg/ l) determined forglycolate, acetate, formate and propionate.
Table 16. Summary of IC results
No. RetentionTime
PeakName
CalibrationType
Points Slope Coeff.Det.
min %1 6.04 Glycolate Linear 4 0.051 99.92 6.58 Acetate Linear 4 0.042 98.73 7.27 Formate Linear 4 0.092 99.84 10.33 Propionate Linear 4 0.035 99.7
Samplename
Samplingdate
Glycolate(mg/l)
Acetate(mg/l)
Formate(mg/l)
Propionate(mg/l)
Train 3
Feed 21-aug 9.7 961.3 463.0 13.2
Feed 27-aug 29.5 814.0 435.8 12.3
Feed 03-sep 24.5 1016.9 425.2 11.3
Feed 13-sep 23.0 423.7 460.8 7.0
Feed 18-sep 16.5 368.1 413.1 10.2
LSP 20-aug < 1 < 1 < 1 17.8
LSP 22-aug < 1 < 1 < 1 < 1
LSP 29-aug < 1 < 1 < 1 < 1
0,00
1,00
2,00
3,00
0,0 20,0 40,0 60,0
GlycolateArea [µS*min]
0,00
1,00
2,50
0,0 20,0 40,0 55,0
AcetateArea [µS*min]
0,00
2,00
5,00
0,0 20,0 40,0 55,0
FormateArea [µS*min]
0,00
1,00
2,00
0,0 20,0 40,0 55,0
PropionateArea [µS*min]
Date: 01.11.2012 Page 39 : 53 Report no: 12-039 Version : 1 Dock.ref: BIOWATER-AQUATEAM REPORT MPR WASTE TO SYSTEM
39
4.4.2. Is MPR waste toxic to the biological system at Nyhamna?
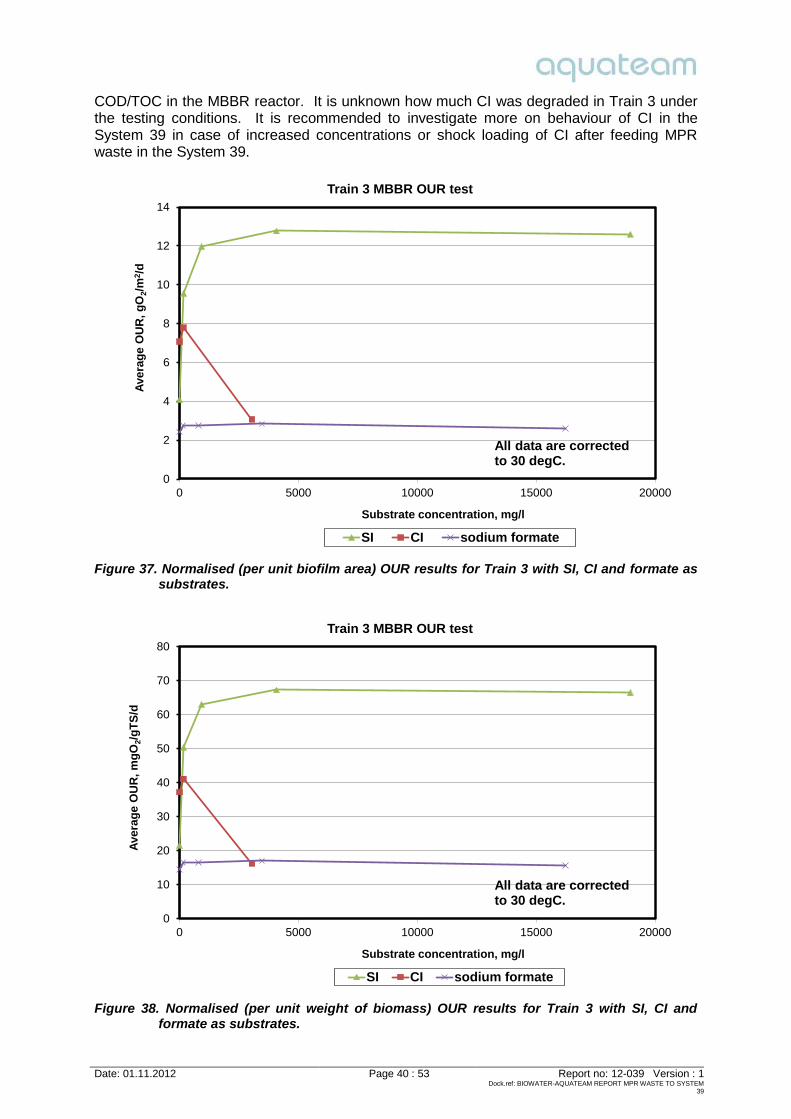
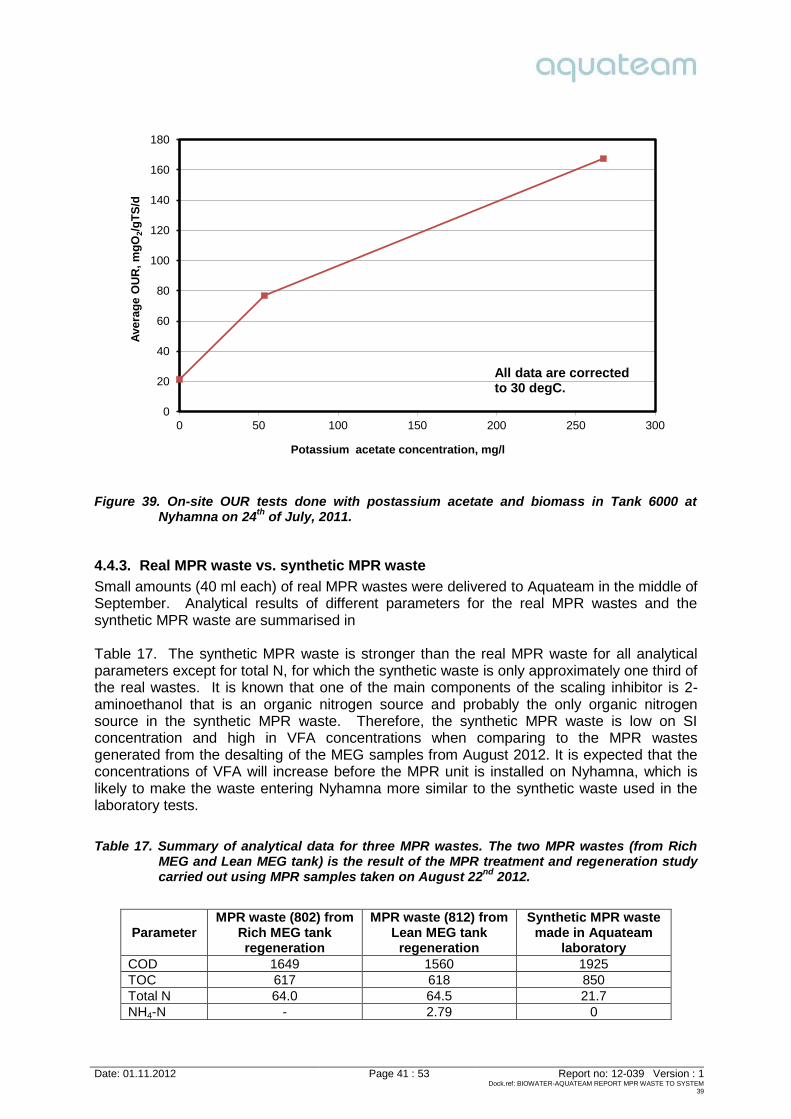
Aerobic bacteria use oxygen as electron acceptor and to support cell synthesis. The Oxygen Uptake Rate (OUR) test is typically employed for evaluating bacterial activity levels and testing toxic effects of a chemical to a bacterial community. Generally speaking, high levels of OURs indicate the added chemical (substrate) is readily available to the bacterial community and low levels of OURs indicates the substrate is slowly available. An OUR drop after a chemical addition indicates inhibitory or toxic effects from the chemical to the bacterial community. Several OUR tests were carried out with biofilm carriers and water from the MBBR reactors of Train 3. The test results are shown in Figure 37 and Figure 38. With SI and formate addition OURs increased with higher substrate concentrations, indicating that SI and formate encouraged bacterial activity. No toxic effects were observed in the OUR tests with SI concentrations up to 19000 mg/l and with formate concentrations up to 16000 mg/l. Comparing to an OUR test done with acetate at Nyhamna in 2011 under the same testing conditions (Figure 39) the increase of OURs with different concentrations of SI and formate was much lower than those with acetate, which was able to raise OURs eight folds at a concentration of 270 mg/l. The tests with SI and CI were done on the same day with different batches of seed biomasses from the same reactor. The test with formate was done two days later. The higher OUR with SI addition than those with formate addition was mainly due to different microbial activities in the reactor between the two days. Similar results were also observed in the methanol study (Xin et al, 2012) which with the same substrate addition OUR results on different days had significant variation. With addition of CI OURs increased first at 165 mg CI/l and then dropped dramatically at 3000 mg CI/l. This indicates that the corrosion inhibitor (CI) encouraged bacterial activity at low concentrations but inhibited bacterial activity at high concentrations. The CI concentration in Train 3 feed was approximately 111 mg/l (equivalent to 115 mg COD/l) and was in the range of the CI concentrations that encourages bacterial activities. Although CI would not inhibit bacterial activities in Train 3, it may have contributed to the elevated
Date: 01.11.2012 Page 40 : 53 Report no: 12-039 Version : 1 Dock.ref: BIOWATER-AQUATEAM REPORT MPR WASTE TO SYSTEM
39
COD/TOC in the MBBR reactor. It is unknown how much CI was degraded in Train 3 under the testing conditions. It is recommended to investigate more on behaviour of CI in the System 39 in case of increased concentrations or shock loading of CI after feeding MPR waste in the System 39.
Figure 37. Normalised (per unit biofilm area) OUR results for Train 3 with SI, CI and formate as substrates.
Figure 38. Normalised (per unit weight of biomass) OUR results for Train 3 with SI, CI and formate as substrates.
0
2
4
6
8
10
12
14
0 5000 10000 15000 20000
Ave
rag
e O
UR
, g
O2/
m2 /
d
Substrate concentration, mg/l
Train 3 MBBR OUR test
SI CI sodium formate
All data are corrected to 30 degC.
0
10
20
30
40
50
60
70
80
0 5000 10000 15000 20000
Ave
rag
e O
UR
, m
gO
2/g
TS
/d
Substrate concentration, mg/l
Train 3 MBBR OUR test
SI CI sodium formate
All data are corrected to 30 degC.
Date: 01.11.2012 Page 41 : 53 Report no: 12-039 Version : 1 Dock.ref: BIOWATER-AQUATEAM REPORT MPR WASTE TO SYSTEM
39
Figure 39. On-site OUR tests done with postassium acetate and biomass in Tank 6000 at Nyhamna on 24th of July, 2011.
4.4.3. Real MPR waste vs. synthetic MPR waste
Small amounts (40 ml each) of real MPR wastes were delivered to Aquateam in the middle of September. Analytical results of different parameters for the real MPR wastes and the synthetic MPR waste are summarised in Table 17. The synthetic MPR waste is stronger than the real MPR waste for all analytical parameters except for total N, for which the synthetic waste is only approximately one third of the real wastes. It is known that one of the main components of the scaling inhibitor is 2-aminoethanol that is an organic nitrogen source and probably the only organic nitrogen source in the synthetic MPR waste. Therefore, the synthetic MPR waste is low on SI concentration and high in VFA concentrations when comparing to the MPR wastes generated from the desalting of the MEG samples from August 2012. It is expected that the concentrations of VFA will increase before the MPR unit is installed on Nyhamna, which is likely to make the waste entering Nyhamna more similar to the synthetic waste used in the laboratory tests.
Table 17. Summary of analytical data for three MPR wastes. The two MPR wastes (from Rich MEG and Lean MEG tank) is the result of the MPR treatment and regeneration study carried out using MPR samples taken on August 22nd 2012.
Parameter MPR waste (802) from
Rich MEG tank regeneration
MPR waste (812) from Lean MEG tank
regeneration
Synthetic MPR waste made in Aquateam
laboratory COD 1649 1560 1925 TOC 617 618 850 Total N 64.0 64.5 21.7 NH4-N - 2.79 0
0
20
40
60
80
100
120
140
160
180
0 50 100 150 200 250 300
Ave
rag
e O
UR
, m
gO
2/g
TS
/d
Potassium acetate concentration, mg/l
All data are corrected to 30 degC.
Date: 01.11.2012 Page 42 : 53 Report no: 12-039 Version : 1 Dock.ref: BIOWATER-AQUATEAM REPORT MPR WASTE TO SYSTEM
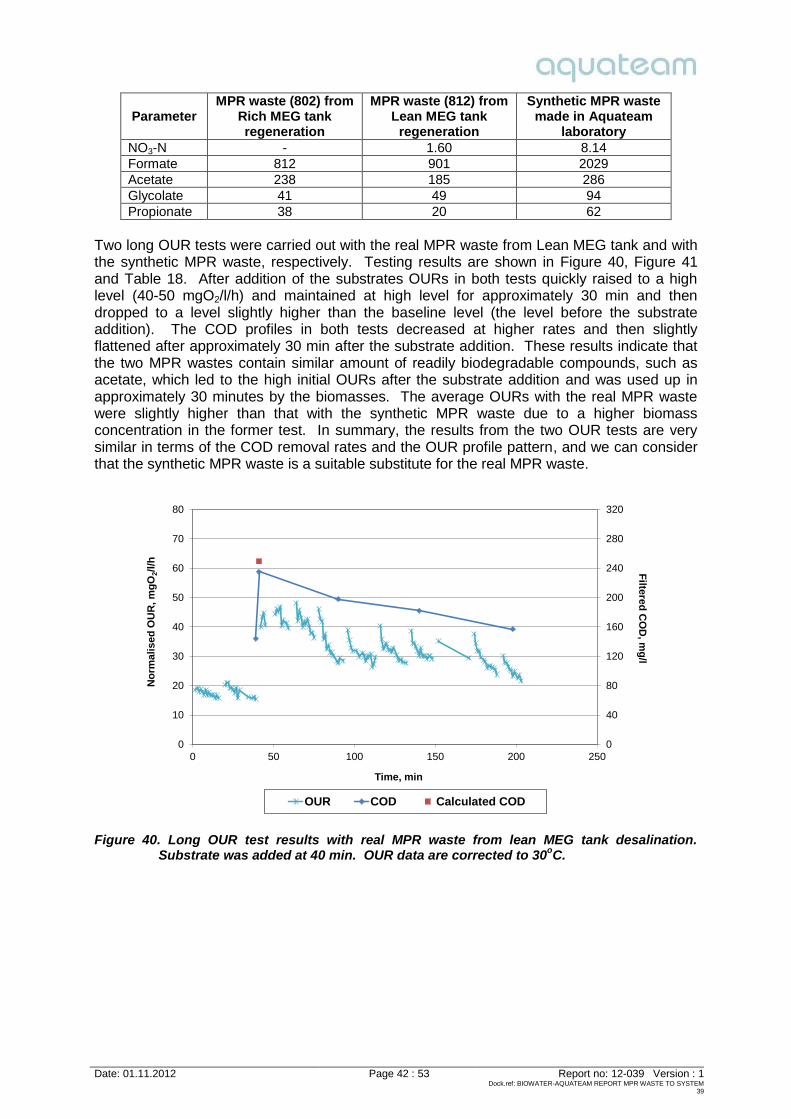
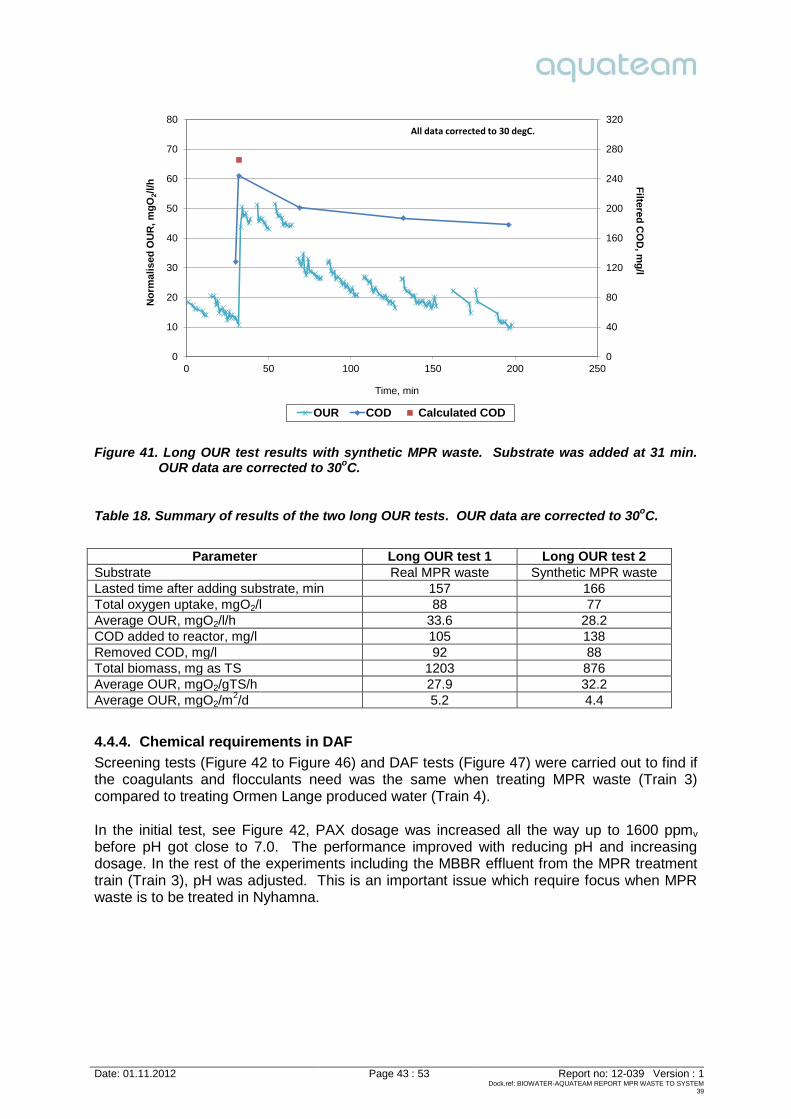
Two long OUR tests were carried out with the real MPR waste from Lean MEG tank and with the synthetic MPR waste, respectively. Testing results are shown in Figure 40, Figure 41 and Table 18. After addition of the substrates OURs in both tests quickly raised to a high level (40-50 mgO2/l/h) and maintained at high level for approximately 30 min and then dropped to a level slightly higher than the baseline level (the level before the substrate addition). The COD profiles in both tests decreased at higher rates and then slightly flattened after approximately 30 min after the substrate addition. These results indicate that the two MPR wastes contain similar amount of readily biodegradable compounds, such as acetate, which led to the high initial OURs after the substrate addition and was used up in approximately 30 minutes by the biomasses. The average OURs with the real MPR waste were slightly higher than that with the synthetic MPR waste due to a higher biomass concentration in the former test. In summary, the results from the two OUR tests are very similar in terms of the COD removal rates and the OUR profile pattern, and we can consider that the synthetic MPR waste is a suitable substitute for the real MPR waste.
Figure 40. Long OUR test results with real MPR waste from lean MEG tank desalination. Substrate was added at 40 min. OUR data are corrected to 30oC.
0
40
80
120
160
200
240
280
320
0
10
20
30
40
50
60
70
80
0 50 100 150 200 250
Filtered
CO
D, m
g/l
No
rmal
ised
OU
R, m
gO
2/l/
h
Time, min
OUR COD Calculated COD
Date: 01.11.2012 Page 43 : 53 Report no: 12-039 Version : 1 Dock.ref: BIOWATER-AQUATEAM REPORT MPR WASTE TO SYSTEM
39
Figure 41. Long OUR test results with synthetic MPR waste. Substrate was added at 31 min. OUR data are corrected to 30oC.
Table 18. Summary of results of the two long OUR tests. OUR data are corrected to 30oC.
Parameter Long OUR test 1 Long OUR test 2
Substrate Real MPR waste Synthetic MPR waste Lasted time after adding substrate, min 157 166 Total oxygen uptake, mgO2/l 88 77 Average OUR, mgO2/l/h 33.6 28.2 COD added to reactor, mg/l 105 138 Removed COD, mg/l 92 88 Total biomass, mg as TS 1203 876 Average OUR, mgO2/gTS/h 27.9 32.2 Average OUR, mgO2/m
2/d 5.2 4.4
4.4.4. Chemical requirements in DAF
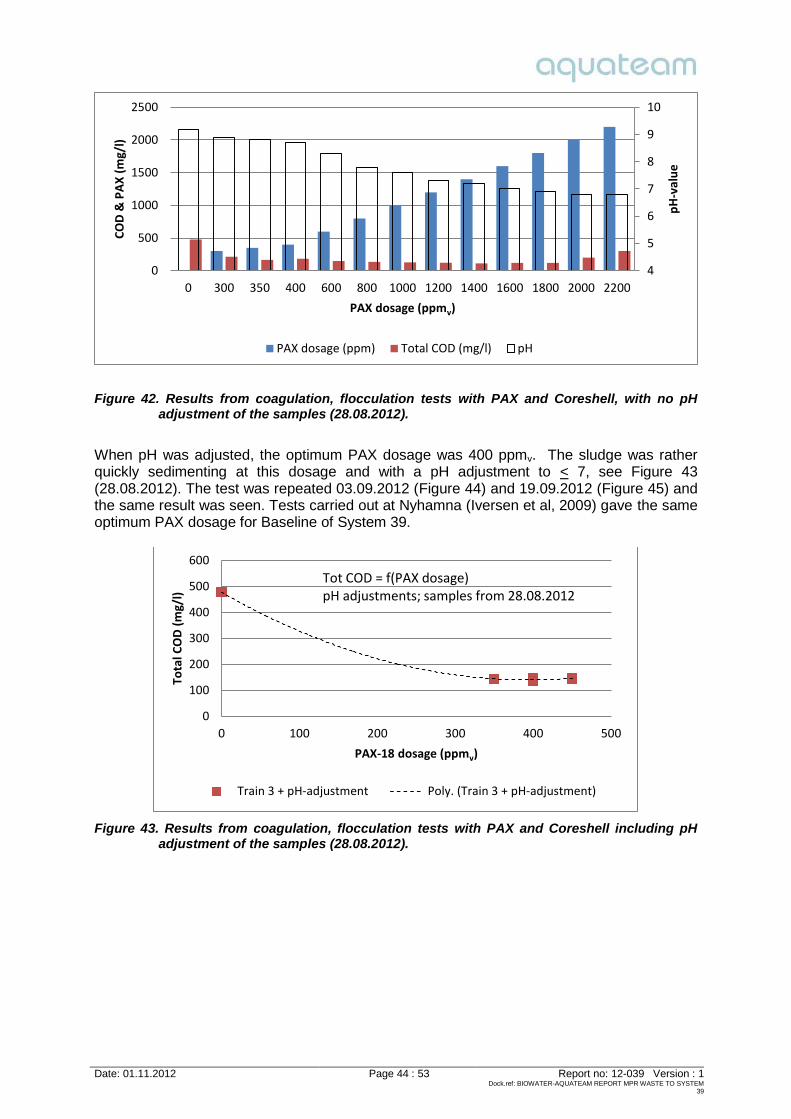
Screening tests (Figure 42 to Figure 46) and DAF tests (Figure 47) were carried out to find if the coagulants and flocculants need was the same when treating MPR waste (Train 3) compared to treating Ormen Lange produced water (Train 4). In the initial test, see Figure 42, PAX dosage was increased all the way up to 1600 ppmv before pH got close to 7.0. The performance improved with reducing pH and increasing dosage. In the rest of the experiments including the MBBR effluent from the MPR treatment train (Train 3), pH was adjusted. This is an important issue which require focus when MPR waste is to be treated in Nyhamna.
0
40
80
120
160
200
240
280
320
0
10
20
30
40
50
60
70
80
0 50 100 150 200 250
Filtered
CO
D, m
g/l
No
rmal
ised
OU
R, m
gO
2/l/
h
Time, min
OUR COD Calculated COD
All data corrected to 30 degC.
Date: 01.11.2012 Page 44 : 53 Report no: 12-039 Version : 1 Dock.ref: BIOWATER-AQUATEAM REPORT MPR WASTE TO SYSTEM
39
Figure 42. Results from coagulation, flocculation tests with PAX and Coreshell, with no pH adjustment of the samples (28.08.2012).
When pH was adjusted, the optimum PAX dosage was 400 ppmv. The sludge was rather quickly sedimenting at this dosage and with a pH adjustment to < 7, see Figure 43 (28.08.2012). The test was repeated 03.09.2012 (Figure 44) and 19.09.2012 (Figure 45) and the same result was seen. Tests carried out at Nyhamna (Iversen et al, 2009) gave the same optimum PAX dosage for Baseline of System 39.
Figure 43. Results from coagulation, flocculation tests with PAX and Coreshell including pH adjustment of the samples (28.08.2012).
Tot COD = f(PAX dosage) pH adjustments; samples from 28.08.2012
Date: 01.11.2012 Page 45 : 53 Report no: 12-039 Version : 1 Dock.ref: BIOWATER-AQUATEAM REPORT MPR WASTE TO SYSTEM
39
Figure 44. Results from coagulation, flocculation tests with PAX and Coreshell including pH adjustment of the samples (03.09.2012).
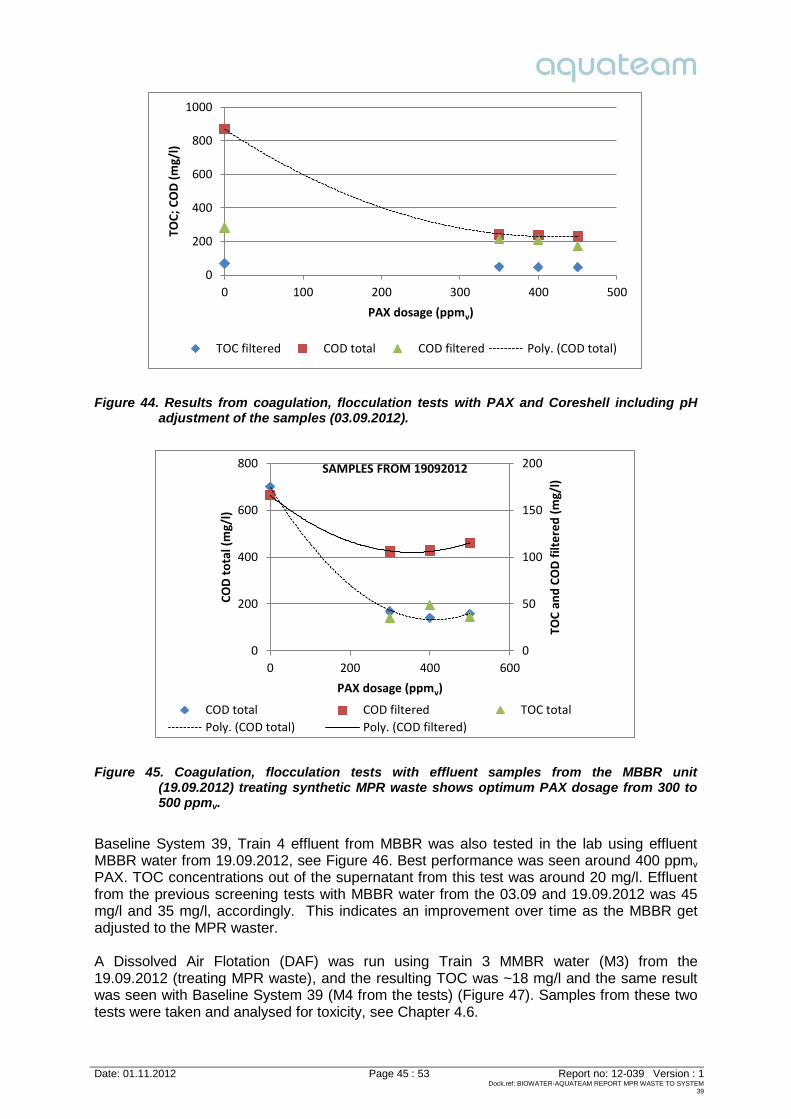
Figure 45. Coagulation, flocculation tests with effluent samples from the MBBR unit (19.09.2012) treating synthetic MPR waste shows optimum PAX dosage from 300 to 500 ppmv.
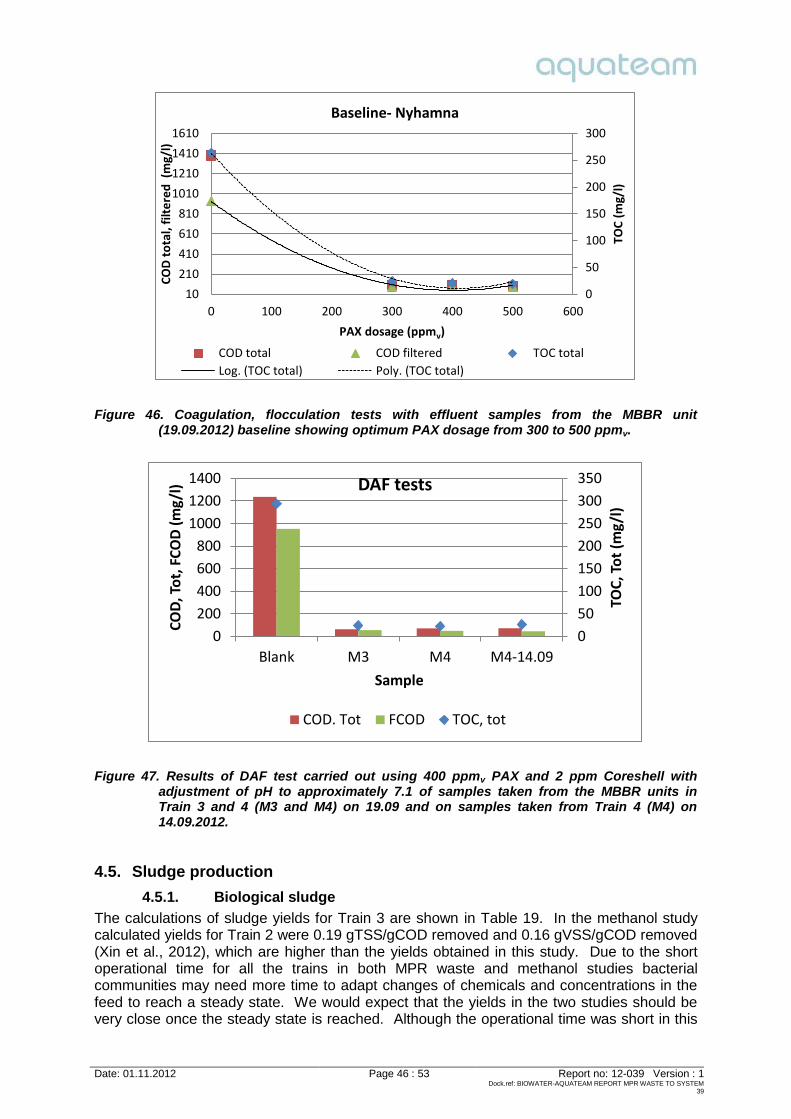
Baseline System 39, Train 4 effluent from MBBR was also tested in the lab using effluent MBBR water from 19.09.2012, see Figure 46. Best performance was seen around 400 ppmv PAX. TOC concentrations out of the supernatant from this test was around 20 mg/l. Effluent from the previous screening tests with MBBR water from the 03.09 and 19.09.2012 was 45 mg/l and 35 mg/l, accordingly. This indicates an improvement over time as the MBBR get adjusted to the MPR waster. A Dissolved Air Flotation (DAF) was run using Train 3 MMBR water (M3) from the 19.09.2012 (treating MPR waste), and the resulting TOC was ~18 mg/l and the same result was seen with Baseline System 39 (M4 from the tests) (Figure 47). Samples from these two tests were taken and analysed for toxicity, see Chapter 4.6.
0
200
400
600
800
1000
0 100 200 300 400 500
TOC
; C
OD
(m
g/l)
PAX dosage (ppmv)
TOC filtered COD total COD filtered Poly. (COD total)
0
50
100
150
200
0
200
400
600
800
0 200 400 600
TOC
an
d C
OD
filt
ere
d (
mg/
l)
CO
D t
ota
l (m
g/l)
PAX dosage (ppmv)
SAMPLES FROM 19092012
COD total COD filtered TOC total
Poly. (COD total) Poly. (COD filtered)
Date: 01.11.2012 Page 46 : 53 Report no: 12-039 Version : 1 Dock.ref: BIOWATER-AQUATEAM REPORT MPR WASTE TO SYSTEM
39
Figure 46. Coagulation, flocculation tests with effluent samples from the MBBR unit (19.09.2012) baseline showing optimum PAX dosage from 300 to 500 ppmv.
Figure 47. Results of DAF test carried out using 400 ppmv PAX and 2 ppm Coreshell with adjustment of pH to approximately 7.1 of samples taken from the MBBR units in Train 3 and 4 (M3 and M4) on 19.09 and on samples taken from Train 4 (M4) on 14.09.2012.
4.5. Sludge production
4.5.1. Biological sludge
The calculations of sludge yields for Train 3 are shown in Table 19. In the methanol study calculated yields for Train 2 were 0.19 gTSS/gCOD removed and 0.16 gVSS/gCOD removed (Xin et al., 2012), which are higher than the yields obtained in this study. Due to the short operational time for all the trains in both MPR waste and methanol studies bacterial communities may need more time to adapt changes of chemicals and concentrations in the feed to reach a steady state. We would expect that the yields in the two studies should be very close once the steady state is reached. Although the operational time was short in this
0
50
100
150
200
250
300
10
210
410
610
810
1010
1210
1410
1610
0 100 200 300 400 500 600
TOC
(m
g/l)
CO
D t
ota
l, fi
lte
red
(m
g/l)
PAX dosage (ppmv)
Baseline- Nyhamna
COD total COD filtered TOC total
Log. (TOC total) Poly. (TOC total)
0
50
100
150
200
250
300
350
0
200
400
600
800
1000
1200
1400
Blank M3 M4 M4-14.09
Sample
TOC
, To
t (m
g/l)
CO
D, T
ot,
FC
OD
(m
g/l)
DAF tests
COD. Tot FCOD TOC, tot
Date: 01.11.2012 Page 47 : 53 Report no: 12-039 Version : 1 Dock.ref: BIOWATER-AQUATEAM REPORT MPR WASTE TO SYSTEM
39
study, the sludge yield results indicate that there will not be an increase of sludge production after adding MPR waste to the System 39. In contrast, the amount of sludge to be produced with addition of the MPR waste will go down since the COD in the MPR waste is lower than the COD in buffer tank effluent.
Table 19. Calculation of sludge yield in Train 3.
Period Feed Average
TSS Average
VSS
Average COD
removed
Sludge yield on TSS
Sludge yield on VSS
13th of August – 10th of September
0922+MPR waste
954 mg/d 745 mg/d 3778 mg/d 0.16
gTSS/gCOD removed
0.12 gTSS/gCOD
removed
4.5.2. Microbial community characteristics in the reactors
Water samples (not biofilm on carriers) were taken from each reactor and observed under a microscope. Table 20 summarises characteristics of the suspended microbial community in the reactors. Figure 48 and Figure 49 show microscopic images of microbial communities in the reactors in Train 3 side by side with those in Train 4. There are significant differences between the microbial communities in LSP in Train 3 and in Train 4, which indicates impacts from the synthetic MPR waste. It is not clear why fungal mycelium was abundant in LSP in Train 3. A concern has been raised about whether the MPR waste would deteriorate the microbial community in LSP in a long term operation. The present plan includes routing MPR waste to the System 39 for 30 to 100 days in the concentrations used in our tests. The length of time needed dependent on how fast the MEG can be cleaned. The microbial community is expected to get recovered from the MPR waste impacts once addition of the MPR waste is stopped. Our tests were run for 42 days and MPR waste was added for 38 days. In the MBBR reactors microbial communities look similar with less biomass in Train 3 than in Train 4 (Figure 49). Since the MPR waste is partly degraded and largely diluted in the LSP and the long hydraulic retention time in MBBR, impacts of the MPR waste on the microbial community in Train 3 have been minimised. If we see the LSP and the MBBR as an integrated system, we do not expect that the MPR waste will significantly impact microbial community in the system over a period of 5 weeks.
Table 20. Description of characteristics of the microbial community in the reactors under microscope.
Train 3
LSP 17th of
September
Diverse community, limited protozoa (ciliates) and abundant fungal mycelium, abundant planktonic bacteria and some big, dense flocs without filamentous organisms
MBBR 17th of
September
Healthy community, some protozoa (ciliates), abundant higher living predators (nematodes and rotifer), few planktonic bacteria and most flocs with abundant filamentous organisms
Train 4
LSP 21st of
September
Healthy community, limited protozoa (ciliates) and some fungal mycelium, abundant planktonic bacteria and few flocs with limited filamentous organisms
MBBR 21st of
September
Healthy community, few protozoa (ciliates; Paramecium spp.), some planktonic bacteria and most flocs with abundant filamentous organisms and less diverse community
Date: 01.11.2012 Page 48 : 53 Report no: 12-039 Version : 1 Dock.ref: BIOWATER-AQUATEAM REPORT MPR WASTE TO SYSTEM
39
A. LSP in Train 3 at 100 magnification B. LSP in Train 4 at 100 magnification
C. LSP in Train 3 at 400 magnification D. LSP in Train 4 at 400 magnification
Figure 48. Microscopic images of microbial communities in LSP reactors in Train 3 and Train 4.
A. MBBR in Train 3 at 100 magnification B. MBBR in Train 4 at 100 magnification
Date: 01.11.2012 Page 49 : 53 Report no: 12-039 Version : 1 Dock.ref: BIOWATER-AQUATEAM REPORT MPR WASTE TO SYSTEM
39
C. MBBR in Train 3 at 400 magnification D. MBBR in Train 4 at 400 magnification
Figure 49. Microscopic images of microbial communities in MBBR reactors in Train 3 and 4.
4.5.3. Chemical sludge
Since the amount of coagulant and flocculants are the same when treating MPR waste as for Baseline System 39, no increase in sludge production is expected from the DAF step. The sludge production from chemical precipitation of sludge from the MBBR unit is kept as the same level as when treating normal Ormen Lange produced water. If the COD is reduced when treating MPR waste, the total sludge production can be slightly reduced. It is, however, expected that the operators of the water treatment plant will try to keep the same COD or TOC loading to the MBBR plant and thus the sludge production is expected to be similar when treating MPR as during normal operation.
4.6. Toxicity The toxicity of treated water has been measured using MARA (11 strains of bacteria) and Skeletonema (marine algae). The following samples have been analysed:
The synthetic MPR wastewater (WW) used in our tests – sample from 17.09. Wastewater from Rich MEG regeneration MPR sample 16517 (received from OLL) Effluent from the labtests with the MPR wastewater – sample out of MBBR (train 3)
18.09.2012 Effluent after coagulation and flotation experiments of MBBR effluents of 24.09.2012:
o From Train 3; MBBR effluent from treatment of MPR WW o From Train 4; MBBR effluent from baseline OL System 39 (buffertank water)
Table 21 summarises the measured results, while Figure 50 and Figure 51 shows the individual results. M3 and M4 is water samples taken from the MBBR units of Train 3 (with MPR waste) and Train 4 (Baseline) in the tests. The treated water including MPR waste is low in toxicity, measured with MARA. After coagulation, flocculation and flotation (DAF) the toxicity is even lower, both with respect to MARA and Skeletonema, see Table 21 and Figure 50 and Figure 51. The synthetic MPR wastewater, which contains 587 mg/l CI (corrosion inhibitor) and 217 mg/l SI (scale inhibitor) will be diluted to ~110 mg/l CI and 40 mg/l SI before it enters the LSP unit in System 39. Figure 37 and Figure 38 shows that CI concentrations in this range is stimulating bacterial activity in the MBBR unit. For SI no toxic effects were seen up to 19000 mg/l and stimulation of growth is occurring up to very high concentrations. The concentrations of CI and SI was planned measured in selected samples, see Table 22. The sensitivity of the CI analyses is not very good, and the feed contained 110 mg/l of CI, but
Date: 01.11.2012 Page 50 : 53 Report no: 12-039 Version : 1 Dock.ref: BIOWATER-AQUATEAM REPORT MPR WASTE TO SYSTEM
39
measurements showed < 50 mg/l. The analytical technique is not specific to the chemical, and during biodegradation the amount of different nitrogen compounds will change. The laboratory was not able to analyse SI in produced water samples. Their method was only applicable to MEG.
Table 21. Toxicity results from measuring the toxicity to marine algae (Skeletonema) and bacteria (MARA) of different water samples. M3 and M4 are samples from the Train 3 and 4 MBBRs.
Figure 50. MTC (Mean Toxicity Concentration) in % measured by MARA (11 different strains of bacteria) of different water samples.
Min EC50 EC10Average Min Strain No (%) (%)
DAF sample MPR (M3 effluent) labtest 24092012 nd 0 11 Slightly toxic to some organisms >100 >100nd 0 11 Slightly toxic to some organisms >100 >100
Skeletonema costatumDose Respons curve for MPR flocc, 24.09.12
0
10
20
30
40
50
60
70
80
90
100
0 10 20 30 40 50 60 70 80 90 100
Res
po
ns
(%In
hib
itio
n)
Dose (%)
Skeletonema costatumDose Respons curve for Baseline M4 flocc, 24.09.12
0
10
20
30
40
50
60
70
80
90
100
0 0,1 0,2 0,3 0,4 0,5 0,6 0,7 0,8 0,9 1
Res
po
ns
(%In
hib
itio
n)
Dose (%)
Skeletonema costatumDose Respons curve for MPR , 17.09.12
Date: 01.11.2012 Page 52 : 53 Report no: 12-039 Version : 1 Dock.ref: BIOWATER-AQUATEAM REPORT MPR WASTE TO SYSTEM
39
5. Conclusions and recommendations for further work The following conclusions have been drawn from this study:
Good and stable performance for Train 3 was observed over the testing period of 5 weeks with addition of the synthetic MPR waste. No violation of the discharge permit on TOC and ammonia is expected for the System 39 with addition of MPR waste at the expected maximum concentrations.
Some chemicals were not completely removed in Train 3 and led to higher COD and TOC values in MBBR effluent than those observed in Train 4 (baseline, which simulates normal operation of System 39).
The coagulation, flocculation and flotation tests carried out on biologically treated wastewater indicated improved performance with respect to TOC removal over time (> 30 days), but slightly less removal of TOC compared to the Baseline.
The high concentrations of VFAs from the MPR waste can be removed in System 39. Scale inhibitor and formate encouraged bacterial activities and did not inhibit bacterial
activities at high concentrations (>16000 mg/l). Corrosion inhibitor (CI) encouraged bacterial activities at low concentrations (above
the levels expected from the MPR waste) and inhibited bacterial activities at high concentrations. CI may have contributed to the elevated COD and TOC values in MBBR in Train 3.
No increased sludge production is expected when treating MPR waste in the System 39. The coagulant/flocculants dosages required in the DAF was the same when treating MPR waste as when treating the Baseline water of System 39.
The buffer capacity of the water increased when treating MPR wastewater, and focus needs to be on the impact on chemical precipitation in the DAF. In the laboratory tests, pH adjustment was needed.
Significant impact of the MPR waste on microbial community in LSP in Train 3 was observed but no significant impacts of the MPR waste was observed on microbial community in MBBR in Train 3. If considering the LSP and the MBBR reactors as an integrated system, we do not expect that the MPR waste will significantly impact the biological system over a period of 5 weeks, but if MPR waste needs to be added over a 100 day period, the impact on the microbial community could be altered, and should be controlled during the operation of System 39 treating the MPR waste.
The MPR wastewater is toxic to marine algae and bacteria, and it contains ~110 ppm of CI and ~40 ppm SI, and should therefore be treated before discharged. The biological treatment plant on Nyhamna (System 39) is able to treat the water and reduce the toxicity to the same level as the baseline; the existing operation.
However, the following uncertainties and possible future work are foreseen with addition of the MPR waste to the buffer tank effluent:
It is extremely important to ensure a healthy microbial community in MBBR tanks in the System 39 before adding MPR wastes to the buffer tank. Biological activities should be evaluated (e.g. using OUR tests) in MBBR tanks during the days before MPR waste addition starts.
It is likely that addition of MPR waste will increase the buffer capacity of the water in the buffertank and that pH adjustment might be necessary to get good performance of the DAF system during treatment of the MPR wastewater.
The behaviour of the CI in the System 39 is not fully understood. A few analyses of the CI concentrations in the feed and in MBBR in Train 3 were carried out in this study. The method applied was, however, not sufficiently accurate. Both the feed and treated water was reported to have < 50 ppm of CI, in spite of the fact that the feed contained > 100 ppm. Too high concentrations of CI could be toxic to the system and
Date: 01.11.2012 Page 53 : 53 Report no: 12-039 Version : 1 Dock.ref: BIOWATER-AQUATEAM REPORT MPR WASTE TO SYSTEM
39
we believe that some of the difficult degraded carbon left in the effluent of the MBBR could be residuals from the CI.
Since monitoring MPR waste treatment in the System 39 will create additional work for the Nyhamna personnel, challenges are foreseen with existing personnel to closely monitor the System 39 performance when MPR waste addition occurs. It is strongly recommended that a detailed monitoring plan should be established well ahead to cover all necessary concerns, such as CI concentration, levels of nitrification and nutrients addition, and the plan should be well executed.
A slight increase in effluent TOC is expected in the initial period of treating MPR waste. It is possible that this will improve over time.
No increased toxicity is expected in the effluent from System 39 when treating MPR waste, but this should be controlled.
6. References Iversen, L. and Andersen, E. (2009): Laboratory Test Report. Ormen Lange Water Treatment Optimization. Flotation and Sludge Dewatering Optimization Laboratory Test. MI Swaco Memo 20-24.04.2012. Xin, G., Vik, E. A., Rusten, B., Bruskeland, A. B. and Siljudalen, J. (2012). Nyhamna expansion project - impact of introducing methanol to the MBBR system on Nyhamna. Aquateam report No. 12-038.