Page 1
HAL Id: hal-00303172https://hal.archives-ouvertes.fr/hal-00303172
Submitted on 13 Nov 2007
HAL is a multi-disciplinary open accessarchive for the deposit and dissemination of sci-entific research documents, whether they are pub-lished or not. The documents may come fromteaching and research institutions in France orabroad, or from public or private research centers.
L’archive ouverte pluridisciplinaire HAL, estdestinée au dépôt et à la diffusion de documentsscientifiques de niveau recherche, publiés ou non,émanant des établissements d’enseignement et derecherche français ou étrangers, des laboratoirespublics ou privés.
Impact of upper-level jet-generated inertia-gravity waveson surface wind and precipitation
C. Zülicke, D. H. W. Peters
To cite this version:C. Zülicke, D. H. W. Peters. Impact of upper-level jet-generated inertia-gravity waves on surface windand precipitation. Atmospheric Chemistry and Physics Discussions, European Geosciences Union,2007, 7 (6), pp.15873-15909. �hal-00303172�
Page 2
ACPD
7, 15873–15909, 2007
Impact of
inertia-gravity waves
on wind and
precipitation
C. Zulicke and D. Peters
Title Page
Abstract Introduction
Conclusions References
Tables Figures
◭ ◮
◭ ◮
Back Close
Full Screen / Esc
Printer-friendly Version
Interactive Discussion
EGU
Atmos. Chem. Phys. Discuss., 7, 15873–15909, 2007
www.atmos-chem-phys-discuss.net/7/15873/2007/
© Author(s) 2007. This work is licensed
under a Creative Commons License.
AtmosphericChemistry
and PhysicsDiscussions
Impact of upper-level jet-generated
inertia-gravity waves on surface wind and
precipitation
C. Zulicke1,*
and D. H. W. Peters1
1Leibniz Institute of Atmospheric Physics, Kuhlungsborn, Germany
*now at: Leibniz Institute for Baltic Sea Research, Warnemunde, Germany
Received: 1 October 2007 – Accepted: 6 November 2007 – Published: 13 November 2007
Correspondence to: C. Zulicke ([email protected] )
15873
Page 3
ACPD
7, 15873–15909, 2007
Impact of
inertia-gravity waves
on wind and
precipitation
C. Zulicke and D. Peters
Title Page
Abstract Introduction
Conclusions References
Tables Figures
◭ ◮
◭ ◮
Back Close
Full Screen / Esc
Printer-friendly Version
Interactive Discussion
EGU
Abstract
A meteorological case study for the impact of inertia-gravity waves on surface meteo-
rology is presented. The large-scale environment from 17 to 19 December 1999 was
dominated by a poleward breaking Rossby wave transporting subtropical air over the
North Atlantic Ocean upward and north-eastward. The synoptic situation was char-5
acterized with an upper tropospheric jet streak passing Northern Europe. The unbal-
anced jet spontaneously radiated inertia-gravity waves from its exit region. Near-inertial
waves appeared with a horizontal wavelength of about 200 km and an apparent period
of about 12 h. These waves transported energy downwards and interacted with large-
scale convection.10
This configuration is simulated with the nonhydrostatic Fifth-Generation Mesoscale
Model. Together with simplified runs without orography and moisture it is demonstrated
that the imbalance of the jet (detected with the cross-stream ageostrophic wind) and
the deep convection (quantified with the latent heat release) are forcing inertia-gravity
waves. This interaction is especially pronounced when the upper tropospheric jet is15
located above a cold front at the surface and supports deep frontal convection. Weak
indication was found for triggering post-frontal convection by inertia-gravity waves.
The realism of model simulations was studied in an extended validation study for the
Baltic Sea region. It included observations from radar (DWDPI, BALTRAD), satellite
(GFZGPS), weather stations (DWDMI) and assimilated products (ELDAS, MESAN).20
The detected spatio-temporal patterns show wind pulsations and precipitation events at
scales corresponding to those of inertia-gravity waves. In particular, the robust features
of strong wind and enhanced precipitation near the front appeared with nearly the same
amplitudes as in the model. In some datasets we found indication for periodic variations
in the post-frontal region.25
These findings demonstrate the impact of upper tropospheric jet-generated inertia-
gravity waves on the dynamics of the boundary layer. It also gives confidence to mod-
els, observations and assimilation products for covering such processes. In an applica-
15874
Page 4
ACPD
7, 15873–15909, 2007
Impact of
inertia-gravity waves
on wind and
precipitation
C. Zulicke and D. Peters
Title Page
Abstract Introduction
Conclusions References
Tables Figures
◭ ◮
◭ ◮
Back Close
Full Screen / Esc
Printer-friendly Version
Interactive Discussion
EGU
tion for the Gotland Basin in the Baltic Sea, the implications of such mesoscale events
on air-sea interaction and energy and water budgets are discussed.
1 Introduction
Inertia-gravity waves (IGW for short) are sub-synoptic features of the atmospheric dy-
namics. During their evolution, IGWs propagate signals over relatively long distances,5
both in the horizontal and vertical. Consequently, regional weather events may be
linked to processes in the upper levels of the atmosphere. They are essential for the
mean global circulation of the middle atmosphere (e.g. Fritts and Alexander, 2003;
Holton, 1992). In the lower troposphere, regional weather events such as wind gusts
or deep convection are sometimes closely connected with IGWs (Bosart and Cussen,10
1973; Uccellini, 1975; Bosart et al., 1998). Local fluctuations due to IGWs may modu-
late the wind field, which drives the air-sea exchange and mixing of the surface water.
The influence of upper tropospheric jet-generated IGWs on moist convection is another
aspect, which may lead to sudden large rates of rainfall. Compilations of precipitation
observations for the Baltic Sea region. Rutgersson et al. (2001) show, that different15
methods scatter by 10–20% on a monthly and basin-wide scale. The major reason
for this uncertainty is the spatio-temporal variability of precipitation. The study of IGW
dynamics could attribute to an improved understanding of the space and time scales
of such precipitation events.
The appearance of IGWs on the planetary scale has been related to the life cycle of20
baroclinic Rossby waves by O’Sullivan and Dunkerton (1995). In their in experiments
with a global circulation model increase IGW activity was found at the north-western
ridge of a poleward breaking Rossby wave (abbreviated with RWB). Such a situation
is often present in winter time over the North Atlantic Ocean/European region. It is as-
sociated with the transport of warm and moist subtropical air into polar regions (Peters25
and Waugh, 1996). Accordingly, there are locations with especially sharp gradients
between subtropical and polar air masses. This induces not only increased cyclonic
15875
Page 5
ACPD
7, 15873–15909, 2007
Impact of
inertia-gravity waves
on wind and
precipitation
C. Zulicke and D. Peters
Title Page
Abstract Introduction
Conclusions References
Tables Figures
◭ ◮
◭ ◮
Back Close
Full Screen / Esc
Printer-friendly Version
Interactive Discussion
EGU
activity, but also jet streaks in the tropopause region. Uccellini and Koch (1987) have
figured out, in situations with a warm front located just beneath the exit region of such
an upper tropospheric jet strong IGW activity may be expected.
In such configurations IGWs have occasionally been observed (Guest et al., 2000;
Plougonven et al., 2003; Thomas et al., 1999; Peters et al., 2003; Zulicke and Peters,5
2007), but systematic studies of their impact on the regional weather are rare. The Co-
operative Convective Precipitation Experiment (CCOPE), conducted 1981 in the Rocky
Mountains (Koch and Golus, 1988), was one outstanding field experiment. Based on
the mesoscale observation network with a station distance of 7 km a conceptual model
has been developed, which allocates the position of deep convection in a traveling IGW.10
The upward velocity fluctuations associated with the IGW induce additional updrafts,
which may initiate deep convection in a conditionally unstable environment. In turn, the
convective dynamics may serve as an IGW source and establishes a kind of feed-back
to the triggering IGW.
The quantification of this conceptual model requires the identification of the relevant15
processes and the diagnosis of suitable measures for IGW effects. A large variety of
processes may serve as IGW source: this is unbalanced jet streaks, frontal systems,
convection and orography. In situations with a RWB, imbalances in the exit regions of
upper tropospheric jet streak may spontaneously radiate IGWs. The source intensity of
such jet-generated IGWs can be quantified with the Lagrangian wind speed tendency20
(Zhang et al., 2000). For the description of IGWs during moist convection different
processes are discussed: adiabatic heating, nonlinear advection, flow deformation by
convective cloud towers (the so-called “obstacle effect” or “moving mountain effect”),
oscillations of air parcels around their level of neutral buoyancy or nonstationarity of
the heat sources (Lane et al., 2001; Alexander and Holton, 2004). A joint description25
of both upper tropospheric jets and moist convection including the role of IGWs is still
pending. Both generation processes contribute to the IGW in the upper atmospheric
layers. Zulicke and Peters (2006) found in a case study that 36% of the stratospheric
IGW activity was related to the upper tropospheric jet and 26% to moist convection.
15876
Page 6
ACPD
7, 15873–15909, 2007
Impact of
inertia-gravity waves
on wind and
precipitation
C. Zulicke and D. Peters
Title Page
Abstract Introduction
Conclusions References
Tables Figures
◭ ◮
◭ ◮
Back Close
Full Screen / Esc
Printer-friendly Version
Interactive Discussion
EGU
The proper quantitative description of IGWs is important for global circulation models,
which do not resolve the complete IGW spectrum (Kim et al., 2003). Hence, the high-
frequency part of the IGW spectrum must be taken into account with parameterizations.
In order to formulate them properly, observational data and well-validated numerical
simulations are required.5
Mesoscale numerical modeling on the regional scale has proven capability to simu-
late IGW generation induced by the upper tropospheric jet (Zhang, 2004; Zulicke and
Peters, 2006), convection and fronts (Reeder and Griffiths, 1996; Lane et al., 2001,
2004) in process studies. The advantage of using regional nested models is the possi-
bility to cover scales over order of magnitudes with a successive increasing resolution10
from domain to domain. In a case study with a high-resolution mesoscale model the
simulations were validated with upper air radiosonde observations. A corresponding
validation exercise on IGW amplitudes in the surface layer is required and another aim
of this study.
In a case study a poleward RWB event was observed and modeled, which took place15
over the North-European/Baltic Sea region from 17 to 19 December 1999 (Peters et
al., 2003; Zulicke and Peters, 2006). Here, we focus on the process of IGW gener-
ation from the upper tropospheric jet, their downward propagation and impact on the
boundary layer over the Baltic Sea. The Southern Baltic is supposed to be a place
with especially intense jet-generated IGWs. This is due to the location of the upper20
tropospheric jet streak over northern Europe with its exit region over the Mecklenburg
Bight while mountain waves are unimportant for this westerly flow. The chance to sam-
ple IGWs and related effects in the wind and precipitation fields is high in the Baltic
Sea region because of the dense observational network. Lots of data are available
from radar, satellite and automated weather stations around the coast. Data assimi-25
lation to circulation models is a tool to generate meteorological fields over the ocean,
where observations are sparse in comparison with land. A detailed inter-comparison
of mesoscale models Jacob et al. (2001) indicated that the scattered and localized
appearance of convective precipitation is difficult to be taken into account. The study
15877
Page 7
ACPD
7, 15873–15909, 2007
Impact of
inertia-gravity waves
on wind and
precipitation
C. Zulicke and D. Peters
Title Page
Abstract Introduction
Conclusions References
Tables Figures
◭ ◮
◭ ◮
Back Close
Full Screen / Esc
Printer-friendly Version
Interactive Discussion
EGU
of IGW dynamics in the frame of upper tropospheric jet streaks and moist convection
could attribute to an improved understanding of the space and time scales of such
precipitation events. The joint analysis of observations and simulations is expected to
confirm the relevance of IGWs and to validate the methods.
The paper is organized as follows: Sect. 2 is devoted to the introduction of the5
data base including a sketch of the meteorological situation, analyses, radar, satel-
lite, weather station data and assimilated products. Spatio-temporal patterns of IGWs
and related wind pulsations and precipitation events are subject of Sect. 3. It includes
detailed process studies, diagnosis of simulations, observations and assimilations and
their mutual validation. The discussion in Sect. 4 focuses on the numerical simula-10
tion and observation of IGWs, the interaction between IGWs and convection, and their
consequences for air-sea exchange. A summary is presented in the final section.
2 Data base and meteorological background
2.1 ECMWF analyses (ECANA)
ECMWF analyses are generated with the Integrated Forecast System with a reso-15
lution of T319L60 corresponding to ∆s(ECANA) ∼63 km and ∆z(ECANA) ∼640 m at
tropopause levels. They have been extracted from archive each 6 h with full horizon-
tal resolution on 21 levels between 1000 and 1 hPa. These data contained standard
meteorological parameters including water vapor mixing ratio but no precipitation rates.
2.2 Meteorological background20
From 17 to 19 December 1999 a field campaign was run at Kuhlungsborn (54.1◦N,
11.8◦E), which aimed to highlight the relation between RWB and IGWs in the strato-
sphere (see Fig. 1a). The synoptic situation during this time is exemplified with ECANA
data. In a map of the mean sea level pressure (pslv, Fig. 1b) a large high-pressure cen-
tre with 1036 hPa is located over the North-East Atlantic Ocean. At its northern ridge,25
15878
Page 8
ACPD
7, 15873–15909, 2007
Impact of
inertia-gravity waves
on wind and
precipitation
C. Zulicke and D. Peters
Title Page
Abstract Introduction
Conclusions References
Tables Figures
◭ ◮
◭ ◮
Back Close
Full Screen / Esc
Printer-friendly Version
Interactive Discussion
EGU
subtropical warm and moist air is advected to Northern Europe. It forms an extended
front moving into south-eastern direction as can be seen in the 500 hPa map of water
vapor mixing ratio (qv ). This process is also related to increased gradients in poten-
tial vorticity at higher atmospheric levels. At the 300 hPa pressure surface (Fig. 1c)
strong jets are found along these air mass boundaries and a minimum in Ertel poten-5
tial vorticity (EPV) of about 0.50 practical vorticity units (PVU=K kg−1
m2
s−1
) at 330 K.
Such configuration is typical for a poleward RWB (Peters and Waugh, 1996). A west-
erly jet streak is found over the North-East Atlantic Ocean with more then 60 m s−1
wind speed (uh) in its centre. This upper tropospheric jet has its exit region just above
the Southern Baltic, thus favoring the generation of IGWs in this region (Uccellini and10
Koch, 1987). A high of upper tropospheric EPV of about 7.4 PVU is found at (65◦N,
40◦E), corresponding to a surface pressure low of about 965 hPa. Both PV anoma-
lies are influencing the Großwetterlage (synoptic situation) of the following days over
North-Western Europe. Starting with 00:00 UTC 17 December 1999, cold and dry air
of polar origin is present. During this day, warm and moist air is taking over, which has15
been advected from the subtropics along northern edge of the Atlantic high including
the passage of a large-scale warm front from the West. This phase ends with a cold
front arrival at about 12:00 UTC 17 December 1999. A second phase with advection of
Atlantic air from westerly directions starts at about 06:00 UTC 18 December 1999 and
extends until 00:00 UTC 19 December 1999, when a change to northerly winds takes20
place.
2.3 Fifth generation Mesoscale Model (MM5)
The Fifth-Generation Mesoscale Model (MM5) has been set up in order to simulate
IGWs, their generation, propagation and dissipation, including the effect on the local
weather. The MM5 was developed by NCAR (Boulder, Colorado) and the Pennsylvania25
State University (Dudhia, 1993; Grell et al., 1995). It integrates the nonhydrostatic dy-
namics and is implemented on a staggered grid. The high-resolution run (referred to as
“MM5”) has been set up as follows: Three nested domains have been defined Fig. 1a),
15879
Page 9
ACPD
7, 15873–15909, 2007
Impact of
inertia-gravity waves
on wind and
precipitation
C. Zulicke and D. Peters
Title Page
Abstract Introduction
Conclusions References
Tables Figures
◭ ◮
◭ ◮
Back Close
Full Screen / Esc
Printer-friendly Version
Interactive Discussion
EGU
which cover an area of about 9000 km×7000 km. The domains have a horizontal res-
olution of ∆s(MM5)=72/24/8 km and a vertical resolution of ∆z(MM5)=100 m. For the
parameterization of subgrid physical processes the planetary boundary layer module
from the Medium-Range Forecast Model was used, Grell-parameterization of cumulus
convection and a Dudhia ice scheme for the microphysics. The model was started at5
00:00 UTC 16 December 1999. For the construction of initial and boundary conditions
ECMWF analyses were used. They were provided at the lower and lateral boundaries
of the largest domain – no data assimilation in the model interior was involved. Hourly
model output is used for the present study.
For a process study idealized runs have been set up: with and without moisture and10
latent heating (MM5WET and MM5DRY). Both were run with two domains and medium
resolution (∆s(MM5WET, MM5DRY)=72/24 km and ∆z(MM5WET, MM5DRY)=250 m).
The terrain height was set to Zero.
2.4 Mesoscale Analysis System (MESAN)
The Mesoscale Analysis System (MESAN) has been developed at the Swedish Me-15
teorological and Hydrological Institute (Haggmark et al., 2000). It uses the optimal
interpolation technique to generate merged analyses from radars, automatic and syn-
optic stations, satellites and first guess fields from the High-Resolution Regional Model
(HIRLAM). The HIRLAM data have been generated with a horizontal resolution of
∆s(HIRLAM)≈44 km and 31 levels corresponding to ∆z(HIRLAM)≈550 m. The MESAN20
system is in operation since October 1996 and provides hourly data on a 22 km grid.
2.5 European Land Data Assimilation System (ELDAS)
In the frame of the European Land Data Assimilation System (ELDAS) precipitation
fields have been created for the Baltic Sea region (Rubel, 2004). Observations from
20 000 rain gauges and radar imagery from the Central European Radar Network25
(CERAD) and the Baltic Radar Network (BALTRAD) are analyzed with the Precipitation
15880
Page 10
ACPD
7, 15873–15909, 2007
Impact of
inertia-gravity waves
on wind and
precipitation
C. Zulicke and D. Peters
Title Page
Abstract Introduction
Conclusions References
Tables Figures
◭ ◮
◭ ◮
Back Close
Full Screen / Esc
Printer-friendly Version
Interactive Discussion
EGU
Correction and Analysis (PCA) model (Rubel and Hantel, 2001). For background data
an experimental ECMWF 40-year Reanalysis Project (ERA40) run with T159L60 spec-
tral resolution has been used. This corresponds to a resolution of ∆s(ERA40)≈126 km
and ∆z(ERA40)≈640 m. Data are available from October 1999 to December 2000
every 3 h on a 0.2 latitude/longitude grid (∆s(ELDAS)≈22 km).5
2.6 BALTEX radar network (BALTRAD)
BALTRAD is the radar network for the Baltic Sea Experiment (BALTEX) (Koistinen
and Michelson, 2002). It is in operation since October 1999 and provides radar re-
flectivity composites with 2 km resolution each 15 min together with 3-and 12-hourly
accumulated precipitation. The data base is formed from about 30 weather radars in10
Norway, Sweden, Finland, Denmark, Germany and Poland. After a quality control, the
pixel closest to the earth surface is taken for the reflectivity composite. Precipitation
rates are estimated using a gauge-to-radar ratio which is determined every 12 h. The
gauges are systematically corrected with the Dynamic Correction Model (Michelson
and Koistinen, 2000) accounting for flow distorsion and instrument-specific corrections15
using background data from MESAN.
2.7 DWD international radar composites (DWDPI)
An international radar composite is compiled by the Deutsche Wetterdienst (DWD)
from local radar images from Brussels (Belgium) and Romo (Denmark) together with
images from Germany, Austria, Switzerland, France, the Netherlands, Great Britain20
and the Czech Republic (DWD, 2006). For the composite the value nearest to ground
is taken. It is provided with 4 km resolution every 15 min.
2.8 GFZ GPS atmosphere soundings (GFZGPS)
GPS (Global Positioning System) data of a German ground receiver network are used
to derive vertically integrated water vapor above the relevant location (e.g. Gendt et25
15881
Page 11
ACPD
7, 15873–15909, 2007
Impact of
inertia-gravity waves
on wind and
precipitation
C. Zulicke and D. Peters
Title Page
Abstract Introduction
Conclusions References
Tables Figures
◭ ◮
◭ ◮
Back Close
Full Screen / Esc
Printer-friendly Version
Interactive Discussion
EGU
al., 2004). The data are operationally processed; corresponding analysis results are
provided by GFZ. Currently (as of mid 2007) about 220 stations are included in the
processing. The GPS atmosphere sounding activities started at GFZ within the Ger-
man Helmholtz Association’s strategy fund project GASP (GPS Atmosphere Sounding
Project (see, e.g., Reigber et al., 2002). For the December 1999 campaign hourly5
GFZGPS data were available for Warnemunde (54.2◦N, 12.1
◦E) and five more Ger-
man stations.
2.9 DWD MIRIAM/AFMS2 automated weather stations (DWDMI)
For validation purposes, wind and precipitation data from MIRIAM/AFMS2 automated
weather stations from the DWD were used. These were available every 10 min from10
214 German stations including Warnemunde.
3 Results
3.1 MM5 simulation of IGW patterns
A snapshot from the MM5 simulation for 18:00 UTC 17 December 1999 is discussed in
the following. The dense geopotential height contours induce a jet streak at 300 hPa,15
approaching the Baltic Sea from west (see Fig. 2a). The arriving air masses are of
subtropical origin and have been advected at the north-eastern edge of the high-
pressure centre in the North-Atlantic (see Fig. 1b). Perpendicular to the major wind
direction an extended band of height-integrated precipitable water (including rain, snow
and graupel, Wp=∫dz qp) is found, which is denoted with C2 (convective event num-20
ber two, at distance s≈1750 km). Along a cross section through Warnemunde two
other localized precipitable water clusters are found (C3 and C4) (see Fig. 2b). While
the C2 event near Warnemunde (at s≈1700 km) extends as high as 5 km, the event
C3 (at s≈1200 km) contains more precipitable water but is more localized and C4 (at
15882
Page 12
ACPD
7, 15873–15909, 2007
Impact of
inertia-gravity waves
on wind and
precipitation
C. Zulicke and D. Peters
Title Page
Abstract Introduction
Conclusions References
Tables Figures
◭ ◮
◭ ◮
Back Close
Full Screen / Esc
Printer-friendly Version
Interactive Discussion
EGU
s≈400 km) is even weaker and smaller. It is noteworthy, that a smaller band with pre-
cipitable water is found in the wake of the big front, which appears in the cross section
at s≈1600 km.
In order to resolve possible relations between the upper-level jet streak and the
surface wind and precipitation patterns IGW structures are shown in a 300 hPa map5
(Fig. 2c) and the Warnemunde cross section (Fig. 2d). A complex three-dimensional
structure is appearing in the horizontal divergence (δ=∂u/∂x+∂v/∂y), which is used
to indicate the IGWs. Localized regions with short horizontal and long vertical wave-
length can be found above mountains. In the map these are Greenland (65–70◦N,
15–20◦W), the Scottish highlands (55–60
◦N, 0–10
◦W), the Scandinavian ridge (60–10
65◦N, 5–10
◦E) and the Alps (45–52
◦N, 5–20
◦E). Patterns over the Scottish Highlands
are also contained in the cross section (Fig. 2d) and are denoted with M (for mountain
waves). The three convection events show also in the divergence structures, especially
clear for C3: this is a zone of convergence (δ<0) below 2 km height and a zone of di-
vergence (δ>0) between 2 and 6 km) with maximal amplitudes of δ≈8×10⁻⁵
s−1
. It is15
also interesting to note, that there appears a tower of downward sloping phase lines
right above C3, similar to the mountain waves. A third class of waves appears as a
combination of downward inclined phases in the stratosphere and upward inclined in
the troposphere. These IGWs appear more clearly after smoothing the divergence over
100 km (see Fig. 2e and f). Three of such jet-generated IGWs can be found in Fig. 2f at20
the upper tropospheric jet level (height z≈9 km) at s≈2100 km, 1750 km and 1250 km
and are denoted with J2, J3 and J4. Solid lines along regions with positive divergence
(δ>0) suggest a connection between the jet and wave-like structure above and below.
In the stratosphere five crests can be found in the height region z≈13–17 km between
J2 and J4. They suggest a horizontal wavelength of λh(MM5)≈220 km and a vertical25
wavelength of λz(MM5)≈3.6 km. Using the dispersion relation for hydrostatic inertia-
15883
Page 13
ACPD
7, 15873–15909, 2007
Impact of
inertia-gravity waves
on wind and
precipitation
C. Zulicke and D. Peters
Title Page
Abstract Introduction
Conclusions References
Tables Figures
◭ ◮
◭ ◮
Back Close
Full Screen / Esc
Printer-friendly Version
Interactive Discussion
EGU
gravity waves the intrinsic frequency of
ωi =
(
f 2+ N2
k2h
k2z
)1/2
≈2π
7.1 h(MM5) (1)
can be estimated (f=1.4×10⁻⁴
s−1
, N=1.2×10⁻²
s−1
). For a mean tropospheric wind
in IGW direction of u||=(kxu+kyv)/kh ≈−15 m s−1
the Doppler relation
ωa = ωi + khu|| ≈ −2π
9.3 h(MM5) (2)5
determines the apparent period. These numbers are similar to those found in Zulicke
and Peters (2006), where imbalances in the upper tropospheric jet exit region have
been identified as their energy source. Inspection of the tropospheric divergence pat-
terns shows that not all stratospheric J-patterns reach the surface. Forward inclined
positive phases are found for J4 which are in positive interference with the divergent10
zone of C3 at (s≈1100 km, z≈4.5 km). Some of the forward inclined positive phase
lines of J2 and J3 seem to be cut by backward inclined negative phase lines. The
latter have a V-shaped form localized around s≈1800 km and 1600 km and could be
attributed to convective of frontal activity.
3.2 MM5 simulation of IGW processes15
In order to resolve this complex pattern idealized MM5 simulations have been per-
formed. The MM5 was run with medium resolution to keep the computational effort
down and without topography to exclude the formation of mountain waves. For the iso-
lation of convective processes, the model was run dry (without any moisture, MM5DRY)
and wet (with moisture and microphysics including latent heat release, MM5WET).20
The 100-km-smoothed divergence is shown for a cross section through the dry run
in Fig. 3a (MM5DRY). For a quantitative interpretation the cross-stream ageostrophic
15884
Page 14
ACPD
7, 15873–15909, 2007
Impact of
inertia-gravity waves
on wind and
precipitation
C. Zulicke and D. Peters
Title Page
Abstract Introduction
Conclusions References
Tables Figures
◭ ◮
◭ ◮
Back Close
Full Screen / Esc
Printer-friendly Version
Interactive Discussion
EGU
wind
u∗ =uavg − vaug
(
u2g + v2
g
)1/2= −
1
f
duh,g
dt(3)
is superimposed. It is closely associated to the tendency of the geostrophic wind speed
(uh,g = (u2g + v2
g )1/2
) and serves as a measure for the imbalance of the jet streak. The
maximal value of u∗(MM5DRY)≈3.5 m s−1
can be associated with a divergence over5
the extension of the imbalance (L∗≈217 km) as
δ∗ (jet) ∝u∗
L∗
(4)
For the dry run a value of jet-generated divergence δ∗(jet, MM5DRY)≈1.6×10⁻⁵
s−1
can be estimated which lies in the order of simulated amplitudes
(δ(MM5DRY)≈3.3×10⁻⁵
s−1
).10
A similar investigation was done for the MM5WET run (Fig. 3b). It is obvious
that the overall divergences have been amplified. The intensity of moist convec-
tion has been quantified with the latent heat release Q∗. Three events exceeding
Q∗=0.5 K h−1
are found at s≈760, 1150 and 1600 km. The most intense event with
Q∗(MM5WET)≈1.3 K h−1
seems to be in positive interference with J3, as discussed15
with Fig. 2f. An estimate of the convection-generated divergence can be obtained as
follows: The latent heating induces an upwind (w∗) over a vertical temperature gradient
∂Θ0
∂z∝ N2
Θ0
g≈ 3.7 K km−1 (5)
which gives rise to convergence/divergence over the height of the convection cell of H∗.
An estimate of20
δ∗ (con) ∝2Q∗
H∗
(
∂T0
/
∂z)≈ 3.3 × 10⁻⁵ s−1(MM5WET) (6)
15885
Page 15
ACPD
7, 15873–15909, 2007
Impact of
inertia-gravity waves
on wind and
precipitation
C. Zulicke and D. Peters
Title Page
Abstract Introduction
Conclusions References
Tables Figures
◭ ◮
◭ ◮
Back Close
Full Screen / Esc
Printer-friendly Version
Interactive Discussion
EGU
is found with the background temperature Θ0=250 K, gravitational acceleration
g=9.8 m s−2
and H∗=6 km. The imbalances in the upper tropospheric jet exit re-
gion appear to be slightly increased (u∗(jet, MM5WET)≈3.9 m s−1
) and give rise to
jet-generated imbalances in the order of δ∗(jet, MM5WET)≈1.8×10⁻⁵
s−1
. Hence, to-
gether with the convection-generated divergences δ∗(MM5WET)≈5.1×10⁻⁵
s−1
can be5
expected as an highest value. Indeed, in the troposphere the simulated divergence
shows values up to δ(MM5WET)≈6.4×10⁻⁵
s−1
which is in the order of this estimate.
The initiation of convection by jet-generated IGWs is discussed next. As in Fig. 2f,
the three jet-generated IGWs J4, J3 and J2 (indicated with solid lines) reach the surface
the dry run (Fig. 3a) at s≈250, 500 and 1500 km. Again, two V-shaped patterns can10
be found (at s≈1750 and 2000 km). Slightly upstream of these positions the stronger
convection events are found.
The jet-generated waves have some impact on the stratification, which is displayed
in Fig. 3c for the MM5DRY run. Near the surface, regions of negative vertical gradients
of potential temperature (∂Θ/∂z<0) can be found between s=0–500, 700–1150 and at15
about 1350 km (indicated with I1, I2 and I3), where dry convection may set on. A region
of decreased stability (∂Θ/∂z<3 K km−1
) at a height of z=3 km can also be found be-
tween s=1050–1550 km. Using polarization relations it can be shown, that IGWs with
a divergence of δ’(MM5DRY)=3.3×10⁻⁵
s−1
are associated with temperature fluctua-
tions of20
T ′ ∝ T0δ′ N2
ωikzg≈ 0.13 K(MM5DRY) (7)
Corresponding vertical temperature gradients are of the order of
∂T ′
∂z∝ kzT
′ ≈ 0.50 K km−1(MM5DRY) (8)
This is still smaller than the simulated variations of about ±1.0 K km−1
.
Another mechanism would be the excitation of convection lifting the saturated air25
parcel above the condensation level. Corresponding patterns of vertical velocity are
15886
Page 16
ACPD
7, 15873–15909, 2007
Impact of
inertia-gravity waves
on wind and
precipitation
C. Zulicke and D. Peters
Title Page
Abstract Introduction
Conclusions References
Tables Figures
◭ ◮
◭ ◮
Back Close
Full Screen / Esc
Printer-friendly Version
Interactive Discussion
EGU
shown in Fig. 3d with four phases of surface near upwind indicated with U1, U2, U3
and U4. On the large scale, the air is lifted due to the propagation of a cold front.
Near the surface upwind regions are found at s=350–450 km, 1050–1450 and 1550–
2150 km which could be the result of large-scale air mass lifting and superimposed jet-
and front-generated IGW patterns. Vertical velocity fluctuations associated with the5
IGW can be estimated as
w ′ ∝δ′
kz≈ 1.9 cm s−1(MM5DRY) (9)
This is well in the order of the upwind patterns which are well-aligned to the positive
divergences indicated with J2, J3 and J4.
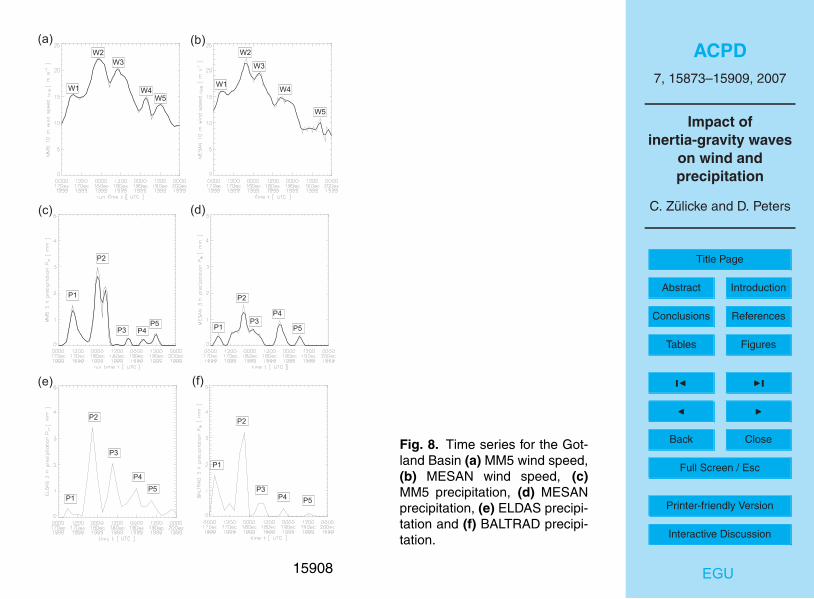
3.3 Validation of surface wind pulsations10
In this section, the MM5 simulations are validated against observations of the 10 m
wind speed (uh,10) at Warnemunde (WMD).
Inspection of the time series of MM5 (Fig. 4a) shows a very strong surface wind pulse
during the passage of a cold front at 18:00 UTC 17 December 1999 (labeled W2). The
peak value for the wind of uh,10(WMD, MM5)=20 m s−1
coincides with the arrival of an15
IGW. Belonging to this event a velocity fluctuation of uh’(WMD, MM5)=3–4 m s−1
can
be estimated from the peak-to-peak difference. This number well corresponds to the
maximum divergence δ’(MM5)=8×10⁻⁵
s−1
from the high-resolution run (Fig. 2c, d) as
may be verified with the relation
u′h∝
δ′
kh≈ 2.8 m s−1(MM5) (10)20
Beside the strong peak W2 four weaker fluctuations may be found in the 3 h smoothed
data: at 01:00 UTC 17 December (W1), 05:00 UTC 18 December (W3), 00:00 and
07:00 UTC 19 December 1999 (W4 and W5).
15887
Page 17
ACPD
7, 15873–15909, 2007
Impact of
inertia-gravity waves
on wind and
precipitation
C. Zulicke and D. Peters
Title Page
Abstract Introduction
Conclusions References
Tables Figures
◭ ◮
◭ ◮
Back Close
Full Screen / Esc
Printer-friendly Version
Interactive Discussion
EGU
A similar time series appears in the MESAN data (Fig. 4b). While the W2 event
appears with nearly the same amplitude and time, the amplitude and times for W3 and
W4 differ slightly, and W5 comes up at the same time as in the MM5 time series. The
MESAN data do not contain the first MM5 wind event (W1).
The observed wind speed time series from DWDMI data set is shown in Fig. 3c. It5
shows a sequence of wind pulses (W2, W3 and W4). The first wind pulse of DWDMI
is contained in both MM5 and MESAN, but with smaller amplitude. The timing of the
DWDMI wind pulses is the same as in MESAN. Keeping in mind, that an exact cor-
respondence in time and space between local observation and modeled/assimilated
data cannot be expected, the time series of Kap Arkona (ARK, 54.7◦N, 13.4
◦E) is10
shown in Fig. 4d). For this DWDMI position, the correspondence to MM5 time se-
ries for Warnemunde is nearly perfect. This concerns the timing of the pulses and in
particular the amplitude of W1.
3.4 Correspondence to radar- and satellite-derived patterns
In this section patterns of remotely sensed fields of high spatial and temporal resolution15
are analyzed for IGW structures.
Patterns of radar reflectivity (Z) from the BALTRAD data set are shown in Fig. 5a
and b. Strong signals are found at about 12:00 UTC 17 December 1999 (labeled
with P2′
like quasi-precipitation event number 2), which show up in the map as a
double-structure. This well compares with the precipitable water in the MM5 simu-20
lation (Fig. 2a). Two isolated signals are found at about 12:00 UTC 18 December and
about 11:00 UTC 19 December 1999 (labeled with P3′and P5
′).
A similar pattern can be identified in the reflectivity classes from DWDPI composites
(Fig. 5c, d). The P2′
event is the strongest, while the evidence for events P3′
and P5′
is supported with radar signals extending over several hours. The DWDPI reflectivity25
map again shows the double-structure for P2′.
From the GFZGPS data a time series of height-integrated water vapor (Wv=∫dzqv )
was constructed for Warnemunde (Fig. 5e). According to the large-scale synoptic sit-
15888
Page 18
ACPD
7, 15873–15909, 2007
Impact of
inertia-gravity waves
on wind and
precipitation
C. Zulicke and D. Peters
Title Page
Abstract Introduction
Conclusions References
Tables Figures
◭ ◮
◭ ◮
Back Close
Full Screen / Esc
Printer-friendly Version
Interactive Discussion
EGU
uation, subtropical moist air was substituting cold polar air in the two situations: first
between 06:00 UTC and 18:00 UTC 17 December 1999 and second low-EPV between
06:00 UTC 18 and 00:00 UTC 19 December 1999. While these air mass properties
are dominating the GFZGPS-WPV signal, only small fluctuations could be related to
IGWs. Two little peaks during the first phase (at 07:30 and 15:30 UTC 17 December5
1999) could possibly related to the double-peak-structure mentioned with the W2 and
P2′
events. During the second moist-air-phase we find two modulations peaking at
10:30 UTC and 19:30 UTC 18 December 1999 – possibly effects of W3 and W4. Little
coherence of the two peaks around P5′
(07:30 and 14:30 UTC 19 December 1999) is
found with DWDMI wind speed.10
3.5 Validation of precipitation events
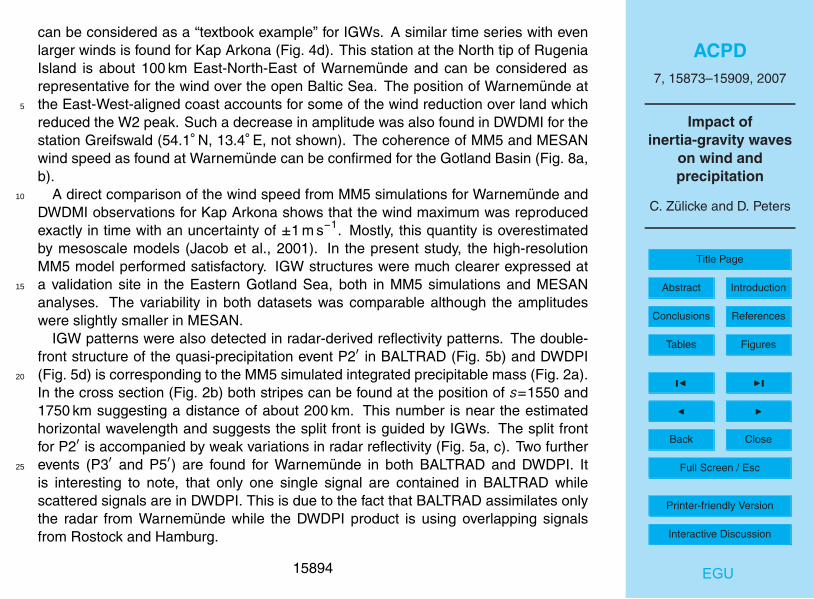
Precipitation is presented as an accumulated quantity in maps for 18:00 UTC 17 De-
cember 1999 (Fig. 6) and time series for Warnemunde (Fig. 7).
The maps provide 100-km-averaged data accumulated over at least 1 h in order to
allow for sufficient resolution of the relevant scale. In the data from MM5, MESAN,15
ELDAS and BALTRAD the double-front structure of P2 can be identified. The most
extended dataset (ELDAS, Fig. 6c) also includes another east–west–oriented band
west of England (at about 52◦N). The limited dataset of DWDMI (Fig. 6a) confirms the
occurrence of precipitation in the north-western part of Germany.
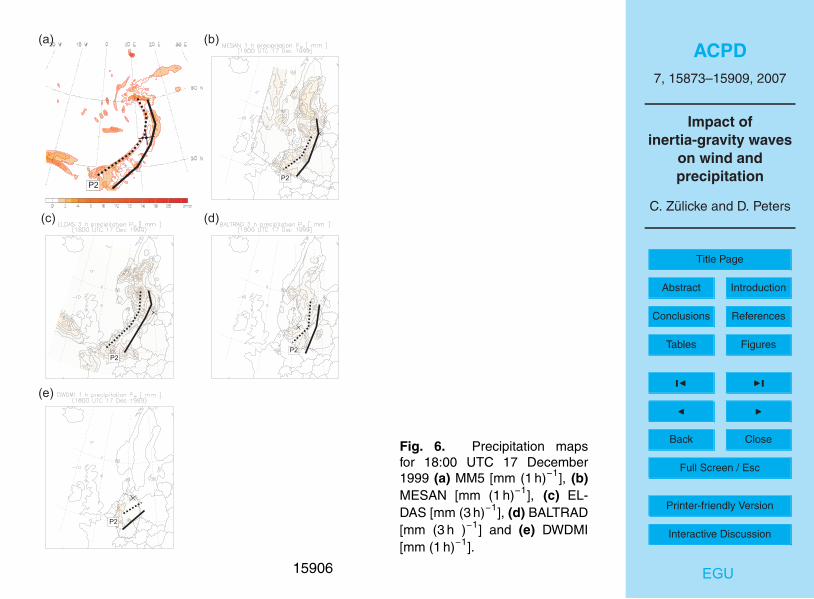
A review of the Warnemunde time series of the three-hourly accumulated precip-20
itation (Fig. 7) shows coherently most of precipitation during the P2 event. Only in
the MESAN dataset (Fig. 7b) even the double-peak structure can be diagnosed. While
precipitation during event P3 could be found in MM5 (Fig. 7a), MESAN (Fig. 7b) and EL-
DAS (Fig. 7c), it weakly or not at all appeared in the radar-derived BALTRAD (Fig. 7d)
and rain-gauge DWDMI (Fig. 7e). Event P5 in MM5 (Fig. 7a) is only coherent with25
BALTRAD-derived rainfall (Fig. 7d), while the MM5-P1 is only related to an insignificant
signal in BALTRAD (at about 03:00 UTC 17 December 1999).
15889
Page 19
ACPD
7, 15873–15909, 2007
Impact of
inertia-gravity waves
on wind and
precipitation
C. Zulicke and D. Peters
Title Page
Abstract Introduction
Conclusions References
Tables Figures
◭ ◮
◭ ◮
Back Close
Full Screen / Esc
Printer-friendly Version
Interactive Discussion
EGU
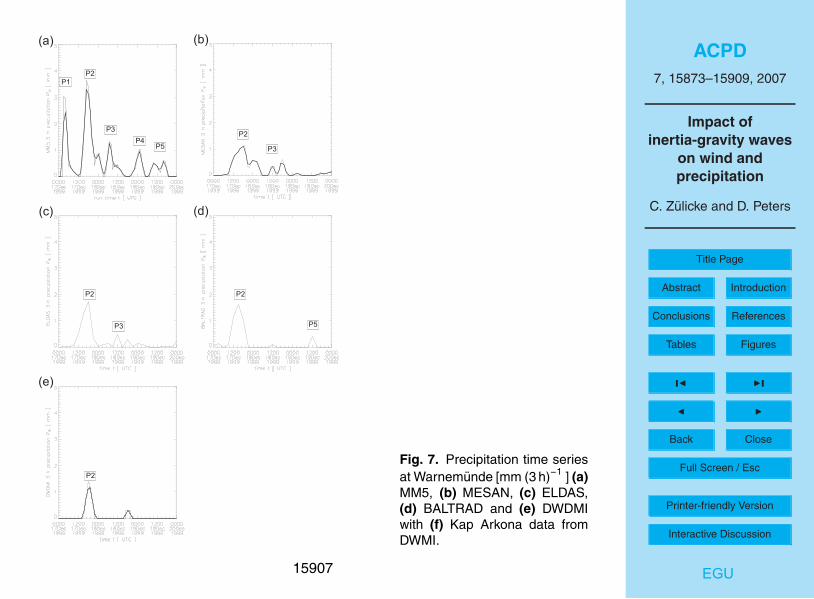
3.6 Wind and precipitation in the Gotland Basin
After the validation of available data at a land station, the surface weather patterns
for a position in the Central Baltic proper are presented. The Gotland Basin (56.5◦N,
20.0◦E) is chosen for this analysis because clear IGW signals are expected without
influence of orography. Different datasets have been compiled for the Gotland Basin5
and are presented in Fig. 8.
The Gotland Basin time series of the wind from MM5 (Fig. 8a) and MESAN (Fig. 8b)
both show 5 peaks in the wind speed. The strongest peak (W2) is nearly identical
with respect to timing (difference is less than 3 h) and magnitude (difference less than
1 m s−1
). No evidence for a double-front structure for P2 could be found which is cor-10
responding to Fig. 6. The following peaks (W3, W4 and W5) are appearing in MM5
about 6 h later than in MESAN. A similar time delay can be diagnosed for the precipi-
tation which is shown in Fig. 8(a, MM5) and (b, MESAN). The precipitation magnitude
of the strongest precipitation event (P2) is in MESAN roughly half as intense as in
MM5. Precipitation from the ELDAS (Fig. 8e) and BALTRAD (Fig. 8f) support the value15
for P2 provided by MM5. The other peaks (P1, P3, P4 and P5) appear with varying
intensity in the different datasets. The MM5 precipitation events (Fig. 8c) appear at
nearly the same time as the MM5 wind pulses (Fig. 8a), while the precipitation in the
other datasets (MESAN in Fig. 8d, ELDAS in Fig. 8e and BALTRAD in Fig. 8f) are
synchronous with the MESAN wind pulses (Fig. 8b). The time difference, however,20
is about 6 h which is just twice the precipitation accumulation time. Hence, the latter
observation is more an indication than a statement.
15890
Page 20
ACPD
7, 15873–15909, 2007
Impact of
inertia-gravity waves
on wind and
precipitation
C. Zulicke and D. Peters
Title Page
Abstract Introduction
Conclusions References
Tables Figures
◭ ◮
◭ ◮
Back Close
Full Screen / Esc
Printer-friendly Version
Interactive Discussion
EGU
4 Discussion
4.1 Numerical simulation of IGWs
IGWs were generated through internal dynamics of the MM5 model. It has been forced
through the boundaries only, which was coarse-grained an on a horizontal grid of
144 km and 12 h. For the near-realistic simulation of IGW features it was necessary5
to run MM5 with sufficient resolution. Two aspects are important: (i) the dynamics
should allow for unbalanced (ageostrophic) motion and (ii) the model–internal diffusion
should not damp the IGWs. If a mesoscale wave of 200 km wavelength shall be simu-
lated properly, the model should be run with a horizontal resolution of about 8 km and
a vertical resolution of about 100 m in both troposphere and stratosphere (Zulicke and10
Peters, 2006). The effective resolution in the troposphere can be estimated with
∆seff = max
(
∆s,N
f∆z
)
(11)
and rounds up to ∆seff(MM5)=8.6 km. Such simulations are computer time intensive
because they require the integration of 3003
grid points. The resolution of the models
reported for the REMO model by Jacob et al. (2001) was about ∆s(REMO)>18.5 km15
and ∆z(REMO)>1 km in the upper troposphere. The corresponding effective resolution
was ∆seff(REMO)≈86 km which makes it difficult to simulate IGWs properly. However,
models with a resolution insufficient to generate IGWs by internal dynamics can be
forced to show IGWs if observations are assimilated. This was the case with ELDAS
and MESAN datasets. ELDAS uses ECMWF analyses with an effective resolution of20
∆seff(ERA40)=86 km. Similar estimates hold for the HIRLAM background data used
for MESAN with an effective resolution ∆seff(HIRLAM)≈47 km.
The high-resolution MM5 model generated IGWs with a horizontal wavelength of
λh(MM5)≈220 km and a vertical wavelength of λz(MM5)≈3.5 km. The related intrin-
sic period qualifies them as sub-inertial. They correspond to those IGWs found in25
the statistical analysis for the position of Kuhlungsborn (Zulicke and Peters, 2006).
15891
Page 21
ACPD
7, 15873–15909, 2007
Impact of
inertia-gravity waves
on wind and
precipitation
C. Zulicke and D. Peters
Title Page
Abstract Introduction
Conclusions References
Tables Figures
◭ ◮
◭ ◮
Back Close
Full Screen / Esc
Printer-friendly Version
Interactive Discussion
EGU
The related apparent period of about 9 h well corresponds to the peak-to-peak-time of
about 12 h found in the wind observations (Fig. 4c). A comparison of the wind time
series at Warnemunde (Fig. 4a) and the Gotland Basin (Fig. 8a) suggests a time delay
of about 6 h. This can be explained with the propagation of the IGW with an apparent
phase speed in wave direction of ca=u||+λ||/τi≈−5.7 m s−1
. While the distance between5
Warnemunde and the Gotland Basin is δs≈564 km, its projection onto the wave direc-
tion is δs||=δs cos(75◦)≈145 km. Hence, the IGW needs a time of δt=δs||/ca∼7.1 h to
overcome this distance.
4.2 Interaction of jet-generated IGWs and convection
The importance of upper tropospheric jet-generated IGWs in the present meteorolog-10
ical situation was shown. This come apparent from the high-resolution (Fig. 2d) and
the low-resolution runs (Fig. 3a, b) where backward inclined phaselines were found
above the jet and forward inclined phases below. From the analysis of time series it
was diagnosed, that the phase propagation was downward above the jet and, hence,
the energy propagation upward. The opposite holds for the region below the jet with15
upward phase and downward energy. A significant part of IGW amplitudes could be
attributed to imbalances in the exit region of the jet.
These relatively large and shallow IGWs are modifying the stratification and upwind
condition and, thus, may initiate convection. Although this “triggering” appeared to be
weak in the medium-resolution MM5DRY run, we expect it to be clearer with higher20
resolution. The divergence structures in the MM5 run are about two times stronger
than in MM5DRY. Hence, the related stratification varies with ∂T’/∂z(MM5)≈1.1 K km−1
(using Eqs. 7 and 8) which is in the order of diagnosed variations (Fig. 3c) and half of
the background gradient (Eq. 5). The vertical velocity fluctuations can be estimated
as w ′(MM5)≈4.6 cm s
−1using Eq. (9). They too come in the range of the large-scale25
lifting motion (Fig. 3d).
The convection events were embedded into IGW patterns of conver-
gence/divergence and related up/downdrafts. According to the conceptual model of
15892
Page 22
ACPD
7, 15873–15909, 2007
Impact of
inertia-gravity waves
on wind and
precipitation
C. Zulicke and D. Peters
Title Page
Abstract Introduction
Conclusions References
Tables Figures
◭ ◮
◭ ◮
Back Close
Full Screen / Esc
Printer-friendly Version
Interactive Discussion
EGU
Koch and Golus (1988) convective rain bands are found above surface convergence
or slightly shifted upstream. The hypothesis is that saturated air can be lifted by
IGWs up to their condensation level. Once induced, condensation develops to deep
convection. This way, upper tropospheric jet-generated IGWs may favor certain
regions for convection at characteristic scales of some hundred kilometers. Note,5
that the development of individual convection cells takes place at scales of less then
ten kilometers. This part of the dynamics is not resolved but parameterized in the
current study. The resulting pattern consists of differently aligned IGW structures;
however, the characteristic scale of jet-generated IGWs can be recovered. Hence, the
IGWs communicate information on scales, which are defined at the tropopause level.10
Associated convection patterns add evidence to the impact of upper tropospheric
jet-generated IGWs on the boundary layer dynamics.
Once initiated, deep convection forces new IGWs. The latent heat release was iden-
tified as the relevant energy source (see Eq. 6). It leads to an amplification of the
divergence patterns in the lower troposphere. Another effect is the increase of imbal-15
ance of the jet exit in the tropopause by about 11%. Here the horizontal diffluence of
the jet combined with the vertical divergence at top of the convection towers. Compar-
ing the magnitude of divergence in the lower stratosphere we find an increase by about
100% similar as in (Zulicke and Peters, 2006). This is the result of upward propagat-
ing convection-generated IGWs rather than large-scale effects and demonstrates the20
process of amplification of lower-stratospheric IGW activity by deep convection.
4.3 Observations of IGW effects
IGW signatures have been detected in wind speed time series. They are characterized
by a strong peak (W2) of about 22 m s−1
accompanied with by four pulsations (W1,
W3, W4 and W5). These features were present in MM5 simulations (Fig. 4a) and the25
assimilated dataset MESAN (Fig. 4b) at the position of Warnemunde. The DWDMI
observation at this site (Fig. 4c) showed strong evidence for wind pulsations. No other
station showed such an exceptional sinusoidal sequence (W2, W3 and W4) which
15893
Page 23
ACPD
7, 15873–15909, 2007
Impact of
inertia-gravity waves
on wind and
precipitation
C. Zulicke and D. Peters
Title Page
Abstract Introduction
Conclusions References
Tables Figures
◭ ◮
◭ ◮
Back Close
Full Screen / Esc
Printer-friendly Version
Interactive Discussion
EGU
can be considered as a “textbook example” for IGWs. A similar time series with even
larger winds is found for Kap Arkona (Fig. 4d). This station at the North tip of Rugenia
Island is about 100 km East-North-East of Warnemunde and can be considered as
representative for the wind over the open Baltic Sea. The position of Warnemunde at
the East-West-aligned coast accounts for some of the wind reduction over land which5
reduced the W2 peak. Such a decrease in amplitude was also found in DWDMI for the
station Greifswald (54.1◦N, 13.4
◦E, not shown). The coherence of MM5 and MESAN
wind speed as found at Warnemunde can be confirmed for the Gotland Basin (Fig. 8a,
b).
A direct comparison of the wind speed from MM5 simulations for Warnemunde and10
DWDMI observations for Kap Arkona shows that the wind maximum was reproduced
exactly in time with an uncertainty of ±1 m s−1
. Mostly, this quantity is overestimated
by mesoscale models (Jacob et al., 2001). In the present study, the high-resolution
MM5 model performed satisfactory. IGW structures were much clearer expressed at
a validation site in the Eastern Gotland Sea, both in MM5 simulations and MESAN15
analyses. The variability in both datasets was comparable although the amplitudes
were slightly smaller in MESAN.
IGW patterns were also detected in radar-derived reflectivity patterns. The double-
front structure of the quasi-precipitation event P2′
in BALTRAD (Fig. 5b) and DWDPI
(Fig. 5d) is corresponding to the MM5 simulated integrated precipitable mass (Fig. 2a).20
In the cross section (Fig. 2b) both stripes can be found at the position of s=1550 and
1750 km suggesting a distance of about 200 km. This number is near the estimated
horizontal wavelength and suggests the split front is guided by IGWs. The split front
for P2′
is accompanied by weak variations in radar reflectivity (Fig. 5a, c). Two further
events (P3′
and P5′) are found for Warnemunde in both BALTRAD and DWDPI. It25
is interesting to note, that only one single signal are contained in BALTRAD while
scattered signals are in DWDPI. This is due to the fact that BALTRAD assimilates only
the radar from Warnemunde while the DWDPI product is using overlapping signals
from Rostock and Hamburg.
15894
Page 24
ACPD
7, 15873–15909, 2007
Impact of
inertia-gravity waves
on wind and
precipitation
C. Zulicke and D. Peters
Title Page
Abstract Introduction
Conclusions References
Tables Figures
◭ ◮
◭ ◮
Back Close
Full Screen / Esc
Printer-friendly Version
Interactive Discussion
EGU
Some variations in the integrated water vapor from GFZGPS (Fig. 5e) could be re-
lated to the radar reflectivity of precipitable water. Most of the signal is related to
large-scale changes in air mass. The two events with northerly polar air inflow after
westerly import of subtropical air (around 00:00 UTC 18:00 and 12:00 UTC 19 Decem-
ber 1999) are the result of the two synoptic scale vorticity anomalies associated to the5
RWB event.
The validation of precipitation at Warnemunde with DWDMI data was relatively poor:
Although the major event P2 was found in all datasets (Fig. 7), the occurrence of the
other events (P1, P3, P4 and P5) was not coherently reflected. For this occasion,
MM5 overestimated the intensity of rainfall by about 100% while the MESAN, ELDAS10
and BALTRAD agreed reasonably. This is due to the adjustment of the Z-R-relation
to available rain gauge observations. However, many reasons account for the dis-
agreement between modeled and assimilated estimates: This is the representativity
of a point measurement (DWDPI) against the coarse-grained and smoothed modeled
(MM5) and assimilated products (MESAN, ELDAS, BALTRAD). Another argument is15
the rain gauge measurement error due to sweep-in and sweep-out of rainwater in windy
situations. Inspection of the modeled and assimilated datasets in the Gotland Basin
shows a major precipitation event P2 (about 3 mm (3 h)−1
) in MM5 (Fig. 8c), ELDAS
(Fig. 8e) and BALTRAD (Fig. 8f) while the signal in MESAN (Fig. 8c) was only half
(about 1.5 mm (3 h)−1
). The slight underestimation of precipitation by MESAN has also20
been found by (Rutgersson et al., 2001). The minor events (P1, P3 and P4) could be
detected in all datasets while the evidence for P5 in BALTRAD is weak. The differences
in timing between all the data are small (about ±3 h). The intensity of the minor precip-
itation events is varying – even the events exceeding 1.5 mm (3 h)−1
are not appearing
homogeneously (P1 in MM5 and BALTRAD, P3 in MM5 and ELDAS). The most prob-25
able reason is the methodological difference in how the precipitation was estimated:
while MM5 it is parameterized convection, in MESAN and ELDAS assimilated radar
and gauges while gauge-calibrated radars were used. However the rain intensity was,
its appearance was closely related to the IGW signatures in the mesoscale wind field.
15895
Page 25
ACPD
7, 15873–15909, 2007
Impact of
inertia-gravity waves
on wind and
precipitation
C. Zulicke and D. Peters
Title Page
Abstract Introduction
Conclusions References
Tables Figures
◭ ◮
◭ ◮
Back Close
Full Screen / Esc
Printer-friendly Version
Interactive Discussion
EGU
4.4 Consequences for air-sea exchange
The modeled mesoscale effects in the atmospheric boundary layer also have conse-
quences for mesoscale ocean dynamics. As an example the input of turbulent ki-
netic energy into the ocean is discussed which scales like u3h. Adding a fluctuation of
3.5 m s−1
to a mean wind of 15 m s−1
an energy input of about (18.5/15.0)3∼188% with5
respect to the mean value is found. Although such an event is not lasting long, the
ocean surface mixed layer may react during hours and mixes down with nearly double
energy. Note, that related effects like entrainment and erosion of the thermocline would
have not been correctly described using the mean wind over 6 h only.
5 Summary and conclusion10
In a meteorological case study over Northern Europe from 17 to 19 December 1999
the impact of upper tropospheric jet-generated IGWs on the local wind and precipitation
fields was documented. A schematic illustration of these processes is shown in Fig. 9.
The IGWs are spontaneously radiated from the exit region of the upper tropospheric jet
streak and propagate energy downward to the surface. In a downstream cross section15
such waves appear forward inclined. Near the surface they lead to wind pulsations
and may trigger precipitation events. The interaction of jet-generated and convection-
generated IGWs leads to a complex pattern in the lower troposphere. It intensifies at
sub-synoptic scales which are defined by the IGW generation process in the upper
tropospheric jet. In these preconditioned regions shorter-scale IGWs are convectively20
generated which propagate upward into the stratosphere. Hence, the convection in the
lower troposphere serves as an amplifier of IGW activity.
For a mutual inter-validation of simulations with observations we compared data from
several sources. The successful simulation of jet- and convectively generated IGWs re-
quires a high vertical and horizontal model resolution. The observed wind fluctuations25
of about 3.5 m s−1
(Fig. 4c) could be related to the intensity of simulated IGWs (see
15896
Page 26
ACPD
7, 15873–15909, 2007
Impact of
inertia-gravity waves
on wind and
precipitation
C. Zulicke and D. Peters
Title Page
Abstract Introduction
Conclusions References
Tables Figures
◭ ◮
◭ ◮
Back Close
Full Screen / Esc
Printer-friendly Version
Interactive Discussion
EGU
Eq. 10). The space and time scales of convection and precipitation systems were re-
lated to those of jet-generated IGWs. These processes were simulated by MM5 with
sufficient accuracy which confirms the proper setup of the mesoscale model. The val-
idation with DWD and BALTRAD observations suggests that surface wind pulsations
and precipitation events in this case study are IGW features. Confidence can also be5
assigned to the mesoscale MESAN and ELDAS assimilation products, where similar
scales have been identified. Hence, MESAN data could be used as a forcing func-
tion for mesoscale ocean circulation models including scales which are not resolved in
ECANA, for example.
The MM5 simulations were used in this process study to diagnose the energetic10
sources for the IGWs: while the wind speed tendency sets the amplitude of jet-
generated IGWs, the latent heat release accounts for the intensity of convection-
generated IGWs. These forcing parameters could be taken as a base for parame-
terizations for a realistic modeling of IGW activity in the mid-latitudes, in particular
during RWB. The statistical evaluation of this hypothesis will be subject of future stud-15
ies. Based on the analysis of available data, situations should be searched, which are
linked to strong upper tropospheric jets and fast northward progression of subtropical
warm moist air. Certainly, such weather patterns are present in poleward RWB which
appear often over northern Europe during winter. The improvement of statistics and
understanding of mesoscale dynamics represents a basic aspect of air-sea exchange20
and has implications on regional energy and water budget studies. It is also relevant
for IGWs in upper levels of the atmosphere.
Acknowledgements. The funding of the work through the DFG project PIGW (Precipitation and
Inertia-gravity waves; contract PE 474/4-1/2) with logistic support from the DFG priority pro-
gram QPF (Quantitative Precipitation Forecast, SPP 1167) is gratefully acknowledged. We are25
also thankful to the user support groups at DKRZ Hamburg (HLRE project 48) and NCAR Boul-
der for keeping MM5 running. ECMWF Reading and DWD Offenbach have kindly provided the
ECANA data. Special thanks for data provision and assistance in processing goes to: K. Bo-
qvist (SMHI Norrkoeping) for MESAN, J. Wickert and G. Dick (GFZ Potsdam) for GFZGPS,
F. Rubel and P. Skomorowski (U Vienna) for ELDAS, D. Michelson and G. Haase (SMHI Nor-30
15897
Page 27
ACPD
7, 15873–15909, 2007
Impact of
inertia-gravity waves
on wind and
precipitation
C. Zulicke and D. Peters
Title Page
Abstract Introduction
Conclusions References
Tables Figures
◭ ◮
◭ ◮
Back Close
Full Screen / Esc
Printer-friendly Version
Interactive Discussion
EGU
rkoeping) for BALTRAD and C. Koziar (DWD Offenbach) for DWDPI and DWDMI. Fruitful dis-
cussions with G. Schmitz and A. Gabriel (IAP Kuhlungsborn), R. Feistel (IO Warnemunde),
C. Nappo (NOAA Oak Ridge) and K. Bumke (IfM-GEOMAR Kiel) helped to improve the paper.
References
Alexander, M. J. and Holton, J. R.: On the spectrum of vertically propagating gravity waves5
generated by a transient heat source, Atmos. Chem. Phys., 4, 923–932, 2004,
http://www.atmos-chem-phys.net/4/923/2004/.
Bosart, L. F. and Cussen, J. P. J.: Gravity wave phenomena accompanying east coast cycloge-
nesis, Mon. Weather Rev., 101, 446–454, 1973.
Bosart, L. F., Bracken, W. E., and Seimon, A.: A study of cyclone mesoscale structure with10
emphasis on a large-amplitude inertia-gravity wave, Mon. Weather Rev., 126, 1497–1527,
1998.
Dudhia, J.: A non-hydrostatic version of the penn state-ncar mesoscale model: Validation tests
and simulation of an atlantic cyclone and cold front, Mon. Weather Rev., 121, 1493–1513,
1993.15
DWD: Composite products, World Wide Web, http://www.dwd.de/en/Technik/Datengewinnung/
Radarverbund/Komposit/Komposit.htm, 2006.
Fritts, D. and Alexander, M. J.: Gravity wave dynamics and effects in the middle atmosphere,
Rev. Geophys., 41, doi:10.1029/2001RG000106, 2003.
Gendt, G., Dick, G., Reigber, C., Tomassini, M., Liu, Y., and Ramatschi, M.: Near real time gps20
water vapor monitoring for numerical weather prediction in Germany, J. Met. Soc. Jap., 82,
361–370, 2004.
Grell, G. A., Dudhia, J., and Stauffer, D. R.: A description of the fifth-generation penn state/ncar
mesoscale model (mm5), Techn. Note (Nat. Cent. for Atmos. Res., Boulder, Colo.), 398, 122,
1995.25
Guest, F. M., Reeder, M. J., Marks, C. J., and Karoly, D. J.: Inertia-gravity waves observed in
the lower stratosphere over macquarie island, J. Atmos. Sci., 57, 737–752, 2000.
Haggmark, L., Ivarsson, K.-I., Gollvik, S., and Olofsson, P.-O.: Mesan, an operational
mesoscale analysis system, Tellus, 52A, 2–20, 2000.
Holton, J. R.: An introduction to dynamic meteorology, Academic Press, London, 1992.30
15898
Page 28
ACPD
7, 15873–15909, 2007
Impact of
inertia-gravity waves
on wind and
precipitation
C. Zulicke and D. Peters
Title Page
Abstract Introduction
Conclusions References
Tables Figures
◭ ◮
◭ ◮
Back Close
Full Screen / Esc
Printer-friendly Version
Interactive Discussion
EGU
Jacob, D., van den Hurk, B. J. J. M., Andrae, U., Elgered, G., Fortelius, C., Graham, L. P.,
Jackson, S. D., Karstens, U., Kopken, C., Lindau, R., Podzun, R., Rockel, B., Rubel, F.,
Sass, B. H., Smith, R. N. B., and Yang, X.: A comprehensive model inter-comparison study
investigating the water budget during the baltex-pidcap period, Meteorol. Atmos. Phys., 77,
19–43, 2001.5
Kim, Y.-J., Eckermann, S. D., and Chun, H.-Y.: An overview of the past, present and future
of gravity-wave drag parameterisation for numerical climate and weather prediction models,
Atmos. Ocean, 41, 65–98, 2003.
Koch, S. E. and Golus, R. E.: A mesoscale gravity wave event observed during ccope. Part I:
Multiscale statistical analysis of wave characteristics, Mon. Weather Rev., 116, 2527–2544,10
1988.
Koistinen, J. and Michelson, D. B.: Baltex weather radar-based precipitation products and their
accuracies, Boreal Env. Res., 7, 253–263, 2002.
Lane, T. P., Reeder, M. J., and Clark, T. L.: Numerical modeling of gravity wave generation by
deep tropical convection, J. Atmos. Sci., 58, 1249–1274, 2001.15
Lane, T. P., Doyle, J. D., Plougonven, R., Shapiro, M. A., and Sharman, R. D.: Observations
and numerical simulations of inertia-gravity waves and shearing instabilities in the vicinity of
a jet stream, J. Atmos. Sci., 61, 2692–2706, 2004.
Michelson, D. B. and Koistinen, J.: Gauge-radar network adjustment for the baltic sea experi-
ment, Phys. Chem. Earth, B15, 915–920, 2000.20
O’Sullivan, D. and Dunkerton, T. J.: Generation of inertia-gravity waves in a simulated life cycle
of a baroclinic instability, J. Atmos. Sci., 52, 3695–3716, 1995.
Peters, D. and Waugh, D. W.: Influence of barotropic shear on the poleward advection of upper-
tropospheric air, J. Atmos. Sci., 53, 3013–3031, 1996.
Peters, D., Hoffmann, P., and Alpers, M.: On the appearance of inertia-gravity waves on the25
north-easterly side of an anticyclone, Meteorol. Z., 12, 25–35, 2003.
Plougonven, R., Teitelbaum, H., and Zeitlin, V.: Inertia gravity wave generation by the tro-
pospheric midlatitude jet as given by the fronts and atlantic strom track experiments radio
soundings, J. Geophys. Res., 103, 4686, doi:10.1029/2003JD003535, 2003.
Reeder, M. J. and Griffiths, M.: Startospheric inertia-gravity waves generated in a numerical30
model of frontogenesis. Ii: Wave sources, generation mechanisms and momentum fluxes,
Q. J. R. Meteorol. Soc., 122, 1175–1195, 1996.
Reigber, C., Gendt, G., and Wickert, J.: Gps atmospharen-sondierungs-project (gasp), GFZ
15899
Page 29
ACPD
7, 15873–15909, 2007
Impact of
inertia-gravity waves
on wind and
precipitation
C. Zulicke and D. Peters
Title Page
Abstract Introduction
Conclusions References
Tables Figures
◭ ◮
◭ ◮
Back Close
Full Screen / Esc
Printer-friendly Version
Interactive Discussion
EGU
STR (Geoforschungszentrum Scientific Technical Report), 04/02, (ISSN 1610-0956), 2002.
Rubel, F. and Hantel, M.: Baltex 1/6-degree daily precipitation climatology 1996–1998, Meteo-
rol. Atmos. Phys., 77, 155–166, 2001.
Rubel, F.: A new european precipitation dataset for nwp model verification and data assimula-
tion studies, in: Research activities in atmospheric and oceanic modelling, edited by: Cote,5
J., WMO/TD, 2004.
Rutgersson, A., Bumke, K., Clemens, M., Foltescu, V., Lindau, R., Michelson, D., and Omstedt,
A.: Precipitation estimates over the baltic sea: Present state of the art, Nord. Hydrol., 32,
285–314, 2001.
Thomas, L., Worthington, R. M., and McDonald, A. J.: Inertia-gravity waves in the troposphere10
and lower stratosphere associated with a jet stream exit region, Ann. Geophys., 17, 115–121,
1999, http://www.ann-geophys.net/17/115/1999/.
Uccellini, L. W.: A case study if apparent gravity wave initiation of severe convective storms,
Mon. Weather Rev., 103, 497–513, 1975.
Uccellini, L. W. and Koch, S. E.: The synoptic setting and possible energy sources for15
mesoscale wave disturbances, Mon. Weather Rev., 115, 721–729, 1987.
Zhang, F., Koch, S. E., Davis, C. A., and Kaplan, M. L.: A survey of unbalanced flow diagnostics
and their application, Adv. Atmos. Sci., 17, 165–183, 2000.
Zhang, F.: Generation of mesoscale gravity waves in upper-tropospheric jet-front systems, J.
Atmos. Sci., 61, 440–457, 2004.20
Zulicke, C. and Peters, D.: Simulation of inertia-gravity waves in a poleward breaking rossby
wave, J. Atmos. Sci., 63, 3253–3276, doi:10.1175/JAS3805.1, 2006.
Zulicke, C. and Peters, D.: Parameterization of strong stratospheric inertia-gravity waves forced
by poleward breaking rossby waves, Mon. Weather Rev., in press, 2007.
15900
Page 30
ACPD
7, 15873–15909, 2007
Impact of
inertia-gravity waves
on wind and
precipitation
C. Zulicke and D. Peters
Title Page
Abstract Introduction
Conclusions References
Tables Figures
◭ ◮
◭ ◮
Back Close
Full Screen / Esc
Printer-friendly Version
Interactive Discussion
EGU
(a)D1
D2
D3
(b)
(c)
Fig. 1. Meteorological situation for 18:00 UTC 17 December 1999 from ECANA data. (a) Target
region with nested MM5 model domains and terrain height (filled contours each 500 m), (b)
specific humidity at 500 hPa (filled dotted contours, qv=1.0, 1.5, 2.0, . . . g kg−1
) and sea level
pressure (solid contours, ∆pslv=10 hPa), (c) 330 K map with the wind (arrows and isotachs,
filled dotted contours, uh=30, 40, 50, . . . m s−1
) together with the 100-km-smoothed Ertel
potential vorticity (solid contours, ∆EPV=1 PVU, 3 PVU thick). Dots indicate the positions of
Warnemunde (54.2◦N, 12.1
◦E) and the Gotland Basin (56.5
◦N, 20.0
◦E).
15901
Page 31
ACPD
7, 15873–15909, 2007
Impact of
inertia-gravity waves
on wind and
precipitation
C. Zulicke and D. Peters
Title Page
Abstract Introduction
Conclusions References
Tables Figures
◭ ◮
◭ ◮
Back Close
Full Screen / Esc
Printer-friendly Version
Interactive Discussion
EGU
C2
C3C4
C4
C2C3
M
M
J2J3
J4
J2J4 J3
(a) (b)
(c) (d)
(e) (f)
Fig. 2. MM5 modeled IGW
patterns for 18:00 UTC 17
December 1999. (a, c, e)
300 hPa maps and (b, d,
f) a vertical cross section
through Warnemunde. (a)
wind speed (filled dotted con-
tours, uh=30, 40, 50, . . .
m s−1
), geopotential height
(solid contours, ∆H=100 m)
and integrated precipitable
water (filled solid contours,
W p=0.5, 1.0, 1.5, . . . mm),
(c) raw horizontal divergence
(contours ∆δ=5×10⁻⁶
s−1
)
and (e) 100-km-smoothed
horizontal divergence (con-
tours ∆δ=2×10⁻⁶
s−1
). The
line indicates a cross section
through Kuhlungsborn (54.1◦N,
11.8◦E) shown for (b) wind
speed (uh) and precipitation
mixing ratio (qp=0.25, 0.50,
0.75, . . . g kg−1
), (d) raw and (f)
100-km-smoothed divergence.
15902
Page 32
ACPD
7, 15873–15909, 2007
Impact of
inertia-gravity waves
on wind and
precipitation
C. Zulicke and D. Peters
Title Page
Abstract Introduction
Conclusions References
Tables Figures
◭ ◮
◭ ◮
Back Close
Full Screen / Esc
Printer-friendly Version
Interactive Discussion
EGU
J4 J3 J2
I2I3I4 U1U3U4 U2
(a) (b)
(c)
(d)
J4J3
J2
Fig. 3. Modeled IGW sources in a vertical cross section through Warnemunde for 18:00 UTC
17 December 1999. (a) For the MM5DRY run, the divergence (thin contours ∆δ=1×10⁻⁵
s−1
,
thick Zero line) and the cross-stream ageostrophic wind (smoothed over 120 km horizontally
and 5 km vertically, filled solid contours, ∆u∗=2.5 m s−1
) are shown. (b) For the MM5WET run,
additionally the condensational heating (filled dashed contours, ∆Q∗=0.5 K h−1
) is superim-
posed. (c) For the MM5DRY run, the vertical gradient of the equivalent potential temperature
below 3 K km−1
is shown (filled solid contours, ∂Θe /∂z=3, 2, 1, 0, −1, . . . K km−1
, the Zero
contour drawn thick). (d) Vertical velocity above −1 cm s−1
(w=−1, 0, 1, . . . cm s−1
) is shown
for the MM5DRY run.
15903
Page 33
ACPD
7, 15873–15909, 2007
Impact of
inertia-gravity waves
on wind and
precipitation
C. Zulicke and D. Peters
Title Page
Abstract Introduction
Conclusions References
Tables Figures
◭ ◮
◭ ◮
Back Close
Full Screen / Esc
Printer-friendly Version
Interactive Discussion
EGU
W1
W2
W5W4
W3W2
W3W4
W5
W2W3 W4
W2
W3 W5
(a) (b)
(c) (d)
Fig. 4. Wind speed time series at Warnemunde from (a) MM5, (b) MESAN, and (c) DWDMI
with (d) Kap Arkona (54.7◦N, 13.4
◦E) data from DWDMI. The thin line is for original data; the
bold line for 3 h averages.
15904
Page 34
ACPD
7, 15873–15909, 2007
Impact of
inertia-gravity waves
on wind and
precipitation
C. Zulicke and D. Peters
Title Page
Abstract Introduction
Conclusions References
Tables Figures
◭ ◮
◭ ◮
Back Close
Full Screen / Esc
Printer-friendly Version
Interactive Discussion
EGU
P2’
P3’
P5’
P2’
P2’ P3’
P5’
P2’
(a) (b)
(c)
(d)
(e)
P2’
P3’
P5’
Fig. 5. Patterns in radar re-
flectivity. (a, c, e) Time se-
ries for Warnemunde of (a)
BALTRAD radar reflectivity, (c)
DWDPI radar reflectivity class
and (e) GFZGPS precipitable
water vapor (W v [mm]). (b, d)
Maps for 16:00 UTC 17 Decem-
ber 1999 for (b) BALTRAD radar
reflectivity and (d) DWDPI radar
reflectivity class.
15905
Page 35
ACPD
7, 15873–15909, 2007
Impact of
inertia-gravity waves
on wind and
precipitation
C. Zulicke and D. Peters
Title Page
Abstract Introduction
Conclusions References
Tables Figures
◭ ◮
◭ ◮
Back Close
Full Screen / Esc
Printer-friendly Version
Interactive Discussion
EGU
P2
(a) (b)
(c) (d)
(e)
P2
P2P2
P2
Fig. 6. Precipitation maps
for 18:00 UTC 17 December
1999 (a) MM5 [mm (1 h)−1
], (b)
MESAN [mm (1 h)−1
], (c) EL-
DAS [mm (3 h)−1
], (d) BALTRAD
[mm (3 h )−1
] and (e) DWDMI
[mm (1 h)−1
].
15906
Page 36
ACPD
7, 15873–15909, 2007
Impact of
inertia-gravity waves
on wind and
precipitation
C. Zulicke and D. Peters
Title Page
Abstract Introduction
Conclusions References
Tables Figures
◭ ◮
◭ ◮
Back Close
Full Screen / Esc
Printer-friendly Version
Interactive Discussion
EGU
P1P2
P3
P4P5
(a) (b)
(c) (d)
(e)
P2
P3
P2
P3
P2
P5
P2
Fig. 7. Precipitation time series
at Warnemunde [mm (3 h)−1
] (a)
MM5, (b) MESAN, (c) ELDAS,
(d) BALTRAD and (e) DWDMI
with (f) Kap Arkona data from
DWMI.
15907
Page 37
ACPD
7, 15873–15909, 2007
Impact of
inertia-gravity waves
on wind and
precipitation
C. Zulicke and D. Peters
Title Page
Abstract Introduction
Conclusions References
Tables Figures
◭ ◮
◭ ◮
Back Close
Full Screen / Esc
Printer-friendly Version
Interactive Discussion
EGU
W1
W2
W3
W4W5
W1
W2
W3
W4
W5
P1
P2
P3 P4P5
(a) (b)
(c) (d)
(e) (f)
P1
P2
P3P4
P5
P1
P2
P3
P4
P5
P1
P2
P3P4 P5
Fig. 8. Time series for the Got-
land Basin (a) MM5 wind speed,
(b) MESAN wind speed, (c)
MM5 precipitation, (d) MESAN
precipitation, (e) ELDAS precipi-
tation and (f) BALTRAD precipi-
tation.
15908
Page 38
ACPD
7, 15873–15909, 2007
Impact of
inertia-gravity waves
on wind and
precipitation
C. Zulicke and D. Peters
Title Page
Abstract Introduction
Conclusions References
Tables Figures
◭ ◮
◭ ◮
Back Close
Full Screen / Esc
Printer-friendly Version
Interactive Discussion
EGU
wind
pulsations
exit region
convection-generated gravity waves
jet-generated
inertia-gravity waves
jet-generated
inertia-gravity waves
upper tropospheric jet streak
wave drag
exit region
precipitation
events
Fig. 9. Schematic sketch of the link between the upper and lower troposphere by inertia gravity
waves as they were found during RWB. IGW packets are spontaneously radiated from the
exit region of a jet streak at tropopause level (thin lines indicate locations of equal phase,
thick arrows indicate group velocity). A part of them propagates upward into the stratosphere,
another part goes down into the troposphere. Deep convection may be favored, which itself
may induce additional gravity waves in the upper troposphere and further up. Related effects
near the surface are wind pulsations and precipitation events while the wave drag is important
for the middle atmosphere.
15909