International Journal of Rural Development and Management Studies Volume 5 • Number 1 • January-June 2011 IMPACT OF URBANIZATION ON GROUNDWATER OF GURGAON DISTRICT, HARYANA, INDIA Vijender Kumar Malik * , Ram Karan Singh ** & S. K. Singh *** Abstract: The depletion of ground water in Gurgaon and its adjoining areas is alarming proportions, creating high water scarcity conditions in the district. The average annual rainfall in the district is about 550 mm and not able to recharge the depleted ground water level which is occurring with high pace due to huge population increase due to urbanization. The total annual ground water availability of the district is 20215.12 ham and existing overall stage of ground water development in the block is of the order of 209% which has exceeded the available recharge and thus the district has been categorized as over exploited region. Sustainable utilization of ground water holds the key to counter the problem of declining water table. An attempt has been made in this paper to highlight the prevailing ground water scenario and the need for scientific management of this vital resource. Optimal utilization of ground water through properly designed abstraction structures constructed at suitable location can mitigate the problems of water scarcity faced during summer. Rainwater harvesting, proper run off management measures and optimal ground water conservation practices will be helpful for eradicating the problem of declining water table in the district. Keywords: Ground Water, Ground Water Depletion, Ground Water Fluctuation, Ground Water Balance, Ground Water Development . INTRODUCTION Gurgaon, one of the southern districts of Haryana has been declared a ‘dark zone’ for its gradually decreasing level of ground water. Since the surface water potential is not promising in the district, there is increased dependence on ground water for meeting the agricultural, domestic and industrial requirements resulting in depletion of ground water resources in the district. The district has seen a sharp decline in ground water table by four to six feet per year (2006 – 2008). Located between the East longitudes of 74°27’00" and 77°35’00" and North latitudes of 21°39’00" and 30°55’00", the district is having a geographical area of 1254 Sq. Km. The share of rural population is 64.42% of the total population and agriculture is the predominant occupation of the majority of the people in Gurgaon district. 92.4% of the net sown area is irrigated in the district. The main source of the irrigation is tube-well, which irrigates about 96.8% of the total irrigated area. Indiscriminate use of underground water has depleted the ground water to the level of over exploited category. The ground water balance as on 2004 shows that there is no scope of further * Ph.D. Research Scholar, Delhi University, Department of Civil and Environmental Engineering, Delhi Technological University (Formerly Delhi College of Engineering), Bawana Road, Delhi, ([email protected]) ** Professor, Department of Civil Engineering, itm University, Gurgaon NCR DELHI (Gurgaon, Sector: 23 A), India, (www.itmindia.edu E-mail: [email protected]) *** Professor and Head, Department of Civil and Environmental Engineering, Delhi Technological University, Bawana Road, Delhi, ([email protected])
Transcript
International Journal of Rural Development and Management StudiesVolume 5 • Number 1 • January-June 2011
IMPACT OF URBANIZATION ON GROUNDWATER OFGURGAON DISTRICT, HARYANA, INDIA
Vijender Kumar Malik*, Ram Karan Singh** & S. K. Singh***
Abstract: The depletion of ground water in Gurgaon and its adjoining areas is alarming proportions,creating high water scarcity conditions in the district. The average annual rainfall in the district isabout 550 mm and not able to recharge the depleted ground water level which is occurring with highpace due to huge population increase due to urbanization. The total annual ground water availabilityof the district is 20215.12 ham and existing overall stage of ground water development in the block isof the order of 209% which has exceeded the available recharge and thus the district has beencategorized as over exploited region. Sustainable utilization of ground water holds the key to counterthe problem of declining water table. An attempt has been made in this paper to highlight the prevailingground water scenario and the need for scientific management of this vital resource. Optimal utilizationof ground water through properly designed abstraction structures constructed at suitable locationcan mitigate the problems of water scarcity faced during summer. Rainwater harvesting, proper runoff management measures and optimal ground water conservation practices will be helpful foreradicating the problem of declining water table in the district.
Keywords: Ground Water, Ground Water Depletion, Ground Water Fluctuation, Ground WaterBalance, Ground Water Development .
INTRODUCTION
Gurgaon, one of the southern districts of Haryana has been declared a ‘dark zone’ for its graduallydecreasing level of ground water. Since the surface water potential is not promising in the district,there is increased dependence on ground water for meeting the agricultural, domestic and industrialrequirements resulting in depletion of ground water resources in the district. The district hasseen a sharp decline in ground water table by four to six feet per year (2006 – 2008). Locatedbetween the East longitudes of 74°27’00" and 77°35’00" and North latitudes of 21°39’00" and30°55’00", the district is having a geographical area of 1254 Sq. Km. The share of rural populationis 64.42% of the total population and agriculture is the predominant occupation of the majorityof the people in Gurgaon district. 92.4% of the net sown area is irrigated in the district. The mainsource of the irrigation is tube-well, which irrigates about 96.8% of the total irrigated area.Indiscriminate use of underground water has depleted the ground water to the level of overexploited category. The ground water balance as on 2004 shows that there is no scope of further
* Ph.D. Research Scholar, Delhi University, Department of Civil and Environmental Engineering, DelhiTechnological University (Formerly Delhi College of Engineering), Bawana Road, Delhi,([email protected])
** Professor, Department of Civil Engineering, itm University, Gurgaon NCR DELHI (Gurgaon, Sector:23 A), India, (www.itmindia.edu E-mail: [email protected])
*** Professor and Head, Department of Civil and Environmental Engineering, Delhi Technological University,Bawana Road, Delhi, ([email protected])
52 International Journal of Rural Development and Management Studies
development in the district. Optimal utilization of ground water resources will be able to mitigatethe depleted water level in the district.
PHYSIOGRAPHY AND DRAINAGE
Gurgaon district possesses varied topography producing ridges, valleys and drainage channelsthat need conservation. The district is situated in the transitional zone of the Ganga Plain in thenorth and the Aravali hills in the south. The Aravalis are along the western part of the districtand extend upto the Union Territory of Delhi in the north-east to the south-west direction.These rocks are one of the oldest mountain systems of the world. The district comprises of hillsand depressions forming diverse nature of topography. Two ridges – Firozpur Jhirka – DelhiRidge forms the western boundary and the Delhi ridge forms the eastern boundary of the district.The topography in general may be reported as slightly undulating. Altitude wise the plainsrange over 225 to 275 m above MSL while the hills range between 275 to 326 m above mean sealevel (MSL).
The district may be divided into four distinct landscapes:
• Aravali Hills: The Aravali hill ranges are of Archean age and form a part of south-eastand (very little) south-east part of the Sahibi river catchment and are of subdued nature.The MSL ranges from 275 to 325 m.
• Foot Hills: Unlike other foothills, landscape of Aravali ranges is typical by virtue of itsgenesis. Apparently they appear to be obstacle dunes displaying dissection and verysevere gully erosion at many places.
• Sahibi Flood Plain: Major part of the catchment area is composed of plain, leaves, barsand basins.
• Aeolian Landscape: This landscape has special significance due to its location in Aeolianactivity. Two distinct parts (i) Aeolian Plain (ii) Sand Dunes are discemible within thisregion.
The drainage of the district are typical of arid and semi-arid areas. It comprises of largedepressions and seasonal streams. Important depressions of the district are Khalipur Lake,Chandani Lake, Sangel-Ujhina Lake, Kotla Dhar Lake and Najafgarh Lake. Sahibi and Indraniare two important seasonal streams of the district.
VEGETATION, CROP PATTERN AND IRRIGATION
On account of the pressure of population and extensive urban development very less has beenleft of the natural vegetation. Gurgaon town and its surrounding areas are relatively less wooded.Shisham is found on both sides of the roads while Kikar is generally found in low lying areas.Agriculture is the predominant occupation of the majority of the people in Gurgaon district.Wheat, Mustard, Barley, Bajra and Jowar are sown in the district. Wheat was the highest cultivatedcrop and production has increased as against the other crops. Bajra is another important cropcultivated. The production of staple crops has decreased and non-staple has increased due to thedemand of the urban growth. The non-cereal crops like vegetables and horticulture productshave a tremendous development. This may be attributed to the: Development of irrigationfacilities, Technological advancement and high demands of these products in Delhi. The netsown area and net irrigated are 78280 and 84461 ha respectively. 2.4% of the sown area is
Impact of Urbanization on Groundwater of Gurgaon District, Haryana, India 53
irrigated in the district. The main source of the irrigation is tube-well which irrigate about 96.8%of total irrigated area. The main livestock of the district is Buffalo. The land use pattern is givenin following table.
Land Use Pattern of the Gurgaon District
Land Utilization Statistics Area in ha
Geographical Area 125307Irrigated Area 84461Forest Area 2600Land under non-agriculture use 44327Permanent Pastures 100Net sown area 78280Gross Cropped Area 120822Cropping Intensity 154.3
CLIMATE
The climate, except during the monsoon, is characterized by the dryness in air, a hot summerand a cold winter. The year may be broadly divided into four seasons, viz. winter, summer,monsoon and the post monsoon or the transit period. The winter starts late in November andcontinues up to the beginning of March. The summer is from March till the end of June. Theperiod from July to mid September is the South West monsoon season. Mid September to end ofNovember constitutes the post monsoon or the transition period.
During the hot season the mean daily maximum temperature (May) at Gurgaon is 45° andthe mean daily minimum temperature is 25°C. During the cold season, the mean daily maximumtemperature at Gurgaon is 26.4°C and the mean daily minimum temperature (January) is 5°C.
Days are a little hotter in May than in June whereas nights are cooler in May than June.From April onwards hot westerly dust laden winds of heat wave conditions occur and the weatherbecomes intensely hot and unpleasant. Occasional dust and thunder storms bring some relieffrom heat. Following table gives the variation in monthly maximum and minimum temperaturefor Gurgaon district. The weather data of the district is shown below:
Weather Data of Gurgaon District
Temperature Mean Daily (°C) Relative Humidity
Month Maximum Minimum At 0830 Hrs. At 1730 Hrs. Wind Speed(Km/Hr)
54 International Journal of Rural Development and Management Studies
Rainfall
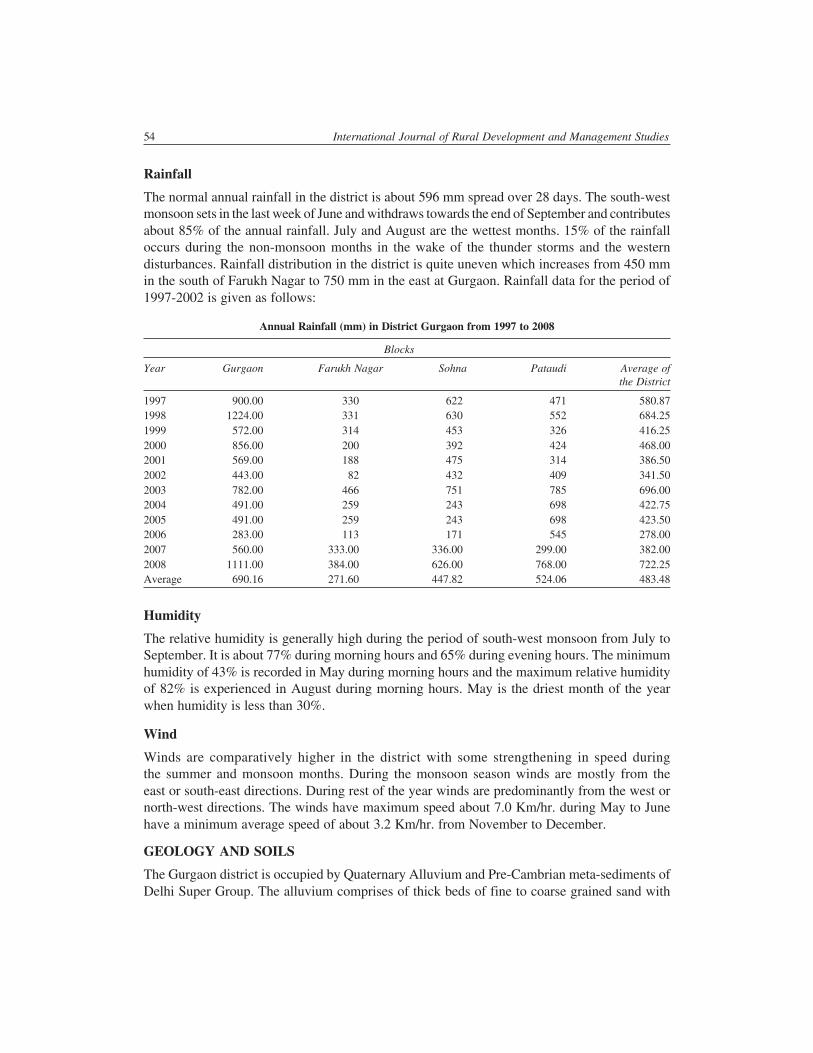
The normal annual rainfall in the district is about 596 mm spread over 28 days. The south-westmonsoon sets in the last week of June and withdraws towards the end of September and contributesabout 85% of the annual rainfall. July and August are the wettest months. 15% of the rainfalloccurs during the non-monsoon months in the wake of the thunder storms and the westerndisturbances. Rainfall distribution in the district is quite uneven which increases from 450 mmin the south of Farukh Nagar to 750 mm in the east at Gurgaon. Rainfall data for the period of1997-2002 is given as follows:
Annual Rainfall (mm) in District Gurgaon from 1997 to 2008
Blocks
Year Gurgaon Farukh Nagar Sohna Pataudi Average ofthe District
The relative humidity is generally high during the period of south-west monsoon from July toSeptember. It is about 77% during morning hours and 65% during evening hours. The minimumhumidity of 43% is recorded in May during morning hours and the maximum relative humidityof 82% is experienced in August during morning hours. May is the driest month of the yearwhen humidity is less than 30%.
Wind
Winds are comparatively higher in the district with some strengthening in speed duringthe summer and monsoon months. During the monsoon season winds are mostly from theeast or south-east directions. During rest of the year winds are predominantly from the west ornorth-west directions. The winds have maximum speed about 7.0 Km/hr. during May to Junehave a minimum average speed of about 3.2 Km/hr. from November to December.
GEOLOGY AND SOILS
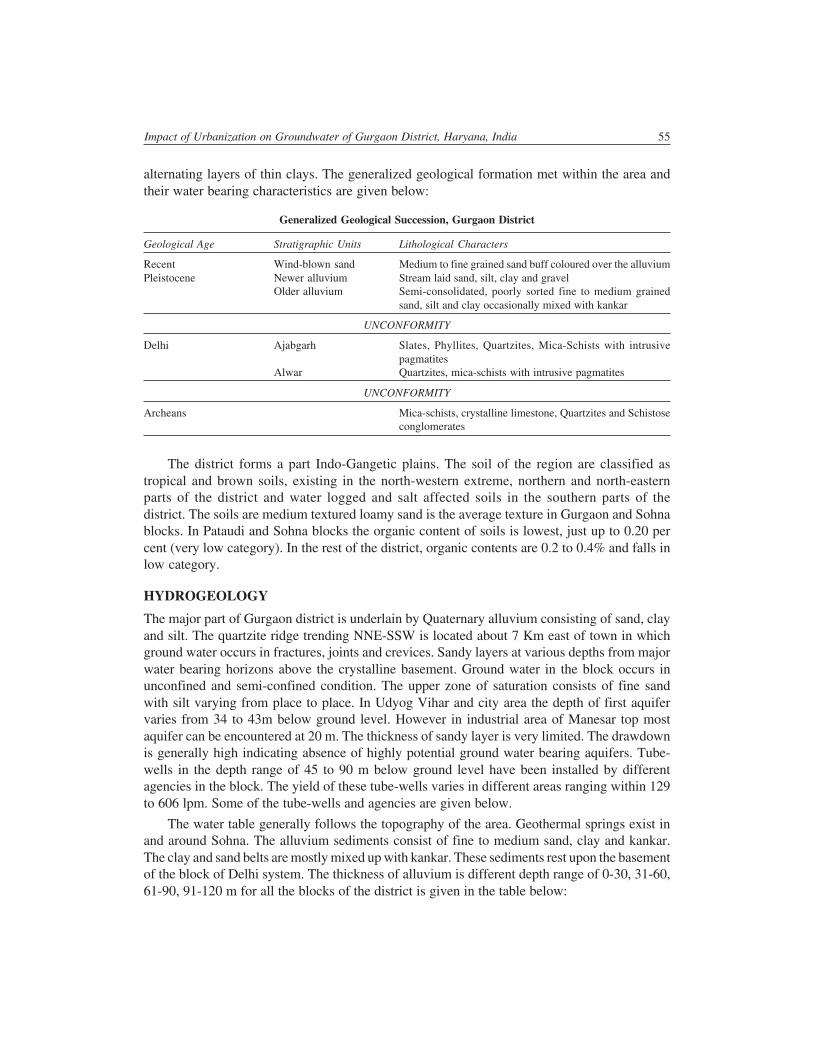
The Gurgaon district is occupied by Quaternary Alluvium and Pre-Cambrian meta-sediments ofDelhi Super Group. The alluvium comprises of thick beds of fine to coarse grained sand with
Impact of Urbanization on Groundwater of Gurgaon District, Haryana, India 55
alternating layers of thin clays. The generalized geological formation met within the area andtheir water bearing characteristics are given below:
Generalized Geological Succession, Gurgaon District
Geological Age Stratigraphic Units Lithological Characters
Recent Wind-blown sand Medium to fine grained sand buff coloured over the alluviumPleistocene Newer alluvium Stream laid sand, silt, clay and gravel
Older alluvium Semi-consolidated, poorly sorted fine to medium grainedsand, silt and clay occasionally mixed with kankar
UNCONFORMITY
Delhi Ajabgarh Slates, Phyllites, Quartzites, Mica-Schists with intrusivepagmatites
Alwar Quartzites, mica-schists with intrusive pagmatites
UNCONFORMITY
Archeans Mica-schists, crystalline limestone, Quartzites and Schistoseconglomerates
The district forms a part Indo-Gangetic plains. The soil of the region are classified astropical and brown soils, existing in the north-western extreme, northern and north-easternparts of the district and water logged and salt affected soils in the southern parts of thedistrict. The soils are medium textured loamy sand is the average texture in Gurgaon and Sohnablocks. In Pataudi and Sohna blocks the organic content of soils is lowest, just up to 0.20 percent (very low category). In the rest of the district, organic contents are 0.2 to 0.4% and falls inlow category.
HYDROGEOLOGY
The major part of Gurgaon district is underlain by Quaternary alluvium consisting of sand, clayand silt. The quartzite ridge trending NNE-SSW is located about 7 Km east of town in whichground water occurs in fractures, joints and crevices. Sandy layers at various depths from majorwater bearing horizons above the crystalline basement. Ground water in the block occurs inunconfined and semi-confined condition. The upper zone of saturation consists of fine sandwith silt varying from place to place. In Udyog Vihar and city area the depth of first aquifervaries from 34 to 43m below ground level. However in industrial area of Manesar top mostaquifer can be encountered at 20 m. The thickness of sandy layer is very limited. The drawdownis generally high indicating absence of highly potential ground water bearing aquifers. Tube-wells in the depth range of 45 to 90 m below ground level have been installed by differentagencies in the block. The yield of these tube-wells varies in different areas ranging within 129to 606 lpm. Some of the tube-wells and agencies are given below.
The water table generally follows the topography of the area. Geothermal springs exist inand around Sohna. The alluvium sediments consist of fine to medium sand, clay and kankar.The clay and sand belts are mostly mixed up with kankar. These sediments rest upon the basementof the block of Delhi system. The thickness of alluvium is different depth range of 0-30, 31-60,61-90, 91-120 m for all the blocks of the district is given in the table below:
56 International Journal of Rural Development and Management Studies
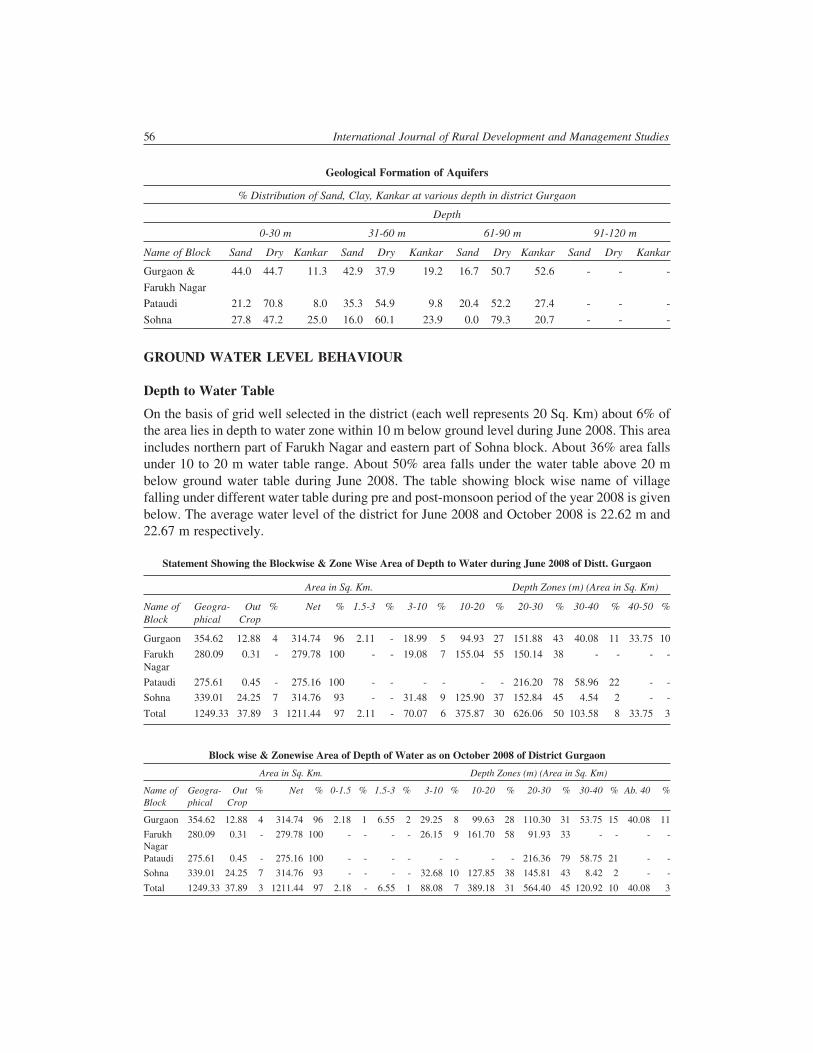
Geological Formation of Aquifers
% Distribution of Sand, Clay, Kankar at various depth in district Gurgaon
Depth
0-30 m 31-60 m 61-90 m 91-120 m
Name of Block Sand Dry Kankar Sand Dry Kankar Sand Dry Kankar Sand Dry Kankar
On the basis of grid well selected in the district (each well represents 20 Sq. Km) about 6% ofthe area lies in depth to water zone within 10 m below ground level during June 2008. This areaincludes northern part of Farukh Nagar and eastern part of Sohna block. About 36% area fallsunder 10 to 20 m water table range. About 50% area falls under the water table above 20 mbelow ground water table during June 2008. The table showing block wise name of villagefalling under different water table during pre and post-monsoon period of the year 2008 is givenbelow. The average water level of the district for June 2008 and October 2008 is 22.62 m and22.67 m respectively.
Statement Showing the Blockwise & Zone Wise Area of Depth to Water during June 2008 of Distt. Gurgaon
Area in Sq. Km. Depth Zones (m) (Area in Sq. Km)
Name of Geogra- Out % Net % 1.5-3 % 3-10 % 10-20 % 20-30 % 30-40 % 40-50 %Block phical Crop
Impact of Urbanization on Groundwater of Gurgaon District, Haryana, India 57
List of Villages Falling Under Different Depth Zones of Distt. Gurgaon during June 2008
Depth zone List of villages
Block Gurgaon1. 50-3.00 Part Dharampur etc.10.00 – 20 Between villages part Dharampur, part Babupur and Makrola etc.20.00 – 30.00 Between villages Bhaghera, part Babupur, Raniala, Doltabad, Dhanwapur, Kheri Majra, Chandu,
Sadharana, Hamirpur, Meoka, Wazirpur, Babroli & Part Kadipur etc.20.00 – 30.00 All villages of the block except villages falls upto 20 mtr. & above 30 mtr. depth zone30-40 Between villages Inayatpur, Gurgaon. Silokra & Kherkidaula, Kasan etc.Above – 40.00 Between villages Dundahera, Mulahea, Nathupur, Sirhol, Sukhrali Sikanderpur, Badha, Chakarpur etc.
BLOCK FARRUKH NAGARA3.00-10.00 Between villages Iqbalpur, Kherajha Jhorla, Mirchwali Dhani & sultanpur etc.10.00-20.00 Between villages Budhera, Khetawas, Dhanawas, Patli, Hzipur, F. Nagar, Mubarikpur, Sarbasirpur,
Daboda, Basonda, Faridpur, Karola, Rajupur Doman, Jaraun & Dhani Hiran etc.20.00-30.00 All villages of the block except villages falls upto 20 mtr. depth zone villages etc.
BLOCK PATAUDI20.00-30.00 All villages of the block except villages falls upto 30-40 mtr. depth zone30.00-40.00 Between villages Rampur, Narhera, Pataudi, Mirzapur, part Dadawas, Milakpur, Khanpur,
3.00-10.00 Damdama etc. between villages part Baikhera, Sirmathla, Lohsinghani, Khatrika, Ghangola,Bhojkpur & part Kuntapur etc.
10.00-20.00 Between villages Rithoj, Behlpa, Phulawas, Mehandwara, Berka & Part Garhi Bazidpur etc.20.00-30.00 All villages of the block except villages falls upto 20 mtrs. And above 30 mtr. depth zone.30.00-40.00 Kherla etc. between villages part Aklimpur & Tikli etc.
List of Villages Falling Under Different Depth Zones of Distt. Gurgaon during Oct. 2008.
Depth zone List of villages
BLOCK GURGAON1.50-3.00 Part Dharampur etc.3.00-10.00 Between villages part Dharampur, part Babupur and Makrola etc.10.00-20.00 Between villages bhaghera. Part Babupur, Raniala, Doltabad, Dhanwapur, Kheri Majra, Chandu,
Sadharna, Hamirpur, Meoka, Wazirpur, Babroli & part Kadpur etc.20.00-30.00 All villages of the block except villages falls upto 20 mtrs. And above 30- mtr. depth zone.30.00-40.00 Between villages Inayatpur, Gurgaon. Silokra and Kherkidaula, Kasan etc.Above – 40.00 Between villages Dundahera, Mulahera, Nathupur, Sirhol, Sukhrali, Sikanderpur, Badha,
Chakarpur etc.BLOCK FARRUKHNAGAR
3.00-10.00 Between village siqbalpur, kherajha jhrola, Mirchwali Dhani & Sultanpur etc.10.00 – 20.00 Between villages Budhera, Khetawas, Dhanwas, Patli, Hazipur, F. Nagar, Mubarikpur,
Sarbasirpur, Daboda, Basonda, Faridpur, Karola, Rajupur Doman, jaraun & Dhani Hiran etc.20.00-30.00 All villages of the block except villages fals upto 20 mtrs. Depth zone villages etc.
BLOCK PATAUDI20.00-30.00 all villages of the block except villages falls upto 30-40 mtr.s depth zone30.00-40.00 Between villages Rampur, Narhera, Pataudi, Mrizapur, Part Dadawas, Milakpur, Khanpur,
Inchhapuri, Mozabad, Bhojpur and nanukalanBLOCK SOHNA
3.00-10.00 Damdama etc. between villages part Baikhera, Sirmathla, Lohsinghani, Khatrika, Ghangola,Bjojpur and part Kantapur etc.
10.00-20.00 Between village Rithoj, Behlpa, Phulwas, Mehndwara, Berka and part Garhi Bazidpur etc.20.00-30.00 All villages of the block except villages falls upto 20 mtr. and above 30 mtr. depth zone30.00-40.00 Khela etc. between villages part Aklimpur and tikli etc.
58 International Journal of Rural Development and Management Studies
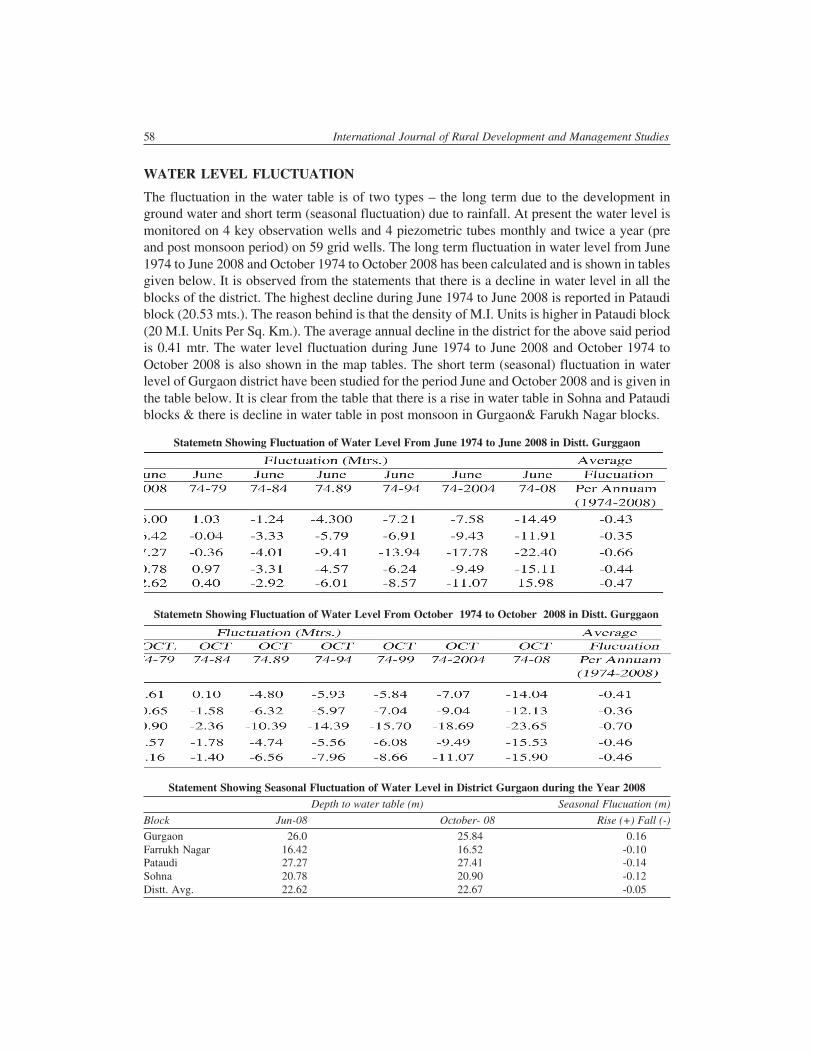
Statement Showing Seasonal Fluctuation of Water Level in District Gurgaon during the Year 2008Depth to water table (m) Seasonal Flucuation (m)
The fluctuation in the water table is of two types – the long term due to the development inground water and short term (seasonal fluctuation) due to rainfall. At present the water level ismonitored on 4 key observation wells and 4 piezometric tubes monthly and twice a year (preand post monsoon period) on 59 grid wells. The long term fluctuation in water level from June1974 to June 2008 and October 1974 to October 2008 has been calculated and is shown in tablesgiven below. It is observed from the statements that there is a decline in water level in all theblocks of the district. The highest decline during June 1974 to June 2008 is reported in Pataudiblock (20.53 mts.). The reason behind is that the density of M.I. Units is higher in Pataudi block(20 M.I. Units Per Sq. Km.). The average annual decline in the district for the above said periodis 0.41 mtr. The water level fluctuation during June 1974 to June 2008 and October 1974 toOctober 2008 is also shown in the map tables. The short term (seasonal) fluctuation in waterlevel of Gurgaon district have been studied for the period June and October 2008 and is given inthe table below. It is clear from the table that there is a rise in water table in Sohna and Pataudiblocks & there is decline in water table in post monsoon in Gurgaon& Farukh Nagar blocks.
Statemetn Showing Fluctuation of Water Level From October 1974 to October 2008 in Distt. Gurggaon
Statemetn Showing Fluctuation of Water Level From June 1974 to June 2008 in Distt. Gurggaon
Impact of Urbanization on Groundwater of Gurgaon District, Haryana, India 59
Depiction of Long Term Water Level Fluctuation during Pre-monsoon (June) 2008
Depiction of Long Term Water Level Fluctuation during Post-monsoon (October) 2008
60 International Journal of Rural Development and Management Studies
GROUND WATER FLOW
In general, the water table contour follows the surface topography. The altitude of water tableranges between 176.78 to 274.85 m at msl. In north and western parts of the district, the watertable slopes north and north-west of the area whereas in southern part water table slopes towardssouthern direction with an average hydraulic gradient of 1.5 m/km.
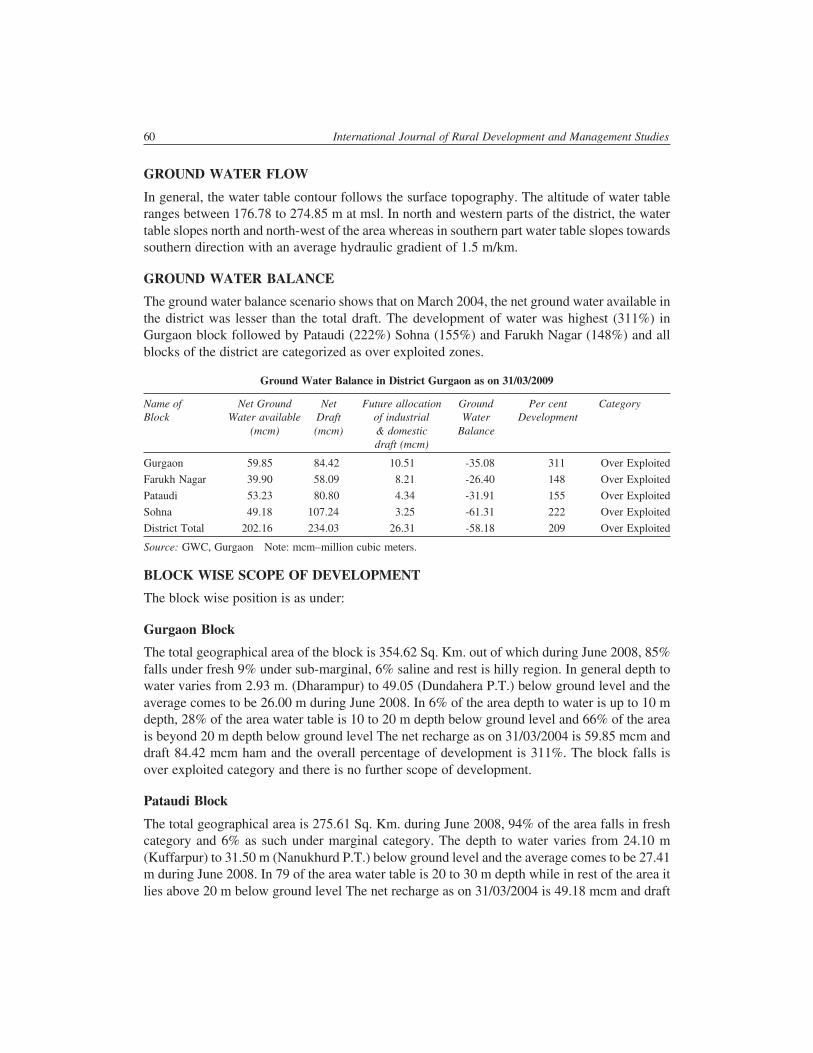
GROUND WATER BALANCE
The ground water balance scenario shows that on March 2004, the net ground water available inthe district was lesser than the total draft. The development of water was highest (311%) inGurgaon block followed by Pataudi (222%) Sohna (155%) and Farukh Nagar (148%) and allblocks of the district are categorized as over exploited zones.
Ground Water Balance in District Gurgaon as on 31/03/2009
Name of Net Ground Net Future allocation Ground Per cent CategoryBlock Water available Draft of industrial Water Development
(mcm) (mcm) & domestic Balancedraft (mcm)
Gurgaon 59.85 84.42 10.51 -35.08 311 Over Exploited
Farukh Nagar 39.90 58.09 8.21 -26.40 148 Over Exploited
Pataudi 53.23 80.80 4.34 -31.91 155 Over Exploited
Sohna 49.18 107.24 3.25 -61.31 222 Over Exploited
District Total 202.16 234.03 26.31 -58.18 209 Over Exploited
The total geographical area of the block is 354.62 Sq. Km. out of which during June 2008, 85%falls under fresh 9% under sub-marginal, 6% saline and rest is hilly region. In general depth towater varies from 2.93 m. (Dharampur) to 49.05 (Dundahera P.T.) below ground level and theaverage comes to be 26.00 m during June 2008. In 6% of the area depth to water is up to 10 mdepth, 28% of the area water table is 10 to 20 m depth below ground level and 66% of the areais beyond 20 m depth below ground level The net recharge as on 31/03/2004 is 59.85 mcm anddraft 84.42 mcm ham and the overall percentage of development is 311%. The block falls isover exploited category and there is no further scope of development.
Pataudi Block
The total geographical area is 275.61 Sq. Km. during June 2008, 94% of the area falls in freshcategory and 6% as such under marginal category. The depth to water varies from 24.10 m(Kuffarpur) to 31.50 m (Nanukhurd P.T.) below ground level and the average comes to be 27.41m during June 2008. In 79 of the area water table is 20 to 30 m depth while in rest of the area itlies above 20 m below ground level The net recharge as on 31/03/2004 is 49.18 mcm and draft
Impact of Urbanization on Groundwater of Gurgaon District, Haryana, India 61
107.24 mcm. The overall percentage development is 222% and the block falls under over exploitedcategory. So there is no further scope of development in the block.
Farukh Nagar Block
The total geographical area is 280.09 sq. km. out of which during June 2008, 96% of the areafalls under fresh, 2% sub-marginal to marginal category. The depth to water in the area variesfrom 9.10 m (Kherla – Jhanjrola) to 16.42 m (Dhana) below ground level and the average comesto be 16.52 m during June 2008. The 7% of the total area is within 10 m depth, 55% area 10 to20 m and in rest of the area water table lies between 20 to 30 m below ground level the netrecharge as on 31/03/2004 is 39.90 mcm. And draft 58.09 mcm. The percentage of thedevelopment in the block is 148% and falls under over exploited category, so there is no furtherscope of development in the block.
Sohna Block
The total geographical area is 339.01 Sq. Km. out of which during June 2008, 80% area fallsunder fresh, 13% under sub-marginal to marginal and rest in hill and saline. The depth to watervaries from 7.30 m (Ghangola) to 31.00 m (Kherla) below ground level and the average comesto be 20.90 during June 2008 10% of the area falls within 10 m depth and in 82% area watertable lies between 0 to 30 m below ground level The net recharge as on 31/03/2004 is 53.23mcm and draft 80.80 mcm. The percentage development is 155% and this block fall in greycategory. Hence, there is no scope of development.
Ground Water Quality
The ground quality zones have been demarcated on the basis of water samples collected fromobservation point (Dug Wells) for determining in the suitability of ground water for irrigationuse. The following criteria on the basis of electrical conductivity have been adopted.
Water Quality Electrical Conductivity(Micro mhos/cm at 25°C)
According to above classification 88% of the total geographical area falls under fresh zoneduring June 2008. The sub-marginal to marginal area is 8% as worked out during the aboveperiod is also suitable for agriculture purpose and can be used for irrigation with little watermanagement practice. During the post monsoon period (October 2008) the area under freshzone comes to 88% and sub-marginal to marginal 9% of the total area. Saline water occurs in allblocks except Sohna and Pataudi blocks.
GROUND WATER EXPLORATION
The detailed exploration of ground water has been carried out by Central Ground Water Board(Northern Region), Chandigarh. Under the exploratory programme of Central Ground Water
62 International Journal of Rural Development and Management Studies
Board, 20 test bore has been drilled out of which 10 boreholes were declared abandoned due toinadequate thickness of granular zones and poor quality of water. In addition 14 boreholes havebeen put in by HSMITC out of these 7 bore successful and remaining have been abandoned.
GROUND WATER RESOURCES
Ground water Resources estimation of the district was done in 2004 for Gurgaon district. Perusalof the estimates reveals overall stage of ground water development in the block is of the order of209% which has exceeded the available recharge and thus the district has been categorized asover exploited. Net annual ground water availability of the district is 20215.12 ham and existinggross water draft for all users is 33055.33 ham.
Gurgaon district is mainly underlain by alluvium of Quaternary age, which forms the principalground water reservoir. Some amount of ground water also occurs in fractures, joints and cervicesof hard rocks found as strike ridges in the district. Granular zones of sand, which occurs interbedded with clay in alluvial formation form the main aquifer system. The upper surface zone ofthe saturation is represented by water levels in dig wells. The ground water in the upper zone,the thickness of which varies from place to place is known to exist down to 70 mm belowground level, hold water under phreatic condition. The aquifers that occur at deeper levels arenormally inter-bedded by sub-regionally to regionally extending alternating impervious toprevious layers of clays. Therefore, ground water in these aquifers occurs under confined tosemi-confined conditions. Ground water in shallow aquifers is exploited through shallow tube-wells whereas deep aquifers are exploited by medium tube-wells.
CONCLUSIONS AND RECOMMENDATIONS
Ground water decline and salinity is the major problem in the district. Ground water is decliningat a rate with the range of 0.77 m/yr. (Bilaspur) to 1.2 m/yr. (Haily Mandi). The stage of groundwater development for the district is 209% that means that net annual withdrawal is more thanthe net annual recharge. During the last 20 years, the ground water level has declined in wholeof the area of the district. All the four blocks fall in over exploited categories. There is no scopefor further ground water development. So there is a need to take measures to arrest the declineof ground water level.
RECOMMENDATIONS
• In order to arrest the declining trend of water level in the district, the roof top rain waterharvesting technology should be adopted and recharge structures may also be constructedin depression areas where water gets accumulated during rainy season. This will help inenhancing the recharge to ground water reservoir.
• Measures should be made to increase the canal water supply for irrigation.• The construction of roof top rain water harvesting structures should be made mandatory in
building bye-laws in all the blocks which will help in checking the falling water trend in.• The crops consuming less quantity of water may be grown in place of crops requiring more
water in the over exploited blocks.• The abandoned dug wells may be cleaned and should be used for recharging the ground
water by utilizing the surface monsoon run off.
Impact of Urbanization on Groundwater of Gurgaon District, Haryana, India 63
• There should be necessity to take up study for revision of tube well draft as well as seepagefactor of canal.
• Replacement of centrifugal pumps with submersible pumps in the steep ground waterdeclining zones should be popularized to avoid failure of tube wells.
• More emphasis should be given in the design and quality control of tube wells for gettingoptimum discharge and to save lot of energy wasted by running inefficient ground waterstructures in the area.
• The area is complex in nature both in regards to existence of aquifer zones and quality of groundwater. So detailed village wise micro level survey is required to be taken up in the area.
• Local populace to be educated regarding consequences of mining of ground water and needfor its effective and economic use.
References
Agarwal, M.C. an Roest, C.J.W. (1996), ‘Towards Improved Water Management in Haryana State, FinalReport of the Indo-Dutch Operational Research Project on Hydrological Studies, Chaudhary CharanSingh Haryana Agricultural University, Hisar. International Institute for Land Reclamation andImprovement and DLO Winand Staring Centre for Integrated Land, Soil and Water Research,Wageningen, the Netherlands.
Chakrapany, R. A. (1981), Hydrology of Gurgaon District, Haryana, Central Ground Water Board, Ministryof Irrigation, Govt. of India.
Chaudhary, B.S., Kumar, M; Roy, A.K. and Ruhas D.S. (1996), Application of Remote Sensing andGeographic Information Systems in Ground Water Investigations in Sohna Block, Gurgaon District,Haryana (India). International Archives of Photogrammetry and Remote Sensing Vienna, Vol. XXXI,Part 136, pp. 18–23
District Gazette, District Gurgaon, Haryana.
Ground Water Resources of India, Central Ground Water Board, New Delhi, 1995.
Integrated Water Resources Development – A Plan for action, Report of the National Commission forIntegrated Water Resource Development, Ministry of Water Resources, New Delhi, 1999.
Narayan, Tulika A. (2002), “The Impact of Credit on Ground Water Use: Recent Evidence for India”Mimeo, College Pack Maryland.
Rao, K. L. (1973), India’s Water Wealth, Orient Longman, New Delhi.
Shah, Tushar, Integrating Water Markets in Sustainable Water Management (Policy School WorkingPaper, Anand, New Delhi)
Swarnakar P and Sharma A.K., Understanding Environmental Gains: An Indian Experience of SustainableDomestic Water Consumption (Updated 2003 April, cited on 2008 Oct. 12) Available from URL:http://www.michaelmbell.net/suscon-abstracts/swanarkar-abs.doc.
Theme Paper ‘Five Decades of Water Resources Development in India’, Indian Water Resources Society,Roorkee, 1998
World Bank (1994), Haryana Water Resources Consolidation Project: Staff Appraisal Report, ReportNo.– 12813. IN, March 1994, the World Bank, Washington DC.
World Bank (1998) India Water Resources Management Sector Review – Initiating and Sustaining WaterSector Reforms, Report No. 18356 – IN. World Bank, Washington DC.