Brodogradnja/Shipbuilding/Open access Volume 69 Number 4, 2018 15 Roberto Vettor Jasna Prpić-Oršić Carlos Guedes Soares http://dx.doi.org/10.21278/brod69402 ISSN 0007-215X eISSN 1845-5859 IMPACT OF WIND LOADS ON LONG-TERM FUEL CONSUMPTION AND EMISSIONS IN TRANS-OCEANIC SHIPPING UDC 629.5.017.2:629.544 Original scientific paper Summary The influence of weather conditions on fuel consumption and CO2 emissions for a containership is assessed by calculating the total added resistance, for various sea-states and relative wave directions, through a time domain procedure. The present article extended a formerly published research presented during the IMAM2015 conference [1] providing a deeper insight of the methodology adopted furtherly discussing the results achieved. In particular, the present paper studies the impact of wind velocity and directionality on the ship speed and its relative importance when compared with the wave added resistance. Moreover, considering the most commonly sailed routes in the North Atlantic, the long-term rate of increment of fuel consumption and CO2 emissions is estimated comparing the resulting ship performance with the wave climate expected for these specific routes. Key words: fuel consumption; emissions; wind loads; speed loss; containership. 1. Introduction The demand of international trades is expected to continuously increase in the next years, and so will the relevance of maritime shipping for the global economy and its burden on the ecosystems. In the last decade, the International Maritime Organization (IMO) promoted the exploration of solutions aimed at limiting the air pollution caused by ships in terms of a reduction of emissions of greenhouse gasses (GHGs). Possibilities of effective interventions have been identified both in the design and in the operational phases. As a consequence two indices have been developed to serve as a reference for monitoring the emissions and stimulating to pursue innovative solutions. The Energy Efficiency Design Index (EEDI, [2]) is a measure of the ship’s energy efficiency and relates the CO2 emissions to a nominal transportation work rate depending on the ship type and technical characteristics. In the Energy Efficiency Operational Indicator (EEOI, [2]), instead, the efficiency of a specific voyage is calculated by comparing the emissions to the effective cargo carried and the length of the journey. At the design phase, the energy efficiency can be improved through the optimization of speed and cargo capacity, propulsion system and the form of the hull and the superstructure, leading to reductions between 10% to 50%. A similar improvement can be obtained in the operational phase by making weather routing, fleet management and efficient logistics be part
Transcript
Brodogradnja/Shipbuilding/Open access Volume 69 Number 4, 2018
Roberto Vettor, Jasna Prpić-Oršić, C. Guedes Soares Impact of wind loads on long-term fuel consumption
and emissions along the main North Atlantic routes
16
of the daily activity of any ship operator. Overall emissions could be lowered of a rate that
ranges between 25% and 75% if the two approaches are combined [3]. To ensure future
maritime transportations to be cleaner, but also more competitive, a key role has to be played
by the shipping industry, placing energy efficiency and environmental protection at a first place
since the design phase.
Environmental loads are among the most important factors influencing the fuel
consumption of a vessel in navigation. This is clearly shown in [4] where a fuel efficiency
model is proposed from the analyzes of log data of container-ships. Not only ship resistance is
increased due the effect of waves and wind on the hull and superstructures. Indeed, the
efficiency of the propulsion system is also reduced, generally with the effect of requiring more
power, decreasing the attainable ship speed and increasing the fuel consumption and emissions.
Moreover, ship motions may induce the Shipmaster to voluntary reduce the speed, increasing
the complexity of an accurate assessment of ship performance in seaways.
In the past ship design was often focused on meeting the requirements of the trial tests,
thus the hull resulted optimized to navigate at the design speed in still water and at full load
draft. Such a condition has an extremely low probability to be encountered in real operations.
Instead, the ship will frequently be partially loaded, in some cases sailing at different speeds
and, as shown in [5], in an environment far from the ideal still water.
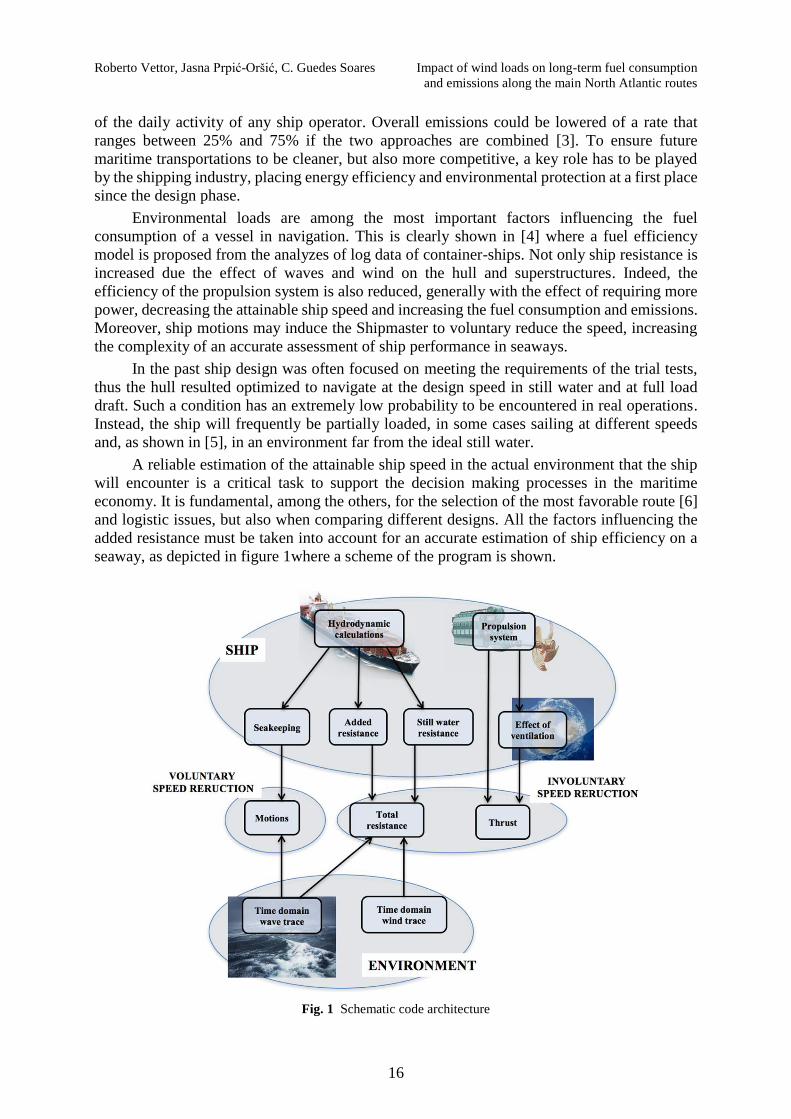
A reliable estimation of the attainable ship speed in the actual environment that the ship
will encounter is a critical task to support the decision making processes in the maritime
economy. It is fundamental, among the others, for the selection of the most favorable route [6]
and logistic issues, but also when comparing different designs. All the factors influencing the
added resistance must be taken into account for an accurate estimation of ship efficiency on a
seaway, as depicted in figure 1where a scheme of the program is shown.
Fig. 1 Schematic code architecture
Impact of wind loads on long-term fuel consumption Roberto Vettor, Jasna Prpić-Oršić, C. Guedes Soares
and emissions along the main North Atlantic routes
17
The irregular sea and wind loads are simulated in the time domain for the specific sea
state. While the effect of waves has been discussed in previous articles of the authors [7], [8],
this work focuses on the effect of wind on the involuntary speed reduction, and on fuel
consumption. Wind loads on marine structure have been largely studied in the literature. A
review of the methods can be found in [9]. In most of the cases, wind is studied for its negative
effect on safety and maneuverability [10], [11], especially on ships with large exposed surface
when sailing in congested areas or in ports. The combined effect of wind and waves on
attainable speed has been studied by [12] with an application to a bulk carrier. In [13] added
resistance due to both wind and waves is considered to develop a semi-empirical performance
prediction model. An estimation of the extreme wind loads can be found in [14], where four
methods have been used to compute ahead force, a side force and the yawing moment. The
statistical analysis of noon reports of ships with large exposed area (pure track or car carrier),
has been performed by [15]. The fuel consumption and speed curves corresponding to different
Beaufort have been estimated, showing an increase of the resistance of 1.6% in head wind
compared to side wind. [16] showed that speed loss due to wind may be comparable to the one
due to waves for high ship speeds and heavy weather conditions. [17] assessed the resistance
and consumption due to wind to account for up to one third of the total ones in challenging
weather conditions.
In this paper, the impact of wind loads on the speed loss and fuel consumption is estimated
in the time domain considering a pre-defined initial cruise speed and the forces acting on the
superstructures due to a simulated realistic wind profile. the attainable ship speed in a given
condition is then assessed as the mean values of the resulting ship speed time-series. In section
2 methodology adopted for the simulation of a realistic wind time-series is presented. Section
3 describes the computation of the wind load on the hull above the sea level and the
superstructure, and of the effect on the propulsion system. Section 4 underlines the method used
to assess the long-term effect of wind in a seaway. The application of the method to a
containership is shown in section 5, providing a quantitative assessment of the relevance of
wind in the speed drop when compared to waves. Conclusions and final remarks are discussed
in section 6.
2. Wind time series simulation
The program allows to compute the ship speed in time affected by a fluctuating wind
profile. This is obtained by superposing a turbulent (gust) component to the mean speed, aiming
at realistically reproduceing the actual condition encountered by a ship. Thus, the generation of
the wind trace is fundamental for a reliable estimation of attainable speed and, consequently,
fuel consumption.
The horizontal component is described by the mean direction, the mean speed, and its
fluctuation aiming at capturing the stochastic nature of wind, continuously varying in time and
space. Instead, the vertical component of wind velocity is usually neglected in practical
applications.
For a given mean speed, the fluctuation can be represented as a random process with zero
mean, distributed in frequency according to a spectrum called the gust spectrum. The
description of such a turbulent process is very complex task, which has been largely studied in
the literature in order to represent the fluctuating component in terms of a gust spectrum.
Proposed formulations include among the others: the Harris (1971) spectrum [18], the
Davenport spectrum [19] that derives from measurements on land, [20], [21] and NPD Wind
[22]. The program, initially developed in [7] has been extended to include the effect of wind
according to the previous considerations. The code supports the calculation of the gust
component by applying the formulations of Harris or Davenport.
Roberto Vettor, Jasna Prpić-Oršić, C. Guedes Soares Impact of wind loads on long-term fuel consumption
and emissions along the main North Atlantic routes
18
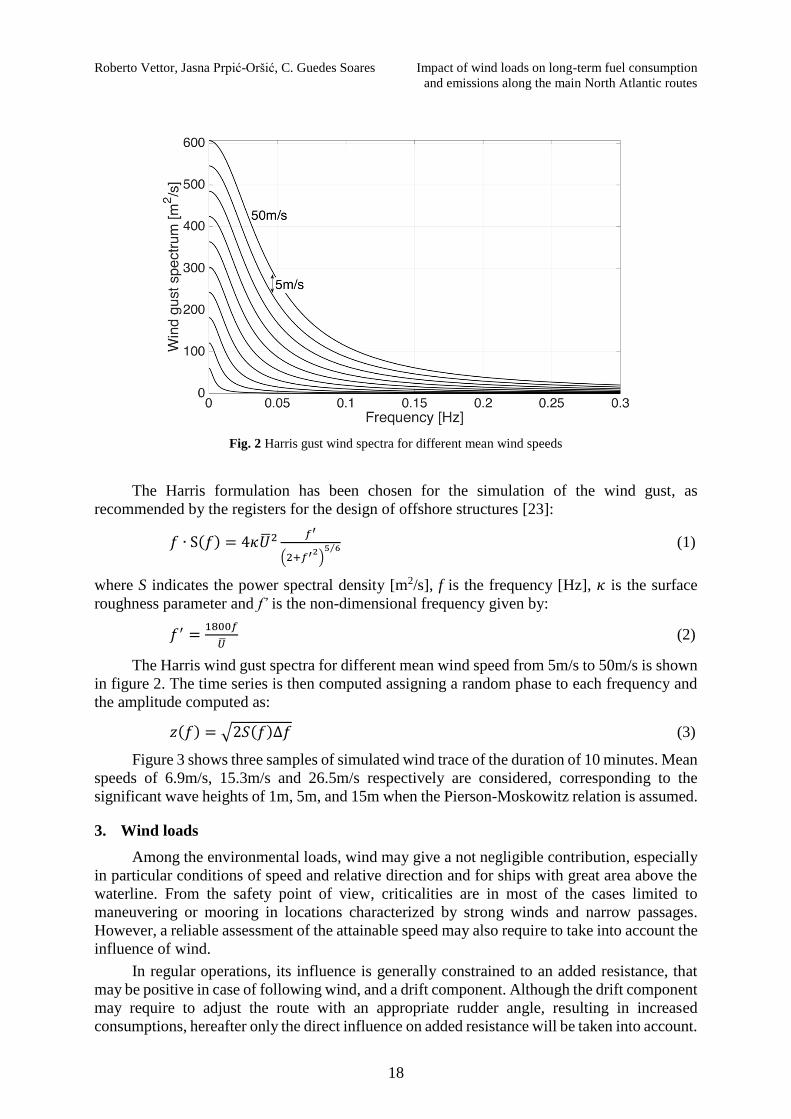
Fig. 2 Harris gust wind spectra for different mean wind speeds
The Harris formulation has been chosen for the simulation of the wind gust, as
recommended by the registers for the design of offshore structures [23]:
𝑓 ∙ S(𝑓) = 4𝜅�̅�2 𝑓′
(2+𝑓′2)5 6⁄ (1)
where S indicates the power spectral density [m2/s], f is the frequency [Hz], 𝜅 is the surface
roughness parameter and f’ is the non-dimensional frequency given by:
𝑓′ =1800𝑓
�̅� (2)
The Harris wind gust spectra for different mean wind speed from 5m/s to 50m/s is shown
in figure 2. The time series is then computed assigning a random phase to each frequency and
the amplitude computed as:
𝑧(𝑓) = √2𝑆(𝑓)∆𝑓 (3)
Figure 3 shows three samples of simulated wind trace of the duration of 10 minutes. Mean
speeds of 6.9m/s, 15.3m/s and 26.5m/s respectively are considered, corresponding to the
significant wave heights of 1m, 5m, and 15m when the Pierson-Moskowitz relation is assumed.
3. Wind loads
Among the environmental loads, wind may give a not negligible contribution, especially
in particular conditions of speed and relative direction and for ships with great area above the
waterline. From the safety point of view, criticalities are in most of the cases limited to
maneuvering or mooring in locations characterized by strong winds and narrow passages.
However, a reliable assessment of the attainable speed may also require to take into account the
influence of wind.
In regular operations, its influence is generally constrained to an added resistance, that
may be positive in case of following wind, and a drift component. Although the drift component
may require to adjust the route with an appropriate rudder angle, resulting in increased
consumptions, hereafter only the direct influence on added resistance will be taken into account.
Impact of wind loads on long-term fuel consumption Roberto Vettor, Jasna Prpić-Oršić, C. Guedes Soares
and emissions along the main North Atlantic routes
19
Fig. 3 10 minutes wind time-series corresponding to mean speeds of 6.9m/s, 15.3m/s and 26.5m/s
A thorough mathematical model can be found, for instance, in [10].
Equation 4 can be applied for the calculation of the longitudinal force imposed by wind:
𝐹𝑤𝑖𝑛𝑑 =1
2𝐶𝑋𝑊𝐴𝑇𝜌𝑎𝑖𝑟𝑈𝑟𝑒𝑙
2 (4)
where CXW is the aerodynamic drag force coefficient, AT is the frontal wind exposed area, ρair is
the air density and Urel is the relative wind speed. The increased ship resistance due to the rudder
correction necessary to keep the course has been neglected.
The area above the sea-level is typically not considered when tank tests or wave added
resistance numerical software which provide information on hull resistance. Nevertheless this
exposed area is affected by presence of the wind that, due to the forward ship speed, exist even
in the mildest weather conditions. Due to this self-component, both speed and direction of the
natural wind must be adjusted when calculating the wind as seen by the ship. In figure 4 a
schematic representation of absolute and relative wind direction is provided.
Fig. 4 Schematic representation of the relative wind
Roberto Vettor, Jasna Prpić-Oršić, C. Guedes Soares Impact of wind loads on long-term fuel consumption
and emissions along the main North Atlantic routes
20
For the computation of the relative wind speed and direction (by convention zero
corresponds to following wind) the following equations can be applied:
𝑈𝑟𝑒𝑙 = √𝒖𝑟𝑒𝑙2 + 𝒗𝑟𝑒𝑙
2 (5a)
𝜓𝑟𝑒𝑙 = 𝑎𝑡𝑎𝑛2(|𝒖𝑟𝑒𝑙|, |𝒗𝑟𝑒𝑙|) (5b)
where urel and vrel are the longitudinal and lateral component respectively given by the
equations:
|𝒖𝑟𝑒𝑙| = −𝑈𝑤𝑖𝑛𝑑 cos(𝜓 − 𝜋) − 𝑉𝑠ℎ𝑖𝑝 (6a)
|𝒗𝑟𝑒𝑙| = 𝑈𝑤𝑖𝑛𝑑 sin(𝜓) (6b)
Equation 4 moves the problem of calculating aerodynamic force to the critical estimation
of the drag force coefficient CXW. Albeit wind tunnel tests (e.g. [24]) are recommended for
accurate results, such trials are typically expensive and time consuming. CFD calculations are
nowadays possible alternatives [25], nevertheless factors such as the relative direction, the ship
draft and the cargo distribution (e.g. in a containership), as well as the relative direction, have
an influence on CXW, as shown in [26]. Thus, the applicability of these methodologies to
operative problems is limited.
For practical application one can opt to a faster numerical formulation for the estimation
of the wind loads. In literature numerous proposals can be found:
Gould [27], [28] studied effect of wind on the superstructures considering a
logarithmic wind profile, aiming at the development a procedure for the estimation of
the resulting forces and moments.
Isherwood [29] based his analysis on several results published in literature relative to
a wide range of ships and relative directions and introduced regressions providing
lateral and side wind forces and yaw moment.
Blendermann [30], [31] performed various wind tunnel tests on scale model
systematically collecting the results. The statistical analysis of such a database
permitted the formulation of expressions to relate wind drag force coefficients (for
both forces and moments) to the frontal and lateral projected areas depending on the
angle of attack of wind.
The OCIMF method [32] is suitable for very large crude carriers (VLCCs) and has
been developed from statistics on a database of wind tunnel tests.
It is necessary to remember that, while the previous methods can provide an indication
for standard cases, in critical situations it is recommended to verify them with experiments.
Indeed, often the outcomes are not in agreement as they derive from different assumptions and
databases, as shown in [9] where a comparative study is performed.
Isherwood method is used in the this work to estimate the drag force coefficient for the
wind directions from 0° to 180° with a step of 30° (see table 2). A spline interpolation is then
applied to take into account the actual relative direction at each step.
According to the method proposed by [29], the drag force coefficient can be readily
estimated when knowing a number of dimensions of the ship: the overall length 𝐿𝑂𝐴, the beam
𝐵, the lateral and transverse projected 𝐴𝐿 and 𝐴𝑇, the length 𝑆 of the perimeter of the lateral
projection excluding waterline and slender bodies, the distance from bow of the centroid of the
lateral projected area 𝐶 and the number of distinct groups of masts or kingposts. Thus, the
coefficient is given by the equation:
𝐶𝑋𝑊 = 𝐴0 + 𝐴12𝐴𝐿
𝐿𝑂𝐴2 + 𝐴2
2𝐴𝑇
𝐵2+ 𝐴3
𝐿𝑂𝐴
𝐵+ 𝐴4
𝑆
𝐿𝑂𝐴+ 𝐴5
𝐶
𝐿𝑂𝐴+ 𝐴6𝑀 (7)
Impact of wind loads on long-term fuel consumption Roberto Vettor, Jasna Prpić-Oršić, C. Guedes Soares
and emissions along the main North Atlantic routes
21
The actual speed that the ship is able to sustain is computed at each time-step comparing
the thrust provided by the propeller and the total resistance including the variating wind force.
A B-series propeller [33] is assumed and the required number of revolution (RPM) is calculated
according to the relative torque characteristics and the wake fraction. A constant engine torque
is considered by accounting for the mass inertia of the ship and engine performance.
Depending on the difference between the initial and the attainable speed, the system may
take some cycles to reach a stationary condition, from where the mean speed can be considered
as representative of the attainable speed. In [7] more details on the model are provided.
4. Effect on a seaway
The model for the calculation of the forces that wind imposes to the ship has to be matched
with appropriate weather information depending on the purpose. If the estimation of wind effect
on a near future route is required, output of a numerical weather forecast has to be used.
Differently, considering a historical weather database allows assessing the long-term effect (see
[34]). In the following the second approach is adopted.
A wave database contains climatological data in a spatial grid covering a specific area,
which can be obtained from simulation models, measurements or observations. The state of the
art wave models [35], [36] allow to solve the spectral energy equation and assess how the
directional wave spectrum propagates in space and time. Due to the continuous evolution of
both numerical models and data assimilation schemes differences in the long-term results may
in some cases be related to these changes rather than to the natural variability of weather. In
order to allow comparisons and significant statistics for a specific long period of time, weather
databases are generated by running the same model over the desired period as to overcome the
numerical inhomogeneities. Such a process is called reanalysis [37]. It must be noted that the
issue of differences in measured data coverage over time cannot be solved.
The state-of-the-art product ERA-interim reanalysis [38] from the European Centre for
Medium-Range Weather Forecast (ECMWF) is used in this work. The database has been
generated from 1979 and is updated in real time, covering the entire globe. Besides atmospheric
variables, the ERA-Interim also includes wave parameters, produced using the ECMWF
Integrated Forecasting System by a two-way coupled atmosphere-wave model system. The
wave model used is the WAM model with a four-dimensional Variational Data Assimilation
(4DVAR) scheme. Observations of ocean wind speeds from VOS, buoys, satellite scatterometer
and (when available) satellite altimeter SWHs were assimilated in the analysis process. The
database consists of 6-hourly global fields with a 1°x1° grid resolution for the wave parameters.
Figure 7 shows the global mean SWH computed from the ERA-interim database.
The statistical multivariate distribution of all variables involved in the process is
calculated from the ERA-interim database. When only the wind is considered it reduces to the
bivariate distribution of mean wind speed and direction. Instead, when the effect of waves is
also included, it becomes a five-variate distribution of significant wave height (HS), wave peak
period (TP), mean wave direction , mean wind speed (WS) and direction (WD). In this work a
different probability distribution has been calculated for each one of the routes analysed
considering the effective climate on their path, making the results more detailed.
When both wind and waves are taken into account, the long term influence on the speed
reduction is computed assuming the superposition of the effects, such as:
ΔV = ∑ [𝑝𝑖(ΔV𝐻𝑆,𝑇𝑃,𝜃 +ΔV𝑊𝑆,𝑊𝐷)]𝐻𝑆,𝑇𝑃,𝜃,𝑊𝑆,𝑊𝐷
(8)
where ΔV𝐻𝑆,𝑇𝑃,𝜃 and ΔV𝑊𝑆,𝑊𝐷 are the speed drops due to waves and wind respectively and 𝑝𝑖 is
the probability of encountering the specific weather condition.
Roberto Vettor, Jasna Prpić-Oršić, C. Guedes Soares Impact of wind loads on long-term fuel consumption
and emissions along the main North Atlantic routes
22
Knowing the attainable speed of the ship, the average fuel consumption on the seaway is
given by:
FOC = 𝐶𝑐𝑜𝑛𝑣 ∙𝑆𝐹𝑂𝐶∙𝐵𝑃
𝑉∙ 𝐿𝑟𝑜𝑢𝑡𝑒 (9)
where SFOC is the specific fuel oil consumption in g/kWh, BP is the engine brake power in
kW, V is the ship speed in knots, 𝐿𝑟𝑜𝑢𝑡𝑒 is the length of the route in nautical miles and 𝐶𝑐𝑜𝑛𝑣 =10−6 is a conversion coefficient to obtain the FOC in metric tonnes.
Strictly, when the ship drag is increased, also the propeller load is increased, thus, if the
engine torque is constant, the engine speed will drop meaning the engine power would also
drop. Furthermore, every change would also result in the change of the SFOC. For slight
changes, however, the engine working point does not undergo large variations, thus constant
power condition may be assumed and the SFOC may be considered constant as well.
Being the present work focused on the long-term effect on fuel consumption and
emissions rather than on operational or extreme conditions, the inaccuracy introduced do not
have a significant impact on the results. Heavy weather conditions, in fact, are encountered very
seldom due to the tendency of ship to avoid storms. As an example, in the most severe route
considered (denoted as Ch_VA in figure 7), a ship has about 8% probability to encounter a
significant wave height greater than 5m.
5. Numerical example
The S175 containership has been used to test the developed code. The cruise speed set as
initial condition is 21 knots and requires from the main engine 27.5MW to be sustained in calm
water. This condition corresponds to a fuel oil consumption (FOC) of 224kg/nmi. In table 1 the
main dimensions of the ship are listed, while the drag force coefficients calculated according to
Isherwood method are shown in table 2.
In figure 5 the attainable ship speed for different relative direction is plotted in function
of the absolute wind speed. When wind speed is moderate, namely lower than 6-8 m/s the
influence of the self-wind component caused by the ship speed is predominant. The impact of
natural wind can be appreciated for stronger wind speeds, although in the considered conditions
a decrease of 0.5 knots at most can be found.
Table 1 Main dimensions of the S175 containership
Length between perpendiculars 175.0 m
Breadth moulded 25.4 m
Design draft 9.5 m
Lateral projected area 3710 m2
Transverse projected area 756 m2
Table 2 Aerodynamic drag force coefficient for different relative wind directions
Wind dir. CXW
0 -0.136
30 -0.230
60 -0.146
90 -0.025
120 0.192
150 0.313
180 0.146
Impact of wind loads on long-term fuel consumption Roberto Vettor, Jasna Prpić-Oršić, C. Guedes Soares
and emissions along the main North Atlantic routes
23
Fig. 5 Speed loss due to wind for different relative wind directions
The wind direction of 150° is selected, being the direction from where wind has the most
important effect on speed loss, to compare it with the effect of waves. The results are shown in
figure 6 for wind and wave separately, as well as their combined effect [39].
The case of fully developed sea-states is considered, that is wind speed and SWH are
considered correlated through the Pierson-Moskowitz relation, such as:
SWH = 0.22𝑈𝑤𝑖𝑛𝑑2
𝑔 (10)
It is thus assumed that wind and waves are aligned, which is generally true for developing
seas, but may be not the case in the open ocean on a swell dominated sea-state.
Fig. 6 Speed loss due to wind, waves and the combined effect for sea-states from 150°
Roberto Vettor, Jasna Prpić-Oršić, C. Guedes Soares Impact of wind loads on long-term fuel consumption
and emissions along the main North Atlantic routes
24
Fig. 7 Main North Atlantic routes (from [5]). Background colour shows the winter mean significant wave height
(in meters).
The red and blue curves show a stabilization and small increase of the ship speed when
𝐻𝑆 exceeds 8 meters. The reason can be attributed to the use of a one parameter spectral model.
When wave heights increase, wave periods does the same, eventually resulting in lower motions
and loads on the hull.
Except for very low SWH, the wind effect on reducing ship speed in operations is in
general minor when compared to the total environmental loads. This effect settles on values of
about 6% for sea-states characterized by SWH higher than 5m.
Fig. 8 Rate of increment of fuel consumption and CO2 emissions due to environmental factors in the main North
Atlantic routes.
Impact of wind loads on long-term fuel consumption Roberto Vettor, Jasna Prpić-Oršić, C. Guedes Soares
and emissions along the main North Atlantic routes
25
A database derived from [40] has been here used for the estimation of the long-term effect on
fuel consumption and CO2 emissions. It describes the real weather experienced by ships
navigating on the routes identified in [5] and showed in figure 7. Figure 8 shows the results of
such analysis in terms of percentage of increment, with respect to calm weather, caused by the
wind. The sole effect of waves and the combination of both environmental factors are also given
for comparison. The portion due to wind has an overall contribution of about 0.4% of increment
of FOC, which, although small can be not negligible when detailed analysis is performed.
Moreover, this rate refers to open waters, characterised by a significant predominance of swell
or fully-developed sea-states. It can be expected to increase when routes on marginal seas are
considered, such as Mediterranean or Baltic.
As it was expectable, northern routes, which include the areas where extratropical storms
generate, are those more conditioned by environmental factors. In these cases, an increase of
6% in the FOC can be accounted in the long term. This is not the case for the southern routes
and especially the one between the Strait of Gibraltar and Miami where the influence of weather
is lower than 2%.
6. Conclusions
The impact of wind load on ship speed loss, fuel consumption and CO2 emissions has
been studied for different weather that ships may encounter. Furthermore, the long-term effect
for some important trans-oceanic routes has been estimated.
For a given weather condition a realistic wind time-series is simulated by considering
appropriate wind gust spectra. Then the ship speed is calculated in the time domain considering
step by step the actual wind load affected by the relative speed and direction. Finally, the mean
of the resulting speed profile is considered representative of the mean attainable speed. The
long-term influence of environmental loads on speed reduction, fuel consumption and
emissions is studied by considering the actual weather that a ship faces while sailing a specific
route. For this purpose, the join probability of encountering determined weather conditions has
been taken into account through the analysis of the climate which characterises the main North
Atlantic routes.
Within 0° and 60°, wind pushes the vessel and, in hypothetical calm waters, allows the
conservation of the cruise speed and its minor increment for stronger winds (indicatively with
speeds higher than 14m/s). The worst conditions are for wind from 120° and 150° due to the
loading of containers above the deck which extends the area exposed to wind, resulting in an
increase of the drag force coefficient. Even in these cases, however, the speed drop is limited
to less than one knot.
The increment in the fuel consumption and CO2 emissions only due to wind appears to
be small. On the other hand, when it is neglected it leads to an underestimation of roughly 0.6%,
As a regerence, it means as much as 5 tonnes of fuel in a trans-oceanic passage as an average.
The results show that long-term effect of wind is much lower than the one of waves, and
its low percentages may follow within the general uncertainties of environmental loads when
considering the lifetime of a ship. Different results could come if specific operations are
considered. For instance, for ships sailing in storms at low speed, in congested or restricted
waters or in developing sea-states typical of marginal seas, a greater impact of wind can be
expected.
In the present study wind speed and SWH are correlated according to the Pierson-
Moskowitz relation, that is fully developed sea-states are considered. Due to this assumption,
the effect of wind in marginal seas or sheltered areas, where the occurrence of developing seas
is higher, can be underestimated. To take into account these conditions, further studies
Roberto Vettor, Jasna Prpić-Oršić, C. Guedes Soares Impact of wind loads on long-term fuel consumption
and emissions along the main North Atlantic routes
26
excluding the strict dependency of wind and waves are necessary. Nevertheless, due to the high
computational demand of such analysis with the time-domain program used, they have not been
carried out in the present work.
The results confirm the expectations on the effect of wind loads and its proportion with
respect to wave loads. Nevertheless, due to the minor relative influence of wind on speed loss,
the differences between the approach presented in this paper and traditional methodologies is
expected to be negligible. Taking into account the higher complexity of the technique here
proposed, this is not expectable to supersede traditional methods which can be considered
sufficiently reliable for the scope of ship operations.
ACKNOWLEDGEMENTS:
This work was performed within the project SHOPERA-Energy Efficient Safe SHip
OPERAtion, which was partially funded by the EU under contract 605221.
This work was also supported by the University of Rijeka (contract no. 13.09.1.1.05) and
Croatian science foundation -project 8722.
The first author was supported by the Portuguese Foundation for Science and Technology
(FCT - Fundação para a Ciência e Tecnologia, Portugal) under the contract no.
SFRH/BD/89476/2012.
REFERENCES
[1] R. Vettor, J. Prpić-Oršić, and C. Guedes Soares, “The effect of wind loads on the
attainable ship speed on seaways,” in Towards Green Marine Technology and Transport,
C. Soares, Guedes, R. Dejhalla, and D. Pavletić, Eds. Taylor & Francis Group, London,
2015, pp. 867–873.
[2] IMO, “Prevention of Air Pollution from Ships, IMO GHG study. MEPC 63 and 64.
International Maritime Organization.,” 2012.
[3] IMO, “PREVENTION OF AIR POLLUTION FROM SHIPS Opportunities for
Reducing Greenhouse Gas Emissions from Ships. MEPC 58/INF.21. International
Maritime Organization,” 2008.
[4] Q. Meng, Y. Du, and Y. Wang, “Shipping log data based container ship fuel efficiency
modeling,” vol. 83, pp. 207–229, 2016.
[5] R. Vettor and C. Guedes Soares, “Detection and analysis of the main routes of voluntary
observing ships in the North Atlantic,” J. Navig., vol. 68, no. 2, pp. 397–410, 2015.
https://doi.org/10.1017/S0373463314000757
[6] R. Vettor and C. Guedes Soares, “Multi-objective evolutionary algorithm in ship route