Impact of Software Vulnerability Announcements on the Market Value of Software Vendors – an Empirical Investigation 1 Rahul Telang, Sunil Wattal {rtelang, swattal}@andrew.cmu.edu Carnegie Mellon University February 2005 1 The authors would like to thank Ashish Arora, Ramayya Krishnan, Sandra Slaughter, participants at the Security Working Group Meeting at Heinz School of Public Policy, and Workshop on Information Systems and Economics (WISE 2004) for helpful comments and suggestions.
Transcript
Impact of Software Vulnerability Announcements on the Market Value of Software Vendors – an Empirical
Investigation1
Rahul Telang, Sunil Wattal
{rtelang, swattal}@andrew.cmu.edu
Carnegie Mellon University
February 2005
1 The authors would like to thank Ashish Arora, Ramayya Krishnan, Sandra Slaughter, participants at the Security Working Group Meeting at Heinz School of Public Policy, and Workshop on Information Systems and Economics (WISE 2004) for helpful comments and suggestions.
ABSTRACT
Researchers in the area of information security have mainly been concerned with tools,
techniques and policies that firms can use to protect themselves against security breaches.
However, information security is as much about security software as it is about secure software.
Software is not secure when it has defects or flaws which can be exploited by hackers to cause
attacks such as unauthorized intrusion or denial of service attacks. Any public announcement about
a software defect is termed as ‘vulnerability disclosure’.
Although research in software economics have studied firms’ incentive to improve overall
quality, there have been no studies to show that software vendors have an incentive to invest in
building more secure software. In this paper, we use the event study methodology to examine the
role that financial markets play in determining software vendors’ incentives to build more secure
software. We collect data from leading national newspapers and industry sources like CERT by
searching for reports on published software vulnerabilities. We show that vulnerability disclosures
lead to a negative and significant change in market value for a software vendor. On average, a
vendor loses around 0.6% value in stock price when a vulnerability is reported. This is equivalent
to a loss in market capitalization values of $0.86 billion per vulnerability announcement. To
provide further insight, we use the information content of the disclosure announcement to classify
vulnerabilities into various types. We find that the change in stock price is more negative if the
vendor fails to provide a patch at the time of disclosure. Moreover, vulnerabilities which cause a
confidentiality related breach cause a greater decline in the market value for a vendor than the
vulnerabilities which cause non-confidentiality related breaches. Also, more severe flaws have a
significantly greater impact than flaws with low or moderate severity. Finally, we find that the
markets do not punish a software vendor more severely if a third party discovers a flaw in its
product than if the vendor itself discovers the flaw. Our analysis provides many interesting
implications for software vendors as well as policy makers.
Keyword: information security, software vulnerability, quality, event study, disclosure policy
1
1. Introduction
Many believe that software vendors typically follow the policy of ‘sell today and fix it
tomorrow’; or ‘I’d rather have it wrong than have it late’ (Paulk et al 1994; Arora,
Caulkins, Telang 2004) for launching software products in the market. This policy,
dictated by the need to launch products quickly before competitors, seemed to work in the
past because software errors which escape detection during pre-launch testing appear very
infrequently in normal operations (once every ‘5000’ years, as per Adams, 1980).
However, Adams’ ‘5000-year error’ theory might not hold in the internet age because
hundreds (if not thousands) of people are looking for flaws in other vendors software
products, drastically increasing the chances that a flaw will be exposed. Various people
such as hackers, independent security firms and academic researchers are interested in
finding flaws in other vendors’ software for different reasons. Not only are security
software products such as firewalls at risk, but software like operating systems, enterprise
software and database software also contain flaws which can be exploited to create security
related attacks.
The Organization of Internet Safety (OIS) (www.oisafety.org) defines security
vulnerability as2: “security vulnerability is a flaw within a software system that can cause it
to work contrary to its documented design and could be exploited to cause the system to
violate its documented security policy”. Software vulnerabilities have widespread impact
and can potentially cause billions of dollars in downtime and disruptions to firms (In this
paper, the word ‘firms’ refers to companies which use software products; ‘vendors’ refers
to companies which develop the software products). A study by NIST in 2002 estimates
the cost of faulty software at $60 bn per year. Incidents like the Code Red virus (in 2001)
and the Melissa virus (in 1999) occurred when hackers exploited flaws in software. The
damage due to Code Red was estimated at $2.1 bn and due to Melissa at $1.1bn3. The
Gartner Group estimates that the system downtime caused by security vulnerabilities
would triple from 5% of the total downtime in 2004 to 15% of the total downtime in 2008.4
In 2003, Computer Emergency Response Team (CERT) reported around 250,000 self 2 In this paper, we use the terms ‘software vulnerability’, ‘security vulnerability’, ‘bug’, ‘flaw’ interchangeably. Any other type of vulnerability such as a non-security related vulnerability explicit mentioned by name. 3 Source : www.cisco.com/warp/public/cc/so/neso/sqso/roi1_wp.pdf 4 http://www.tekrati.com/T2/Analyst_Research/ResearchAnnouncementsDetails.asp?Newsid=3608
Our second hypothesis pertains to whether the software vendor releases a patch for the
product at the time of the vulnerability announcement. As per the popular convention
followed in the vulnerabilities market, vendors are given some time to work on a patch for
the vulnerability before it is made public. Vendors may also provide a workaround (such as
disabling features of the software) when a vulnerability is disclosed and choose to address
the vulnerability in a future upgrade. Presence of the patch is also likely to reduce
customers’ loss if they apply the patch. Since presence of patch also reflects vendor’s
commitment to its customers we expect that vulnerabilities disclosed with a patch will
compensate, to an extent, the negative signal due to vulnerability disclosure. Vendors are
also pushing for limited disclosures so that they can release the remedial patch in time.
This also suggests that patches play a critical role. Therefore our second hypothesis is:
H2: CAR (Cumulative Abnormal Return) [negative] of a stock is greater for vulnerabilities
where the software vendor does not release a patch at the time of the vulnerability
disclosure.
The damages suffered by a software vendor’s customers due to a vulnerability in the
vendor’s software depend on the type of security breach that the vulnerability facilitates.
Campbell et at (2003) classify the security breaches as confidentiality related and non-
confidentiality related. Confidentiality related breaches involve attacks where an intruder
can gain access into a system and can steal sensitive information. Non-confidentiality
related breaches include attacks like denial of service (DoS) attacks where the most likely
scenario is a disruption and/or a downtime. Campbell et al (2003) further show that the
loss in market value is more for confidentiality related breaches than for non-
confidentiality related breaches. Hovav and D’Arcy (2003) show that DoS attacks are not
associated with any significant loss in market value for a firm. Therefore we would expect
that the vendor loses more market value if the vulnerability in its software causes a
confidentiality related breach. The intuition is that the negative reaction due to the
vulnerability is more if the customers can potentially suffer greater losses due to the
vulnerability. Therefore, our next hypothesis is:
H3: CAR is greater for a vulnerability which can potentially cause a breach in
confidentiality as compared to non-confidentiality related breaches.
10
The impact of a software flaw on a vendor also depends on how severe the
vulnerability is. Davidson and Worrell (1992) conduct an event study with product defect
announcements in the tire industry and showed that the impact of severe flaws (which
involve a recall) is more than that of less severe flaws (which involve repairs but nor
recall). Sometimes an ‘exploit’ exists for the vulnerability at the time of announcement. An
‘exploit’ is a piece of code which anyone can use to compromise the security of the
software product and subsequently of other information assets. Therefore, we propose our
next set of hypotheses as:
H4a: The loss in market value of a software vendor is greater if the announced
vulnerability has a higher severity.
H4b: The loss in market value of a software vendor is greater if an exploit exists publicly
at the time of the vulnerability announcement.
A recent article in the Wall Street Journal hinted that firms are using vulnerability
disclosure as a strategic weapon against competitors. E.g. ISS disclosed a vulnerability in
rival Checkpoint’s flagship firewall product just ahead of Checkpoint’s investor summit.
Vendors themselves disclose vulnerability information in their products routinely. In fact,
many believe that vendors would prefer not to disclose information at all but they fear that
someone else would do it. Generally vendors are likely to be more careful about the
disclosure as opposed to third party. Moreover, disclosure by vendors would signal their
commitment to providing secure software, we hypothesize that
H5: The loss in market value for a software vendor is lower in case the security
vulnerability is discovered by the vendor itself rather than by rivals or third party security
firms.
Our final hypothesis relates to the publication where vulnerability is reported. Some
vulnerabilities are reported in popular press. Others find mention only in industry sources
like CERT or technology news portals like news.com. The question which arises is
whether both sources are equally influential in affecting a stock’s CAR? One would
suspect the popular press of being more influential than industry sources because it reaches
a broader audience. So our next hypothesis is:
H6: The magnitude of CAR is more when the vulnerability is reported in popular press
than in industry sources.
11
4. Data Description & Methodology
4.1 Vulnerability Disclosure Process
The typical process of vulnerability disclosure takes place as shown in Figure 1.
Vulnerability Discovery
Patch / No Patch
Full /Limited Disclosure?
Announcement
• Vulnerability
Characteristics
Disclosure
Revised cash flow Expectation by Investors
Full Disclosure (report to public)
By Firm
Limited Disclosure (report to firm)
By Virus/Hack Attack By Third Party
Abnormal Returns
Figure 1: Vulnerability Discovery and Disclosure
The process starts with the vulnerability discovery. There are various sources for
vulnerability discovery. Some vulnerabilities are discovered by amateur researchers or by
independent security analysts (ISA) like eEye Security. If the ISA chooses to follow
‘limited disclosure’, it reports the vulnerability to the concerned vendor or to an
independent body like CERT who disclose the vulnerability to public later (generally after
12
the fix has been made available) in a limited way8. Sometimes, the vendor itself might
discover a vulnerability in its products. On the other hand, if the ISA chooses to follow
‘full disclosure’ or if a hacker discovers the vulnerability, the vulnerability may get
announced directly to public. Forums such as Bugtraq allow for full disclosure of
vulnerability information. In any case, after the vulnerability has been announced,
investors might re-evaluate their projections on the software vendors’ profitability based
on the vulnerability characteristics. Consequentially, the stock price of the vendor might
show an abnormal return due to the vulnerability announcement.
4.2 Data
Our data comes from the vulnerability disclosures in popular press as well as from the
advisory reports in CERT. We include articles published by news networks like
Businesswire, Newswire and daily articles in popular press like WSJ, NY Times,
Washington Post and LA Times. We search for these news articles in Proquest and Lexis-
Nexis Academic databases which, between them, maintain news articles from major
newspapers and news networks all over the country. We also include articles from
news.com which is a CNET owned site and is a premier source for round-the-clock,
breaking technology news coverage. We used the following terms in our search:
‘vulnerability AND disclosure’, ‘software AND vulnerability’, ‘software AND flaw’,
‘virus AND vulnerability’& ‘vulnerability AND patch’.
We also searched the vulnerability announcements for information on the type of
vulnerabilities. Based on this, we classify vulnerabilities into various categories.
• If the announcements contained words such as ‘serious’ or ‘severe’ or ‘dangerous’ to
describe the vulnerability, we characterized the vulnerability as ‘Severe’. If the
announcement characterized the vulnerability as ‘moderately severe’ or ‘with low
severity’, we characterized it as ‘Non-severe’.
• The vulnerability announcements also had references to what kind to security breach
could be facilitated if attackers exploited the vulnerability. If the vulnerability contained
terms such as ‘cause denial of service’, or ‘disrupt operations’, we classified the
vulnerability as type ‘DoS’; otherwise if the vulnerability contained terms such as ‘gain
8 CERT then reports the vulnerability to the respective vendor and gives it time (typically 45 days) to come out with a patch.
13
access’ or ‘steal information’ or ‘take control’, we classified the vulnerability as
‘Confidentiality Related’.
• Further, the announcements also described whether the vendor released a patch at the
time of the vulnerability announcement. If the vendor announced a patch at the time of
vulnerability disclosure, we classified the vulnerability as ‘Fix Available’.
• Finally, we also classify vulnerabilities on whether an ‘exploit’ exists for the
vulnerability in the public domain. If the vulnerability announcement contained terms
such as ‘an exploit for the vulnerability is circulating’, we classify the vulnerability as
type ‘Exploit’.
As per convention in prior event study literature (Hendricks & Singhal 1996), we excluded
the following type of announcements from our sample:
• Vulnerability announcements in non-daily periodicals like magazines because of the
difficulty in determining the exact date of the announcement.
• Repeat announcements of the same event in a different publication at a later date. In
case of such repeat announcements, the earliest announcement date was chosen as the
event day.
• Announcements which were associated with other confounding events like stock splits
and mergers on the event date.
• Announcements related to firms not traded on any public exchange in the US.
• Announcements that point to a fundamental protocol flaw rather than a particular
software. E.g. a flaw in the FTP protocol affects multiple vendors. The reason behind
dropping this category is that the flaw exists in the software only because it follows a
flawed protocol, and not due to the vendor.
• Software flaws which are not security related.
Our dataset contains 146 vulnerability announcements pertaining to around 18 firms in
the time period January 1999 – May 2004. We capture information on the following details
about the vulnerability announcement: date, firm name, product, who discovered the flaw,
news source, whether patch is available and severity. The descriptive statistics of the data
are given in Table 1.
14
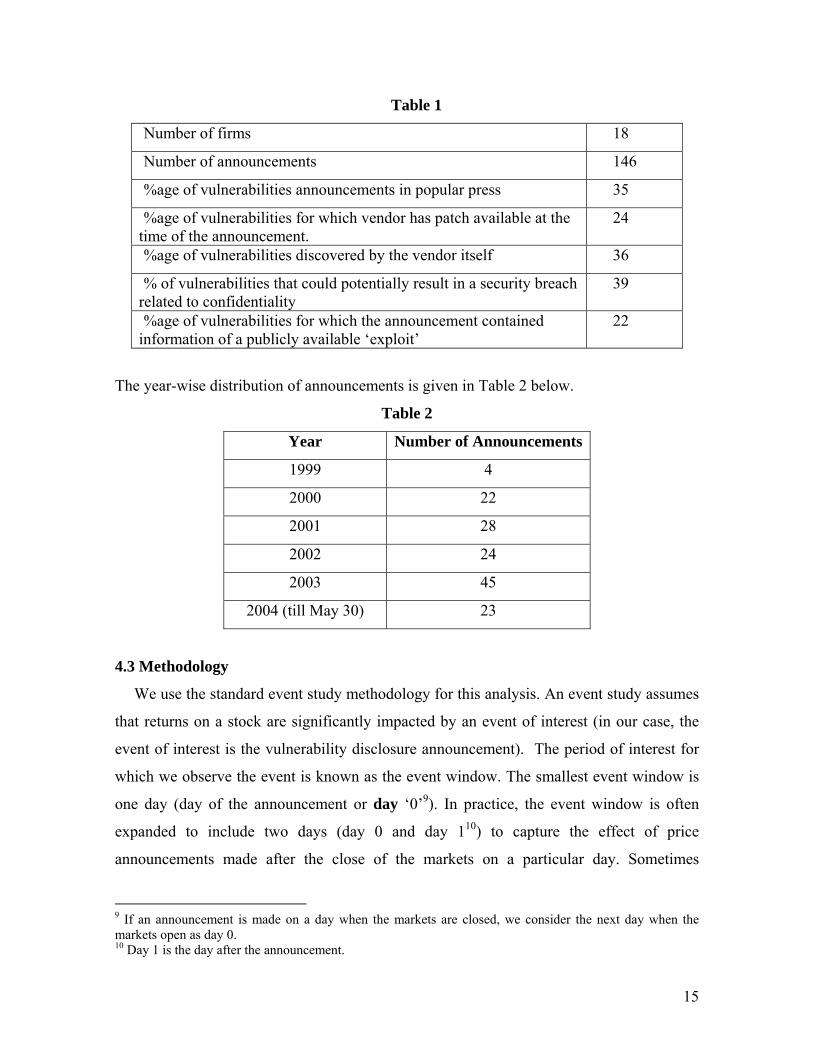
Table 1
Number of firms 18
Number of announcements 146
%age of vulnerabilities announcements in popular press 35
%age of vulnerabilities for which vendor has patch available at the time of the announcement.
24
%age of vulnerabilities discovered by the vendor itself 36
% of vulnerabilities that could potentially result in a security breach related to confidentiality
39
%age of vulnerabilities for which the announcement contained information of a publicly available ‘exploit’
22
The year-wise distribution of announcements is given in Table 2 below.
Table 2
Year Number of Announcements
1999 4
2000 22
2001 28
2002 24
2003 45
2004 (till May 30) 23
4.3 Methodology
We use the standard event study methodology for this analysis. An event study assumes
that returns on a stock are significantly impacted by an event of interest (in our case, the
event of interest is the vulnerability disclosure announcement). The period of interest for
which we observe the event is known as the event window. The smallest event window is
one day (day of the announcement or day ‘0’9). In practice, the event window is often
expanded to include two days (day 0 and day 110) to capture the effect of price
announcements made after the close of the markets on a particular day. Sometimes
9 If an announcement is made on a day when the markets are closed, we consider the next day when the markets open as day 0.10 Day 1 is the day after the announcement.
15
researchers include a day before the announcements to incorporate any information leaks
about the event. In our study we define a one day event window (day 0)11. Hendricks and
Singhal (1996) cite two reasons to use a one day event period. One, a shorter event period
permits a better estimation of the effects of information of stock prices since it reduces the
possibility of other confounding factors not related to the announcement. Two, it also
increases the power of the statistical tests.
Abnormal returns are defined as the difference between the actual return of the stock
over the event window minus the expected return of the stock over the event window. The
expected return on the stock is calculated in several ways, but in our analysis, we use the
market model which assumes a stable linear relation between the market return and the
return on the stock. We also verify our results using other methods such as the market-
adjusted method and the mean-adjusted method. The coefficients of the linear model are
calculated by choosing a portion of the data as the estimation window. The estimation
window, generally between 120 days and 200 days used in most studies, is the period
immediately before the event window. In our case, we use an estimation window of size
160 days, from day -175 to day -16.
There are three main methods followed in the event study methodology (Campbell,
Andrew and MacKinlay, 1997; Hendricks and Singhal, 1996) to estimate the abnormal
returns.
1. The Market Model
In the market model, the abnormal returns are estimated as follows:
mtititit RRAR ⋅−−= βα 12 (1)
where i denotes the event (i=1,2……N), m denotes the market and t denotes the day of
the event (e.g t = 0 denotes the day of the vulnerability announcement.). ARit denotes the
abnormal return of event i at time t, Rit denotes the actual return and Rmt denotes the market
return at time period t13. mtit R⋅+ βα denotes the normal return of the firm due to the
market-wide movement. The abnormal return is defined as the difference between the
actual return and the normal return. This is the part of the actual return that cannot be
11 We also highlight our results using different values of the event window. 12 Rit for a stock is the percent change in the stock price at time t, (=Pit - Pit-1 )/ Pit-1 13 We obtain the data on the stock and market returns from Yahoo Finance(http://finance.yahoo.com)
16
explained by market movements and captures the effect of the event. Since most of the
tech stocks are listed on NASDAQ, we use this as our indicator for market returns. We use
ordinary least squares regression to estimate the coefficients α and β for the above
regression.
2. The Market Adjusted Model
In this case, the abnormal returns are given as
mtitit RRAR −= (2)
where the terms have the usual meaning as in the Market Model.
3. The Mean Adjusted Model
iitit RRAR −= (3)
where ∑=
=T
sisi RR
1
is the mean return on the stock which made a vulnerability
announcement during event i, over the duration of the estimation period and T is number
of days in the estimation period (in our study, T=160).
The mean abnormal return across all observations on day t of the event is given as
∑=
=N
iitt ARA
1
. The cumulative abnormal return ∑=event
tACAR for the event is defined as the
sum of the abnormal returns over the event window. Prior research on event studies
(Brown & Warner 1980, Brown & Warner 1985) presents a comprehensive analysis of
suitable test statistics for the abnormal mean return. Since vulnerabilities were disclosed
by more than one vendor on a given day, our statistic should allow for event day
clustering. The following t-statistic proposed by Brown & Warner (1985) takes in to
account event day clustering as well as cross-sectional dependence in the security specific
excess returns.
2A
t
SAt = (4)
Where ⎟⎠
⎞⎜⎝
⎛−
−= ∑
=
T
ssA AA
TS
1
2 )(1
1 and T is the number of days in the estimation period
and ⎟⎠
⎞⎜⎝
⎛= ∑
=
T
ssA
TA
1
1
17
The null hypothesis is that the abnormal returns are not significantly different from
zero. Under the null hypothesis, the abnormal returns are independent and identically
distributed and normal with a mean of zero and the variance given by the variance of
abnormal returns over the estimation period.
We also do multivariate regression and test our hypothesis of how CAR varies with
various vendors, or vulnerability characteristics. But before we present the details on our
regression analysis, we present the results of the event study.
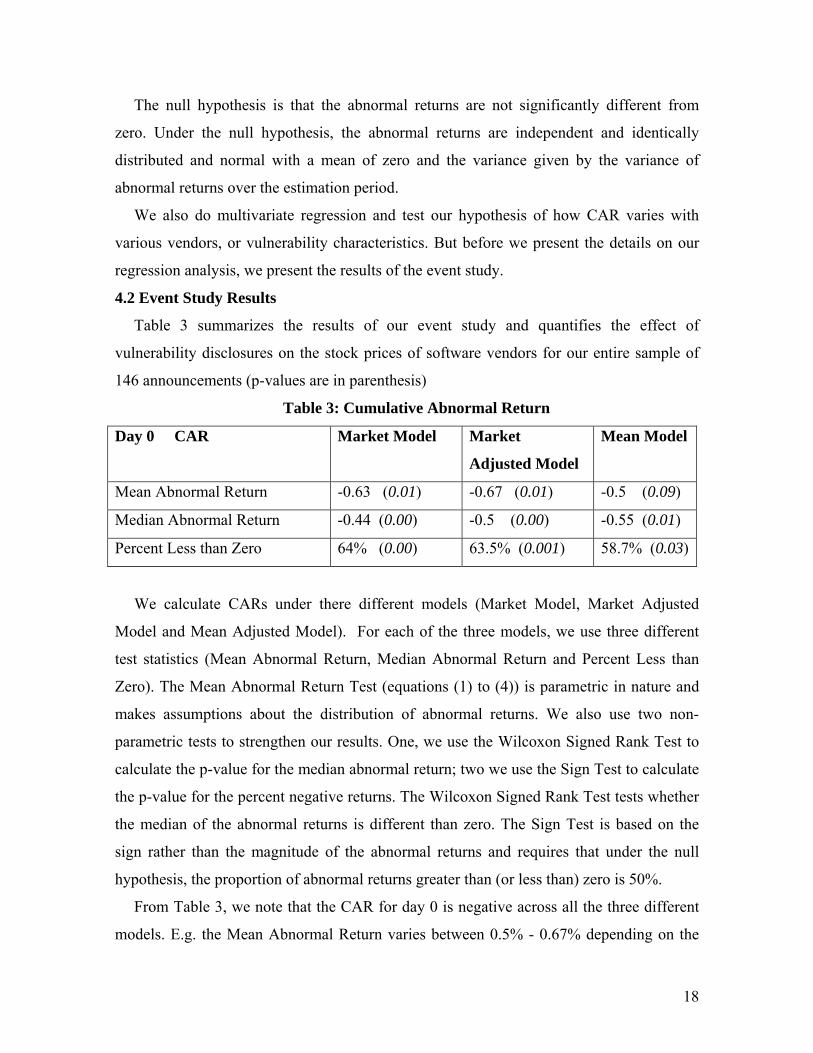
4.2 Event Study Results
Table 3 summarizes the results of our event study and quantifies the effect of
vulnerability disclosures on the stock prices of software vendors for our entire sample of
146 announcements (p-values are in parenthesis)
Table 3: Cumulative Abnormal Return
Day 0 CAR Market Model Market
Adjusted Model
Mean Model
Mean Abnormal Return -0.63 (0.01) -0.67 (0.01) -0.5 (0.09)
Median Abnormal Return -0.44 (0.00) -0.5 (0.00) -0.55 (0.01)
Percent Less than Zero 64% (0.00) 63.5% (0.001) 58.7% (0.03)
We calculate CARs under there different models (Market Model, Market Adjusted
Model and Mean Adjusted Model). For each of the three models, we use three different
test statistics (Mean Abnormal Return, Median Abnormal Return and Percent Less than
Zero). The Mean Abnormal Return Test (equations (1) to (4)) is parametric in nature and
makes assumptions about the distribution of abnormal returns. We also use two non-
parametric tests to strengthen our results. One, we use the Wilcoxon Signed Rank Test to
calculate the p-value for the median abnormal return; two we use the Sign Test to calculate
the p-value for the percent negative returns. The Wilcoxon Signed Rank Test tests whether
the median of the abnormal returns is different than zero. The Sign Test is based on the
sign rather than the magnitude of the abnormal returns and requires that under the null
hypothesis, the proportion of abnormal returns greater than (or less than) zero is 50%.
From Table 3, we note that the CAR for day 0 is negative across all the three different
models. E.g. the Mean Abnormal Return varies between 0.5% - 0.67% depending on the
18
model used. Further the Market Model and the Market Adjusted Model are statistically
significant at p < 0.01, while the Mean Adjusted Model is statistically significant at p < 0.1
level. The Median Abnormal Returns range between 0.44% - 0.55% and are significant at
the 0.01 level. Finally, the percent observations less than zero range between 57.8% - 64%
and are significant at the 0.05 level. It is clear that CAR is negative and statistically
significant for all three models and all three tests.
Thus, our results suggest that software vendors do tend to lose market value when a
vulnerability is announced in their product. To check for the robustness of our results, we
not only test the mean abnormal returns, but also the median abnormal returns and the
percent less than zero. This provides support for hypothesis H1 that vulnerability
announcements are associated with a loss in market value of software vendors.
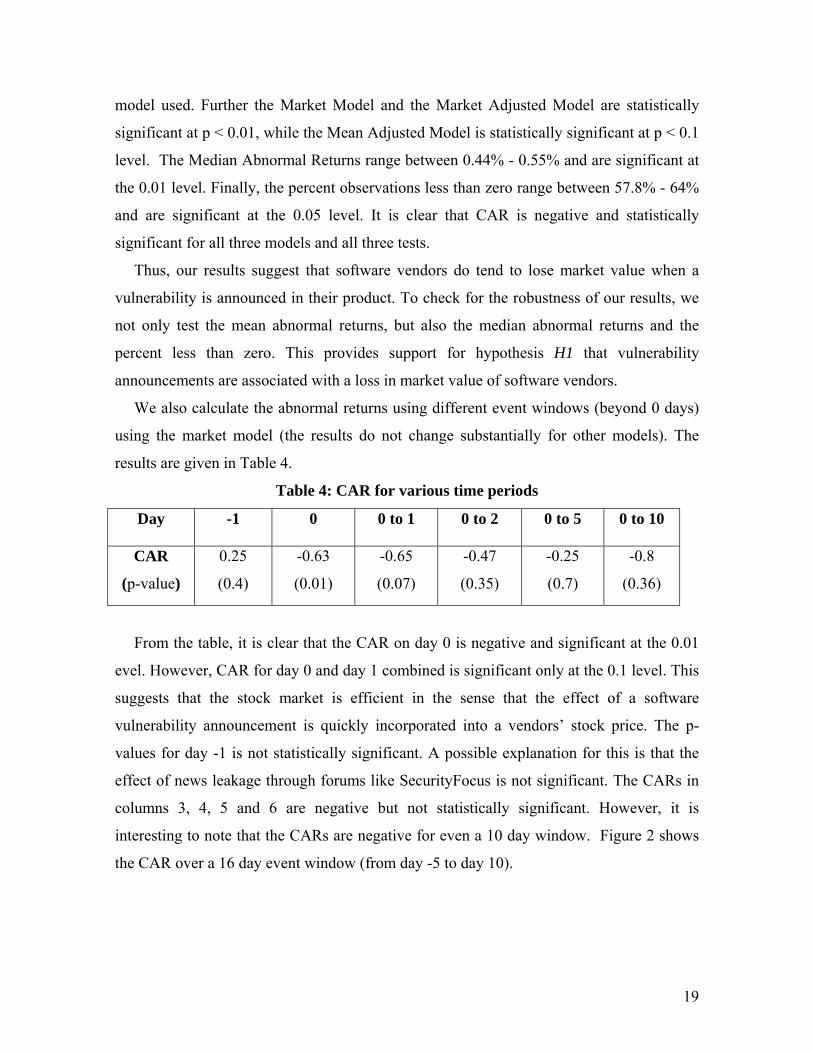
We also calculate the abnormal returns using different event windows (beyond 0 days)
using the market model (the results do not change substantially for other models). The
results are given in Table 4.
Table 4: CAR for various time periods
Day -1 0 0 to 1 0 to 2 0 to 5
0 to 10
CAR
(p-value)
0.25
(0.4)
-0.63
(0.01)
-0.65
(0.07)
-0.47
(0.35)
-0.25
(0.7)
-0.8
(0.36)
From the table, it is clear that the CAR on day 0 is negative and significant at the 0.01
evel. However, CAR for day 0 and day 1 combined is significant only at the 0.1 level. This
suggests that the stock market is efficient in the sense that the effect of a software
vulnerability announcement is quickly incorporated into a vendors’ stock price. The p-
values for day -1 is not statistically significant. A possible explanation for this is that the
effect of news leakage through forums like SecurityFocus is not significant. The CARs in
columns 3, 4, 5 and 6 are negative but not statistically significant. However, it is
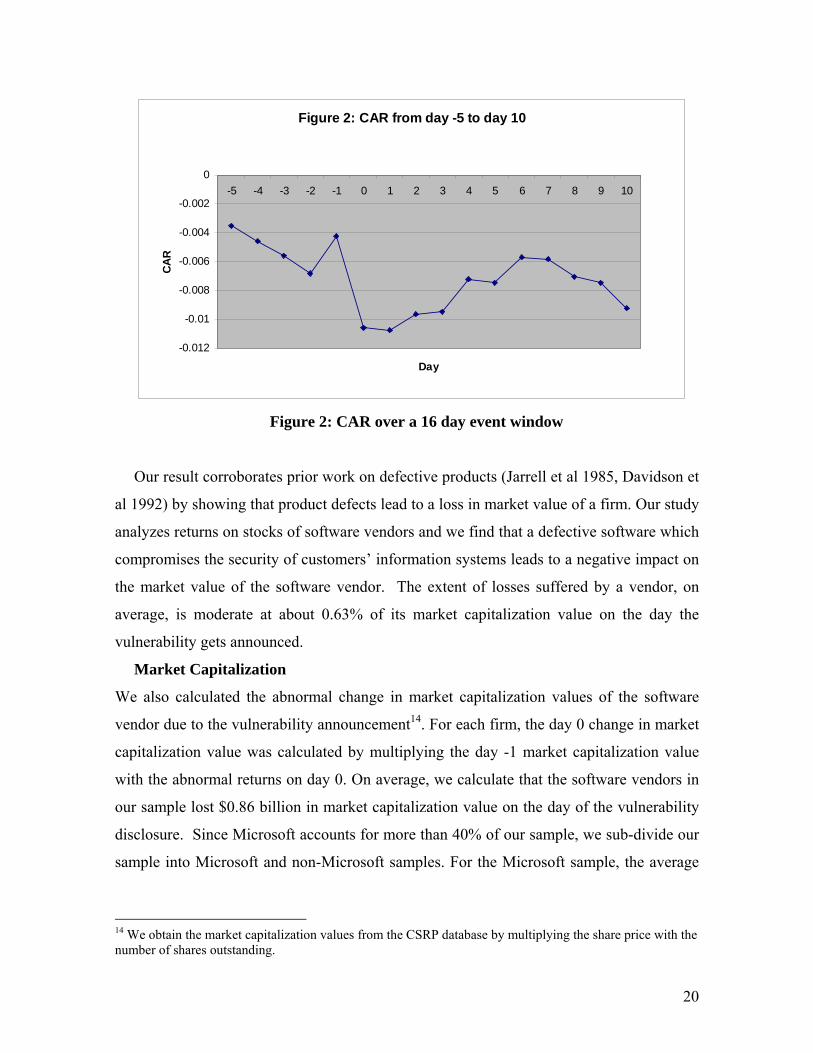
interesting to note that the CARs are negative for even a 10 day window. Figure 2 shows
the CAR over a 16 day event window (from day -5 to day 10).
19
Figure 2: CAR from day -5 to day 10
-0.012
-0.01
-0.008
-0.006
-0.004
-0.002
0-5 -4 -3 -2 -1 0 1 2 3 4 5 6 7 8 9 10
Day
CAR
Figure 2: CAR over a 16 day event window
Our result corroborates prior work on defective products (Jarrell et al 1985, Davidson et
al 1992) by showing that product defects lead to a loss in market value of a firm. Our study
analyzes returns on stocks of software vendors and we find that a defective software which
compromises the security of customers’ information systems leads to a negative impact on
the market value of the software vendor. The extent of losses suffered by a vendor, on
average, is moderate at about 0.63% of its market capitalization value on the day the
vulnerability gets announced.
Market Capitalization
We also calculated the abnormal change in market capitalization values of the software
vendor due to the vulnerability announcement14. For each firm, the day 0 change in market
capitalization value was calculated by multiplying the day -1 market capitalization value
with the abnormal returns on day 0. On average, we calculate that the software vendors in
our sample lost $0.86 billion in market capitalization value on the day of the vulnerability
disclosure. Since Microsoft accounts for more than 40% of our sample, we sub-divide our
sample into Microsoft and non-Microsoft samples. For the Microsoft sample, the average
14 We obtain the market capitalization values from the CSRP database by multiplying the share price with the number of shares outstanding.
20
change in market capitalization is around $0.92 billion and for the non-Microsoft sample,
the average change in market value is $0.81billion.
Robustness Checks: We also perform the following robustness checks on our results, as
specified in the event study by Cooper, Dimitrov and Rau (2001).
1. Robustness to Outliers:
To check the robustness of our results to exclude the effect of outliers, we compute the
CAR for our sample after excluding the top 10 percentile and the bottom 10 percentile of
observations (ranked according to the day 0 mean abnormal returns). We find that our
results remain qualitatively the same. For example, mean abnormal returns for this sample
are 0.53% (against 0.63% for the entire sample) and these are significant at the 5% level.
This suggests that our results are robust to outliers in the data.
2. Momentum Effect:
It can be argued that the day 0 abnormal returns are caused simply by market momentum
than by the underlying event. As a simple check, we compute the correlation between the
abnormal returns before the event and those after the event. In specific, we check the pair-
wise correlation (along with level of significance) for three pairs of values : one, day -10 to
day -1 CAR and day 0 to day 10 CAR; two, day -10 to day -1 CAR and day 0 CAR; and
three, day -1 CAR and day 0 CAR. The pair-wise correlations are as follows:
• day -10 to day -1 CAR and day 0 to day 10 CAR (correlation: 0.13, p-value 0.12)
• day -10 to day -1 CAR and day 0 CAR (correlation: -0.05, p-value 0.5)
• day -1 CAR and day 0 CAR (correlation: 0.03, p-value 0.67)
Thus we find that none of the correlations is strong or significant at the 10% level and
hence the momentum in the stock prices does not seem to be driving our results.
5. Regression Analysis
To test the other hypothesis, we develop both a regression model and simple means test
to explain the effect of various vulnerability characteristics on abnormal returns. However,
ordinary least squares model might not be appropriate because it does not account for
heterogeneity among firms. The issue of heterogeneity is an important consideration in
analyzing panel data. For example, the level of abnormal returns could differ across firms
if investors use different valuation models across firms (Malatesta and Thompson 1985).
21
Estimating aggregate parameters while ignoring heterogeneity could lead to biased and
inconsistent estimates (Hsiao 1986).
To incorporate the impact of firm specific heterogeneity in our data, we propose a fixed
effects model. The fixed effects model controls for unobservable firm specific variables
that are constant over time. This is equivalent to generating dummy variables for each firm
and including them in an ordinary linear regression to control for firm specific effects. The
fixed effects model can be specified as:
itiitit Xy εµβ ++⋅= (5)
where i = 1…..N (N is the total number of firms) and t = 1……..T (T is the total number
of events). yit is the Abnormal Return (ARit) for firm i at event t as calculated according to
the market model in equation (1)15. Xit are the independent variables which capture the
various vulnerability characteristics, ui is the firm specific dummy variable. The
description of the independent variables is as follows:
SEVR: whether the vulnerability has been classified as severe; SEVR = 1 for a severe
vulnerability and 0 otherwise.
PATCH: Whether a patch is available at the time of the vulnerability disclosure. PATCH
=1 if a patch is available and 0 otherwise.
DISC: Whether the vulnerability was disclosed by the third party. DISC = 1 if the
vulnerability was disclosed by the third party and 0 if disclosed by the vendor.
EXPLOIT: If an exploit is publicly available at the time of the vulnerability
announcement, then EXPLOIT = 1; otherwise it is zero.
CERT: If the vulnerability was first reported in CERT, then CERT = 1, it is 0 otherwise.
PRESS: If the vulnerability was first reported in popular press, the variable PRESS = 1,
otherwise it is zero.16
DOS: If the vulnerability can potentially lead to a denial of service type attack or a
disruption in services, then the variable DOS =1, otherwise it is zero.
Effect of Investor Sentiments:
15 Since the market model is the most common model used in event studies, we proceed with the remaining analysis with this model. 16 For PRESS and CERT, we compare with the baseline case that the vulnerability was reported at the CNET/ZDNET owned news.com website.
22
To control for abnormal returns due to overall market sentiments, we introduce a set of
dummy variables based on the time when the vulnerability was announced. We use the
events surrounding 9/11 as the basis for segmenting our sample into various time periods.
The stock market crash in late 2000 could also play a role in the negative abnormal returns.
We introduce the following dummy variables in our model:
Post_911: If the vulnerability was announced within a year of 9/11, i.e. if the date of
the announcement was between Sept 11, 2001 and Sept, 11 2002. This constitutes 19
observations from our sample.
Pre_911: If the vulnerability was announced within a year before 9/11, i.e. if the date of
the announcement was between Sept 11, 2000 and Sept, 11 2001. This was also the time
after the stock market crashed in mid 2000 and lasted till the first three quarters of 2001
(Wall Street Journal, 200017, Kannan et al 2003, Wall Street Journal, 200318). This
constitutes 28 observations from our sample.
Year_99-00: if the announcement was made prior to September 11, 2000, i.e. if the date
of the announcement is between Jan 1, 1999 and September 11, 2000. This constitutes 23
observations from our sample.
Year_02-03: If the date of the announcement is between September 11, 2002 and
September 11, 2003. This constitutes 44 observations from our sample.
Year_03-04: If the date of the announcement is between September 11, 2003 and June
1, 2004. This constitutes 32 observations from our sample. This is the baseline category for
our regression.
5.1 Results
We first compare the mean CARs of different sub samples based on vulnerability
characteristics to understand how various factors affect market value of the firms. The
characteristics that we consider are explained above. This is similar to the method followed
by Subramani and Walden (2001), Chatterjee, Richardson and Zmud (2001) Im, Dow and
Grover (2001). The results are summarized in Table 5.
17 Article titled ‘The Internet Bubble Broke Records, Rules and Bank Accounts’ dated 07/14/2000 18 Article titled ‘Thinking Things Over: On Repairing Economic Damage’ dated 03/10/2003
23
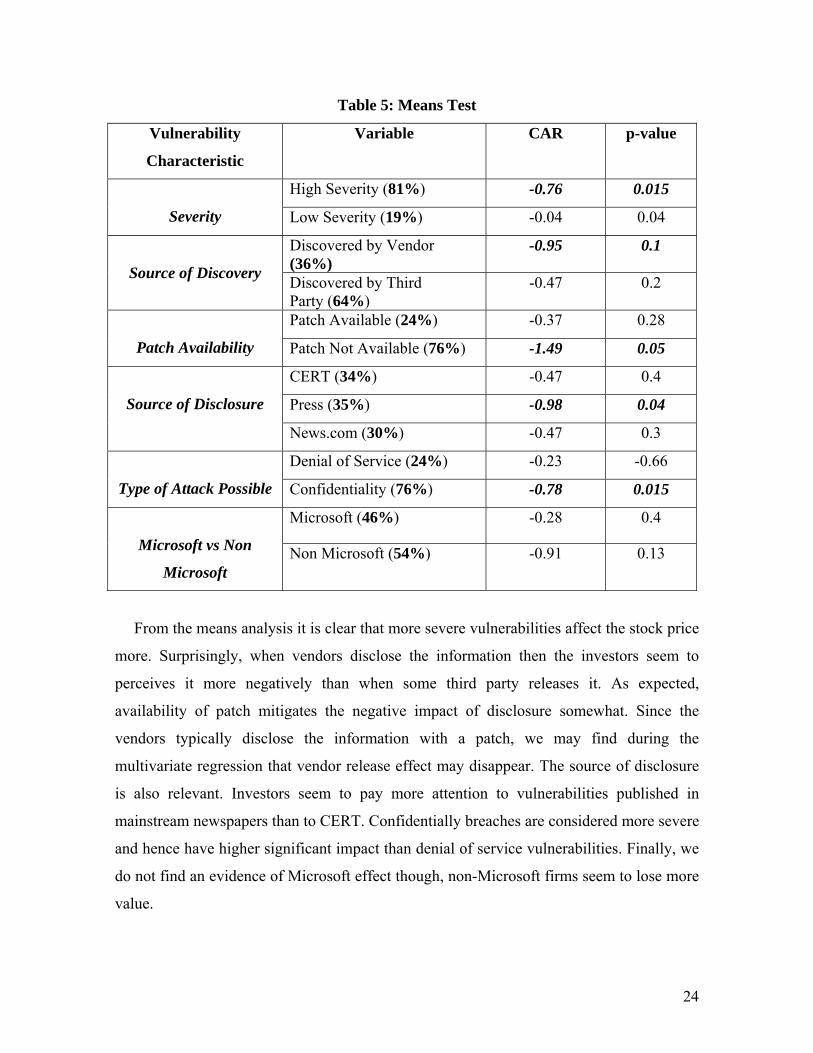
Table 5: Means Test
Vulnerability
Characteristic
Variable CAR p-value
High Severity (81%) -0.76 0.015
Severity Low Severity (19%) -0.04 0.04
Discovered by Vendor (36%)
-0.95 0.1
Source of Discovery Discovered by Third Party (64%)
-0.47 0.2
Patch Available (24%) -0.37 0.28
Patch Availability Patch Not Available (76%) -1.49 0.05
CERT (34%) -0.47 0.4
Press (35%) -0.98 0.04
Source of Disclosure
News.com (30%) -0.47 0.3
Denial of Service (24%) -0.23 -0.66
Type of Attack Possible Confidentiality (76%) -0.78 0.015
Microsoft (46%) -0.28 0.4
Microsoft vs Non
Microsoft Non Microsoft (54%) -0.91 0.13
From the means analysis it is clear that more severe vulnerabilities affect the stock price
more. Surprisingly, when vendors disclose the information then the investors seem to
perceives it more negatively than when some third party releases it. As expected,
availability of patch mitigates the negative impact of disclosure somewhat. Since the
vendors typically disclose the information with a patch, we may find during the
multivariate regression that vendor release effect may disappear. The source of disclosure
is also relevant. Investors seem to pay more attention to vulnerabilities published in
mainstream newspapers than to CERT. Confidentially breaches are considered more severe
and hence have higher significant impact than denial of service vulnerabilities. Finally, we
do not find an evidence of Microsoft effect though, non-Microsoft firms seem to lose more
value.
24
In the second method, we test our hypothesis related to the impact of various
vulnerability characteristics on the market value of a software vendor using the
multivariate regression model outlined in equation (5). This is similar to the methodology
followed by prior event studies such as Hendricks and Singhal (1997), Chatterjee,
Richardson and Zmud (2001), Lane and Robertson (1995). The regression method has the
advantage over the sub-sample method used in Table 5 that the regression method captures
the effect of all the independent variables simultaneously. The sub-sample method could
give spurious results because the effects of a sub-sample, such as patch vs no-patch, can be
explained by a relationship between patch and other independent variables. The parameter
estimates as well as the p-values for the various parameters of our fixed effects regression
are given in the Table 6 below.
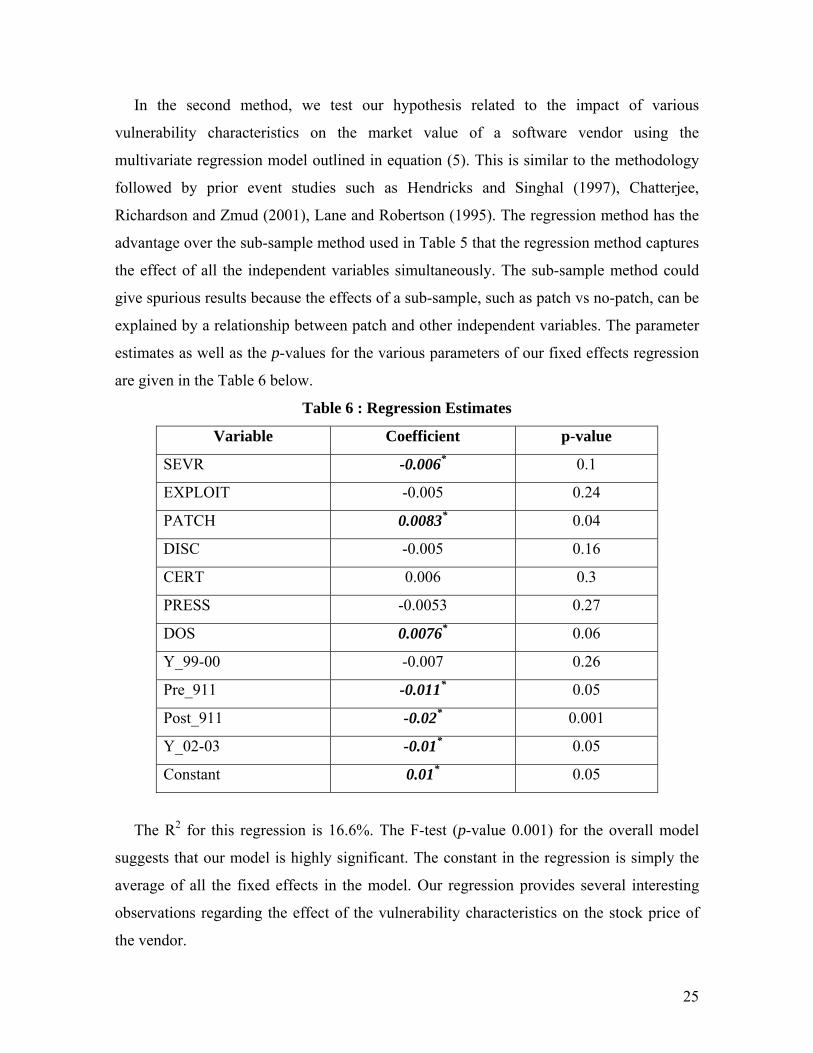
Table 6 : Regression Estimates
Variable Coefficient p-value
SEVR -0.006* 0.1
EXPLOIT -0.005 0.24
PATCH 0.0083* 0.04
DISC -0.005 0.16
CERT 0.006 0.3
PRESS -0.0053 0.27
DOS 0.0076* 0.06
Y_99-00 -0.007 0.26
Pre_911 -0.011* 0.05
Post_911 -0.02* 0.001
Y_02-03 -0.01* 0.05
Constant 0.01* 0.05
The R2 for this regression is 16.6%. The F-test (p-value 0.001) for the overall model
suggests that our model is highly significant. The constant in the regression is simply the
average of all the fixed effects in the model. Our regression provides several interesting
observations regarding the effect of the vulnerability characteristics on the stock price of
the vendor.
25
1. Severity: The coefficient on the SEVR variable in Table 6 is negative and significant
(though at p = 0.1). This is consistent with results in Table 5. More severe
vulnerabilities have a higher potential to cause damage and hence have a larger adverse
impact on CAR. On average, a severe vulnerability can cost a software vendor 0.6%
more than a non-severe vulnerability, providing support to hypothesis H4.
2. Patch: We also find that the non-availability of a patch is positive and significantly
correlated with the market value. This provides support to hypothesis H2 because the
coefficient on the PATCH variable suggests that on average, firms which do not
provide a patch at the time of the vulnerability disclosure suffer a loss of 0.83% more
than firms which provide a patch.
3. Confidentiality: The coefficient of the DOS variable is 0.0076. This implies that
vulnerabilities which result in a non-confidential breach (denial of service, disruptions
in service) have an abnormal return of 0.76% higher than the vulnerabilities which
result in a confidentiality-related breach. This confirms our hypothesis H3.
None of the other coefficients are significant (except time coefficients). Thus our results
fail to provide support for hypothesis H5 and H6. From table 5 also, we can observe that
none of the sub-samples (other than the Press sub-sample) has a significant coefficient.
The rejection of hypothesis H5 is especially interesting because it suggests that the markets
do not penalize a vendor any more if the vulnerability is discovered by a third party than
by the vendor itself.
We also control for the effect of the time period during which the vulnerabilities were
announced to control for time-specific investor sentiments which can affect abnormal
returns. We find that software vendors suffered the greatest abnormal returns in the one
year period post 9/11; for example, on average, vendors lost 2% more in market value for
each vulnerability announcement in the year following 9/11 than they did in the baseline
period (2003-04). This suggests that security concerns among investors were highest
during this period, as an aftermath of September 11. The next highest period of abnormal
returns was the one-year time frame after the dot-com crash, i.e. from Sept 2000 to Sept
2001. In this period, software vendors lost, on average, 1.0% more on vulnerability
announcements than in the baseline period. The results also suggest that year 2003-04 is
when the vendors suffered the least. It is possible that vulnerability announcements have
26
become commonplace and are not affecting the vendors as much. But, more research is
needed to provide a definitive answer.
6. Conclusions and Discussion
To the best of our knowledge, this is the first study to analyze the impact of product
defects on software vendors. We also analyze the information content of the vulnerability
disclosure announcement and classify vulnerabilities into various sub-types based on the
following characteristics: the source of vulnerability disclosure, severity of the
vulnerability, availability of a fix, whether an exploit was publicly available at the time of
discovery, the type of security breach caused by the vulnerability and the source of
vulnerability discovery. Our results show that vulnerability disclosure leads to a significant
loss of market value for software vendors. This indicates that the stock markets react
negatively to the news of a vulnerability disclosure, because the discovery of a
vulnerability could suggest a loss in future cash flow of the software vendors. Software
vulnerabilities affect the cash flows of a vendor in two main ways: One, the vendor has to
spend time and effort in providing a patch for the vulnerability, which increases the overall
cost of the software product and hence reduces profits. Vulnerabilities may also lead to
customer dissatisfaction because the customer has to spend time and effort in installing
patches and is exposed to a risk of security related attacks. This could further lead to
customers shifting to competitor’s products and hence reduces the cash flow for the
vendors’ products. This has implications for software vendors to invest in improving the
quality of their software. While vendors would like to launch software products as soon as
possible, our study shows that vendors need to focus testing in areas that can potentially
contain greater number of security vulnerabilities. We also show that the effect of a
vulnerability announcement is quickly incorporated into the stock price and after the
second day, there is no significant impact on the stock prices. We check for the robustness
of our results in terms of checking for outliers and checking for momentum effects in the
stock returns. We find that our results are also robust to the effect of investor sentiments
since we control for the effect of various time periods in our regression.
Our study also provides preliminary evidence that firms should integrate security into
software quality practices. In a firm with limited resources, this would mean focusing
testing efforts in areas that have a greater number of security vulnerabilities. Although
27
researchers in computer science have stressed on this fact (McGraw 2004), there hardly
exists any literature in software engineering economics which measures the return on
investment of incorporating security based metrics in software quality or software risk
assessment. While software quality traditionally deals with functional testing, complete
security testing would incorporate non-functional testing we well, i.e. subjecting the
software to misspecified input streams (Potter and McGraw 2004).
Our results also show that vulnerabilities which are severe or which can cause a
confidentiality related attack are likely to result in a greater loss in market value for a
vendor. This has implications for the software vendor in terms of allocating resources for
software testing and quality improvements. For example, vendors should focus on
spending more resources in testing those software modules where a flaw is more likely to
cause a confidentiality related breach. Campbell et al (2003) show that confidentiality
related breaches cause a greater loss to firms; we complement that result by showing that
software vulnerabilities which cause a confidentiality related breach are likely to result in a
greater loss in market value for the vendor.
Comparison with prior event studies:
It is interesting to compare how the abnormal returns in our event study compare with
results in prior event studies. Specifically, we compare our results with event studies in the
following categories: security breach related announcements, IT investment related
announcements and product defect related announcements.
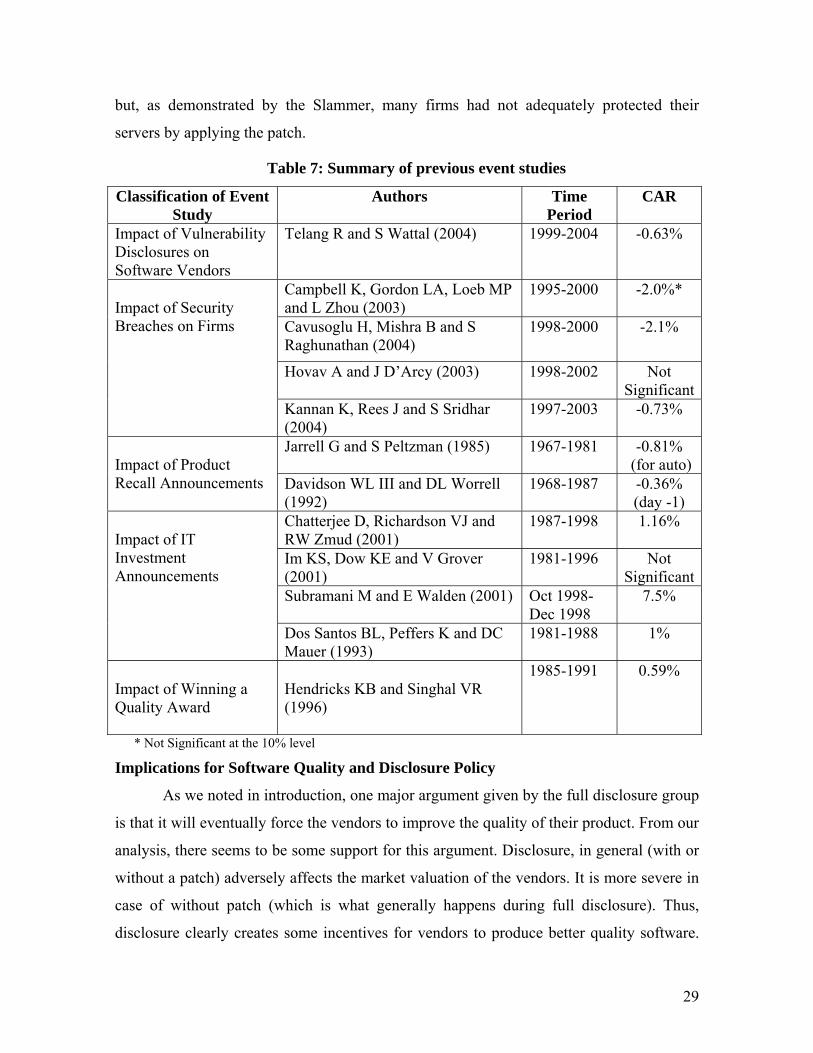
Table-7 shows that our results are comparable to prior studies on product defects and
product recall announcements. It is especially interesting to note that the loss in market
value that vendors suffer due to a security vulnerability is much less than that suffered by
firms during a security breach. A possible reason could be that software vendors are
protected by click-wrap agreements and have only limited liability for any flaw in their
products. Another reason is that firms usually supply a patch with the vulnerability
disclosure (almost 76% of observations in our sample have a patch available at the time of
disclosure). Therefore security breaches are not so much caused due to unprotected
vulnerabilities as due to lack of adequate patching done by firms. E.g. the SQL Slammer
virus, which affected millions of servers worldwide, was created when hackers exploited a
six month old vulnerability in SQL. Microsoft had already released a patch for the same,
28
but, as demonstrated by the Slammer, many firms had not adequately protected their
servers by applying the patch.
Table 7: Summary of previous event studies
Classification of Event Study
Authors Time Period
CAR
Impact of Vulnerability Disclosures on Software Vendors
Telang R and S Wattal (2004) 1999-2004 -0.63%
Campbell K, Gordon LA, Loeb MP and L Zhou (2003)
1995-2000 -2.0%*
Cavusoglu H, Mishra B and S Raghunathan (2004)
1998-2000 -2.1%
Hovav A and J D’Arcy (2003)
1998-2002 Not Significant
Impact of Security Breaches on Firms
Kannan K, Rees J and S Sridhar (2004)
1997-2003 -0.73%
Jarrell G and S Peltzman (1985)
1967-1981 -0.81% (for auto)
Impact of Product Recall Announcements
Davidson WL III and DL Worrell (1992)
1968-1987 -0.36% (day -1)
Chatterjee D, Richardson VJ and RW Zmud (2001)
1987-1998 1.16%
Im KS, Dow KE and V Grover (2001)
1981-1996 Not Significant
Subramani M and E Walden (2001) Oct 1998- Dec 1998
7.5%
Impact of IT Investment Announcements
Dos Santos BL, Peffers K and DC Mauer (1993)
1981-1988 1%
Impact of Winning a Quality Award
Hendricks KB and Singhal VR (1996)
1985-1991 0.59%
* Not Significant at the 10% level
Implications for Software Quality and Disclosure Policy
As we noted in introduction, one major argument given by the full disclosure group
is that it will eventually force the vendors to improve the quality of their product. From our
analysis, there seems to be some support for this argument. Disclosure, in general (with or
without a patch) adversely affects the market valuation of the vendors. It is more severe in
case of without patch (which is what generally happens during full disclosure). Thus,
disclosure clearly creates some incentives for vendors to produce better quality software.
29
However, market value is only one metric to capture the impact of disclosure. A more
interesting and comprehensive work would be to measure the impact of disclosure on
profit or market share of these firms. But our paper does provide a starting point for why
we should analyze this issue in more detail. Another potential area of future research
would be to capture and test the link between security based risks and the quality of
software systems.
From our discussion, it is also clear why vendors are pushing for a limited
disclosure policy. Recently, Organization for Internet Safety (OIS), which is consortia of
11 large software vendors, announced a limited-disclosure policy which requires the
discoverer to notify the vendors and give them some time before making the information
public. From our analysis, such a policy benefits vendors because limited disclosure gives
them time to release a patch for the vulnerability and availability of patch mitigates some
adverse effects of disclosure. We also find that whether the vulnerability is reported by
vendors themselves, or other parties, it has essentially similar impact on market value. To
an extent, our study points that vendors are not necessarily better off disclosing
information themselves. Generally, an argument could be made that vendors should release
the information themselves, for if not, someone else will and it will lead to worse
consequences. However, we do not find any evidence of this. Vendors may be better off
keeping quiet and integrate their fixes as either service packs (which do not give micro-
details on what it fixes) or newer versions and announce the patch only if someone else has
disclosed it. However, more research is required; especially more data on announcements
when hackers exploit the vulnerabilities.
Another issue raised in discussing software flaws is whether software vendors should be
held responsible by law for vulnerabilities discovered in their products. Currently, the use
of End User License Agreements (EULA or Click-Wrap Agreements) that come with
software products limit the liability that vendors face if customers suffer a loss due to a
flaw in software. Our results show that liability laws (which anyway are not likely to pass
sometimes soon) are not the only way to ‘punish’ software vendors for flaws discovered in
their products. Market seems to act on this information and punishes a vendor, who on an
average, loses around 0.63% of its market value on the day a vulnerability is reported in its
30
products. Software liability could certainly cause the market value of the vendors to
decline further if a vulnerability is reported in their product.
Some vulnerabilities are posted on a public listing such as Bugtraq before these are
announced in popular press or CERT. In that case, the actual vulnerability announcement
may have little surprise value. Therefore our results are a lower bound for the actual
decrease in stock prices experienced by the software vendor if a flaw is reported in its
product. We do not include the vulnerabilities reported on Bugtraq since most of these are
not confirmed vulnerabilities at the time they are posted online.
A limitation of our study is that most of the data points in our sample are
announcements regarding off-the-shelf software products. Our analysis does not cover
software development projects where a security flaw can cause millions of dollars worth of
damage. The main reason for excluding them was the lack of availability of data on
software failures in such cases. We also reiterate that further analysis in terms of software
quality, market share or profitability is needed to fully understand how vulnerability
disclosure signals poorer quality and how it affects the vendors’ incentives to provide
better quality software. Our paper takes the first step in this direction.
References
• Adams EN III (1980) ‘Minimizing Cost Impacts of Software Defects’ IBM Research Report, RC 8228 April
• Applewhite A (2004) ‘Whose Bug Is It Anyway? The Battle over Handling Software Flaws’ IEEE Software, March/April 2004, 94-97
• Anderson R (2001) ‘Why Information Security is Hard – an Economic Perspective’ Proceeding of 17th Annual Computer Security Applications Conference, New Orleans, Louisiana
• Arora, A., Caulkins, J.P. and R Telang, (2004). ‘Sell First, Fix Later: Impact of Patching on Software Quality’, Carnegie Mellon University, working paper.
• Arora, A., Telang, R. and H Xu, (2004). ‘Optimal Policy for Software Vulnerability Disclosure’, Carnegie Mellon University, working paper.
• Banker RD and SA Slaughter (1997) ‘A Field Study of Scale Economies in Software Maintenance’, Management Science, 43(12), 1709-1725
• Barki H, Rivard S and J Talbot ‘Toward an Assessment of Software Development Risk’, Journal of Management Information Systems, 10(2), 203-225
• Basili, VR and JD Musa (1991) ‘The Future Engineering of Software: A Management Perspective’ IEEE Computing, 20(4), 90-96
• Bharadwaj, A and M Keil (2003) ‘The Effects of Information Technology Failures on the Market Value of Firms’, Working paper.
31
• Brown SJ and JB Warner (1980) ‘Measuring Security Price Performance’, Journal of Financial Economics, 14(1985), 3-31
• Brown SJ and JB Warner (1985) ‘Using Daily Stock Returns: The Case of Event Studies’, Journal of Financial Economics, 14(1985), 3-31
• Campbell JY, Andrew WL and AC MacKinlay (1997) ‘The Econometrics of Financial Markets’ Princeton University Press
• Campbell K, LA Gordon LA, Loeb MP and L Zhou (2003) ‘The Economic Cost of Publicly Announced Information Security Breaches: Empirical Evidence from the Stock Market’, Journal of Computer Security, 11(3), 431-448
• Carr R, Tynan M and R Davis (1991) ‘Quality and Security: They Work Together’ IEEE AES Systems Magazine, 6(9), 15-19
• Cavusoglu H, Mishra B and S Raghunathan (2004) ‘The Effect of Internet Security Breach Announcements on Market Value: Capital Market Reactions for Breached Firms and Internet Security Developers’ International Journal of Electronic Commerce, 9(1), 69
• Chaney PK, Devinney TM and RS Winer (1991) ‘The Impact of New Product Introductions on the Market Value of Firms’, The Journal of Business, 64(4), 573-610
• Chatterjee D, Richardson VJ and RW Zmud (2001) ‘Examining the Shareholder Wealth Effects of Announcements of Newly Created CIO Positions’, MIS Quarterly, 25(1), 43-70
• Cooper MJ, O Dimitrov and PR Rau (2001) ‘A Rose.com by Any Other Name’, The Journal of Finance, (6), 2371-2387
• Cusumano, MA (2004) ‘Who is Liable for Bugs and Security Flaws in Software?’ Communications of the ACM, 47(3), 25-27
• Davidson WL III, DL Worrell(1992) ‘The Effect of Product Recall Announcements on Shareholder Wealth’ Strategic Management Journal, 13(6), 467-473
• Devanbu P and S Stubblebine (2000) ‘Software Engineering for Security : a Roadmap’ Future of Software Engineering, ACM 225-239
• Dolley J (1933) ‘Characteristics and Procedure of Common Stock Split-Ups,’ Harvard Business Review, 316-326
• Dos Santos BL, Peffers K and D Mauer (1993) ‘The Impact of Information Technology on the Market Value of the Firm’, Information Systems Research, 4 (March), 1-23
• Gal-Or, E. & A Ghose (2003). ‘The Economic Consequences of Sharing Security Information’, In 2nd Workshop on Economics and Information Security, May 29-30.
• Gordon LA & MP Loeb(2002) ‘The Economics of Information Security Investments’ ACM Transactions on Information and Systems Security,5(4),438-457
• Gordon, L.A., Loeb, M.P. & Lucyshyn, W. (2002) ‘An Economic Perspective on the Sharing of Information Related to Security Breaches: Concepts and Empirical Evidence’, In The 1stWorkshop on Economics and Information Security, May16-17.
• Gordon LA and MP Loeb and T Sohail (2003) ‘A Framework for Using Insurance for Cyber Risk Management’ Communications of the ACM, 46(3), 81-85
• Harter DE, Krishnan MS and Slaughter SA (2000) ‘Effects of Process Maturity on Quality, Cycle Time, and Effort in Software Product Development’ Management Science, 46(4), 451-466
32
• Hendricks KB and Singhal VR (1996) ‘Quality Awards and the Market Value of the Firm: An Empirical Investigation’ Management Science, 42(2), 415-436
• Hendricks KB and Singhal VR (1997) ‘Delays in New Product Introductions and the Market Value of the Firm: The Consequences of Being Late to the Market’, Management Science, 43(4), 422-436
• Hovav A and J D’Arcy (2003) ‘The Impact of Denial-of-Service Attack Announcements of the Market Value of Firms’, Risk Management and Insurance Review, 6(2), 97-121
• Hsiao, C (2002) ‘Analysis of Panel Data’ Cambridge University Press • Im KS, Dow KE and V Grover (2001) ‘Research Report: A Reexamination of IT
Investment and the Market Value of the Firm – An Event Study Methodology’, Information Systems Research, 12(1), 103-117
• Jarrell G and S Peltzman (1985) ‘The Impact of Product Recalls on the Wealth of Sellers’ The Journal of Political Economy, 93(1), 512-536
• Kannan K and R Telang (2004) ‘Market for Software Vulnerabilities? Think Again’ Management Science (Forthcoming).
• Kannan K, Rees J and S Sridhar (2004) ‘Reexamining the Impact of Information Security Breach Announcements on Firm Performance’ Working Paper
• Lane V and R Jacobson (1995) ‘Stock Market Reactions to Brand Extension Announcements: The Effects of Brand Attitude and Familiarity’, Journal of Marketing, 59 (January), 63-77
• McGraw G (2004) ‘Software Security’ IEEE Security and Privacy, 2(2), 80-83 • Malatesta, P and R Thompson (1985) ‘Partially Anticipated Events: A Model of Stock
Price Reactions with an Application to Corporate Acquisitions’, Journal of Financial Economics, 14(2), 237-250
• Paulk M Weber C, Curtis W and Chrissis M (1994) ‘The Capability Maturity Model: Guidelines for Improving the Software Process’ Carnegie Mellon University : Software Engineering Institute
• Pfleegar CP (1997) ‘The Fundamentals of Information Security’ IEEE Software, 14(1), 15-17
• Potter B and G McGraw (2004) ‘Software Security Testing’ IEEE Security and Privacy, 2(5), 81-85
• Slaughter SA, DE Harter and MS Krishnan (1998) ‘Evaluating the Cost of Software Quality’ Communications of the ACM, 41(8), 67-73
• Wallace L, Keil M and A Rai (2004) ‘How Software Project Risk Affects Project Performance: An Investigation of the Dimensions of Risk and An Exploratory Model’, Decision Scineces, 35(2), 289-321
• Wang H and C Wang (2003) ‘Taxonomy of Security Considerations and Software Quality’ Communications of the ACM, 46(6), 75-78