A Forrester Total Economic Impact™ Study Commissioned By Gigamon Project Director: Shaheen Parks April 2016 The Total Economic Impact™ Of Gigamon Cost Savings And Business Benefits Enabled By Gigamon
Transcript
A Forrester Total Economic Impact™ Study
Commissioned By
Gigamon
Project Director: Shaheen Parks April 2016
The Total Economic Impact™ Of Gigamon Cost Savings And Business Benefits Enabled By Gigamon
Table Of Contents Executive Summary .................................................................................... 3
ABOUT FORRESTER CONSULTING Forrester Consulting provides independent and objective research-based consulting to help leaders succeed in their organizations. Ranging in scope from a short strategy session to custom projects, Forrester’s Consulting services connect you directly with research analysts who apply expert insight to your specific business challenges. For more information, visit forrester.com/consulting.
Executive Summary Gigamon commissioned Forrester Consulting to conduct a Total Economic Impact™ (TEI) study and examine the potential return on investment (ROI) enterprises may realize by deploying Gigamon. The purpose of this study is to provide readers with a framework to evaluate the potential financial benefit of Gigamon on their organizations.
To better understand the benefits, costs, and risks associated with a Gigamon implementation, Forrester interviewed several customers with multiple years of experience using Gigamon solutions. The Gigamon portfolio provides a security delivery platform, network visibility, and traffic monitoring. The products can be configured to manipulate and route traffic to various tools, including security, application performance, network management, analysis, and compliance tools. The ability to mirror network traffic is also important in creating a Traffic Visibility Fabric™ that delivers traffic to security analytics tools for deeper inspection and analysis.
Prior to Gigamon, customers did not have comprehensive and scalable visibility across their networks. These limitations led to diminished security and constraints in executing network upgrade projects. With Gigamon, customers were able to improve network processes across a variety of tools, enabling them to meet their objectives, increase productivity, and keep costs in check without affecting performance. As one network architect told us: “We get the continuous traffic. Without Gigamon, it would be impossible to do that.”
GIGAMON STRENGTHENS SECURITY AND LOWERS COSTS
Our interviews with four existing Gigamon customers and subsequent financial analysis found that a composite organization based on these interviewed organizations experienced the risk-adjusted ROI, benefits, and costs shown in Figure 1.1 See Appendix A for a description of the composite organization.
The composite organization analysis points to benefits of $2.7 million versus costs of $1.1 million, adding up to a net present value (NPV) of $1.6 million.
Gigamon can enhance network security while reducing fixed and variable costs. The costs and benefits for a composite organization of 5,000 employees, based on customer interviews, are:
x Investment costs: $797,000. x Annual costs: $154,700. x Total cost savings and benefits (over
three years): $2.1 million.
4
› Benefits. The composite organization experienced the following risk-adjusted benefits:
• Reduced cost of hardware and software. The use of Gigamon led to hardware and software savings, through either the elimination of some hardware and software or the reduced usage of others. The total benefit included in the analysis is over $1.1 million.
• Reporting effort savings. The metrics and reports available from the Gigamon Visibility Fabric eliminated the need to run specialized, discrete reports (and also eliminated the wait for the results of the reporting process). We have included savings of approximately $18,000 in the financial model.
• Reduction in downtime. The Gigamon platform led to a reduction in network downtime on a regular basis. The value of this benefit will vary widely; therefore, we have included a nominal amount in the financial analysis to represent this savings; we invite the reader to expand this category as needed. The total for this benefit is over $26,000.
• Fewer security personnel required. Use of Gigamon allowed the organization to reduce the number of security personnel needed. The value of this benefit is approximately $1.5 million.
• Customer satisfaction. The reduction in downtime as well as the ability to provide continuous network traffic without interruption led to higher customer satisfaction for both internal and external customers. We have not quantified the value of this benefit, but interviewees stressed its importance.
• Strengthened security profile. In addition to reducing its security-focused resources, the organization was able to strengthen its overall security posture, improving the prompt identification and resolution of anomalies. While we have not quantified this benefit apart from the time savings for security personnel (addressed in a previous benefit), this is a crucial benefit of the solution; interviewees cited better root cause analysis and quicker resolution time, particularly for potentially severe threats.
› Costs. The composite organization experienced the following risk-adjusted costs:
• Gigamon costs of $30,000 per device on average, for a total of $720,000 initially. This is the cost for the Gigamon appliances; the composite organization required 24 appliances with the associated software across four data centers. We also include 20% maintenance.
• Planning and implementation costs. These are the costs for internal resources to plan and implement Gigamon, totaling $77,000 upfront.
• Ongoing administration costs. This category represents the cost for ongoing administration of the Gigamon solution, at a total of $14,700 annually.
5
Disclosures The reader should be aware of the following:
› The study is commissioned by Gigamon and delivered by Forrester Consulting. It is not meant to be used as a competitive analysis.
› Forrester makes no assumptions as to the potential ROI that other organizations will receive. Forrester strongly advises that readers use their own estimates within the framework provided in the report to determine the appropriateness of an investment in Gigamon.
› Gigamon reviewed and provided feedback to Forrester, but Forrester maintains editorial control over the study and its findings and does not accept changes to the study that contradict Forrester's findings or obscure the meaning of the study.
› Gigamon provided the customer names for the interviews but did not participate in the interviews.
6
TEI Framework And Methodology
INTRODUCTION
From the information provided in the interviews, Forrester has constructed a Total Economic Impact (TEI) framework for those organizations considering implementing Gigamon. The objective of the framework is to identify the cost, benefit, flexibility, and risk factors that affect the investment decision, to help organizations understand how to take advantage of specific benefits, reduce costs, and improve the overall business goals.
APPROACH AND METHODOLOGY
Forrester took a multistep approach to evaluate the impact that Gigamon can have on an organization (see Figure 2). Specifically, we:
› Interviewed Gigamon marketing and sales personnel, along with Forrester analysts, to gather data relative to Gigamon and the marketplace for Gigamon.
› Interviewed four organizations currently using Gigamon to obtain data with respect to costs, benefits, and risks.
› Designed a composite organization based on characteristics of the interviewed organizations (see Appendix A).
› Constructed a financial model representative of the interviews using the TEI methodology. The financial model is populated with the cost and benefit data obtained from the interviews as applied to the composite organization.
› Risk-adjusted the financial model based on issues and concerns the interviewed organizations highlighted in interviews. Risk adjustment is a key part of the TEI methodology. While interviewed organizations provided cost and benefit estimates, some categories included a broad range of responses or had a number of outside forces that might have affected the results. For that reason, some cost and benefit totals have been risk-adjusted and are detailed in each relevant section.
Forrester employed four fundamental elements of TEI in modeling Gigamon’s service: benefits, costs, flexibility, and risks.
Given the increasing sophistication that enterprises have regarding ROI analyses related to IT investments, Forrester’s TEI methodology serves to provide a complete picture of the total economic impact of purchase decisions. Please see Appendix B for additional information on the TEI methodology.
FIGURE 2 TEI Approach
Source: Forrester Research, Inc.
Perform due diligence
Conduct customer interviews
Design composite
organization
Construct financial
model using TEI framework
Write case study
7
Analysis
COMPOSITE ORGANIZATION
For this study, Forrester conducted a total of four interviews with representatives from the following companies, which are Gigamon customers based in the US and Canada:
› A healthcare plan provider based in the Midwestern United States, with approximately 3,500 employees and more than 2.5 million members.
› An energy company with revenues of close to $30 billion, 30,000 employees, and approximately 35,000 megawatts of owned capacity.
› A Canadian bank that offers commercial and personal banking, wealth management, and corporate and investment banking services. The bank has more than 21 million customers and assets in excess of $800 billion.
› An American computer storage and data management company with more than $6 billion in annual revenue and approximately 13,000 employees.
Based on the interviews, Forrester constructed a TEI framework, a composite company, and an associated ROI analysis that illustrates the areas financially affected. The composite organization that Forrester synthesized from these results represents an organization with the following characteristics:
› It is an insurance provider.
› It has 5,000 employees.
› It has four data centers.
Forrester notes that this composite organization, while reflecting the characteristics of the interviewed customers, is on the larger size compared with many typical Gigamon customers. For a smaller company, we would expect similar benefit and cost categories; however, the magnitudes of both costs and benefits would be proportionally smaller as well, reflecting the size of the organization.
After an extensive RFP and business case process evaluating multiple vendors, the composite organization chose Gigamon and began deployment.
INTERVIEW HIGHLIGHTS
All of the interviewees discussed their use of Gigamon as dual-purpose, using it for both data security and network purposes. While one interviewee began using Gigamon after a string of network incidents forced the issue, others brought the solution in as part of redesign efforts. However they started using the product, all of the interviewees revealed that after the initial use case, they expanded the Gigamon solution to other uses within their organizations.
The interviews revealed that:
› Cost savings associated with Gigamon were significant. The ability to reduce costs through filtering of network traffic and more effective use of hardware was a primary benefit for interviewees.
“It was quick to see there was clear value to Gigamon — almost instantaneous.” ~ Network engineer
“We have better visibility into threats — and we don’t have to interrupt any traffic for the threat monitoring.” ~ Network architect
8
› Security was an important benefit of using Gigamon. All interviewees cited an improvement in security, though it was not always possible to quantify. Some indicated that there was a large improvement in the ability to reduce both mean time to identification and recovery (MTTI/MTTR). While others indicated a specific reduction in effort associated with investigating anomalies, others concentrated on the overall improvement afforded by better, quicker identification and resolution, leading to fewer incidents overall.
› Network availability was a key driver. The ability to move tasks out of band and reduce impediments to the flow of network traffic was important to all interviewees, including both internal users and customers.
9
BENEFITS
The composite organization experienced a number of quantified benefits in this case study:
› Reduced cost of hardware and software.
› Reporting effort savings.
› Reduction in downtime.
› Fewer security personnel required.
Another important benefit mentioned by the interviewed organizations was an increase in customer satisfaction. While customer satisfaction depends on a number of factors, some organizations nevertheless regarded the opportunity to provide best-in-class customer service as a strong driver for implementing Gigamon. One interviewee said: “While there is not a lot of awareness or appreciation for the network, there is a very low tolerance for network issues. The lack of negative impact on our environment is huge.”
Additionally, although we have not quantified its impact, most of the interviewees confirmed that their overall security was stronger with Gigamon. One interviewee commented, “It’s so much easier to find the problems.” Another said: “We absolutely have a lower chance of an incident. With Gigamon, we are able to resolve threats and act quickly.”
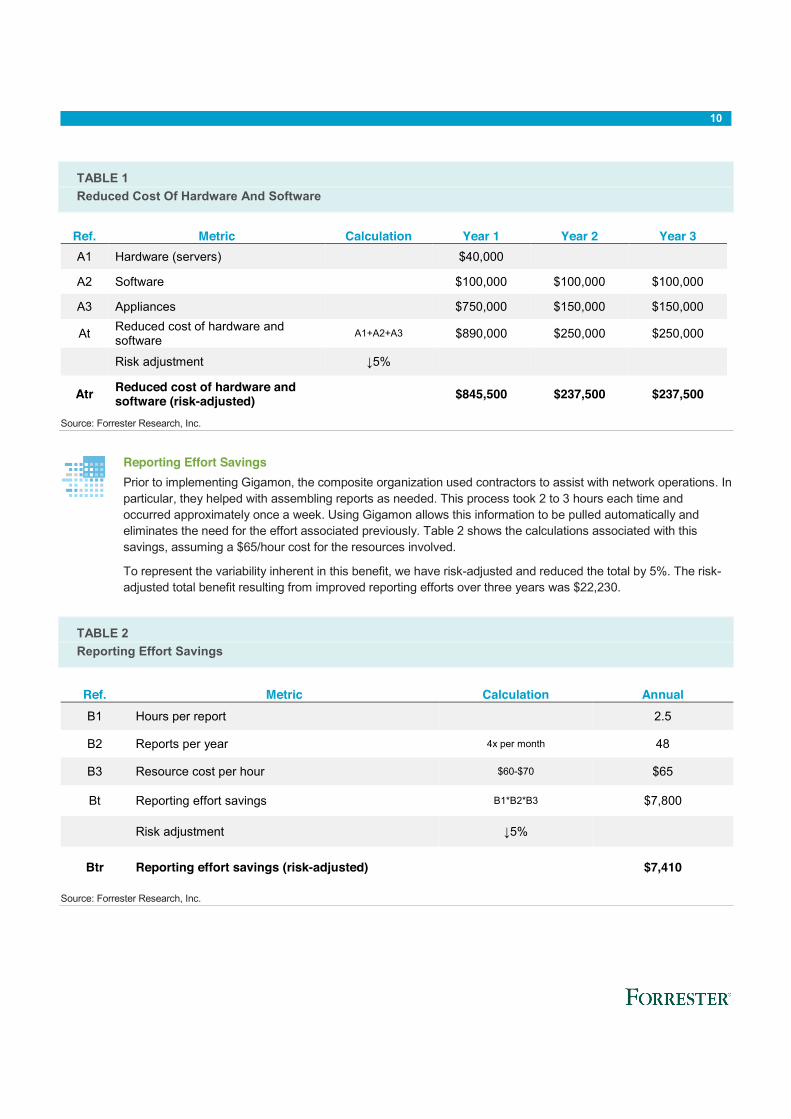
Reduced Cost Of Hardware And Software All of the interviewed organizations were able to eliminate costs associated with various kinds of hardware and software. In order to calculate this benefit, we have grouped the savings into three categories: hardware (primarily servers), software, and appliances. For the server cost avoidance, the composite organization is able to shrink the number of servers required to support network operations, moving from six to just two. We estimate these servers at $10,000 each, leading to total savings of $40,000 in the first year of the analysis. For the software costs, the composite organization is able to reduce the traffic flow to a number of tools by leveraging Gigamon’s filtering capabilities to sort and reduce the amount of data handled by the tools. As the tool cost is dependent on the amount of traffic, this lowered the cost incurred by the organization. In aggregate, we include $100,000 per year in this category; interviewees estimated this savings anywhere from $20,000 to $200,000 annually. Finally, we include savings associated with fewer appliances. One interviewee estimated that his company would require four times as many appliances without Gigamon, which would involve both upfront costs and ongoing maintenance costs. We have included a total of $750,000 in savings in appliance costs in the first year of the analysis, with an ongoing savings of 20%, or $150,000, in the later years.
All three of these savings benefits varied widely between the interviewees, as the benefits were highly dependent on the details of each company’s existing environment and network requirements. To compensate, this benefit was risk-adjusted and reduced by 5%. The risk-adjusted total benefit resulting from software and hardware savings over the three years was $1,320,500. See the section on Risks for more detail.
10
TABLE 1 Reduced Cost Of Hardware And Software
Ref. Metric Calculation Year 1 Year 2 Year 3 A1 Hardware (servers) $40,000
A2 Software $100,000 $100,000 $100,000
A3 Appliances $750,000 $150,000 $150,000
At Reduced cost of hardware and software A1+A2+A3 $890,000 $250,000 $250,000
Risk adjustment ↓5%
Atr Reduced cost of hardware and software (risk-adjusted) $845,500 $237,500 $237,500
Source: Forrester Research, Inc.
Reporting Effort Savings Prior to implementing Gigamon, the composite organization used contractors to assist with network operations. In particular, they helped with assembling reports as needed. This process took 2 to 3 hours each time and occurred approximately once a week. Using Gigamon allows this information to be pulled automatically and eliminates the need for the effort associated previously. Table 2 shows the calculations associated with this savings, assuming a $65/hour cost for the resources involved.
To represent the variability inherent in this benefit, we have risk-adjusted and reduced the total by 5%. The risk-adjusted total benefit resulting from improved reporting efforts over three years was $22,230.
TABLE 2 Reporting Effort Savings
Ref. Metric Calculation Annual B1 Hours per report 2.5
Reduction In Downtime Several of the interviewees discussed the importance of constant network availability and the impact Gigamon had in terms of reducing the number of outages. One interviewee in particular stressed this as a key benefit of the solution: “Network outages affect the ability of the organization to do what they do. It can affect lots of people using the customer portals. If we can’t provide service, we can be subject to fines. And the traders are quick to tell us that 30 seconds [of downtime] can cost us $30 million.” In discussing how Gigamon affected the situation, he said, “It was quick to see there was benefit, because we could pull out that functionality, secure the core, and solve the problem out of band.”
While these totals reflect extraordinary circumstances, we include the reduction in downtime calculation below to offer the reader a way to evaluate this impact. We have used a nominal rate of $1,000/hour of downtime (though it can be much higher). Even at this low rate, we see an annual savings of $12,000 associated with downtime elimination, assuming one incident a month (lasting 1 hour) is eliminated. We encourage the reader to consider the real cost of downtime when evaluating the impact of this benefit, as uptime can be crucial to any organization.
Given the difficulty in projecting this benefit, the total savings included in the financial model was risk-adjusted and reduced by 10%. The risk-adjusted total benefit resulting from a reduction in downtime was $32,400 over the three years.
TABLE 3 Reduction In Downtime
Ref. Metric Calculation Annual C1 Number of outages 1/month 12
C2 Length of outage (hours)
1
C3 Cost per hour of outage $1,000
Ct Reduction in downtime C1*C2*C3 $12,000
Risk adjustment ↓10%
Ctr Reduction in downtime (risk-adjusted)
$10,800
Source: Forrester Research, Inc.
Fewer Security Personnel Required The final benefit included in the financial analysis is the savings associated with fewer security personnel. The interviewed organizations described the efficiency gains associated with using Gigamon for security-related tasks, which included savings in hardware, software, and labor. We have assumed that the software and hardware savings are included in the projections of the first benefit category; here, we quantify the value of fewer security-focused resources. One interviewee said: “We would have definitely required both more staff and more tools without Gigamon. We would have needed double the security staff, at least a dozen. Our goal is to decrease complexity as well as cost.” In this case, the organization was able to avoid hiring additional resources; other companies could potentially redirect existing resources into other functions within security or IT.
For the composite organization, we include the savings from five fewer resources, at a fully loaded annual rate of $130,000, as shown in Table 4. As interviewees provided a wide range for this savings, this benefit was risk-
12
adjusted and reduced by 5%. The risk-adjusted total benefit resulting from a reduction in security personnel over the three years was $1,852,500. See the section on Risks for more detail.
TABLE 4 Fewer Security Personnel Required
Ref. Metric Calculation Annual D1 Number of personnel 5
D2 Annual rate $130,000
Dt Security personnel D1*D2 $650,000
Risk adjustment ↓5%
Dtr Security personnel (risk-adjusted) $617,500
Source: Forrester Research, Inc.
Total Benefits Table 5 shows the total of all benefits across the four areas listed above, as well as present values (PVs) discounted at 10%. Over three years, the composite organization expects risk-adjusted total benefits to be a PV of more than $2.7 million.
TABLE 5 Total Benefits (Risk-Adjusted)
Ref. Benefit Category Year 1 Year 2 Year 3 Total Present Value
Atr Reduced cost of hardware and software $845,500 $237,500 $237,500 $1,320,500 $1,143,355
Total benefits (risk-adjusted) $1,481,210 $873,210 $873,210 $3,227,630 $2,724,271
Source: Forrester Research, Inc.
13
COSTS
The composite organization experienced a number of costs associated with the Gigamon solution:
› Gigamon costs.
› Planning and implementation costs.
› Ongoing administration costs.
These represent the mix of internal and external costs experienced by the composite organization for initial planning, implementation, and ongoing maintenance associated with the solution.
Gigamon Costs The composite organization uses a total of 24 Gigamon appliances over its four data centers. At a per-appliance cost of $30,000, this leads to a total initial cost of $720,000. We include 20% maintenance in the later years, at a total of $140,000 per year. As maintenance is typically paid for the following year, we include these costs for years 1 and 2 of the analysis.
TABLE 6 Gigamon Costs
Ref. Metric Calculation Initial Year 1 Year 2 E1 Cost per appliance $30,000
E2 Number of appliances 24 E3 Ongoing support E1*E2 $140,000 $140,000
Et Gigamon cost $720,000 $140,000 $140,000
Source: Forrester Research, Inc.
Planning And Implementation Costs In addition to the Gigamon appliance costs, the composite organization incurs costs in the planning and implementation of Gigamon. We include the costs of two resources over three months, at an annual rate of $140,000.
These costs are variable from organization to organization, considering some organizations outsource and some manage this in-house, perhaps augmented with third-party consulting help. Some of the interviewees had prior experience with Gigamon, streamlining their ability to implement the solution. To compensate, this cost was risk-adjusted up by 10%. The risk-adjusted initial cost of planning and implementation was $77,000. See the section on Risks for more detail.
14
TABLE 7 Planning And Implementation Costs
Ref. Metric Calculation Initial F1 Number of resources 2
F2 Length of time (years) 3 months .25
F3 Annual rate $140,000
Ft Planning and implementation F1*F2*F3 $70,000
Risk adjustment ↑10% �
Ftr Planning and implementation (risk-adjusted) $77,000
Source: Forrester Research, Inc.
Ongoing Administration Costs Interviewees cited a small amount of ongoing administration labor required. For the composite organization, we include 2 hours per week, at an hourly rate of $67/hour, with a 5% risk adjustment for variability. This yielded a total cost of $14,700 annually, as shown in Table 8.
TABLE 8 Ongoing Administration Costs
Ref. Metric Calculation Annual G1 Hours per week 2
Total Costs Table 9 shows the total of all costs as well as associated present values (PVs), discounted at 10%. Over three years, the composite organization expects total costs to be a PV of a little more than $1 million.
15
TABLE 9 Total Costs (Risk-Adjusted)
Ref. Cost Category Initial Year 1 Year 2 Year 3 Total Present Value
Total costs (risk-adjusted) $797,000 $154,700 $154,700 $14,700 $1,121,100 $1,076,532
Source: Forrester Research, Inc.
FLEXIBILITY
Flexibility, as defined by TEI, represents an investment in additional capacity or capability that could be turned into business benefit for some future additional investment. This provides an organization with the “right” or the ability to engage in future initiatives but not the obligation to do so. There are multiple scenarios in which a customer might choose to implement Gigamon and later realize additional uses and business opportunities. Flexibility would also be quantified when evaluated as part of a specific project (described in more detail in Appendix B).
For the purposes of this analysis, we have not quantified flexibility. However, interviewees who had been using Gigamon for an extended period of time were very enthusiastic about the opportunity to continually expand the number of use cases within their organizations. One interviewee said, “Gigamon is a collaboration tool for us, breaking down the silos between different parts of the organization.” Another told us: “Once people heard that we could start pulling transparency out, with no risk to the network, everyone wanted to use it. As we put processes in place, there is a trickle effect. We continue to buy Gigamon products and increase the footprint as the organization grows.”
RISKS
Forrester defines two types of risk associated with this analysis: “implementation risk” and “impact risk.” Implementation risk is the risk that a proposed investment in Gigamon may deviate from the original or expected requirements, resulting in higher costs than anticipated. Impact risk refers to the risk that the business or technology needs of the organization may not be met by the investment in Gigamon, resulting in lower overall total benefits. The greater the uncertainty, the wider the potential range of outcomes for cost and benefit estimates.
16
TABLE 10 Benefit And Cost Risk Adjustments
Benefits Adjustment
Reduced cost of hardware and software Ð 5%
Reporting effort savings Ð 5%
Reduction in downtime Ð 10%
Security personnel Ð 5%
Costs Adjustment
Planning and implementation Ï 10%
Ongoing administration Ï 5%
Source: Forrester Research, Inc.
Quantitatively capturing implementation risk and impact risk by directly adjusting the financial estimates results provides more meaningful and accurate estimates and a more accurate projection of the ROI. In general, risks affect costs by raising the original estimates, and they affect benefits by reducing the original estimates. The risk-adjusted numbers should be taken as “realistic” expectations since they represent the expected values considering risk.
The following impact risk that affects benefits is identified as part of the analysis:
› All of the benefits included in this analysis varied widely between the interviewed organizations. While we have chosen conservative values for each calculation, we have also applied risk adjustments to the totals to compensate.
The following implementation risk that affects costs is identified as part of this analysis:
› Both planning and administration costs have been risk-adjusted. Both were quite low as estimated by the interviewees; we have risk-adjusted these costs to compensate for the potential impact of previous experience with the solution and other factors that may have influenced the amount of effort required.
Table 10 shows the values used to adjust for risk and uncertainty in the cost and benefit estimates for the composite organization. Readers are urged to apply their own risk ranges based on their own degree of confidence in the cost and benefit estimates.
17
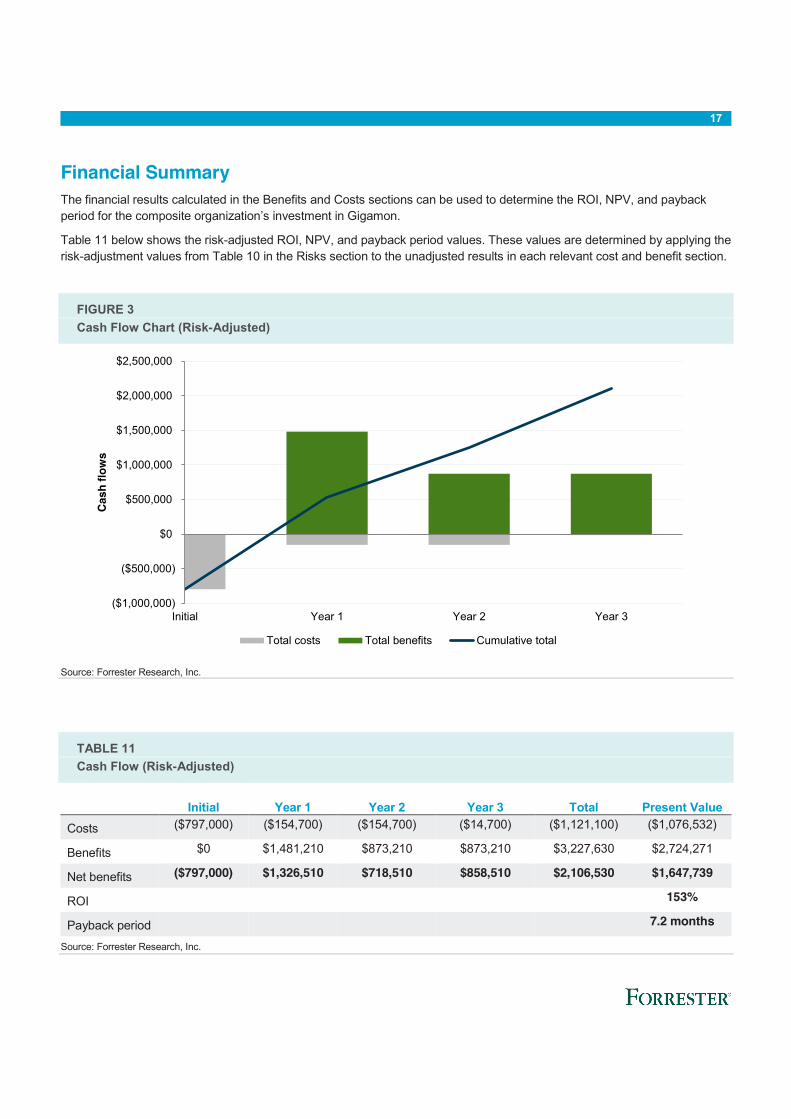
Financial Summary The financial results calculated in the Benefits and Costs sections can be used to determine the ROI, NPV, and payback period for the composite organization’s investment in Gigamon.
Table 11 below shows the risk-adjusted ROI, NPV, and payback period values. These values are determined by applying the risk-adjustment values from Table 10 in the Risks section to the unadjusted results in each relevant cost and benefit section.
Net benefits ($797,000) $1,326,510 $718,510 $858,510 $2,106,530 $1,647,739
ROI 153%
Payback period 7.2 months
Source: Forrester Research, Inc.
($1,000,000)
($500,000)
$0
$500,000
$1,000,000
$1,500,000
$2,000,000
$2,500,000
Initial Year 1 Year 2 Year 3
Cas
h flo
ws
Total costs Total benefits Cumulative total
18
Gigamon: Overview The following information is provided by Gigamon. Forrester has not validated any claims and does not endorse Gigamon or its offerings.
Gigamon (NYSE: GIMO) provides active visibility into physical and virtual network traffic, enabling stronger security and superior performance. Gigamon’s Visibility Fabric and GigaSECURE, the industry’s first Security Delivery Platform, deliver advanced intelligence to assure that security, network, and application performance management solutions in enterprise, government, and service provider networks operate more efficiently.
As data volumes grow, threats become more sophisticated, network speeds increase, and tools are increasingly overburdened, making 100% visibility more critical than ever. While Gigamon does not make pure-play security or monitoring tools, its technology makes these tools better at what they do: monitoring, detecting, responding, analyzing, and protecting.
Gigamon empowers infrastructure and security architects, managers, and operators with unmatched visibility into traffic without affecting the performance or stability of production environments. With GigaVUE for traffic visibility and GigaSMART for traffic manipulation, the GigaSECURE Security Delivery Platform filters and feeds the right traffic at the right time to management, monitoring, and security devices to optimize performance, eliminate blind spots, and reduce false positives.
Gigamon is installed in more than three-quarters of the Fortune 100, more than half of the Fortune 500, and seven of the 10 largest service providers. Gigamon also holds 31 patents, with 28 pending.
19
Appendix A: Composite Organization Description For this TEI study, Forrester has created a composite organization to illustrate the quantifiable benefits and costs of implementing Gigamon. The composite company is intended to represent an insurance provider with 5,000 employees and is based on characteristics of the interviewed customers. The composite company has four data centers spread across the United States.
In purchasing Gigamon, the composite company has the following objectives:
› Improve network visibility.
› Reduce hardware and software costs.
› Improve data security.
FRAMEWORK ASSUMPTIONS
Table 12 provides the model assumptions that Forrester used in this analysis.
The discount rate used in the PV and NPV calculations is 10%, and the time horizon used for the financial modeling is three years. Organizations typically use discount rates between 8% and 16% based on their current environment. Readers are urged to consult with their respective company’s finance department to determine the most appropriate discount rate to use within their own organizations.
TABLE 12 Model Assumptions
Ref. Metric Calculation Value
X1 Hours per week 40
X2 Weeks per year 52
X3 Hours per year (M-F, 9-5) 2,080
X4 Hours per year (24x7) 8,736
X5 Security personnel $130,000
X6 Hourly (C5/C3) $62.50
Source: Forrester Research, Inc.
20
Appendix B: Total Economic Impact™ Overview Total Economic Impact is a methodology developed by Forrester Research that enhances a company’s technology decision-making processes and assists vendors in communicating the value proposition of their products and services to clients. The TEI methodology helps companies demonstrate, justify, and realize the tangible value of IT initiatives to both senior management and other key business stakeholders. TEI assists technology vendors in winning, serving, and retaining customers.
The TEI methodology consists of four components to evaluate investment value: benefits, costs, flexibility, and risks.
BENEFITS
Benefits represent the value delivered to the user organization — IT and/or business units — by the proposed product or project. Often, product or project justification exercises focus just on IT cost and cost reduction, leaving little room to analyze the effect of the technology on the entire organization. The TEI methodology and the resulting financial model place equal weight on the measure of benefits and the measure of costs, allowing for a full examination of the effect of the technology on the entire organization. Calculation of benefit estimates involves a clear dialogue with the user organization to understand the specific value that is created. In addition, Forrester also requires that there be a clear line of accountability established between the measurement and justification of benefit estimates after the project has been completed. This ensures that benefit estimates tie back directly to the bottom line.
COSTS
Costs represent the investment necessary to capture the value, or benefits, of the proposed project. IT or the business units may incur costs in the form of fully burdened labor, subcontractors, or materials. Costs consider all the investments and expenses necessary to deliver the proposed value. In addition, the cost category within TEI captures any incremental costs over the existing environment for ongoing costs associated with the solution. All costs must be tied to the benefits that are created.
FLEXIBILITY
Within the TEI methodology, direct benefits represent one part of the investment value. While direct benefits can typically be the primary way to justify a project, Forrester believes that organizations should be able to measure the strategic value of an investment. Flexibility represents the value that can be obtained for some future additional investment building on top of the initial investment already made. For instance, an investment in an enterprisewide upgrade of an office productivity suite can potentially increase standardization (to increase efficiency) and reduce licensing costs. However, an embedded collaboration feature may translate to greater worker productivity if activated. The collaboration can only be used with additional investment in training at some future point. However, having the ability to capture that benefit has a PV that can be estimated. The flexibility component of TEI captures that value.
RISKS
Risks measure the uncertainty of benefit and cost estimates contained within the investment. Uncertainty is measured in two ways: 1) the likelihood that the cost and benefit estimates will meet the original projections and 2) the likelihood that the estimates will be measured and tracked over time. TEI risk factors are based on a probability density function known as “triangular distribution” to the values entered. At a minimum, three values are calculated to estimate the risk factor around each cost and benefit.
21
Appendix C: Glossary Discount rate: The interest rate used in cash flow analysis to take into account the time value of money. Companies set their own discount rate based on their business and investment environment. Forrester assumes a yearly discount rate of 10% for this analysis. Organizations typically use discount rates between 8% and 16% based on their current environment. Readers are urged to consult their respective organizations to determine the most appropriate discount rate to use in their own environment.
Net present value (NPV): The present or current value of (discounted) future net cash flows given an interest rate (the discount rate). A positive project NPV normally indicates that the investment should be made, unless other projects have higher NPVs.
Present value (PV): The present or current value of (discounted) cost and benefit estimates given at an interest rate (the discount rate). The PV of costs and benefits feed into the total NPV of cash flows.
Payback period: The breakeven point for an investment. This is the point in time at which net benefits (benefits minus costs) equal initial investment or cost.
Return on investment (ROI): A measure of a project’s expected return in percentage terms. ROI is calculated by dividing net benefits (benefits minus costs) by costs.
A NOTE ON CASH FLOW TABLES
The following is a note on the cash flow tables used in this study (see the example table below). The initial investment column contains costs incurred at “time 0” or at the beginning of Year 1. Those costs are not discounted. All other cash flows in years 1 through 3 are discounted using the discount rate (shown in the Framework Assumptions section) at the end of the year. PV calculations are calculated for each total cost and benefit estimate. NPV calculations are not calculated until the summary tables are the sum of the initial investment and the discounted cash flows in each year.
Sums and present value calculations of the Total Benefits, Total Costs, and Cash Flow tables may not exactly add up, as some rounding may occur.
TABLE [EXAMPLE] Example Table
Ref. Metric Calculation Year 1 Year 2 Year 3
Source: Forrester Research, Inc.
22
Appendix D: Endnotes 1 Forrester risk-adjusts the summary financial metrics to take into account the potential uncertainty of the cost and benefit estimates. For more information, see the section on Risks.