28
Impacts and Actions Resulting from the August 14, 2003 Blackout Cornell University David W. Hilt January 20, 2005
| Date post: | 30-Mar-2018 |
| Category: |
Documents |
| Upload: | nguyenkiet |
| View: | 218 times |
| Download: | 1 times |

Impacts and ActionsResulting from the August 14, 2003 Blackout
Cornell UniversityDavid W. Hilt
January 20, 2005

2
Summary of August 14 Blackout
● ImpactsOver 50 million people 60-65,000 MW30 hours to restoreManufacturing disrupted400+ Generators tripped
● StatisticsLine trips began at 3:05 PMCascading began at 4:06 PM− Lasted approximately 12 seconds
Thousands of discrete events

3
1:31:34 p.m.1:31:34 p.m.
August 14, 2003What Happened?
765kVDC
Voltage
MontrealOttawa
Toronto
DetroitCleveland
AkronCanton
Buffalo
New YorkPittsburg
Toledo
2:02 p.m.3:05:41 to 3:41:33 p.m.3:45:33 to 4:08:58 p.m.4:08:58 to 4:10:27 p.m.4:10:00 to 4:10:38 p.m.4:10:40 to 4:10:44 p.m.4:10:44 to 4:13:00 p.m.

4
Every Blackout has Impacts● November 9, 1965 – NY Blackout
30,000,000 people and over 20,000 MW of demand –up to 13 hours
● July 13, 1977 - New York City9,000,000 people and 6,000 MW of demand – up to 26 hours
● July 2, 1996 – Western US2,000,000 customers (10 % of the Western Interconnection) and 11,850 MW of demand for up to several hours
● August 10, 1996 – Western US7,500,000 customers; 28,000 MW of demand for up to 9 hours

5
Recommendations● The three Ts
ToolsTreesTraining
• Need to implement throughout the industry

6
Investigation Organization OverviewSteering Group
MAAC/ECAR/NPCC Coordinating Group
MAAC
ECAR
NPCC
MEN Study Group
Project Planning and Support
Sequence of Events
Data Requests and Management
Investigation Team Lead
System Modeling and Simulation Analysis
NERC & Regional Standards/Procedures
& Compliance
Transmission System Performance,
Protection, ControlMaintenance & Damage
Operations - Tools, SCADA/EMS
Communications Op Planning
System Planning, Design, & Studies
Root Cause AnalysisCooper Systems
Generator Performance, Protection, Controls
Maintenance & Damage
U.S – CanadaTask Force
Vegetation/ROW Management
Frequency/ACE
Restoration
Investigation Process Review

7
Causes of the August 14 Blackout
● Inadequate situational awareness ● Ineffective vegetation
management● Inadequate diagnostic support●Failure to follow NERC Operating
Policies and Planning Standards

8
Near-Term Actions
● Voltage and Reactive ManagementEnsure sufficient voltage support for reliable operations
● Reliability CommunicationsStrengthen and implement communication protocols between Control Area Operators, Reliability Coordinators, and ISOs
● Failures of System Monitoring and Control Functions
Review, update, and train on plans for loss of monitoring and control systems

9
Near-Term Actions
● Emergency Action PlansReview, update, and train on emergency plans and actions
● Train for EmergenciesConduct emergency training drills
● Vegetation ManagementConfirm that ROWs are clear of obstructions
10
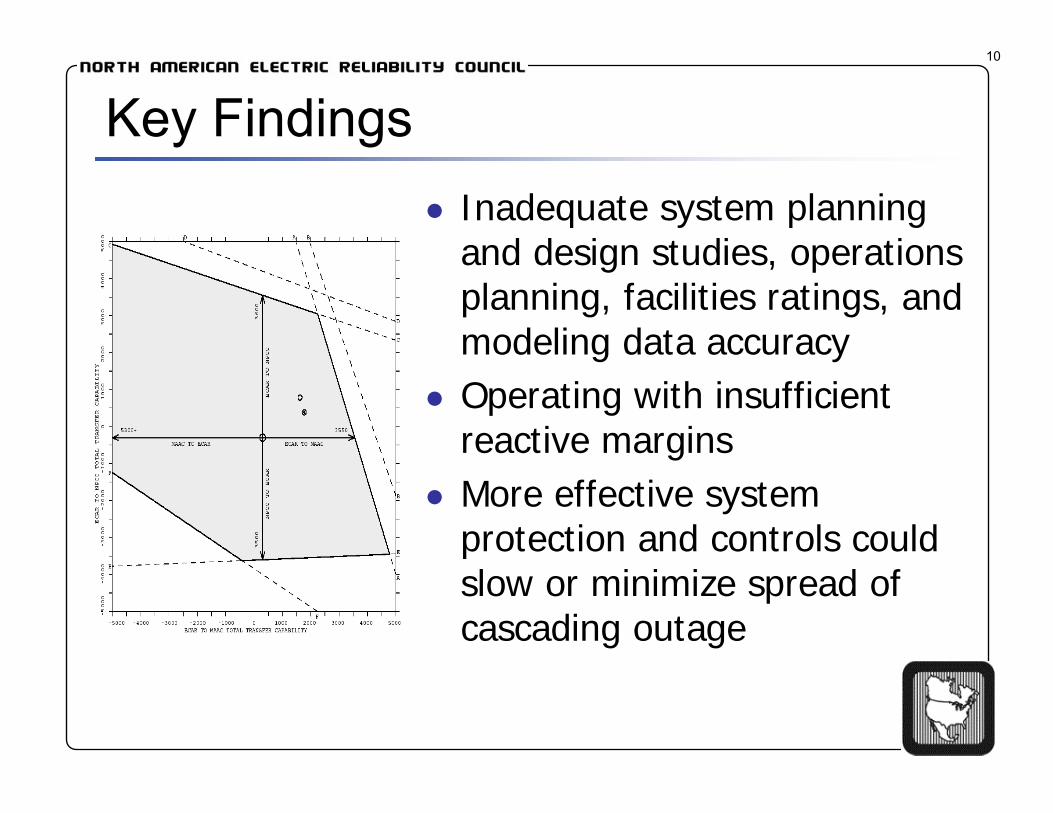
Key Findings● Inadequate system planning
and design studies, operations planning, facilities ratings, and modeling data accuracy
● Operating with insufficient reactive margins
● More effective system protection and controls could slow or minimize spread of cascading outage

11
Key Findings
● Compliance requires objective measurements and concrete actions to resolve violations
● Problems from prior blackouts were repeated
12
NERC Blackout Recommendations
● Corrective Actions● Strategic Initiatives● Technical Initiatives
Goals:1. Correct root cause deficiencies 2. Address contributing factors3. Identify objective and
measurable actions

13
Corrective Actions: FE● Voltage criteria and
reactive resources● Operational
preparedness and action plan
● Emergency response capabilities and preparedness
● Control center and operator training
Juniper 345kV
-1000
-900
-800
-700
-600
-500
-400
-300
-200
-100
0
100
200
300
400
500
0.7 0.8 0.9 1 1.1
Voltage PU
Reac
tive
Pow
er (M
VAR)
15-05 Chamberlin-Harding
15-32 Hanna-Juniper
15-41 Star-S Canton
15-45-40 Canton Central-Tidd
15-59 West Akron 138kV Lines
14
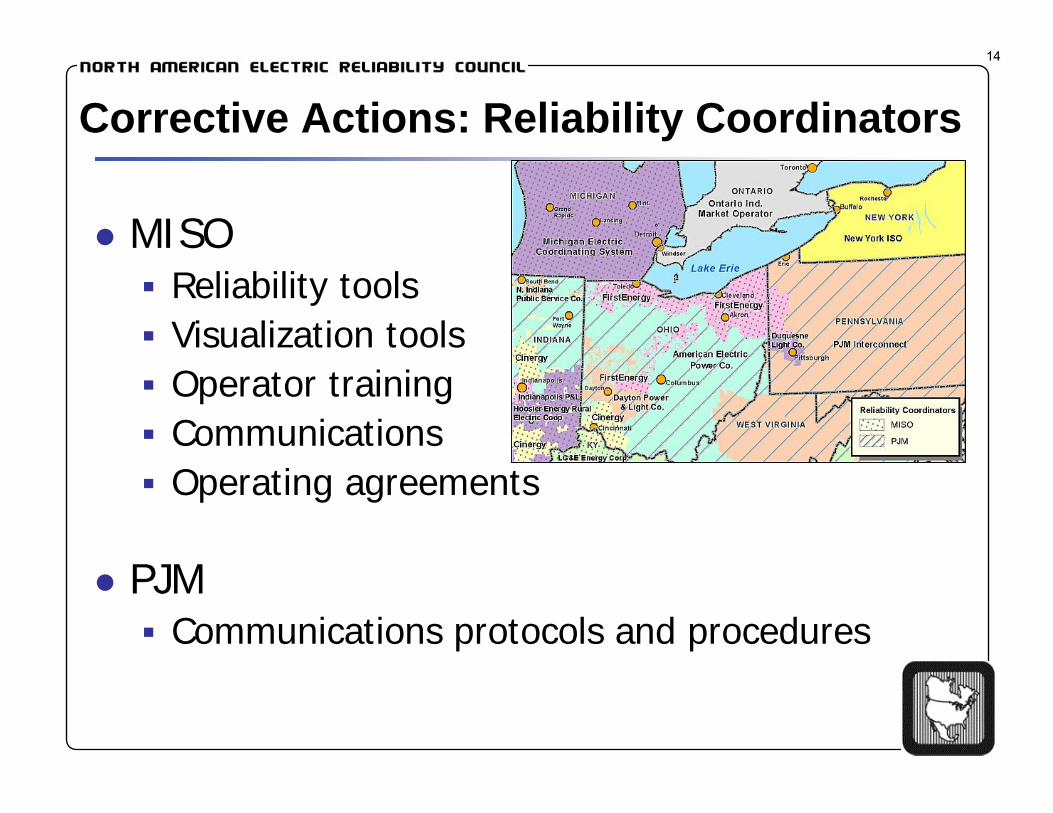
Corrective Actions: Reliability Coordinators
● PJMCommunications protocols and procedures
● MISOReliability toolsVisualization toolsOperator trainingCommunicationsOperating agreements

15
NERC Strategic Initiatives
● Strengthen compliance● Readiness audits● Vegetation-related
outage reporting● Track implementation
of recommendations
16
Performance Reviews
● Strengthen NERC Compliance Enforcement Program
Regions to submit results to NERCProvide list of non-compliant entities
● Confidential reports to the NERC BoardSpecific violationsResults of audits
● Release of confirmed violationsIdentification of violators

17
Readiness Audits
● Audit control areas and reliability coordinators
● Conduct on a 3-year cycle
● Report to the Board

18
Readiness Audit Program Status
● On target to audit one-third of control areas and reliability coordinators in 2004
● Audits Completed as of October 14, 2004
57 Control Areas6 Reliability Coordinators1 Transmission Operator

19
Vegetation-Related Outage Reports
● Report tree contacts to the Regions (230+ kV)
● Regions report to NERC● Regions to conduct and
report on annual vegetation management surveys

20
Recommendations Tracking
● NERC and Regions will track:Implementation of recommendationsCompliance auditsReadiness audit recommendationsLessons learned from system disturbancesUse regional processes as model
21
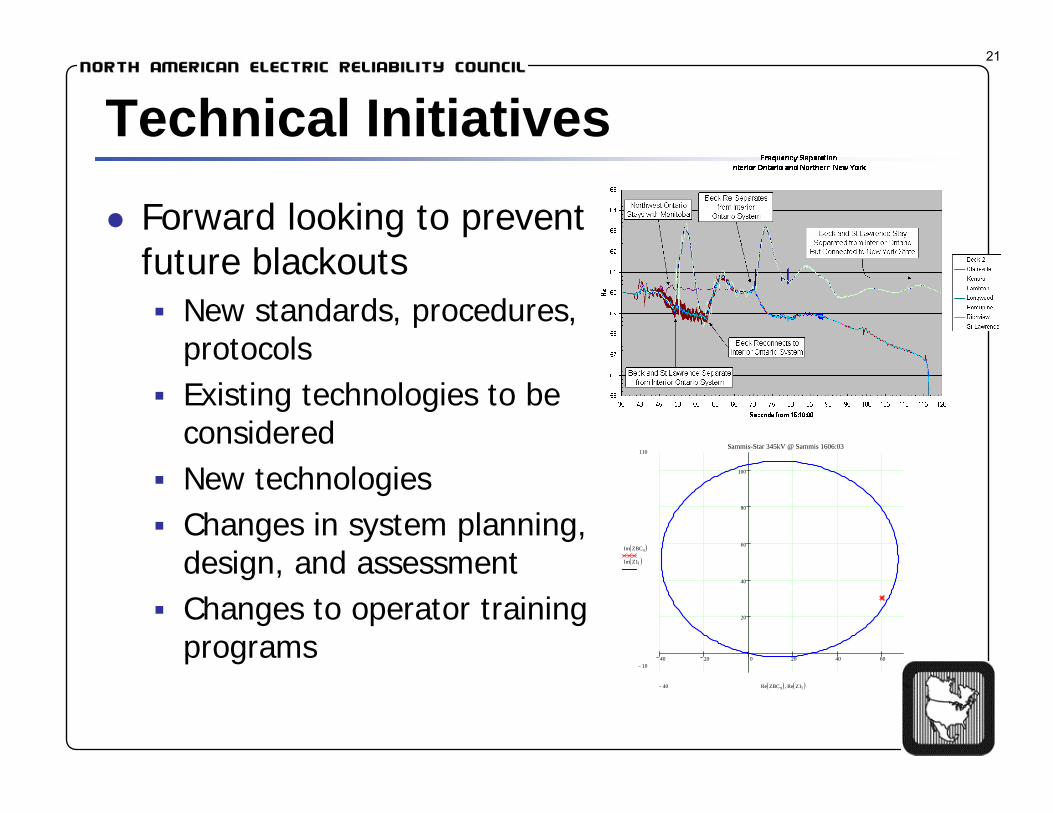
Technical Initiatives
● Forward looking to preventfuture blackouts
New standards, procedures, protocolsExisting technologies to be consideredNew technologies Changes in system planning, design, and assessmentChanges to operator training programs 40 20 0 20 40 60
20
40
60
80
100
Sammis-Star 345kV @ Sammis 1606:03110
10−
Im ZBCx( )Im Z1l( )
7040− Re ZBCx( ) Re Z1l( ),

The Gory Details
Really Interesting Plots for Engineers
22

23
NY to Ontario 345kV Line Flows at NiagaraProgressively Worsening Stability Conditions
New York to Ontario 345 kV Line Flow at Niagara(does not include 230 kV line flow)
0.00
200.00
400.00
600.00
800.00
1000.00
1200.00
1400.00
1600.00
1800.00
2000.00
16:0
5:43
16:0
5:49
16:0
5:54
16:0
6:00
16:0
6:05
16:0
6:11
16:0
6:16
16:0
6:22
16:0
6:27
16:0
6:33
16:0
6:38
16:0
6:44
16:0
6:49
16:0
6:55
16:0
8:55
16:0
9:00
16:0
9:06
16:0
9:11
16:0
9:17
16:0
9:23
16:0
9:28
16:0
9:33
16:0
9:39
16:0
9:45
16:0
9:50
16:0
9:56
16:1
0:01
16:1
0:20
16:1
0:26
16:1
0:31
16:1
0:37
16:1
0:42
16:1
0:48
MW
200.0
220.0
240.0
260.0
280.0
300.0
320.0
340.0
360.0
380.0
KV
Niagara KV
PA301&2 MW
Sammis-Star 345 trip
East Lima - Fostoria Central 345 trip
Thetford-Jewel, Hampton Pontiac,& Perry - Ashtabula 345kV lines trip
Argenta - Battle Creekdouble circuit 345 trip

24
Detroit Units Slip Poles

25
Severe Under Frequency Condition

26
View Into Detroit from Lambton
27
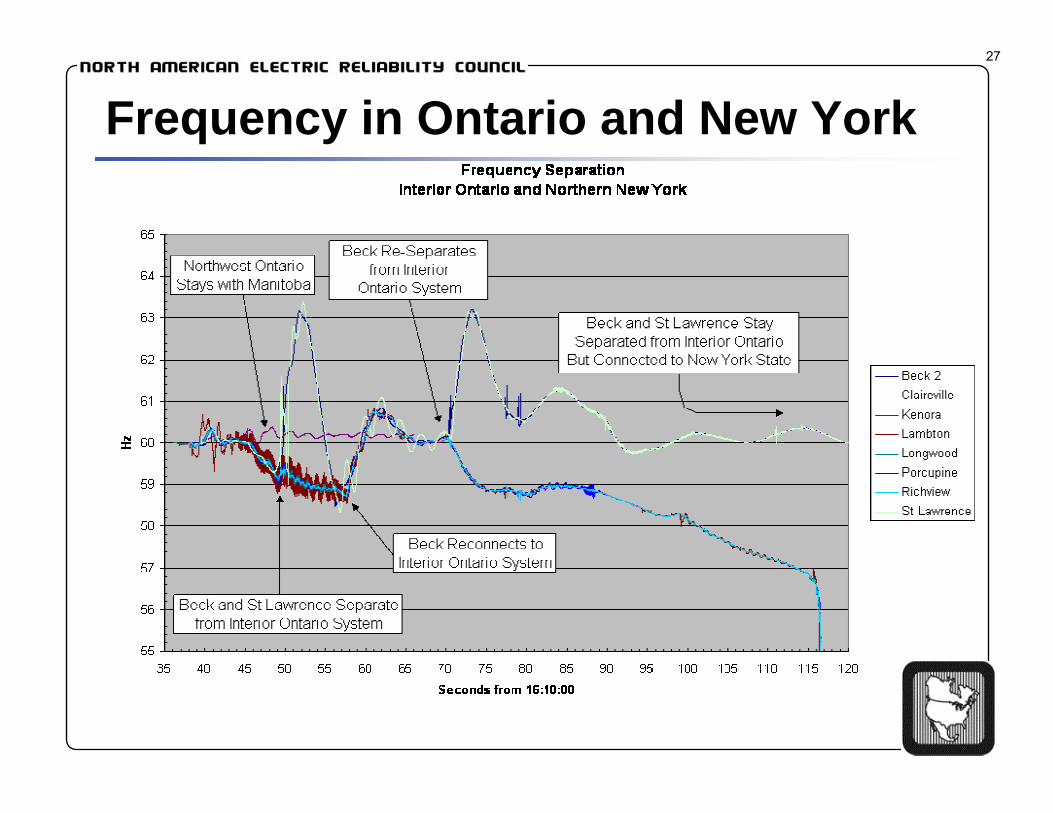
Frequency in Ontario and New York

28
Next Steps
● Implement strategic initiatives and recommendations
● Readiness audits● Enact reliability
legislation – mandatory standards and compliance enforcement


