Geogaphica Timisiensis, vol. 19, nr. 2, 2010 (pp. 139-154 ) ● IMPACTS AND CONSEQUENCES OF URBAN SHRINKAGE ON THE SOCIETY, INFRASTRUCTURE AND ENVIRONMENT FROM TIMISOARA Delia Ioana NADOLU, Daniel LUCHES Department of Sociology-Anthropology, Faculty of Sociology and Psychology, West University of Timisoara Abstract: Timisoara is nowadays the 2nd city of Romania, an important economical, social and cultural urban centre. Until 1990, the city had a relatively continuous growing, natural at the beginning of the 19th century, but artificially accelerated during the communist period. After the political change, the city has started a natural process of reconfiguration, similar with the national and euro-regional trends. The decline of the Timisoara’s population was almost constant during 1990-2008. The statistical fact is eloquent: during 2 decades, Timisoara has lost 14% of its population. This paper tries to identify the reasons and the premises of the city shrinking towards business and employment, social infrastructure and education, technical infrastructure. Rezumat: Impactul depopulării urbane asupra societăŃii, infrastructurii şi mediului în Timişoara. Timisoara este în present al doilea oraş din România, un important centru urban economic, social şi cultural. Până în 1990, oraşul a avut o creştere relativ constantă, într-o formă naturală la începului secolului XIX- lea dar şi într-o formă accelerată artificial în timpul perioadei comuniste. După schimbarea politică oraşul a cunoscut un process natural de reconfigurare, similar cu tendinŃele naŃionale şi euro-regionale. Descreşterea populaŃiei timişorene a fost aproape constantă în perioada 1990-2008. Datele statistice sunt elocvente: de-a lungul a 2 decade, Timişoara a pierdul 14% din populaŃia sa. Această lucrare urmăreşte să identifice motivele şi premisele depopulării urbane raportat la mediul de afaceri si ocuparea fortei de munca, infrastructura socială si educatie, infrastructura tehnica. Key words: urban shrinkage, employment rate and unemployment, technical infrastructure, social infrastructure and education Cuvinte cheie: depopulare urbana, ocupare si somaj, insfrastructura tehnica, infrastructura sociala si educatie 1. PATTERNS OF SEGREGATION AND SOCIAL COHESION Even if the shrinking process is a constant reality for the last almost 20 years, the city of Timisoara does not look to be seriously affected. On the basis of the previous analysis, the artificial urbanization that has directly affected the city during the communist period has accumulated a structural pressure that nowadays is practically regularized. We are talking about the persons that can now move away in any foreign country; about the persons from rural areas that were forced to live in the city and which are now unemployed; about the
Delia Ioana NADOLU, Daniel LUCHES Department of Sociology-Anthropology, Faculty of Sociology and Psychology,
West University of Timisoara
Abstract: Timisoara is nowadays the 2nd city of Romania, an important economical, social and cultural
urban centre. Until 1990, the city had a relatively continuous growing, natural at the beginning of the 19th
century, but artificially accelerated during the communist period. After the political change, the city has
started a natural process of reconfiguration, similar with the national and euro-regional trends. The decline of
the Timisoara’s population was almost constant during 1990-2008. The statistical fact is eloquent: during 2
decades, Timisoara has lost 14% of its population. This paper tries to identify the reasons and the premises of
the city shrinking towards business and employment, social infrastructure and education, technical
infrastructure.
Rezumat: Impactul depopulării urbane asupra societăŃii, infrastructurii şi mediului în
Timişoara. Timisoara este în present al doilea oraş din România, un important centru urban economic, social şi
cultural. Până în 1990, oraşul a avut o creştere relativ constantă, într-o formă naturală la începului secolului XIX-
lea dar şi într-o formă accelerată artificial în timpul perioadei comuniste. După schimbarea politică oraşul a
cunoscut un process natural de reconfigurare, similar cu tendinŃele naŃionale şi euro-regionale. Descreşterea
populaŃiei timişorene a fost aproape constantă în perioada 1990-2008. Datele statistice sunt elocvente: de-a
lungul a 2 decade, Timişoara a pierdul 14% din populaŃia sa. Această lucrare urmăreşte să identifice motivele
şi premisele depopulării urbane raportat la mediul de afaceri si ocuparea fortei de munca, infrastructura socială
si educatie, infrastructura tehnica.
Key words: urban shrinkage, employment rate and unemployment, technical infrastructure, social infrastructure and education Cuvinte cheie: depopulare urbana, ocupare si somaj, insfrastructura tehnica, infrastructura sociala si educatie
1. PATTERNS OF SEGREGATION AND SOCIAL COHESION
Even if the shrinking process is a constant reality for the last almost 20 years, the city
of Timisoara does not look to be seriously affected. On the basis of the previous analysis,
the artificial urbanization that has directly affected the city during the communist period has
accumulated a structural pressure that nowadays is practically regularized. We are talking
about the persons that can now move away in any foreign country; about the persons from
rural areas that were forced to live in the city and which are now unemployed; about the
● Impact and Consequences of Urban Shrinkage on the Society
140
families that can now adopt any measures of family planning; about the persons that were
forced to inhabit in uncomfortable block-flats and which have the possibility nowadays to
Figure 1 Distribution of population density in Timisoara DistribuŃia densităŃii populaŃiei în Timişoara
build a house on ground, even not quite in Timisoara but close enough (until 20 km). All
these factors have direct influences upon the distribution of the population density across
the city. A very professional representation (elaborated by an architectural project) looks
like1:
Thus, it can be observed a quasi-eclectic distribution, the quarters with high density
(concrete block-flats) been quite mixed with other quarters with low density (historical
houses). Generally talking, Timisoara keeps the concentric profile, with 2 or 3 waves of
modern construction around the city core but with interactions with former villages integrated
as historical neighbourhoods. Some industrial facilities that are not working any more
represent a very valuable land close to centre that can be reused in other ways (as residential
projects or company buildings etc.). The city trend to extend its influence on the surrounds
(under the perspective of the future metropolitan area) and on new and very consistent
residential neighbourhoods are developed in all the closest villages.
2. BUSINESS AND EMPLOYMENT
The evolution of Timisoara’s business area is indirectly reflected by a series of
indicators that will be summarily presented forward:
1 Daniel Tellman, Arch. (2009), Distribution of population density in Timisoara, from the project *** “Studiul director privind facilităŃile sportive şi de agreement în Timişoara” [Director Study about the Sport and Leisure Facilities in Timisoara] elaborated by the Plancontrol Company and Politechnic University for the Timisoara City Hall, available at http://blog.plancontrol.ro/2009/10/01/studiu-director-privind-facilitatile-sportive-si-de-agrement-din-timisoara/ or at http://commons.wikimedia.org/wiki/File:Densitatea_Populatiei_Timisoara_09.jpg, last accesed 20 March 2010
Delia Ioana NADOLU, Daniel LUCHES ●
141
2.1 Employees The 1990s have been characterized by reorganizations and even by the dissolution
of some companies which existed at that time, with direct consequence on the decreasing of
the number of employed people in Timisoara. Starting with 2000 the local business area
records a slight increase reflected by the new employment opportunities for the existing
working force. Therefore, the number of unemployed people in Timisoara starts to decrease
until a minimal point of 1.6% in 2006 and 2007. With the economical recession this
indicator has growing back to around 4% (in 2009).
EvoluŃia numărului de angajaŃi
Figure 3 The evolution of the employment sector EvoluŃia angajaŃilor pe sectoare
The number of employed people per fields of activity also reflects the local business
area’s dynamic. Therefore we can observe that during the analyzed interval some fields of
activity were affected by a decrease of the number of employees while other fields enjoy a
constant increase in their number of employees. The regression, with the biggest impact on
the number of employed people in Timisoara, can be found within the industrial activities
area which has constantly recorded decline concerning the number of employees, reaching
by the end of the 90’ almost half of the working force volume specific during 1991.
In the last five years the local public transportation provider has registered a
constant extent of the lines length, the number of passengers has increased and also the
number of kilometres per year shows a positive trend.
The extend of the lines length
(in km)10,181
10,218
9,9249,837
9,263
9,867
1,000
2,000
3,000
4,000
5,000
6,000
7,000
8,000
9,000
10,000
11,000
12,000
2004
2006
2008
Thousands
Number of passengers105,5
5493,21
686,21
778,15
077,86
396,61
8
10,000
20,000
30,000
40,000
50,000
60,000
70,000
80,000
90,000
100,000
110,000
120,000
2004
2006
2008
Thousands
5.2 The heating system
Figure 14 The evolution of the routes length
EvoluŃia lungimii liniilor
Figure 15 The evolution of number of trams, trolleys and buses
EvoluŃia numărului de tramvaie, treleibuze şi autobuze
Figure 16 The extension of the lines length
Extinderea lungimii liniilor
Figure 17 The evolution of number of passengers’
EvoluŃia numărului de pasageri
Delia Ioana NADOLU, Daniel LUCHES ●
149
Timisoara is one of the few large cities in Romania where the centralized public
heating system is still functional, despite the decrease in the number of users of this service.
Over the past 10 years at the local level, due to relatively high costs and especially the need to
improve thermal comfort, some buildings have opted for separate heating systems. The most
popular and commonly used heating systems are the private gas-fired central heating.
Figure 18 The evolution of thermo energy and Hot water EvoluŃia energiei calorice şi a apei calde
Previous figure shows the descending trend of centralized public heating system,
reflected both in terms of heat supplied to the population and hot water distributed to users.
The future trend is likely to decline more consistently, generated mainly by eliminating the
present subsidies offered by the municipality for these utilities. For this reason, the final
price will increase at least with 50% and possibly many users will renounce of these
services in favour of an alternative heating system.
5.3 Water supply system and sewerage networks
The water supply and sewerage services are currently provided by the regional operator
AQUATIM, which in recent years has extent constantly to other localities, namely counties of
Romania. Timisoara's water supply is made from two separate sources: surface and depth. The
processing of the drinkable water is achieved through three waterworks. More than two thirds of the
water, which are distributed to consumers, comes from the Bega Water Treatment Station and the
rest of the city's drinking water requirement is provided from underground sources through Ronat
Water Treatment Station and Urseni Water Treatment Station (data from Annual Report of
AQUATIM, 2009). Along with the mentioned sources of water, in recent years many wells were
drilled in public area and offered in every district of the city, their number reaching to 100 in 2009.
Water distribution network has a total length of 616.5 km (in 2007) and wastewater collection
network reaches 489 km (in 2007).
0100200300400500600700800
1990
1992
1994
1996
1998
2000
2002
2004
2006
Water mains system sewerage networks
Figure 19 The evolution of the Water mains system and the Sewerage networks
790957 971 892 822
5.841 5.700 5.4825.098 4.904
01.0002.0003.0004.0005.0006.0007.0008.000
2004 2005 2006 2007 2008
Thousands
thermic energy delivered to the population hot water (in m3)
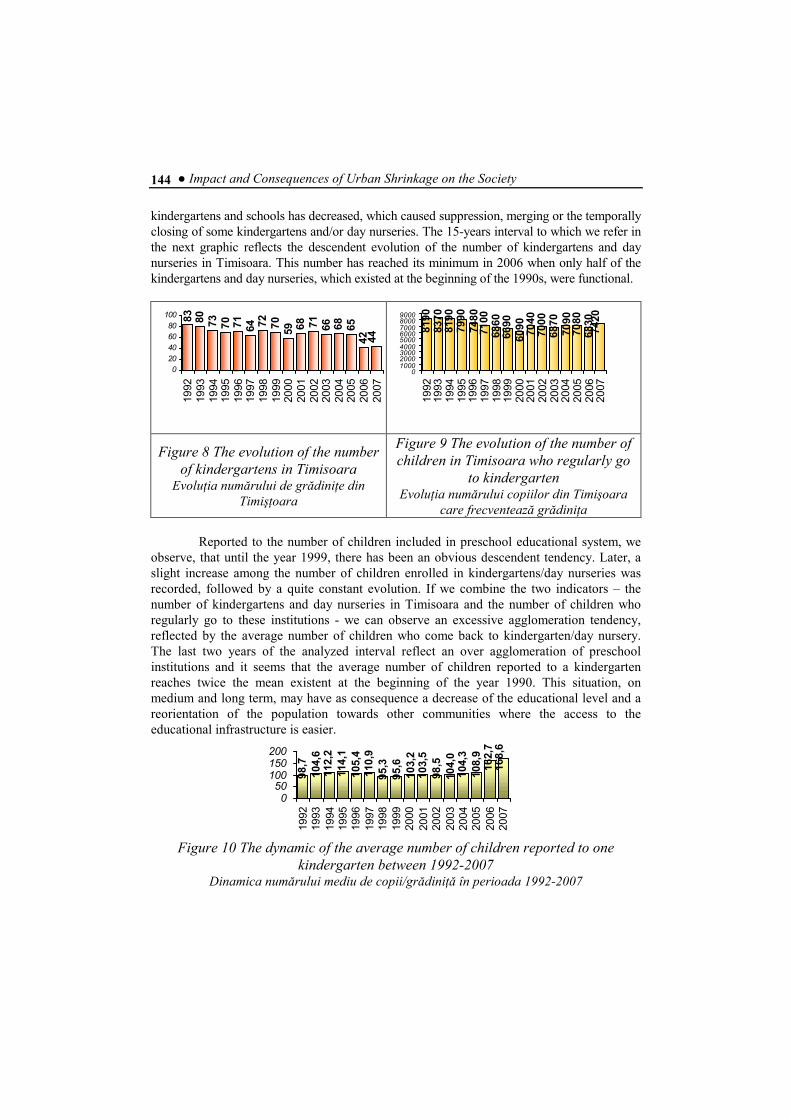
● Impact and Consequences of Urban Shrinkage on the Society
150
Wastewater and the rain water is collected by the gravitational fall, than is passed to
the wastewater unit system and is processed by Sewage Treatment Station of the city (built
in 1912, and are constantly subjected for process of modernization).
Water demand for the period 2000 - 2009 shows major changes, reaching in 2009 almost
half of the average consumption of year 2000. (This observation is based only on the water
distribution network not including the use of public and individual wells drilled. Also the
decrease in the consumption average is a result of the network improvement and
modernisation, which decreases the water loss in the network).
44.53
187.159
45.62546.7247.085
89.06
66.43
51.83 49.275 48.18 47.45
174.71167.271163.092167.433169.998
0
100
200
2000 2001 2002 2003 2004 2005 2006 2007 2008 2009
Thousands water demand (L/person/day) Wastewater (L/person/day)
Figure 20 The evolution of water demand and Wastewater (L/person/day)
EvoluŃia cererii de apă
6. LAND USE AND ENVIRONMENTAL QUALITY
Physical geography and geology:
Timisoara is located in the south-eastern Pannonian Plain, in the area of the rivers Timis and Bega ramble. Timisoara highest rate is in the northeast, the neighbourhood "Între Vii" at the 95 m and the lowest point is to 84 m in the west district Mehala (RonaO). Administrative territory of the city landscape and suburban municipalities include the following main units: High Plain Living Giarmata Vii – DumbrăviŃa, Low Plain of Torontal and Alluvial Plain of Bega.
In terms of tectonic, Timisoara is located in an area with east-west oriented strike fault,
marked by the existence of ŞanoviŃa extinct volcano.
Seismological studies show that seismic lines Periam-VariaQ-Vinga intersect the
northwest of Timisoara and Radna-ParQa-Şag the southeast of the town. Timisoara is a very
Figure 21 Timisoara, Union Square Timişoara – PiaŃa Unirii
Delia Ioana NADOLU, Daniel LUCHES ●
151
active seismic centre, but from the numerous earthquakes observed, only few have exceeded the
magnitude 6 on the Richter scale2. As a result of the petro-graphic composition of surface
formations, on the territory of Timisoara appeared the compaction clay-sandy substrate
phenomenon. This is highlighted in Elisabetin and Cetate districts, and also elsewhere where they
formed cravers.
Waters: Bega River has its spring in Poiana Ruscă Mountains (Padeş peak at 1150 m altitude).
Bega canal was built between 1728 and 1760 and includes the distance from Timisoara to the
point of Begas watering, over a length of 115 km. The Bega canal was projected for navigation,
access barges of 600-700 tonnes and an annual transportation capacity of 3,000,000 trucks.
Timisoara has many natural lakes, formed in adjacent areas to city (near Kuncz district, near
village Giroc, Snakes Lake in the Green Forest) and lakes of anthropogenic origin (Fratelia,
Freidorf, MoşniQa, Mehala, Youth Strand), notable by their location on line contact with
suburban towns.
Timisoara's groundwater is quite close to surface, with a depth between 0.5 - 4 meters.
Ground water layers increase the depth from north to south, from 4 m to 80 m deep and contain
drinking water, thus providing some urban consumption requirements. Timisoara has also deep
water, captured in Union Square (hypothermal), south of Cetate and district Fabric (mesothermal)
with therapeutic value, used for the spa3. Thermo-mineral waters are used for cure and recreation
resort in Timisoara by supplying the Hospital of Physiotherapeutic spa and two sports facilities with
swimming pools.
Green Areas: A key role in achieving an ecological balance of the surroundings, is the
harmonization of relations between built and open spaces and planted area of the city and
surrounding territory. In the ecological functionality and equilibrium, the green areas have
the ability to retain precipitation, reduce and purify water leaks, fix soil, retain alluvial
materials, regulate temperature and air humidity. Green space in the public domain in
Timisoara is represented by parks, squares and street alignments and comprises a total of
168,500 trees4.
According to the National Institute of Statistics, at 31.12.2006, the total area of green
spaces in Timisoara was 502 ha, consisting of: Parks 87.59 ha; Squares 12.97 ha; Alignments in
neighbourhoods 328.58 ha; Forest curtain 22.00 ha; Green Forest area 50.70 ha.In 2006 green
space was 15.9 square meters per inhabitant, respectively 0.5 trees per capita. The Government
Emergency Ordinance no.114/17.10.2007 foresees that in 2010 the green space should be 20
square meters per inhabitant, which will correspond to 630 ha, and in 2013 the area of green
spaces have to reach 26 mp per capita. It results that, in 2013, the total area of green space will
2 in Local Environmental Action Plan – Timis County, adopted by the Environmental Protection Agency Timis in 2008, http://www.apmtm.ro/index.htm 3 Local Environmental Action Plan – Timis County, adopted by the Environmental Protection Agency Timis in 2008, http://www.apmtm.ro/index.htm 4 Anexa „Timişoara Ecologică” la HCL 201/22.04.2008, p. 16 // „Ecological Timisoara” - Annex of City Hall Ordinance no. 201/22.04.2008, p. 16
● Impact and Consequences of Urban Shrinkage on the Society
152
increase to 819 hectares in the city of Timisoara. This law was one of the arguments that led to the
establishment in 2007 of a specialized structure on environmental issues in Timisoara:
"Environment Office" in the City Hall of Timisoara (by HCL no. 124/2007)
Environment:
The Government Emergency Ordinance no. 195/2005 on environmental
protection, approved by Law no. 265/2006 stipulates in Article 90 that the local government
have tasks and responsibilities for the conservation and protection of urban green spaces,
surveillance operators subordinated to prevent the accidental removal of pollutants or
uncontrolled waste deposits reusable, provide sanitation localities, maintenance,
management markets, public parks and green spaces, promoting a proper attitude about the
importance of environmental protection and has the responsibility to have staff for
environmental protection5. In the Timis County, specialized operators accredited by local
councils carry out municipal waste management. In Timisoara, the problem of municipal
waste is under basic changes for achievement of the environmental protections standards.
In December 2005, it was initiated a dual collection system involving the
distribution out free recyclable waste bins/bags of 240 l (in areas of buildings) or low-
density polyethylene bags of 140 l (in areas of homes), mark properly with collection
instructions. In Timisoara collection is performed on two fractions: recyclable waste (paper
/ cardboard, plastic, aluminium dose, PET) and household garbage. Currently dual-
collection system is being implemented in the whole city and growing in line with the
waiver of collection system by battery container as it was found that dual-collection system
is more efficient. Hazardous waste is given the highest possible impact on human health and
the environment. In Timisoara and in the region this type of waste does not represent a high
risk: in the Timis County in 2006, approximately 4% were hazardous waste.
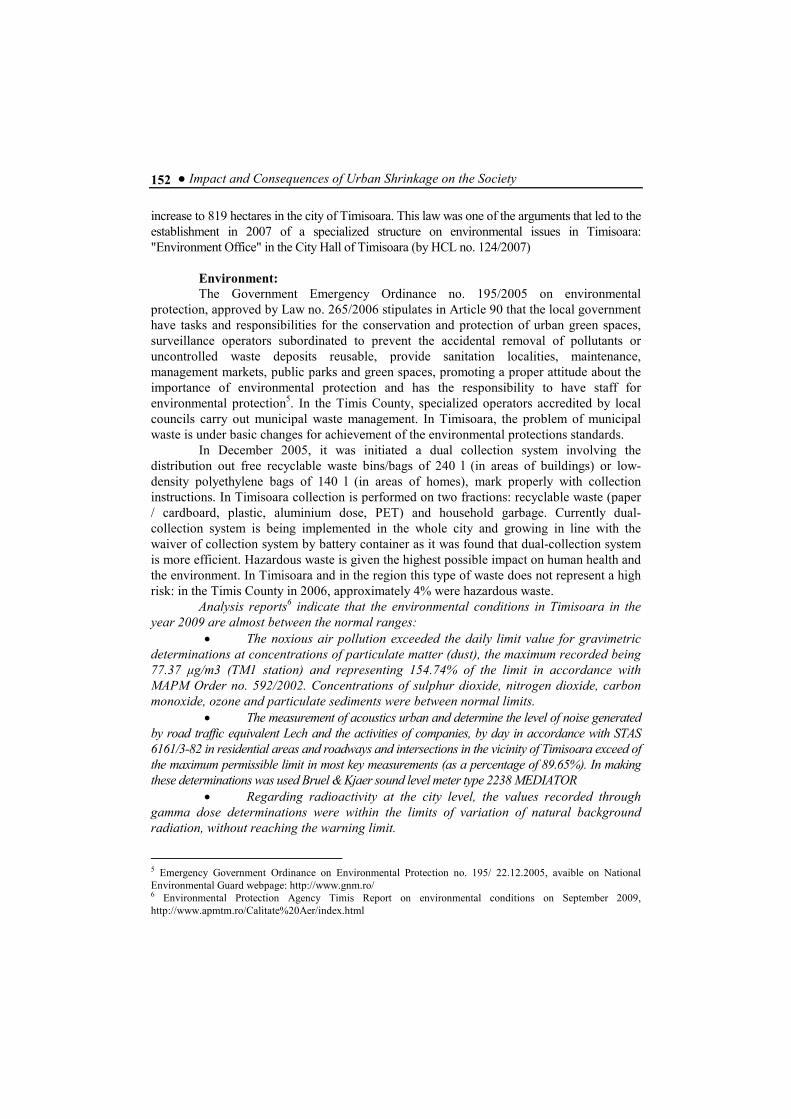
Analysis reports6 indicate that the environmental conditions in Timisoara in the year 2009 are almost between the normal ranges:
• The noxious air pollution exceeded the daily limit value for gravimetric determinations at concentrations of particulate matter (dust), the maximum recorded being 77.37 µg/m3 (TM1 station) and representing 154.74% of the limit in accordance with MAPM Order no. 592/2002. Concentrations of sulphur dioxide, nitrogen dioxide, carbon monoxide, ozone and particulate sediments were between normal limits.
• The measurement of acoustics urban and determine the level of noise generated by road traffic equivalent Lech and the activities of companies, by day in accordance with STAS 6161/3-82 in residential areas and roadways and intersections in the vicinity of Timisoara exceed of the maximum permissible limit in most key measurements (as a percentage of 89.65%). In making these determinations was used Bruel & Kjaer sound level meter type 2238 MEDIATOR
• Regarding radioactivity at the city level, the values recorded through gamma dose determinations were within the limits of variation of natural background radiation, without reaching the warning limit.
5 Emergency Government Ordinance on Environmental Protection no. 195/ 22.12.2005, avaible on National
Environmental Guard webpage: http://www.gnm.ro/ 6 Environmental Protection Agency Timis Report on environmental conditions on September 2009,
http://www.apmtm.ro/Calitate%20Aer/index.html
Delia Ioana NADOLU, Daniel LUCHES ●
153
Aknowledgement
This article is based on the partial result of the project FP7 no.225193 ShrinkSmart – The
Governance of the Shrinkage into the European Context, financed by European Commission. West
University of Timisoara is partner into the consortium of this project (http://www.shrinksmart.ufz.de/).
REFERENCES Ciuhandu, Ghe., (2005), Raportul de activitate al primarului 2005 [The mayor’s report of activity
2005] Timisoara City Hall, electronic versions available at
http://www.primariatm.ro/index.php?meniuId=1&viewCat=634, last accessed 4 February
2010
Ciuhandu, Ghe., (2006), Raportul de activitate al primarului 2006 [The mayor’s report of activity
2006] Timisoara City Hall, electronic versions available at
http://www.primariatm.ro/index.php?meniuId=1&viewCat=956, last accessed 5 February
2010
Ciuhandu, Ghe., (2007), Raportul de activitate al primarului 2007 [The mayor’s report of activity 2007]
Timisoara City Hall, electronic versions available at
http://www.primariatm.ro/index.php?meniuId=1&viewCat=1204, last accessed 5 February 2010
Ciuhandu, Ghe., (2008), Raportul de activitate al primarului 2008 [The mayor’s report of activity 2008]
Timisoara City Hall, electronic versions available at
http://www.primariatm.ro/index.php?meniuId=1&viewCat=1671, last accessed 8 February 2010
Ciuhandu, Ghe., (2009), Raportul de activitate al primarului 2009 [The mayor’s report of activity 2009]
Timisoara City Hall, electronic versions available at
http://www.primariatm.ro/index.php?meniuId=1&viewCat=2055, last accessed 8 February 2010
Davidson, K., (2004), Property fragmentation. Redistribution of land and housing during the Romanian democratisation process. Upsala Unviersitet. Geografiska Regionstudier, nr. 60, 78 pp.
Park, R., Burgess E. W., McKenzie, R. D., (1925), The City, University of Chicago Press Chicago
Sandu, D., (1977), Studiu asupra migraŃiei forŃei de muncă din agricultură (Research about the migration of the working force from agriculture), in Caiet de studii nr. 64, vol. V, Institutul de Economie
Agrară, Bucuresti
*** Raportul anual 2005 [Annual reports 2005], Regia autonomă de apă şi canal Aquatim Timişoara,