66
PSI Bericht Nr. 96-05 Comprehensive Assessment of Energy Systems (GaBE) / Air Pollution Impacts of Air Pollutants on Ecosystems : A Review Sebnem Andreani-Aksoyoglu

PSI Bericht Nr. 96-05
Comprehensive Assessment of Energy Systems (GaBE) / Air Pollution
Impacts of Air Pollutants on Ecosystems : A Review
Sebnem Andreani-Aksoyoglu

Abstract ........................................................................................................................ 1 1 Introduction ............................................................................................................. 2 2 Air Pollutants ......................................................................................................... 6 3 Deposition of air pollutants ............................................................................. 9 4 Damages of air pollutants on vegetation ................................................ 14 4.1 Uptake and chemical reactions of pollutants .................................... 14 4.2 Plant damages caused by pollutants ...................................................... 16 4.2 .1 Acute damages ............................................................................................. 18
Sulfur dioxide ............................................................................................... 18 Fluorides ........................................................................................................ 19 Nitrogen oxides ........................................................................................... 19 Ozone ................................................................................................................ 20 Peroxyacetyl nitrate (PAN) .................................................................... 20 Minor pollutants ......................................................................................... 21
4.2.2 Chronic damages ......................................................................................... 21 Sulfur dioxide ............................................................................................... 21 Fluorides ........................................................................................................ 22 Photochemical oxidants and nitrogen oxides ................................. 22
4.2.3 Invisible damages ....................................................................................... 22 4.3 Response of agricultural plants to air pollution ............................. 23 4.4 Response of forests to air pollution ..................................................... 29 5 Health effects of air pollution .................................................................... 30 6 Material effects of air pollution ................................................................ 33 7 Critical levels and loads ................................................................................ 36 7.1 Critical loads ................................................................................................... 37 7 .1 .1 Critical loads for acid deposition ....................................................... 37
Forest soi Is .................................................................................................... 37 Groundwater ................................................................................................. 39 Surface water .............................................................................................. 40
7.1.2 Critical loads for nitrogen deposition .............................................. 42 Forest ecosystems ..................................................................................... 42 Groundwater ................................................................................................. 47 Surface water .............................................................................................. 47
7.2 Critical levels ................................................................................................. 49 7.2.1 Sulfur dioxide ............................................................................................... 49 7 .2.2 Ozone ................................................................................................................ 50 7.2.3 Nitrogen oxides ............................................................................................ 52 8 Summary and conclusion ................................................................................. 53 Acknowledgements ................................................................................................ 55 References ................................................................................................................ 56 Glossary ..................................................................................................................... 64

1
Abstract
Air pollution is changing ecosystems especially in Europe and North America. Such
changes result from acid deposition, photo-oxidants, and nitrogen accumulation, leading
to serious deterioration of terrestrial and aquatic ecosystems. Political decisions
concerning air pollution control strategies require scientific studies of critical levels and
loads above which pollutant concentrations and deposition may cause adverse
environmental effects. In the frame of the project "Ganzheitliche Betrachtung von
Energiesystemen (GaBE)", the sub-project "Air pollution" is dealing with the
composition of the air in the lower troposphere affected by the anthropogenic emissions
from various energy systems and with the impacts of air pollutants on the ecosystems.
The consequences of emission scenarios resulting from the energy systems of interest
will be simulated using three-dimensional chemical dispersion models and the
concentrations and depositions of the pollutants under the prevailing conditions will be
calculated. In order to be able to interpret these values in terms of damage for the
environment, data concerning the critical levels and loads for the relevant air pollutants
were compiled and the possible impacts of the pollutants on the ecosystems such as
vegetation, soils, groundwaters and surface waters in Switzerland, as well as on human
health and materials were reviewed and reported.

2
1 Introduction
An atmosphere of consistent and natural composition termed as "clean air", is one of the
basic requirements of the undisturbed development of ecosystems. Clean air can still be
found in remote areas far from human civilization and contains 78.1 vol. % nitrogen
(N 2), 20.9 vol. % oxygen (02), 0.94 vol. % inert gases (Ar, Kr, Ne, He, Xe), 0.03 vol.
% carbon dioxide (CO2), and some trace amounts of carbon monoxide (CO), hydrogen
(H2), ozone (03), methane (CH4), nitrogen oxides (NO, NO2) and ammonia (NH3).
These trace gases either come from higher atmospheric layers or result from
decomposition processes or from the weather factors. Their concentrations are below
I0-4 vol. % (Isidorov, 1990).
Increasing industrialization, densely populated areas as well as increasing traffic lead to
air pollution from gases and dusts in the atmosphere and thus affect the biosphere,
human health, and materials. It is now known that air pollution is changing ecosystems
especially in Europe and North America. These changes are the consequences of acid
depositions, photo-oxidants and nitrogen accumulations and they may cause severe
decline in ecosystems. The nature, severity and rate of environmental deterioration vary
from area to area as a function of pollution, climate and ecosystem sensitivity.
Air pollutants are either emitted directly from the anthropogenic or biogenic emission
sources or they are formed in the atmosphere by chemical reactions of the emitted
species. The term "air pollutants" in this report, refers only to those substances which
come from anthropogenic sources such as power stations, factories, traffic, etc. The
species coming from the natural sources and causing air pollution directly or indirectly
(i.e. isoprene, monoterpenes, nitrogen oxides) are out of the scope of this study and
their contributions to the air pollution in Switzerland have been discussed elsewhere
(Andreani-Aksoyoglu and Keller, 1994, 1995, Keller et al., 1995, Andreani-Aksoyoglu
et al., 1995a,b).
Some of the air pollutants have lifetimes in the atmosphere long enough to be
transported away from the sources where they are emitted or formed. The pollutants
may be removed from the atmosphere in various ways and can affect a variety of
receptors, for example, humans, animals, aquatic ecosystems, vegetation and materials.
Several air pollutants damage directly the plant communities by being taken up usually
by their leaves through the stomata. Once absorbed, they can cause biochemical
transformations leading to decline of growth, productivity, vitality or quality of plants
(Dassler and Bortitz, 1988).

3
Another path is via acidification of soil, groundwater and surface waters mainly by
deposition of sulfur and nitrogen compounds. The major effects of acidification on
water chemistry are increased sulfate and nitrate concentrations, decreased pH and
alkalinity and increased aluminum concentrations. Leaching of exchangeable base
cations from the soil induces decreases in base cation concentrations in the soil solution
and increases in concentrations in groundwater and surface waters.
Apart from acidification, an excess input of nitrogen may also lead to eutrophication
which causes inhibitions of nutrient uptake for vegetation, decreased frost hardiness,
increased susceptibility to attacks by insects, viruses, bacteria and fungi, groundwater
pollution due to nitrate leaching, vegetation changes in oligotrophic surface waters.
Any political decision regarding air pollution control requires scientific evaluations of
the loadings and levels at which pollutant deposition and ambient concentrations exert
adverse environmental effects. In the last years, there has been some studies on this
topic, completed by several countries in Europe and North America (Nilsson and
Cowling, 1992, Fuhrer and Achermann, 1994). The Swiss project "Ganzheitliche
Betrachtung von Energiesystemen (GaBE) (Comprehensive Assessment of Energy
Systems) 11 deals with the asessment of energy systems in an integral manner. It
addresses health risks, environmental impacts and economic aspects associated with the
different energy sources and technologies such as fossil fuels, nuclear and renewables
(Hirschberg et al., 1994). One part of this project deals with the air pollutants released at
various stages of the full energy chain and their impacts on human beings, ecosystems
and materials. The scope is to establish a correlation between the emission rates of
possible species released into the atmosphere and the resulting concentration and load
pattern due to transport, dispersion, chemical conversion and deposition.
In the frame of the GaBE sub-project "Air Pollution", it is planned to simulate the
various emission scenarios resulting from the energy systems of interest and to calculate
the concentration and the deposition of the pollutants under particular prevailing
conditions. The correlations between the emission rates and the resulting concentrations
and load patterns due to transport, chemical conversion and deposition can be
established by means of the three dimensional chemical dispersion models. In order to
run such models, three dimensional concentration and wind fields as well as other
meteorological and chemical data and space and time dependent emission data are
required. An anthropogenic emission inventory relevant to the air pollutants in
Switzerland has already been prepared for being used in the model (Keller, report in
preparation). This inventory together with other input parameters will be used to

4
perform the simulations for the present emissions case. The calculated concentration
and deposition levels have to be interpreted in terms of damage for the environment by
comparing them with the critical values in order to estimate the environmental and
economical impacts of the emissions for the present case.
After the completion of the present case study, scenario calculations will be carried out
in which emissions will be modified according to the future energy systems and/or to
achieve certain criteria. Relative yield loss of some crop species due to changes in the
emissions/concentrations of the pollutants will be calculated using the exposure
response functions.
The purpose of this report is to compile data concerning the critical levels and loads for
the relevant air pollutants and to review the possible impacts of these pollutants on
ecosystems such as soils, groundwater, surface waters, and vegetation in Switzerland.
Some data concerning the health impacts and damages to materials are also included as
additional information although they are not primarily in the scope of this study.
The second chapter of this report is an executive summary of the air pollutants. It
describes the types of air pollutants, their sources and characteristics and evaluates the
most important air pollutants in Switzerland.
Deposition of the pollutants on the vegetation, soil, and surf ace waters is the topic of the
third chapter. Removal of pollutants from the air by dry and wet deposition, factors
affecting these processes are dealt with in this part of the report. Impacts of dry/wet
deposition on the soil, vegetation and surface waters are discussed.
Damages caused by the air pollutants on the vegetation are evaluated in the fourth
chapter. The uptake processes of pollutants by plants, the chemical reactions of
pollutants in the plant metabolism and consequent damages are discussed. The damage
symptoms for various pollutants and sensitivity of trees and plant species to these
pollutants are evaluated in this chapter. Ozone exposure-response functions for various
crop species are listed to be used in the future calculations of yield losses.
In chapter 5, the health effects of air pollutants were discussed briefly. The air quality
guidelines issued by the World Health Organization and some selected countries, to
prevent all adverse effects on human health from air pollution exposure, are
summarized for various types of air pollutants.
Chapter 6 deals with the effects of air pollutants on materials. The effects of acid
deposition on atmospheric corrosion of materials are discussed in this chapter. This part

5
provides a brief review of knowledge about the effects of pollutants on various
materials, including metals, stones and plastics.
Chapter 7 describes the critical loads/levels concept. This part contains the evaluation of
existing methods of critical loads/levels calculations and receptor-oriented thresholds
issued by UN-ECE Convention on Long-Range Transboundary Air Pollution.
Chapter 8 gives a summary of the present report.

6
2 Air Pollutants
The high air pollution episodes happen during stagnant weather conditions both in
summer and in winter, though the pollutants of primary concern during winter and
summer usually differ. In winter, episodes may occur when pollutants generated by the
burning of fossil fuel accumulate in the atmosphere. The pollutants of primary interest
are sulfur dioxide and suspended particulate matter. In summer, episodes may occur
during warm, sunny weather due to photochemical reactions of nitrogen oxides and
hydrocarbons in the atmosphere which lead to the formation of photooxidants.
Air pollution started to be recognized in the 13th century when coal began to replace
wood for use in domestic heating and handicraft. The London smog in 1952 which
caused about 4000 fatalities was the most dramatic pollution event recorded to date in
terms of health effects and it was characterized by high sulfur dioxide and particle
concentrations in the presence of fog.
A new type of air pollution which caused injury to certain vegetable crops grown in
California was reported in 1950 (Middleton et al., 1950). It was soon established that
the new type of air pollution - later called "photochemical air pollution" - was caused by
the reactions of organics and oxides of nitrogen in air in the presence of sunlight
(Finlayson-Pitts and Pitts, 1986).
Air pollution system starts with various sources of anthropogenic and natural emissions.
These are defined as primary pollutants since they are emitted directly into the air from
their sources; they include, for example, SO2, NOx (NO+ NO2), CO, Pb, organics, and
particulate matter. Once in the atmosphere, they are subjected to dispersion and
transport caused by the meteorological conditions, and simultaneously to chemical and
physical transformations into gaseous and particulate secondary pollutants, defined as
those formed from reactions of the primary pollutants in air (Finlayson-Pitts and Pitts,
1986). Some pollutants can be both primary and secondary (e.g. NOx)-
On a global scale, natural emissions often outweigh those from human activities
whereas in developed countries, most of the air pollution comes from the anthropogenic
sources (Isidorov, 1990). Anthropogenic emissions originate mainly from the fossil fuel
combustion, industrial processes and biomass burning. The sources of natural emissions
are vegetation and oceans for emissions of volatile organic compounds, and lightning,
soils, and ammonia oxidation for NOx emissions. Air pollutants coming from natural
sources are out of the scope of this report, and only anthropogenic pollutants will be

7
referred to as pollutants here. The most important gaseous air pollutants and their
emission sources and characteristics are summarized in Table 1. A detailed description
of sources and sinks for the air pollutants is given elsewhere (Keller and Andreani
Aksoyoglu, 1994).
Air pollutants are not always necessarily in gaseous form. Chemical reactions in clouds
occur in the aqueous phase as well as in the gas phase. Clouds and fogs consist of small
water drops imbedded in air. Solutes in the aqueous phase derive from aerosol particles
incorporated during the process of droplet formation and from the dissolution of gases
present in the surrounding air. For example, atmospheric S02, H202, and 03 can trigger
aqueous-phase reactions within cloud, fog and rainwater and these reactions convert
significant quantities of S from the +IV state to the+ VI state, they can also be a sink for
tropospheric ozone (Chameides and Stelson, 1992).
The fate of the primary pollutants after being emitted into the atmosphere, is determined
by the meteorology and chemical transformations simultaneously. The lifetimes of the
pollutants depend on the rate constants of their reactions with particular species. They
are either transformed to secondary pollutants and undergo other reactions or they may
be removed at the earth's surface via wet or dry deposition and can impact a variety of
receptors, for example, humans, animals, aquatic ecosystems, vegetation, and materials.
Air pollutant concentrations in Switzerland are measured systematically by the Swiss
national monitoring network (NABEL) at 16 ground-based stations. There are also
some data about the vertical distribution of the species in the troposphere. The typical
daily and monthly concentrations and the evolution of annual averages of air pollutants
in Switzerland are given in Bi.irki and Keller (1994).
The most important air pollutants in Switzerland are ozone and nitrogen oxides in
summer due to photochemical reactions. Sulfur dioxide concentrations are continuously
decreasing due to improved quality of the fossil fuels. The only critical area for sulfur
dioxide in Switzerland is the southern part which is affected by the agglomeration area
in the Po Valley. The carbon monoxide levels decreased in the last years as well. The
measurements taken with aircrafts and at the ground-based stations in the years between
1991 and 1993 during the Swiss photo-oxidant study POLLU:tvfET (POLLUtion and
METeorology) indicated that ozone concentrations were high over the densely
populated and industrialized Swiss Plateau (Oommen et al., 1995). However, ozone and
nitrogen dioxide concentrations were considerably higher and the concentration
gradients were more pronounced in the south of the Alps than in the north (Prevot,
1994).

8
Table 1 The most important gaseous air pollutants (after Dassler and Bortitz, 1988)
pollutant sources characteristics
heating systems operated respiratory and assimilation sulfur dioxide ( S 02) with lignite, coal, fuel oil, poison, effect on vegetation
chemical factories, etc. up to about 30 km.
sulfur trioxide (SO3) sulfuric acid factories, oil burns damage, short heating distance damage, combined
with SO2
gas production, sulfate hydrogen sulfide (H2S) cellulose industry, viscose cell and enzyme poison
rayon industry, coking plants, mineral oil refineries
factories producing fluoride hydrogen fluoride (HF), chemicals,phosphate toxic effects even at low
silicon tetrafluoride (SiF 4) fertilizer plants, aluminum amounts, tendency to smelters,glass etching aerosol formation, short-works, enamel works, distance effect (1-5 km) brickworks, ceramics industry, lignite and coal consumers
power stations, chemical formation of oxidants (03, nitrogen oxides (NOx) industry, nitric acid PAN) by photochemical
production, exhaust gases secondary reactions of motor cars
ozone (03), PAN and other formed in the lower air damages on human health photooxidants layers under particular and vegetation
meteorological conditions
lead (Pb) compounds, in densely populated areas hydrocarbons, carbon motor cars and near busy roads monoxide (CO), nitrogen oxides (NOx)
hydrogen chloride (HCl), chlorine electrolysis, mostly short-distance chlorine (Cl2) galvanizing plants, potash damage
industry, PVC refuse combustion
ammonia (NH3) animal farming, fertilizer short-distance damage works
ethylene (C2H4) chemical industry, exhaust detectable near the busy gases of motor cars roads and city centers,
prevent vegetation growth

9
3 Deposition of air pollutants
Atmospheric pollutants can be removed by the earth's surface in two ways, classified as
dry deposition or wet deposition, depending on the phase in which pollutant strikes the
earth's surface and is taken up. On the one hand, pollutants in the form of either gases or
small particles can be transported to ground level and directly adsorbed and/or absorbed
by materials there; this process is called dry deposition. The term dry deposition refers
to the mechanism of transport to the surface, not to the nature of the surface itself. Dry
deposition is characterized by a deposition velocity which is defined as the flux of the
species to the surface divided by the concentration at some reference height. Deposition
velocity is related to the surface resistance which depends on the affinity of the surface
for the species and to the gas-phase resistance which depends on the micrometeorology
governing the transport of the gas to the surface. Some of the deposition velocities
found in the literature, measured on different surfaces for various pollutants are shown
in Tables 2-4. On the other hand, pollutants may be dissolved in clouds, fog, rain, or
snow. When these water droplets reach the earth's surface including soil, grass, trees,
buildings, etc., the process is termed wet deposition. Because of the highly variable
nature of precipitation events, estimating wet deposition of pollutants quantitatively is
difficult. In addition to meteorological factors, the solubility of the pollutant in ice,
snow, and rain and its variation with temperature and pH as well as the size and the
number of the water droplets must be considered.
The deposition of air pollutants affects the plants directly or via soil by changing the pH
and trace element content of soil, by growth retardation in roots and plants, and by
uptake of toxic substances. Apart from the effects on vegetation, deposition causes
serious problems via acidification in groundwater and surface waters as well (Kreiser et
al., 1993).
The atmospheric trace gases and particles which contribute to acidification of
ecosystems include the primary emitted pollutants SO2, HCl, NH3, NOx, the secondary
pollutant gases NO2, HNO3 and the SO42-, N~-, NI4+ and H+ ions in aerosols and
precipitation. The acidification of soil, groundwater and surface waters in large areas of
Europe and North America is mainly caused by deposition of sulfur and nitrogen
compounds (Fowler et al., 1992).
The principal risk of damage from acid deposition for agricultural crops is derived from
contact with above-ground plant tissues, rather than from changes in soil properties,
because most crop plants are grown on soils that are well buffered and amended with
fertilizer and lime. Field experiments involving applications of simulated acid rain to

10
crops indicate that little or no reduction in yield is likely for oats, potato and corn.
Results for wheat and soybean are scattered and difficult to interpret (Pell and Puente,
1987, Pell et al., 1987, Banwart et al., 1988, Evans et al., 1983, Porter et al., 1987).
Experiments also showed that the threshold for foliar injury and reductions in growth or
yield for many crop plants is below pH 3, but for some species under some conditions
injury can occur above this threshold.
Acid inputs are largely neutralized and buffered within the soil, primarily as a result of
weathering and cation exchange processes. In this way the soil's acid neutralizing
capacity decreases. In principle, this decrease can be brought about by the weathering of
silicate minerals alone without affecting the acid-base status of the soil so that the
acidification process does not lead to a decreased base saturation. However, in most
acidic forest soils the weathering rates of silicate minerals are too low to compensate for
elevated acid deposition.
It has been suggested that the widespread occurrence of forest die-back which is
generally associated with symptoms of severe magnesium deficiency is related to the
leaching of nutrient cations induced by acid deposition. However, some other
researchers believe that dissolved aluminum is a key factor because it may inhibit the
root uptake of mineral nutrients (Chadwick and Hutton, 1991).
The acidification due to NH3 or NH4+ deposition results from microbiological
nitrification of Nf4+ to N03-. The physical and biological fate of deposited N02, N03-,
NH3, and NH4+ is not fixed for each compound. Ammonia, for example, may be
washed by rain into soil after depositing on a leaf surface and then it may be nitrified in
the soil and leached as N03- from the soil. It can also be taken by plants directly as
Nf4+. This kind of complications mainly with deposited nitrogen compounds cause
considerable difficulty in quantifying the actual acidification resulting from known
deposition rates. In this report, the biological or chemical processing of deposited gases
or ions will be considered only at the initial sites of uptake.
Acidification of freshwaters caused by the deposition of sulfur and nitrogen was first
recognized in the soft water lakes of Scandinavia and eastern North America, but now
acidification of lakes and rivers has also been reported in central and eastern Europe and
in the UK (McCormick, 1989). The effects of acid deposition on surface water acidity
are related to the geology of bedrock, the buffering capacities and flow rates of the
water, lake sediment and catchment soils, other hydrological features and the level and
pattern of acid deposition. The most important effects of acidification of freshwaters are
the reduction and loss of populations, especially trout and salmon.

1 1
Chemical reactions which take place in the soil play an important role in the process of
acidification. About 90-95 % of the water entering a typical acidified lake drains from
the catchment, only a small proportion comes directly from the atmosphere. Several
buffering processes occur in soil depending on its composition and pH. At high pH
values (8.0-6.2) CaCO3 is the major buffering system (carbonate buffer range). When
this buffer is exhausted, pH decreases and buffering starts to take place by silicate
minerals (pH= 6.2 - 5.0). At lower pH values (5.0 - 4.2), the cation exchange capacity
of soil acts as pH buffering system (exchange buffer range). At pH values below 4.5, Al
in the soil react with H+ (aluminum buffer range). When Al hydroxides are exhausted,
iron hydroxides may start interacting with H+ (Fe buffer range). Deep calcareous soils
tend to have a high acid neutralizing capacity which maintains the soil at a relatively
high pH value.
The fish mortality in acidified lakes is related to the dissolved aluminum levels whose
toxicity to fish is pH dependent, highest being at pH 5 (Baker and Schofield, 1980).
Mobilization of metals from the soils by acidification may also cause damage to human
and animals, via drinking water. These metals are aluminum and heavy metals.
Aluminum is the most abundant metal in the earth1s crust and acidification mobilizes it
from the soils and lake sediments. Mercury, especially in the form of methyl mercury, is
very toxic. The other heavy metals of concern are lead and cadmium, which
contaminate the drinking water via corrosion of distribution materials rather than via
mobilization from the soil.
The acidified aquatic ecosystems have the potential for recovery which varies
considerably between different lakes. In the case of terrestrial ecosystems, especially
forests, recovery is slower, with a rate which is difficult to predict.
Apart from acidification, eutrophication may also be caused by the excess input of
nitrogen. This can cause a change in the ecosystem composition. New species with
higher tolerance to excess nitrogen will replace those ones which are sensitive to large
amounts of nitrogen. Deposition of high amounts of nitrogen compounds may also
cause an increase in the release of N2O to the atmosphere which is an effective
greenhouse gas.

12
Table 2 Dry deposition velocities for gaseous and particulate sulfur compounds (after
Davidson and Wu, 1990, Finlayson-Pitts and Pitts, 1986)
species deposition velocity (cm s-1) type of measurement
S02 0.04 - 3.4 gradient over grass
0.1 - 1.5 gradient over wheat, z < 2 ma
0.2 - 1.0 (day) Eddy correlation over Scots pine, z= 11 m
0.0 I - 0.2 (night)
< 0.09 chamber with spruce or pine
1.0 Eddy correlation over wheat
0.5 (summer) chamber with coniferous tree
0.1 (winter)
0.72 gradient over loblolly pine
0.008 chamber with soil and grass
0.11 chamber with grass
0.32 chamber with P. vulgaris
0.1 - 4.5 grass
0.1 - 1.0 pine forest
S042- < 0.4 gradient over grass, z=0.75, 1.5, 3, 6 rn
0.1 (winter) gradient over vegetation
0.7 - 1.5 (summer) throughfall in F agus silvatica canopy
0.3 - 0.9 (winter)
1.0 - 2.0 throughfall in Picea abies canopy
0.38 - 0.60 throughfall in Quercus prinus canopy
1.0 (night) gradient over wheat, z=5.5, 15.8 m
2.9 (day)
0.18 Eddy correlation over short mixed pasture
0.76 Eddy correlation over pine forest canopy
0.5 Eddy correlation over loblolly pine canopy
H2S 0.05 - 0.17 (summer) chamber with Pinus radiata
0.03 - 0.12 (winter)
0.2 chamber with P. vulf?aris
cos (3.1- 5.7)· 10-4 chamber with soil
0.14 chamber with P. vulgaris
CH3SH 0.06 chamber with P. vulf?aris
CS2 0.06 chamber with P. vulf?aris
a: z is the height above the surface

13
Table 3 Dry deposition velocities for gaseous and particulate nitrogen species (after
Davidson and Wu, 1990, Finlayson-Pitts and Pitts, 1986)
species deposition velocity ( cm s-1) type of measurement
NOx 0.30 gradient over cut grass, z=5 cm <0.09 chamber with spruce or pine 0.04 Eddy correlation over wheat 0.05 (night) Eddy correlation over soybean, z=S-6 m 0.6 (maximum in day)
NO2 0.4 - 0.5 chamber with Scots pine 0.30 - 0.80 soil, cement 1.90 alfalfa
NO 0.10 - 0.20 soil, cement NO3- 0.7 - 1.7 (summer) throughfall in Fagus silvatica canopy
0.6 - 1.6 (winter) 1.1 - 3.7 (summer) throughfall in Picea abies canopy 1.3 - 3.2 (winter) 0.55 - 0.71 throughfall in Quercus prinus canopy
HNO3 1.0 - 4.7 grassy field PAN 0.14 - 0.30 grass, soil
0.63 alfalfa NR4+ 0.6 - 1.3 (summer) throughfall in F agus silvatica canopy
0.2 - 0.8 (winter) 0.7 - 2.1 (summer) throughfall in Picea abies canopy 0.6 - 1.6 (winter)
Table 4 Dry deposition velocities for ozone (after Davidson and Wu, 1990, Finlayson
Pitts and Pitts, 1986)
deposition velocity ( cm s-1) 0.08 - 0.91 0.06 - 1.0 0.6 0.34 - 0.49 0 - 1.5 (afternoon) 0.5 (day) 0.1 (night) 0.3 (night) 0.8 (maximum in day) 0.10 - 2.10 0.47 - 0.55 0.20 - 0.84
type of measurement gradient over grass, z= 0.25, 0.5, 1, 2 m gradient over cut grass Eddy correlation over wheat Eddy correlation over grass gradient over pasture Eddy correlation over loblolly pine, z =23 m
Eddy correlation over soybean, z=5-6 m
soil, short grass grass, soil, water maize, soy bean field

14
4 Damages of air pollutants on vegetation
One of the ways by which air pollutants affect the vegetation is through direct contact
of gaseous pollutants with plants. Air pollution may be harmful to animals and humans
as well. However, the gas metabolism of humans and animals is adapted to an oxygen
content of air of about 21 vol. %, whereas the assimilation of plants is adapted to only
0.03 vol. % carbon dioxide. Therefore green plants are much more susceptible to air
pollution and react to pollutant concentrations which do not cause any apparent toxicity
in humans and animals. In this way, plants have an indicator function in addition to the
direct effects such as crop loss, decline of quality, changes in ecosystems, forest
decline, etc. Plants react very sensitively to too low or to too high concentrations of the
air components. Depending on the length of influence and its intensity, the
consequences can vary : physiological disturbances, effects on enzyme systems, damage
of cell plasma, death of cells, quantitative or qualitative reduction of plant growth and
changes in the ecosystem.
The biological response of plants to the air pollutants is the accumulation of physical,
biochemical, and physiological events, beginning with the uptake of pollutants and
ending with a measurable biological effect on the plant. The measurable biological
effect in the case of crops, is the final agronomic yield.
4. 1 Uptake and chemical reactions of pollutants
The air pollutants taken up generally by leaves are either stored there or transported into
other parts of plants, slowly desorbed or leached, or incorporated into the intermediate
metabolism (Dassler and Bortitz, 1988). Damage caused by gaseous pollutants on the
plants directly is regulated by three processes : ( 1) stomata! resistance controlling the
entry of gaseous pollutant into the leaf, (2) resistance in the cell liquid controlling the
pollutant distribution and concentration at the target site (biochemical resistance), and
(3) repair and compensation processes (homeostatis) (Hogsett et al., 1988).
The leaf is a typical receptor and has been studied frequently. Leaves are the most
active parts of the plants exchanging gases with the surrounding atmosphere. They are
covered with a waxy protective coating (cuticle). Gaseous pollutants enter through open
stomata. Gas exchange by leaf tissue occurs primarily by diffusion through stomata and
to a limited degree, through mechanical punctures or cracks in the cuticle. After having
penetrated the cuticle, gaseous pollutants encounter a water-saturated atmosphere in the
intercellular spaces and an aqueous solution on the cell walls of internal leaf tissue.

15
Solubility of the gas plays an important role in determining whether it is readily
absorbed by the cells. Those gases which react with water to produce acids (such as
S02 and N02) are absorbed easily. Hence these gases are strong phytotoxicants (Taylor,
1973). Gases with low solubility in water such as carbon monoxide and nitric oxide,
have a low phytotoxicity level. A toxic effect is the outcome of a series of events that
can be assigned into three phases : (1) exposure, (2) toxokinetic (absorption,
distribution, and metabolism), and (3) toxodynamic (target interaction).
Exposure phase : when the plant is exposed to a toxicant, a toxic effect can occur
only after absorption of the substance. The uptake of the substance is highly dependent
on the concentration of the gaseous substance in the surrounding air determining the
rate at which the substance comes into contact with the surface. The stomata are the key
factors controlling the rate of absorption.
Toxokinetic phase : this phase is governed by the absorption, distribution, and
metabolism of the pollutant, including all the processes affecting the relationship
between the available pollutant and the pollutant concentration attained in the target
tissue.
Toxodynamic phase : this phase of the toxic response represents the interaction
of the activated toxicant and the target tissue or receptor. The concentration of the
toxicant attained in the target tissue determines the degree of resultant biological
response. This response may be irreversible enzyme inhibition, uncoupling of
biochemical reactions, removal of an essential metal, or interference with the general
function of a cellular membrane (Hogsett et al., 1988).
The reactions of some pollutants in solution and some possible toxic reactions together
with detoxification mechanisms are shown in Table 5. Sulfur dioxide is absorbed
readily by stomata. Some of the effects of sulfur dioxide are attributable to its acidifying
effects, either as sulfurous acid, or after oxidation, as sulfuric acid. Sulfite and sulfate
both can be metabolized by plant tissue. Sulfite can be oxidized to sulfate, and this
ability may be correlated with the resistance (Mudd, 1973). On the other hand, sulfate
can be reduced all the way to sulfide.
When the oxides of nitrogen come in contact with water, both nitrous and nitric acids
are formed (Table 5). Toxic reactions may result from pH decrease. Other toxic
reactions may be a consequence of deamination reactions with amino acids and nucleic
acid bases. Another consideration is the reactions of oxides of nitrogen with double
bonds. The reaction of nitrogen dioxide with unsaturated compounds results in the

16
formation of both transient and stable free radical products. The possible modes of
toxicity for oxides of nitrogen are numerous. Detoxification by the metabolism occurs
via reduction of both nitrate and nitrite to ammonia.
Peroxyacetylnitrate (PAN) degrades rapidly in aqueous solution at all pH values but
most rapidly at alkaline pH. The products are acetate, nitrite and molecular oxygen
(Table 5). These products are relatively nontoxic; the toxicity of PAN cannot be
attributed to nitrite since the damage symptoms are different. Possible toxic reactions of
PAN are reactions with sulfhydryl group of biological molecules and oxidation of
reduced nicotinamides.
Ozone, being a very polar molecule, is very hydrophilic. It dissolves readily in water
and can lead to several types of products. Ozone reacts with several amino acids in
aqueous solutions. It oxidizes also nicotinamides, unsaturated fatty acids and lecithin.
Ozone can react with and alter critical sulfhydryls of the cell which could cause
inactivation of some enzymes (Heath, 1988). It is impossible at present to decide
whether the effects of ozone are primary reactions or the result of a series of reactions
initiated by ozone. Effects of ozone can be attributed to enzyme inhibition of one sort or
another.
4.2 Plant damages caused by pollutants
Damages caused by air pollutants vary both in type and degree. Some studies have
shown that variability in the degree of damage exists within the same species (Ryder,
1973). This leads to resistant and susceptible varieties of the same species.
The pollutants taken up by plants may cause acute or chronic damage depending on the
exposure time and concentration. The difference between acute and chronic effects of
pollutants is defined in terms of dose rate and time of exposure. However, the
symptoms of both effects may be similar (Feder, 1973 ). Acute exposures (plants
exposed to relatively high concentrations of pollutants for a short time) generally cause
visible plant injury, but do not necessarily affect total growth or productivity. On the
other hand, plants exposed to low levels of pollutants for long periods of time ( chronic
exposure) were reported to show reduced growth, leaf size, stem length, root weight and
flower production as well as a delay in the onset of floral initiation (Feder, 1973).

Table 5 Reactions of pollutants in aqueous solution (after Mudd, 1973)
reactions in solution toxic reactions detoxification by metabolism
sulfur dioxide
S02 + H20 ➔ H2S03 RCOH + NaHS03 ➔ R(OH)CH-S03Na so42- _. soi- _. _. -s-
H2S03 ➔ H2S04 RSSR + S032-➔ RS-+ RSS03- S032-➔ S042-
reactions with pyrimidines
oxides of nitrogen
NO + N02 + H20 ➔ 2HN02 RNH2 + HN02 ➔ ROH+ N2 + H20 N03- ➔ N02 ➔➔ NH3 ...... ---.I
3N02 + H20 ➔ 2HN03 + NO RCH = CHR + N02 ➔ RCH-CHN02R
ozone
oxidation of aminoacids toxic reactions of fatty acid hydroperoxides, oxidation of nicotinamide
oxidation of unsaturated fatty acids hydrogen peroxide, malonaldehyde oxidation of lecithin reactions with sulfhydryl groups
peroxyacetylnitrate (PAN)
PAN+ 20H--► CH3C02- +02+N02- +H20 PAN+ 3RSH ➔ CH3COSR + RSSR + H20 CH3COSR + H20 ➔ RSH + CH3C02H +H++N02-
PAN+ reduced nicotinamide ➔ oxidized nicotinamide

18
4.2.1 Acute damages
Short-term exposure to very high concentrations might lead to acute damages. This type
of exposure can be encountered in areas near industrial centers or in the case of
breakdowns in the factories. Acute symptoms of injury from various pollutants in
different horticultural and agronomic groups are visible on the affected plant. Symptom
expressions produced include chlorosis, necrosis, abscission of plant parts, and effects
on pigment systems. The most severe injury produced by air pollutants is usually
expressed by the death of large areas of leaf tissue. The dead (necrotic) areas become
dry and may have various colors from white or ivory to red or dark brown. Necrotic
areas may be accompanied by varying degrees of yellow discoloration (chlorosis).
Chlorotic symptoms are usually produced by long-term or repeated short-term exposure
to relatively low concentrations of the toxicants and are generally considered as the
symptoms of chronic injury. There are exceptions, however, when chlorosis appears in
conjuction with necrosis following exposure to high concentrations of pollutants. The
chlorosis may develop independently or appear as a border around necrotic lesions.
Leaves with symptoms of acute injury usually drop prematurely. Exposure to very high
concentrations of nitrogen dioxide, chlorine, or hydrogen chloride may cause extensive
defoliation within a few hours. Much lower concentrations may cause gradual
development of typical symptoms of senescence, followed by premature dropping of
affected leaves (Taylor, 1973). Younger needle-age groups are more sensitive to this
type of damage than the older ones. In case of acute exposures, survival or death of
plants is determined by the extent of physiologically active leaf mass remaining and/or
the capacity to form new shoots.
Sulfur dioxide At present, sulfur dioxide is still the main air pollutant in the
industrial states of Europe. This colorless gas is irritant and has adverse effects on the
respiratory tract of humans and animals, but also on the assimilation apparatus of plants.
Even after short-term influence, sulfur dioxide concentrations above 0.2 mg m-3 can
cause serious disorders in the assimilation organs of conifers and necrotic changes.
Acute necrosis results from rapid absorption of SO2. Once SO2 enters the mesophyll
tissue, it reacts with water to produce sulfite ion which has strong phytotoxic properties.
Sulfite ions are subsequently slowly oxidized to sulfate (Table 5). Both sulfite and
sulfate ions are toxic to plant cells, but the former is reported to be 30 times more toxic
than the latter. Sulfite concentration increases rapidly with a high rate of SO2
absorption. When lethal concentrations accumulate in the most susceptible areas of the
leaf, a dark green, water-soaked discoloration develops. The affected area becomes

19
flaccid, and upon drying becomes white to ivory on most plants, red or brown in others.
Small grain crops such as barley, oats, rye and wheat are relatively sensitive to S02
injury. Injury on these grain crops and other parallel-veined plants usually develops as
necrotic streaks between the veins near the leaf tip and extends toward the base as the
severity of injury increases. On grasses and grains where the long, limber leaf blade
curves downward, injury is usually most severe at the bend. Sulfur dioxide injury of
pines usually starts at the tip of the needles and extends towards the base as successive
exposures produce more severe injury (Taylor, 1973).
FI u or id es Fluoride damage to plants has been observed and studied in many parts
of the world (Ryder, 1973, Dassler and Bortitz, 1988). Fluorides can have extremely
toxic effects even at very low concentrations. Plant damage is attributed primarily to
hydrogen fluoride (HF), but silicon tetrafluoride and other gaseous forms released by
industry are also toxic. HF is much more abundant in polluted areas than the other
fluoride compounds. After penetrating the open stomata, HF is readily dissolved in the
aqueous solution on the internal leaf tissues. When the concentrations are high ( > 3-4
ppb) acid-type burn develops on sensitive tissue. Transition from healthy to necrotic
tissue is abrupt. Necrosis starts at the tip and progresses toward the base as fluorides
accumulate. After several days, the necrotic tissue on injured apricot, grape, and other
woody plant leaves may separate from the remainder of the leaf and drop away, leaving
a ragged hole. Plants such as iris, gladiolus and tulip are susceptible to fluoride injury.
Several species of pine and fir are considered to be among the most fluoride-susceptible
plants. Needles of these conifers are most sensitive to HF.
Fluoride may produce chlorotic areas on the leaves of citrus and sweet cherry without
evidence of necrosis.
Nitrogen oxides Nitric oxide (NO), nitrogen dioxide (N02) and other oxides of
nitrogen considerably contribute to air pollution. The human organism seems more
endangered by nitrogen oxides than plants. Atmospheric concentrations of N02 seldom
reach sufficient levels to produce acute injury in plants unless an accidental release of
N02 or of NO occurs. Nitrogen dioxide is soluble in water, therefore it is readily
absorbed when it enters the intercellular cavities of the leaf (Table 5). At high
atmospheric concentrations absorption is rapid, and susceptible areas on recently
matured and rapidly expanding leaves are killed. Lower atmospheric concentrations
may produce small, irregularly shaped, dark-pigmented lesions when susceptible plants
are exposed for several hours. These symptoms resemble ozone injury. Susceptibility of
plants to N02 increases in the dark. Apparently, a light-dependent enzymatic reaction

20
will reduce nitrites produced from foliar-absorbed NO2 to ammonia which is readily
used as a plant nutrient. In the dark, this reaction is suppressed and toxic levels of
nitrites are allowed to accumulate.
Extremely high dosages of NO2 for a few minutes may stimulate rapid leaf drop with no
identifiable chlorosis or necrosis. In controlled experiments, NO2 caused excessive
defoliation of citrus, peppers, and other deciduous plants when they were exposed
briefly to very high concentrations (250 ppm) (Taylor, 1973).
Ozone Ozone is the principal oxidizing component in photochemically produced air
pollutants. It has been reported to have caused more injury to vegetation than any other
pollutant in the United States (Taylor, 1973, Miller, 1988). Exposure for two or more
hours to concentrations of 100 ppb may cause acute injury to several of the most
sensitive plant species. Recently expanded leaf tissue is most susceptible to ozone
injury. Very young, rapidly growing leaves and older, matured leaves are quite resistant.
One of the earliest indications of ozone injury on several plant species is an upper
surface discoloration with a waxy appearance. Ozone may cause severe tip bum on
current season needles of sensitive pine species.
Ozone may cause extensive chlorosis during an exposure of two to four hours to
concentrations as high as 400 to 500 ppb. A general bleaching of mature leaves on
melons, squash, beans, and radishes frequently develops after exposure to a heavy dose
of ozone.
Ozone-induced leaf drop may result from brief exposure to high concentrations, but
more often it results from long term or repeated exposures and probably should be
considered as a symptom of chronic injury.
Peroxyacetyl nitrate (PAN) PAN is a highly toxic photochemical air
pollutant and is responsible for serious plant injury in and near urban centers (see Table
5 for the reactions). Acute injury is seldom observed on woody shrubs and trees, but
grasses, vegetables, and weeds may be severely injured in a two-hour exposure by as
little as 10 to 20 ppb (Mudd, 1973). PAN attacks mesophyll tissue surrounding the
substomatal chambers on the lower side of the leaf. When tissue immediately beneath
the lower epidermis is killed, the epidermis dries, producing a glazed or bronzed
appearance on the lower leaf surface. As the upper part of the leaf continues to grow, it
cups downward, and becomes distorted. Very high dosages of PAN produce bifacial
necrosis.

21
Minor pollutants Injury by ethylene develops slowly over a considerable time
( chronic injury) and is expressed as distortion of growth, epinasty, chlorosis,
defoliation, and excessive drop of blossoms or fruits. Symptoms of acute injury may be
produced when the flower bud is in the most susceptible stage.
Accidental release of ammonia can cause very high concentrations to occur briefly in
the atmosphere. Various types of necrotic spotting and streaking have been reported
when different types of plant material were exposed to high concentrations of ammonia.
Chlorine and hydrogen chloride produce acute symptoms on a variety of plants.
Chlorine injury on plants such as barley, radish, and spinach frequently produces
general bleaching and yellowing. Extremely high dosages of chlorine for a few minutes
may stimulate rapid leaf drop with no identifiable chlorosis or necrosis.
4.2.2 Chronic damages
The repeated exposure to low levels of air pollutants is called chronic exposure. This
type of exposure can take place in all areas containing air pollutants. Different plants
react with different intensities to each pollutant and pollutant level. Plants are generally
suspected of being pollution sensitive if some visible symptoms of injury can be
correlated with the presence of a particular pollutant or group of pollutants in the air. A
plant growing in its normal habitat is usually exposed to a fluctuating level of one or
more pollutants. This level may exceed or fall below the level demonstrated to cause
injury to the particular plant species or type exposed to the same pollutant under
laboratory conditions. Usually no necroses are visible due to the chronic exposure. The
effects are the reduced growth, premature death of the needles of the oldest age-group
in conifers, weaker new shoots. The survival of plants is dependent on the remaining
leaf mass and root activity. Increased concentrations or additional exposure can lead to
acute damage.
Sulfur dioxide Hidden injuries have been reported to result from long-term
exposure to low level sulfur dioxide, manifested not by visible symptoms, but by
decreased growth, faster aging of foliage, accumulation of sulfates, and reduction in
photosynthesis. The effects of chronic exposure of plants to sulfur dioxide in the air are
expressed as changes in rate of growth and total dry weight, i.e. yield. Some researchers
claim that the damage to the crop does not occur until 5 % or more of the area of the
leaves show visible markings (Thomas, 1961).

22
Fluorides When the cumulative load of fluoride in the plant reaches a threshold
concentration, a number of characteristic symptoms may appear. The concentration at
which injury symptoms appear seems to depend largely on the plant species and to a
certain extent on a series of complex interacting environmental conditions which affect
the physiological state of the plant. The chronic exposure of the plant to low levels of
fluoride causes the plant to accumulate fluoride. The discoloration is at first marginal,
starting at the leaf tip, but increases in width, length, and intensity as the time multiplied
by the concentration exposure increases.
Photochemical oxidants and nitrogen oxides Ozone and
peroxyacety l nitrate have very short half lives and leave no trace in the plant tissues
(Finlayson-Pitts and Pitts, 1986). On the other hand, nitrogen oxides are longer lived
but are not traceable either once they enter the plant, except in terms of their effects.
They cause visible injury symptoms on the leaves of plants providing pollutant dosages
are above the injury threshold for the plant variety. Reductions in yield of several crops
(tomato, alfalfa, sugar beet, endive plants) which were subjected to naturally occuring
smog have been reported (Feder, 1973).
4.2.3 Invisible damages
There has been several arguments about the definition of "invisible damage" or "hidden
injury" in the past. This type of damages are characterized by some scientists as
disturbances of plants which only become apparent in the increment, but cannot be
perceived with the naked eye. There are some other definitions as damages
characterized by reduced photosynthetic activity, earlier aging, growth depression, etc.
or as damages following chronic and acute damage. The absence of visible damage
symptoms is the reason of controversial justification of the term invisible "damage". It
has recently been proposed to use the term "invisible immision effects" (Dassler and
Bortitz, 1988). Thus it is clear that air pollution may well have effects on plants, but
changes within the plant organs can only be measured or analytically registered. They
do not, however, cause damage symptoms, i.e. there is no damage in the
phytopathological sense, but only a disturbance of the physiological functions of plants
and/or utilization value of plant material. The most essential invisible effects on plants
are ( 1) the reactions in plant metabolism which cause a decrease in photosynthesis, (2)
changes in the fine structure of cell components, (3) contamination of plant material
with pollutants, and ( 4) leaching of nutrients and possibly of further plant constituents,
which becomes more evident in the case of acidic precipitations. The measurable

23
reactions of plant metabolism in the case of invisible exposure are mainly assimilation
depression as well as changes in enzyme activities.
4.3 Response of agricultural plants to air pollution
In complex natural communities contin~ous air pollution could have a marked effect on
species frequency and could, with time, completely change the community composition.
In the cultivated agricultural community, the pollutant-induced effects could result in
the loss of productivity, and eventually the crop would no longer be profitable to grow.
The highest yield losses in agricultural plants are a consequence of chronic damage.
Yield reductions in fodder plants, cereals, and horticultural plants due to the effect of
S02 are to be expected in many industrial centers. Decreased yields and changes of
constituents can occur even at low S02 concentrations. Apart from the S02
concentrations, the amount of yield losses largely depends on the variety. Relative
sensitivities of some trees and plants to sulfur dioxide are shown in Table 6. However,
in several species, variations in sensitivity to the pollutants have been observed (Ryder,
1973).
Table 6 Relative sensitivities of some trees and plant species to S02 (after Dassler and
Bortitz, 1988)
species sensitivity Scots pine (pinus sylvestris) European larch (larix decidua) Norway spruce (picea abies) Silver fir (abies alba) very sensitive rice sunflower alfalfa white fir (abies concolor) Japanese larch ( larix kaempferi) soybean barley sensitive oats wheat rye cotton red beech (fagus sylvatica) com less sensitive sorghum

24
The following plant species were reported as sensitive to ozone and other oxidants:
dwarf beans, wheat, certain kinds of tobacco, and some leguminous plants (Dassler and
Bortitz, 1988). Relative sensitivities of some trees and plants species to NOx, 03, and
PAN are listed in Table 7.
Table 7 Relative sensitivities of some trees and plant species to NOx, 03 and PAN
(after Larcher, 1994). vs: very sensitive, s: sensitive, Is: less sensitive
species NOx 03 PAN cereals vs VS
nee l s grass vs vs spinach VS vs maple s 1 s 1 s birch vs 1 s 1 s beech 1 s 1 s ash VS /1 S 1 s oak Is VS /1 S I s fir s s /1 s 1 s larch vs VS/ S I s spruce 1 s pine 1 s VS/ l S 1 s
It was suggested that relative stomatal conductance might provide a basis to define the
potential sensitivity of different crops, since it will control the absorbed dose of ozone
(Fuhrer and Achermann, 1994). A number of factors may influence the response of
crops to ozone. The most important of these are soil moisture deficit and atmospheric
vapor pressure deficit which affect stomata! conductance and thus the absorbed ozone
dose. The European crops which are reported to have developed ozone injury are wheat,
lucerne, soybean, potato, spinach, cotton clover, bean, corn, tomato, tobacco, artichoke
and watermelon.
Investigations in recent years confirmed the high plant toxicity of fluorine compounds.
Fluorine damage often occurs together with sulfur dioxide damage. Relative HF
susceptibilities of some trees and plants are given in Table 8.

25
Table 8 Relative HF susceptibility of the leaves of some vegetables and trees (after
Dassler and Bortitz, 1988)
species
leak (Allium porrum)
onion (Allium cepa)
parsley (Petroselinum crispum var. vulgare)
Norway spruce (picea abies)
Scots pine (pinus sylvestris)
European larch (larix decidua)
cucumber ( Cucumis sativus)
rhubarb (Rheum undulatum)
spinach (Spinacia oleracea)
Japanese larch (larix kaempferi)
dwarf bean (Phaseolus vulgaris)
endive ( Cichorium endivia)
garden-lettuce (Lactuca sativa var. cap.)
tomato (Lycopersicum esculentum)
beetroot (Beta rubra hort.)
carrots (Daucus carota)
celeriac (Apium graveolens var. rapaceum)
kale (Brassica oleracea var. acephala)
kohlrabi (Brassica oleracea var. gangylodes)
large radish (Raphanus sativus)
radish (Raphanus radicola)
red and white cabbage (Brassica oleracea var. capitata)
savoy (Brassica oleracea var. sabauda)
sprouts (Brassica oleracea var. }?emmifera)
sensitivity
very sensitive
sensitive
less sensitive
relatively insensitive
Hertstein et al. ( 1995) give ozone exposure - response functions for various crops
derived from ozone fumigation experiments under near-ambient conditions using open
top chambers (Table 9). Relative yield changes can be calculated using these functions.
The relative yield change (EQ3) of a particular crop is calculated as follows :

26
where:
Y rel (x) = the relative yield calculated from the current ozone concentrations (x)
Y'rel (x') = the relative yield at a background concentration in pre-industrial times (x')
Relative yield changes Eo3 can subsequently be converted into potential relative yield
loss, Lo3 expressed in percentage(%)
Lo = (1-Eo )x100 3 3
The basic assumption here is that the relative effects of ozone on crop growth and yield
can be estimated independently from relative changes of the atmospheric composition.
However, when relating ozone-induced yield changes in polluted areas to that of a
background ozone concentrations in unpollutant air in the pre-industrial times, one has
to consider that the background ozone level corresponded to much lower CO2
concentrations than presently found. CO2 may have a counter effect on crop growth,
i.e. it may compensate the negative effects caused by ozone exposure. For example,
crops usually respond to CO2 enrichment with increased net photosynthesis, reduced
photorespiration, increased above- and below-ground biomass, increased yield,
decreased transpiration, etc. (Rogers and Dahlman, 1993). The application of exposure
response functions using a background concentration in the denominator, which
corresponded to much lower CO2 concentrations, may lead to great overestimation of
the crop losses. However, these yield functions can be used to estimate potential relative
yield changes resulting from slight variations in ozone concentrations under current
CO2 conditions if it is constant.
Fuhrer et al. ( 1989) made a first attempt to theoretically assess the effects of air
pollution on agricultural crops in Switzerland on the basis of literature data about the
effects of pollutants on plants and on the basis of the Swiss air pollution monitoring
data. Calculations were carried out in three steps : The first step consisted of a

27
qualitative risk assessment for selected air pollutants. The second step involved the
quantification of crop-specific and regional risk indices, based on biological exposure
response functions taken from the international literature and on pollution monitoring
data from eight test regions for the years 1987 and 1988. For the third step, agronomic
information was included in the assessment. In combination with the risk indices
determined in the second step for ozone, relative losses in acreage of the selected crops
were calculated for the test regions.
The first step of analysis of Fuhrer et al. ( 1989) revealed that on a regional scale, ozone
is the only possible risk factor of importance for crop loss, and that hydrogen fluoride is
of local importance. The second step revealed the highest risk indices for pastures and
grapevines, and lowest indices for field vegetables and corn. On an average, calculated
relative yield losses for crops were as follows: Grapevines 10.7 %, pasture 8.4 %, beets
5.5 %, legumes 3.3 %, wheat 1.6 %, corn 0.5 %, and field vegetables 0.3 %. The few
experimental observations from field studies with Swiss crops did not agree well with
the calculated values. This shows the important limitations associated with the model :
the lack of information concerning the reponse of Swiss crops to ozone as compared to
the response of those foreign crops for which exposure-response functions were used in
the model, uncertainty about pollution levels in different regions of Switzerland,
restrictions regarding temporal and spatial extrapolation of regional data, omission of
possible interactions between different pollutants, etc. Regional relative yield loss
calculated in the third step revealed values between 2 and 9 % . Highest percentage was
estimated for western Switzerland, the western part of the Swiss Plateau and Valais,
lowest percentage for the central and eastern part of the Swiss Plateau and eastern
Switzerland (Fuhrer et al., 1989).

28
Table 9 Ozone exposure-response functions for various crop species (after Hertstein et
al., 1995 and references therein). xn : seasonal mean of [03] in ppm averaged over n
hours. 7h = 09:00-15:59, 8h = 09:00-16:59, 12h = 08:00-19:59
Forage Timothy /red clover Tall fescue/ladino clover Winter wheat Roland Abe&Arthur-71 Blueboy II Coker47-27 Holly Oasis Vona Spring wheat Albis Star Turbo Barley Poco Alexis Corn Coker 16 PAG397 Pioneer 3780 Beet Detroit Dark Red Turnips Tokyo Cross Just Right Purple Top White Globe Shogoin Rape Calypso Vegetables Spinach "America" Spinach "Hybrid 7" Spinach "Viroflay" Spinach "Winter Bloom" Lettuce "Empire" Tomato "Murrieata" Legumes Red kidney bean "California Light Red" Pink bean "Sutter Pink" Pea bean "Sal Small White 11
Bush bean "Rintintin" Grape vine Thompson seedless
Yrel = exp[-(x12 I 0.072)4,034 J Yrel = 1 - 4.254 XJ2
Yrel = exp [- (x7/O.l 13)1·734 J Yrel = exp [- (x7/O.145)3.326J Yrel = exp [- (x7/O.175)3.22 J Yrel = exp [- (x7/O.171)2-06j Yrel = exp [- (x7/O.156)4.95 J Yrel = exp [- (x7/O.186)3·20] Yrel = exp [- (x7/O.O97)1.506j
Yrel = 1 - 5.93 X8 Yrel = 1 - 5.53 X8 Yrel = 1 - 8.63 X8
Yrel = exp [- (x7/O.2O5)4.278J no yield losses
Yrel = exp [- (x7/O.22])4.46j Yrel = exp [- (x7/O.161)4·594 J Yrel = exp [- (x7/O.l 55)3,071 J
Yrel = 1 - 3.992 XJ2
Yrel = 1 - 6.602 XJ2 Yrel = exp [- (x7/O.O9Q)3.05 J Yrel = exp [- (x7/0.O95)2-51 J Yrel = exp [- (x7/O.O96)2- 12 J
Yrel = 1 - 3.481 X8
Yrel = exp [- (x7/O.142Jl.65j Yrel = exp [- (x7/O.139)2-68j Yrel = exp [- (x7/O.129)1·99 J Yrel = exp [- (x7/O.127)2.07J Yrel = exp [- (x7/O.122)8.837J Yrel = exp [- (x7/O.142)3.807J
Yrel = exp [- (x7/O.l2O)1•171 J Yrel = 1 - 8.18 XJ2 Yrel = 1 - 5.98 XJ2 Yrel = exp [- (xsfO.12])3.62 J
Yrel = 1.121 - 6.63 XJ2

29
4.4 Response of forests to air pollution
There are some generally accepted ideas about forest damage in Europe and in North
America. It is clear that a number of different types of decline are present, each being
characterized by a specific set of symptoms and resulting from a certain combination of
climate, soil and pollution. Every country has accepted the idea that forest decline is
due to a complex set of factors. However, some countries differ over the interpretation
of the role of air pollution as the following statements show : "there is no direct proof of
pollution-related decline of forest trees in the United Kingdom" whereas "ozone is
important in a decline of pines in southern and central California and is the pollutant of
greatest concern with respect to possible regional-scale impacts in North American
forests" (Nilsson and Cowling, 1992).
The effects of air pollutants on forests have been studied extensively both in
experimental chamber systems and with open-air fumigation experiments (Schlaepfer,
1992, Matzner, 1992, McLeod and Skeffington, 1995, Cronan, 1984, Smith et al.,
1984). These experiments suggest that there is a clear dose-response relationship for
S02. Chronic pollution damage of forests often leads to large damaged areas in spruce
and pine populations. This damage is caused mainly by S02 and fluorine compounds.
The effects observed were reduction in photosynthesis in picea abies (Norway spruce),
and to a lesser extent and in conjuction with 03, in pinus sylvestris (Scots pine), direct
foliar damage in pinus sylvestris, enhancement of frost damage by S02 in pie ea abies
and picea sitchensis (Sitka spruce), enhanced N uptake by picea abies and picea
sitchensis, high S02 deposition rates possibly due to NH3 co-deposition, increased
foliar leaching, progressive soil acidification, increased Al concentrations and Al/base
cation ratios in soil solution, and inhibition of litter decomposition. Some recent studies
indicate that the presence of gaseous ammonia may influence sulfur dioxide deposition
rates on leaf surfaces (Fowler, 1992).
Depending on the kind and concentration of the pollutants several tree types are
chronically or acutely damaged (Tables 6-8). The important symptoms for forestry are
the leaf and needle necroses, reduction of number of needle age-groups and thus foliar
reduction in canopies, reduction of fine root weight and wood yields, and dying of
populations. There are essential differences between spruce and pine trees with regard
to chronic damage caused by S02. In pine-tree populations, the density of canopies
declines steadily on a large area, and then individual trees die. The dying process in
spruce populations, however, proceeds from the border of the population with the wind
direction, and the inner part of population generally shows no damage.

30
5 Health effects of air pollution
During smog episodes, air quality guidelines for air pollutants of major importance can
be exceeded to the extent that acute adverse effects on health may occur. Such episodes
happen during stagnant weather conditions both in summer and winter. However, the
pollutants of primary concern in winter and summer episodes are usually different.
Table 10 shows the values or limits for various air pollutants recommended by the
World Health Organization (WHO, 1987) as well as some selected countries. These
standards are set to protect the public health.
The World Health Organization issued air quality guidelines for a number of pollutants
including ozone, sulfur dioxide, and suspended particulate matter. Since these
guidelines are meant to prevent all adverse effects on human health from air pollution
exposure, these levels are sometimes considerably exceeded during the typical winter
and summer-type smog exposures. A separate gradation of the health effects known or
expected to occur during winter- or summer-type smog exposures at certain
concentrations of pollutants are given by WHO (1992). Winter-type smog means
pollution from the combustion of sulfur-containing fossil fuel for heating and/or energy
generation. Sulfur dioxide and suspended particulate matter are the pollutants of
primary concern. Observed effects of winter-type smog included temporary changes in
pulmonary function, an increase in morbidity among chronic bronchitics, an increase in
hospital admissions due to respiratory and cardiovascular conditions and depending on
the severity and nature of the exposure, increases in mortality (Ackermann-Liebrich et
al., 1993).
The expected health effects of pollutant mixtures containing sulfur dioxide and
particulate matter are graded in Table 11. As the lowest detectable effect, transient
reductions in lung function are graded as moderate. An increase in the mortality has
been identified as the most severe effect. Effects on morbidity are graded as moderate
when they begin to occur. These effects become severe at some point before mortality.
WHO ( 1992) gives 24-hour average levels of 400 µg m-3 sulfur dioxide combined with
400 µg m-3 particulate matter in air as the threshold for severe effects.
Summer-type smog refers to photochemical pollution arising from atmospheric
reactions of hydrocarbons and nitrogen oxides, stimulated by sunlight. Although ozone
is considered to be the most biologically active pollutant, not all effects on health
associated with exposure to summer-type smog can be ascribed to ozone alone.
However, no reliable dose-response information exists other than the observations that
annoyance effects such as eye irritation begin to occur when ozone levels of about

31
200 µg m-3 are exceeded. Experimental studies on humans showed that ozone was
effective on lung functions, bronchial reactivity, and respiratory (WHO, 1992,
Ackermann-Liebrich et al., 1993). The expected acute health effects of summer-type
smog graded by WHO (1992) are given in Table 12. These levels do not indicate
thresholds of effects, but indicate an amount of air pollution high enough to cause
effects that may be detected in well designed studies.
Table 10 Recommended values or limits for various air pollutants to protect the public
health (WHO, 1987, Finlayson-Pitts and Pitts, 1986, LRV, 1992)
pollutant country concentration time WHO 25ppm 24h
30ppm 8h l00ppm 1 h
Canada 13 ppm 8h co Japan 20ppm 8h
Germany 26ppm 0.5 h Switzerland 8 mg m-3 24h WHO 38 - 57 ppb 24h
15 - 23 ppb annual mean Germany 0.06ppm 24h Netherlands 0.05 ppm 24h
SO2 Sweden 0.29 ppm 1 h 0.12 ppm 24h
Switzerland 100 µg m-3 24 h 30 µg m-3 annual mean
WHO 0.10 ppm 1 h Japan 0.06ppm 1 h
03 Switzerland 120 µg m-3 1 h Germany 0.05 ppm 2-12 mo Japan 0.04 - 0.06 ppm 24h
N02 Switzerland 30 µg m-3 annual mean
80 µg m-3 24h
NMHCa Canada 0.24ppm WHO 60 -90 µg m-3 annual mean Canada 120 µg m-3 24h
total suspended particles 70 µg m-3 1 yr Sweden 260 µgm-3 24h
75 µg m-3 1 yr Japan 200 µgm-3 lh Switzerland 70 µg m-3 annual mean
150 µg m-3 24h
lead USSR 0.7 µg m-3 24h Switzerland 1 µg m-3 1 y
a non-methane hydrocarbons from 6:00 to 9:00 a.m. (ppm C)

32
Table 11 Levels of 24-hour average concentrations of air pollutant mixtures containing
sulfur dioxide and particulate matter above which specific acute effects on human
health are expected on the basis of observations made in epidemiological studies ( after
WHO, 1992)
sulfur dioxide particulate health effects classification (µg m-3) matter (µg m-3)
200 200 small, transient decrements in lung moderate (gravimetric) function
250 250 increase in respiratory morbidity moderate (black smoke) among susceptible adults and
possible children
400 400 further increase in morbidity severe (black smoke)
500 500 increase in mortality among elderly, severe (black smoke) chronically ill people
Table 12 Expected acute effects of photochemical smog on days characterized by
maximum I-hour average ozone concentrations as indicated for children and non
smoking young adults on the basis of observations made in toxicological, clinical, and
epidemiological studies (after WHO, 1992)
Ozone ( m-3) health effects classification
< 100 none
200 eye, nose and throat irritation in few sensitive mild people, some chest tightness, cough
300 eye, nose and throat irritation in < 30 % of moderate people, increased respiratory symptoms
400 eye, nose and throat irritation in > 50 % of severe eo le, further increased res irate s m toms

33
6 Material effects of air pollution
Air pollution affects not only human beings, animals, vegetation and other ecosystems,
but also the materials. Theoretically almost every building in or downwind of a major
urban or industrial center may have the risk of being exposed to the corrosive effects of
acid deposition. The effects of acid deposition, together with other pollutants and
meteorological factors contributing to the deterioration of materials are well-known, but
not yet fully understood.
The rate of corrosion has increased dramatically in many urban areas. Buildings and
structures which have stood largely undamaged for hundreds, even thousands of years
have recently begun to be affected (McCormick, 1989). The effects of pollution on
various materials such as metals, polymers, and natural and man-made silicates are
reported by UN-ECE (1992b). Most of the corrosion of buildings and monuments is
apparently the result of the dry deposition of sulfur dioxide and sulfate particles. When
sulfur pollutants come in contact with the surface of sandstone or limestone, they can
react with the calcium carbonate in the stone to form calcium sulfate which sticks to the
surface. This causes flaking which can be washed away with rain, exposing more stone
to corrosion. Acid deposition can lead to stone decay via creation of salts which can
crystallize, expand, and/or contract causing disintegration. Recent investigations
indicated that the combination of S02 and N02 accelerates the corrosion of several
materials such as copper, gold contact materials or calcareous stones (UN-ECE, 1992b).
On gold and copper surfaces, nitrogen dioxide oxidizes sulfur dioxide to sulfuric acid.
On alkaline stone materials, nitrogen dioxide may catalyze the oxidation of adsorbed
sulfur dioxide to sulfate. Ozone also has been proven to strongly stimulate the
deposition of sulfur dioxide on marble surfaces, by oxidizing the sulfur.
Sulfur dioxide and its oxidation products induce hydrolytic decomposition of polymers
such as polyamide, cellulose and polyesters (UN-ECE, 1992b). Photochemical
degradation process is important in atmospheres polluted by S02 for polymers such as
polyethylene, polypropylene, polymethylmetacrylate and polystyrene. Nitrogen oxides
are reported to react with various polymers. Paints exposed to acid deposition are also
subjected to the effect of UV light, temperature, humidity and other environmental
factors which adversely affect the coatings.
Wet deposition has a corrosive effect providing wetness and corrosion substances like
H+ and SO 42- ions. On calcareous stones, some dissolution of carbonate can occur. On
zinc surfaces, rain may solve protective layers of basic zinc salts. Types of damages
caused by the air pollutants on materials are listed in Table 13. The sensitivities of some
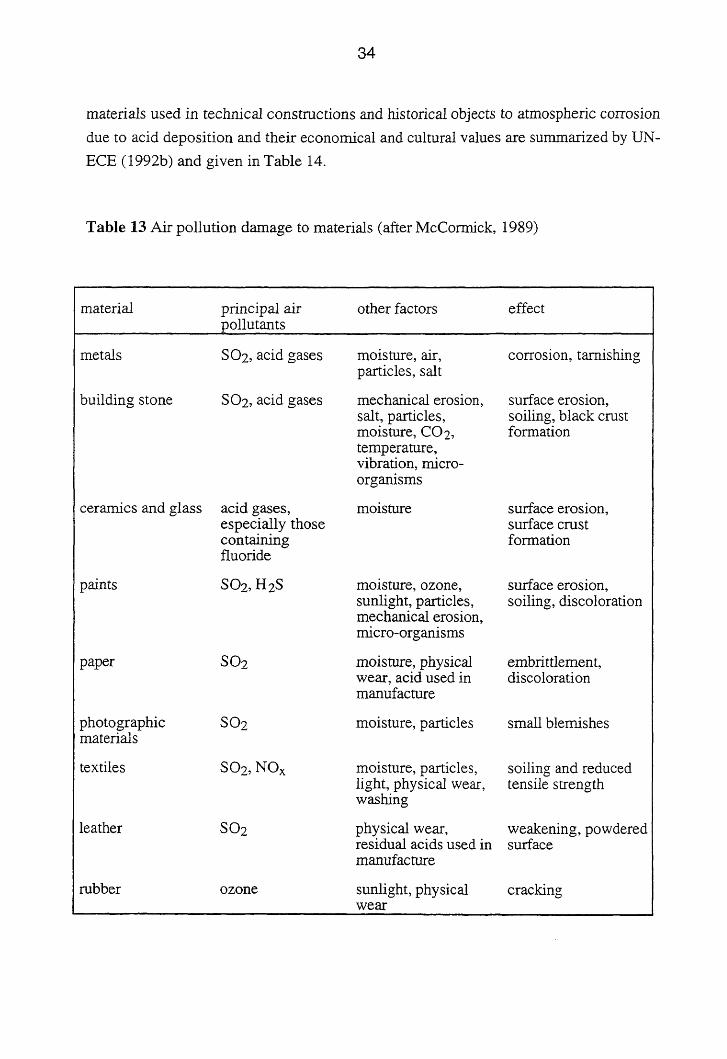
34
materials used in technical constructions and historical objects to atmospheric corrosion
due to acid deposition and their economical and cultural values are summarized by UN
ECE (1992b) and given in Table 14.
Table 13 Air pollution damage to materials (after McCormick, 1989)
material principal air other factors effect pollutants
metals S02, acid gases moisture, air, corrosion, tarnishing particles, salt
building stone S02, acid gases mechanical erosion, surface erosion, salt, particles, soiling, black crust moisture, CO2, formation temperature, vibration, micro-organisms
ceramics and glass acid gases, moisture surlace erosion, especially those surf ace crust containing formation fluoride
paints S02, H2S moisture, ozone, surlace erosion, sunlight, particles, soiling, discoloration mechanical erosion, micro-organisms
paper S02 moisture, physical embrittlement, wear, acid used in discoloration manufacture
photographic S02 moisture, particles small blemishes materials
textiles S02, NOx moisture, particles, soiling and reduced light, physical wear, tensile strength washing
leather S02 physical wear, weakening, powdered residual acids used in surface manufacture
rubber ozone sunlight, physical cracking wear

Table 14 Sensitivity of materials to acid deposition and their economical and cultural values (after UN-ECE, 1992b).
material
carbon steel
zinc copper materials
aluminum
nickel stainless steel
lead
calcareous stones
rendering (plaster)
concrete
paint on metal paint on wood
stained glass
paper and leather
electronic e_ql!i2ment
sensitivity
high
high
medium
low, very good resistance
high low, excellent resistance
low, excellent resistance
high
probably high for CaO containing materials effects uncertain
medium low, effects uncertain
high
medium medium
economic
medium
high
value
low outdoors, high indoors in electronic equipment
medium
low
medium
low
medium to high
high
very high
very high high
low
medium high
cultural
medium
high
ve1y high
medium
high
high high
u.) 01

36
7 Critical levels and loads
Air pollution control strategies require scientific evaluations of the loads and levels at
which pollutant deposition and ambient concentrations cause adverse environmental
effects. The Air Working Group of the UN-ECE Executive Body adopted the concept of 1critical load1 and 1critical lever for these adverse effects (UN-ECE, 1988). A general
definition of both the critical load and the critical level is :
1'The quantitative estimate of an exposure to one or more pollutants above which
adverse effects on specified sensitive elements of the environment may occur according
to our present knowledge". For critical loads, exposure is expressed as a deposition rate
for sulfur and/or nitrogen integrated over a given time period. The elements of the
environment where effects of deposition can arise are forests, surface waters and
groundwater. In the case of critical levels, sensitive plants, plant communities and
ecosystems are the receptors and exposure is defined as the concentrations integrated
over a specified time interval.
The task of setting specific critical levels is simplified by focussing on sensitive
receptors which are in many cases ecologically or economically important plant species.
The air pollutants under consideration are sulfur dioxide, nitrogen oxides and ozone,
these being considered to be the most important in Europe (CEC, 1987).
Since the late eighties the critical levels/loads approach is well established within the
frame of UN-ECE Convention on Long-Range Transboundary Air Pollution. Critical
loads of acidity and sulfur have been used to develop impact-based and cost-optimized
sulfur emission abatement scenarios by the UN-ECE Task Force on Integrated
Assessment Modeling. Based on these results, a protocol on the reduction of sulfur
emissions was signed in Oslo, in June 1994.
Critical loads are emerging as an important factor in air pollution abatement strategies.
Some countries (Canada, Finland, Hungary, the Netherlands, Sweden and the former
USSR) have already applied this concept in designing control programmes. At present,
the critical loads approach can be applied to the effects of sulfur and nitrogen
compounds. Critical loads/levels can be defined for different components of the
environment and controls can be designed to meet some but not all. The critical loads
are expressed as total deposition. Therefore the measurement of atmospheric input
(wet/dry) must be improved.
37
7 .1 Critical loads
The aim of the critical load approach is that pollutant emission reductions should be
negotiated on the basis of the effects of air pollutants, rather than by choosing an equal
percentage emission reduction for all countries involved. The goal is to reduce, in a
cost-effective manner and wherever possible, emissions of pollutant substances to levels
where, ultimately, critical loads are not exceeded. The calculation of critical loads of
acidity, sulfur and nitrogen form a basis for assessing the effects of changes in the
emissions and deposition of these compounds. The critical loads approach is widely
accepted as a tool for planning pollutant abatement strategies. It maximizes
environmental benefits by targetting emission controls, so that deposition is reduced in
sensitive areas rather than uniformly. The following informations are needed to use the
critical load approach : 1) inventories of current emissions and projections of future
emission rates, 2) estimates of the potential for and costs of emission reductions,
including structural changes and conservation of energy and natural resources, 3) long
range transport models, 4) maps of critical loads and target loads, 5) integrated
assessment modeling.
Critical loads have been defined for acidic, sulfur and nitrogen deposition with respect
to the sensitivity of aquatic and terrestrial ecosystems. Critical loads of acidity have
been mapped throughout Europe (Downing et al., 1993). It formed the basis for
deriving a separate critical load of sulfur. Protocols may address both reductions of
sulfur and nitrogen emissions simultaneously to reduce acid deposition (Downing et al.,
1993 ). Unlike sulfur, however, nitrogen deposition contributes to major environmental
problems other than acidification. Thus an assessment of the effects of nitrogen
compounds on ecosystems must consider both acidification and eutrophication effects.
7.1.1 Critical loads for acid deposition
Forest soils
The production of protons in the soil is only partially reflected in changes in pH.
Consequently, soil acidification is better defined as a decrease in acid-neutralizing
capacity of the soil. Acid-neutralizing capacity is defined as the sum of the weatherable
and exchangeable cations in the soil. Soil acidification is thus associated with removal
of cations from the soil, either by uptake or leaching. The effect of soil acidification on
the pH or the base saturation depends on the buffer capacity of the soil.

38
The natural process of soil acidification in forest ecosystems results from the
dissociation of carbonic and organic acids. Anthropogenic soil acidification is caused
by the atmospheric deposition of S02, NOx, and NH3. Inputs of sulfur and nitrogen
from the atmosphere, exceeding the net uptake of these compounds in biomass, cause
soil acidification by leaching of S042- and N03-, accompanied by cations released
through weathering and cation exchange. Effects of increased concentrations of sulfate
and nitrate in the soil solution are ( 1) decreases in pH, alkalinity, and base saturation,
(2) a decrease in availability of mineral nutrients due to leaching, (3) increased
concentrations of aluminum and heavy metals, which may have toxic effects on roots
and soil organisms.
The steady state mass balance method assumes a time-independent equlibrium between
the production and consumption of acidic compounds. The basic principle of this
approach is to identify the long-term average sources of acidity and alkalinity in the
system, and to determine the maximum tolerable acid input that will balance the system
at the biologically safe limit (Rihm et al., 1992). This method can be applied to soils
and lakes. Rihm et al. ( 1992) calculated the critical load of actual acidity as follows :
CL (actual acidity)= BCw - Alk I (crit.)
where
CL (actual acidity)= critical load of actual acidity (eq ha-1 yr-1)
BCw = weathering of base cations (eq ha-I yr-1)
A1k I (crit.) = critical alkalinity leaching (eq ha-1 yr-1)
The steady state mass balance approach is based on many assumptions of which the
most important are :
- ion-exchange is at steady-state
- there is no nitrogen fixation or denitrification, nitrogen cycle is at steady-state
- net changes in sulfate concentrations within the system are negligible
- hydrology and weathering rates can be represented by annual means
- temporal variations in base cation and nitrogen uptake for managed forests as a
function of forest age and management are not included
- horizontal water flux in the soil is not considered

39
It has been shown that the areas with high sensitivity of forest soils to acid deposition
are in the north-eastern part of Switzerland and in the south-west part of the Swiss
Plateau. The Jura mountains and the Alps are rather insensitive due to high buffering
capacity of calcareous soils and due to high precipitation, respectively. The critical load
of acidity calculated by Rihm ( 1994) is 667 eq ha- 1 yr 1 for deciduous (beech) forests in
the Swiss Plateau, and 1281 eq ha- 1 yr1 for coniferous (spruce) forests in the region of
the Alps.
In Schutzwald Project, various forested areas with different altitudes in the upper Reuss
Valley, Switzerland, were studied in order to estimate the load of air pollutants
(BUW AL, 1996). All these areas contain mainly coniferous forests (Norway Spruce).
Critical loads for acidity and actual acid deposition calculated for each soil type showed
significant differences between the sensitivities to acidity. Some regions were well
buffered whereas others were more sensitive to acidity. The fact that the calculated
acidity exceeded the critical load on some calcareous soils has been explained by deep
lying calcareous layers which do not affect the upper layers.
Groundwater
Natural waters acquire their chemical characteristics by dissolution and by chemical
reactions with solids, liquids and gases with which they come into contact during the
various parts of the hydrological cycle. The uppermost part of the earth's rocks
constitutes a porous medium in which water is stored and through which it moves. Up
to a certain level these rocks are saturated with water that is free to flow laterally under
the influence of gravity. Subsurface water in this saturated zone is groundwater.
Acidification of groundwater can cause a serious problem for the sensitive, shallow
aquifers of high permeability. Groundwater becomes corrosive and decreasing pH leads
to increased concentrations of harmful metals such as copper, lead, and aluminum.
Sulfuric acid replaces the exchangeable base cations in the soil with hydrogen ions, and
leads to an increase in water hardness. When the topsoil has reached equilibrium with
the acid water, the hardness decreases to its original value. Subsequently, sulfuric acid
begins to react with bicarbonate, thus reducing the bicarbonate concentration, i.e.
alkalinity. As alkalinity decreases, the pH also decreases, and aluminum may appear in
solution. This third stage may never be reached in the deeper parts of the ground,
because alkalinity produced by weathering may be sufficient to neutralize the acid load
(Stumm and Morgan, 1981). In order that the input of strong acid does not exceed the
alkalinity production by weathering in the unsaturated zone and in the aquifer, the long-

40
term critical load for groundwater has to be set. Consequently, the critical load of acids
to shallow groundwater is closely related to the soil characteristics. Protection of
groundwater extracted from shallow wells (2-3 m) draining sand and gravel, would
require a critical load as low as 100 to 500 eq ha- 1 yr-1• Chadwick and Hutton ( 1991)
give the critical levels of aluminum mobilization as 35 eq ha-1 yr- 1 and 650 eq ha- 1 yr-1
for coniferous and deciduous forests respectively. They also indicate that critical loads
for deeper aquifers have not yet been determined due to the hydrological complexity of
such systems.
Surface water
Acidification of surface water is a problem in the areas with thin topsoils of high
permeabilities and high sensitivities to acid deposition (e.g. granites). In Switzerland,
most of the surface waters and groundwaters are well buffered by calcareous strata.
Only lakes in alpine areas on slow-weathering bed rocks are sensitive to acid
deposition. The chemistry of several lakes in the southern part of Switzerland was
intensively investigated and high levels of acidification and high aluminum toxicity for
aquatic biota have been detected (Dietrich, 1988).
The effects of pollutants in surface waters are similar to those in groundwater, 1.e.
decrease in pH, and alkalinity, increase in the concentrations of sulfate, nitrate, base
cations and aluminum. The loss of fish populations and other aquatic biota have been
observed in many lakes in Europe. Henriksen et al. ( 1986) define the critical load for
acid deposition to surface waters as "the highest deposition of strong acid anions that
will not lead in the long term to harmful effects on biological systems, such as decline
and disappearance of fish populations". The largest reductions in aquatic biota may
occur in the pH range 6.1 to 5.2. To avoid loss of fish populations, the pH must be at
least 5.3 and labile Al must be less than 30 mg m-3 in the most sensitive surface waters
(Chadwick and Hutton, 1991). The effects of pH in surface waters on the fish species in
Canada are given in Table 15.
Schuurkes et al. (1987) gives the critical load for acidity for surface waters as 250
eq ha -1 yr 1. Some critical values for forest soils and fresh water systems are given in
Table 16. Critical loads in most of the alpine lake catchments on slow-weathering
bedrocks have been shown to be below 200 eq ha-lyr-1, mainly in the Ticino region
(Rihm, 1994).

41
An overview of various critical loads for different regions in the world is given in Table
17. Most of these thresholds aim to keep the pH above 5.3 in the most sensitive lakes.
However, such loadings could lead to biological changes. A summary of the critical
acidity loads is given in Table 18.
Table 15 Biological effects of acid waters in Canada (after McCormick, 1989)
pH
6.5
6.0
5.5-6.0
5.5
5.0-5.5
5.0
4.5-5.0
4.0-4.5
Effect
Continued exposure results in significant reduction in egg hatchability
and growth in brook trout
With high CO2 concentrations, certain trout species can be adversely
affected.
Rainbow trout not found. Small populations of relatively few fish
species found. Molluscs rare.
Declines in salmon fisheries can be expected.
Restricted fish populations, but not lethal unless CO2 is high. May be
lethal to eggs and larvae, and to some mayflies. Diversity of bacterial
species reduced.
Tolerable lower limit for most fish.
No viable fishery can be maintained. Lethal to eggs and fry of salmon
species.
Fish population limited; few species survive. Flore restricted.
For the data given in Table 18, no distinction has been made between forest soils,
groundwater, and surface water because of similar criteria used to set critical loads.
However, a distinction has been made between the sensitive and non-sensitive systems
by selection of low and high quality sites in relation to nitrogen load and slow and fast
weathering bedrock material in relation to the sulfur load.

42
Table 16 Critical values in forest soils and fresh water systems (after Chadwick and
Hutton, 1991, Rihm, 1994)
unit soil fresh water groundwater
[Af3+J eqm-3 0.2 0.003 0.02
Al:Ca mol moI-1 1.0 - -
pH - 4.0 5.3, 6.0 6.0
[Alk] eq m-3 -o.3a 0.02, 0.08 0.14
[N03] eq m-3 - - 0.8
a: [Alk] = [HCO3-J + [RCOO-J - [H+J - [Al3+], calculated by neglecting [HCO3-J and [RCOO-J and assuming log Kgibb of 0.8 and [Al] = 0.2 (A pH of 4.0 corresponds to 0.1 eq m-3 ofH+)
7.1.2 Critical loads for nitrogen deposition
Forest ecosystems
Nitrogen is an element derived from the soil which plants require in largest amounts ( 1-
4 % on a dry weight basis) and it is a growth limiting factor in most terrestrial
ecosystems. Any additional input of nitrogen will initially lead to increased production.
A further increase in nitrogen input will cause a change in the ecosystem composition.
Vegetation changes threaten the wild flora of many European countries. The most
susceptible ecosystems are heathlands with lichen cover and. low meadow vegetation
types without any addition of artificial fertilizers. The response of the ecosystems to
nitrogen is, however, not unlimited. Increasing input of nitrogen will eventually lead to
a situation where other factors, such as other nutrients, water or sunlight may become
limiting for production. High nitrogen inputs may lead to increased sensitivity to frost
and nutrient imbalances. Increase in nitrogen concentration in leaves or needles may
lead to a decrease in frost hardines. Increased frost damage in Scots pine trees is
associated with nitrogen concentrations in the needles above 2 % .
The accumulation of ammonium in the soil resulting from the deposition of ammonia,
appears to inhibit nutrient uptake by many coniferous trees. Imbalanced nutrient
concentrations in the soil solution cause potassium and magnesium deficiencies the
visible effect being chlorotic yellow-brown needles.

43
Table 17 Critical loads (eq ha-1 yr- 1) of acid deposition (sulfur) for surface waters (after Chadwick and Hutton, 1991).
location and characteristics critical load
Sweden
- shallow soils, low ionic strength 150
- glacial till, medium ionic strength 400
Swedish and Norwegian lakes and catchments 200
Switzerland 200-500
the Netherlands 250
eastern Canada and eastern USA 400
eastern USA most sensitive lakes
- Adirondacks, New York 340
- Catskills/Poconos 600
- Southern New England 350
- Central New England 570
- Maine 380
- N orthwestem Minnesota 620
- Upper peninsula of Michigan 200
- Upper Great Lakes area 310
USA, White Oak, Run, Virginia 750
Finnish lakes 200-1300
Norway
- precipitation 2000 mm 400
- precipitation 1000 mm 200

44
Table 18 Critical loads ( eq ha-1 yr- 1) of acid deposition for terrestrial and aquatic
ecosystems (after Chadwick and Hutton, 1991)
pollutant criteria critical load
sensitive non-sensitive
N uptake (and immobilization) 200-500 500-1400
s base cation weathering 100-500 500-2000
N+S uptake and weathering 300-1000 1000-3400
The importance of nitrogen as a plant nutrient is strongly suggestive that there is no
threshold below which an enhanced atmospheric nitrogen deposition will not influence
ecological processes. It may therefore be difficult to assign a critical load for nitrogen
deposition to semi-natural ecosystems. One of the problems is whether or not the loads
should be assessed on the most sensitive ecosystem in a particular region and whether
or not they should be assessed on the most sensitive processes or organisms within an
ecosystem. Another problem which is the most difficult, is to detect the change in
ecosystems which can be attributed to a particular nitrogen load. In addition, there is the
problem that variation in the proportion of NHx to NOx deposition may produce
different ecological effects for the same total nitrogen load. For example, NHx
absorption in the plant canopy may cause problems of pH regulation in leaves, because
primary assimilation of ammonia is usually confined to the roots, whereas many plants
reduce nitrate in their shoots.
Since tree growth may be limited not only by nutrient, but also by other stress factors
(e.g. water availability), it is recommended to calculate nitrogen uptake as the minimum
of the critical nitrogen uptake and the present uptake (Posch et al., 1993).
For managed forests UN-ECE (1990) suggests a nitrogen mass balance calculation
CL (N) =Nu+ Ni (crit.) + N1 (crit.)
where
CL (N) = critical load of nitrogen (kg N ha-I yr-1)
Nu= nitrogen uptake (kg N ha-I yr-1)

45
Ni (crit.) = critical nitrogen immobilization (kg N ha- I yr- 1)
N1 (crit.) = critical nitrogen leaching (kg N ha-1 yr-1)
Rihm et al. ( 1992) estimated critical loads of nitrogen for different ecosystems and
altitudes in Switzerland (Table 19). In these calculations denitrification by
microbiological activity is not taken into account.
The estimated critical nitrogen load is 1000-1500 eq ha-1 yr- 1, to avoid the nutrient
imbalance (Chadwick and Hutton, 1991). UN-ECE (1990) gives the critical load values
for natural vegetation as follows :
heathlands
raised bogs
coniferous forests
deciduous forests
7 - 10 kg N ha -1 yr-1
5 - 10 kg N ha-1 yr-1
10 - 12 kg N ha-1 yr-1
< 15 kg N ha -1 yr-1
The critical Nf4+-N load for Norway spruce is given as 60 - 120 kg N ha-1 yr-1
(Wilson, 1993). The critical nitrogen soil solution concentrations for some vegetation
changes are given in Table 20.
The critical loads of nitrogen with respect to eutrophication of raised bogs, dry
unfertilized meadows and forests mapped by Rihm et al. (1992) indicate that critical
load values for nitrogen are mostly exceeded in Switzerland. The most extreme
exceedances occur in the Swiss Plateau where the agricultural ammonia emissions and
N02 levels are high. These calculations give a strong indication that the present air
pollution burden on sensitive ecosystems is far beyond the limits to be considered as
biologically safe. This is the case for acid deposition and for nitrogen deposition with
respect to eutrophication.

46
Table 19 Critical loads of nitrogen for different ecosystems and altitudes in Switzerland
(after Rihm et al., 1992)
ecosystem altitude (m) critical load of nitrogen
[kg N ha-1 yr-1]
300 10
dry unfertilized meadows 1000 7
> 1000 7
300 10
raised bogs 1000 5
>1000 5
300 12
coniferous forests 1000 10
> 1000 10
deciduous forests all 15
Table 20 Suggested limiting concentrations of N for inducing vegetation changes ( after
Posch et al., 1993)
change
coniferous trees -♦ nutrient imbalance
deciduous trees -♦ nutrient imbalance
lichens -♦ cranberry
lingon -♦ blueberry
blueberry -+- grass
grass -+- herbs
[N] crit in mg N 1 -I
S0.2
S0.2 - 0.4
S 0.2 - 0.4
$;0.4 - 0.6
$; 1 - 2
S 3 - 5
Nitrogen accumulation on forest soils was studied in Schutzwald Project (BUW AL,
1996) using various methods taking the denitrification into account. The results
indicated that nitrogen load cannot be calculated only from the acidity load, because it
can also precipitate as NH4+ as well as N03-.

47
Groundwater
High nitrate concentrations in groundwater can be harmful to human health in areas
where groundwater is used for water supply. These problems occur in places where
intensive animal husbandary is active such as the Netherlands. The current EC drinking
water standard is 50 mg 1-1. The estimated critical nitrogen loads for the groundwater
beneath forests vary between 2200 eq ha -1 yr- 1 for coniferous forests and 3400 eq ha -I
yr-1 for deciduous forests (Chadwick and Hutton, 1991).
Surface water
The direct deposition of nitrogen as well as indirect inputs via leaching from the
surrounding catchment contribute to vegetation changes in oligotrophic surface waters.
Schuurkess et al. (1987) give a critical nitrogen load of 1400 eq ha-1 yr-1 for poorly
buffered pools and lakes.
A summary of the critical nitrogen loads is given in Table 21. For sensitive ecosystems,
critical nitrogen loads are higher than critical sulfur loads. Critical load values of
nutrient nitrogen assigned for various ecosystems in Switzerland are given in Table 22.
Table 21 Critical nitrogen deposition loads ( eq ha- 1 yr 1) for terrestrial and aquatic
systems ( after Chadwick and Hutton, 1991)
receptor effects criteria critical load
forest eutrophication vegetation changes 700-1400
forest frost damage N content in leaves 1000-2000 <1.8%
forest nutrient imbalances NJ4/Mg<5 1000-1500
groundwater nitrate leaching NO3 < 50 mg 1-1 2200-3400
surface water eutrophication increases in 1000-2000 nitrophilic species

48
Table 22 Critical load ranges of nitrogen (kg N ha- 1 yr- 1) assigned for various
ecosystem types in Switzerland (Downing et al., 1993)
ecosystem critical applicable ecosystems in Switzerland critical load load range assigned
Molinio-Pinion (Waldfoehrenwald auf 17 tonigem Boden, montan)
acidic (managed) 15-20 Ononido-Pinion (offener Kieferwald, 17 coniferous forest sehr trocken)
Cytiso-Pinion (Foehrenwald-Steppe) 17 Quercion robori-petraeae (bodensauerer 15 Eichen-B irken wald, naehrstoffarrn)
acidic (managed) < 15-20 Quercion pubesc.-petraeae (therrnophile 15 deciduous forest Eichen waelder)
Orno-Ostryon (Hopfenbuchwald) 15 lowland dry 15-20 none heathland lowland wet 17-22 none heathland species-rich low land 7-20 none heaths/acid grassland
Erico-Mugion (Bergfoehrenwald auf 10 Kalk, subalpin)
arctic and alpine 5-15 Erica-Pinion (Waldfoehrenwald auf 10 heaths Kalk, montan)
Calluno-Pinion (Foehrenwald auf Silikat, 10 montan) Mesobromion (Halbtrockenrasen, kollin 19
calcareous species- 14-25 u. unt. montan) rich grassland Andropogonetum grylii (Trockenrasen, 19
Steilhaenge) neutral-acid species- 20-30 Molinion (nasse Streu-Magerwiesen) 25 rich grassland
Seslerio-Bromion (Halbtrockenrasen, 12 ob. montan) Festucion spadiceae (subalpin kalkarm, 12 steile Trockenhaenge)
Montane-subal pine 10-15 Caricion ferrugineae (frische Rasen auf 12 grassland Kalk, subalpin)
Stipo-Poion xerophilae (Walliser 10 Schwingelrasen, Graubuenden) Oxytropido-Elynion (Gratrasen, alpin) 10 Seslerion coeruleae (Trockenrasen auf Kalle, subalpin-alpin) 10
shallow soft-water 5-10 Littorellion (flache, oligothrophe See- 7 bodies und Teichufer) Ombrotrophic bogs 5-10 Sphagnion fusci (Hochmoor) 7
Scheuchzerietalia (Scheuchzergras) 25 Mesotrophic fens 20-35 Caricion fuscae ( Braunseggenried) 25
Caricion davallianae (Davallseggenried) 25
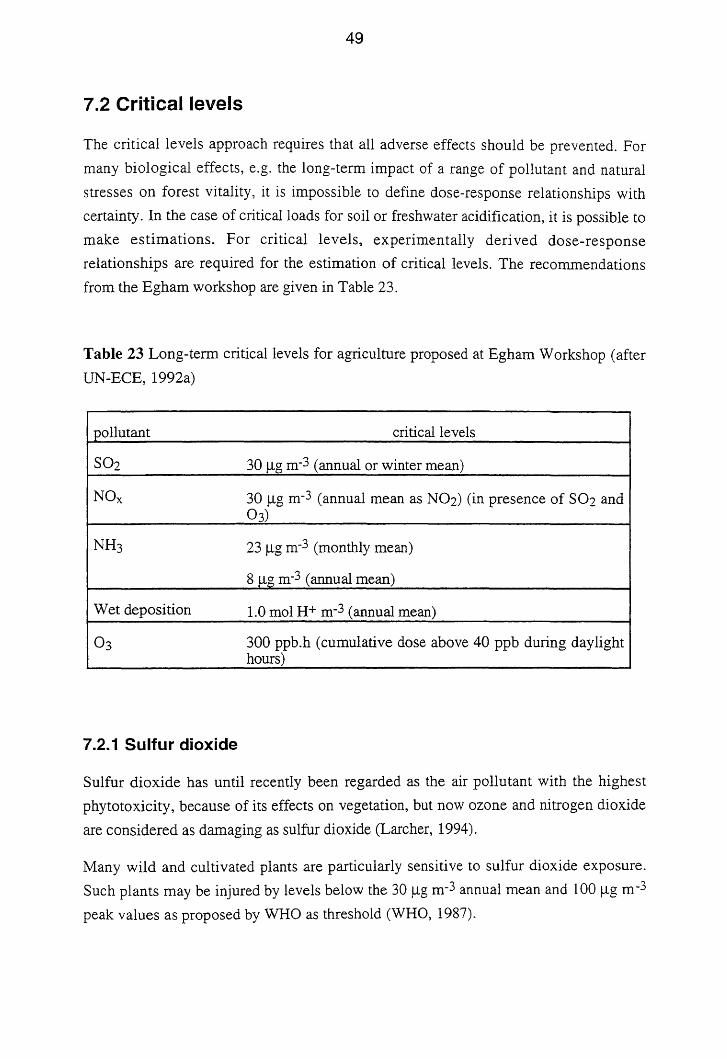
49
7 .2 Critical levels
The critical levels approach requires that all adverse effects should be prevented. For
many biological effects, e.g. the long-term impact of a range of pollutant and natural
stresses on forest vitality, it is impossible to define dose-response relationships with
certainty. In the case of critical loads for soil or freshwater acidification, it is possible to
make estimations. For critical levels, experimentally derived dose-response
relationships are required for the estimation of critical levels. The recommendations
from the Egham workshop are given in Table 23.
Table 23 Long-term critical levels for agriculture proposed at Egham Workshop (after
UN-ECE, 1992a)
pollutant critical levels
SO2 30 µg m-3 (annual or winter mean)
NOx 30 µg m-3 (annual mean as NO2) (in presence of SO2 and 03)
NH3 23 µg m-3 (monthly mean)
8 µg m-3 (annual mean)
Wet deposition 1.0 mol H+ m-3 (annual mean)
03 300 ppb.h (cumulative dose above 40 ppb during daylight hours)
7.2.1 Sulfur dioxide
Sulfur dioxide has until recently been regarded as the air pollutant with the highest
phytotoxicity, because of its effects on vegetation, but now ozone and nitrogen dioxide
are considered as damaging as sulfur dioxide (Larcher, 1994).
Many wild and cultivated plants are particularly sensitive to sulfur dioxide exposure.
Such plants may be injured by levels below the 30 µg m-3 annual mean and 100 µg m-3
peak values as proposed by WHO as threshold (WHO, 1987).

50
On the basis of the available experimental data, it is apparent that most horticultural and
agricultural plant species do not show adverse effects at sulfur dioxide concentrations
below 30 µg m-3. However, particularly sensitive species of trees, mosses, lichens and
grassland vegetation are already affected by concentrations of about 20 µg m-3. The
critical level for sulfur dioxide acting alone is set at 20 µg m-3 as an annual mean value
and 70 µg m-3 as a 24-hour mean value. Annual mean critical levels of sulfur dioxide
for some vegetation types are given in Table 24.
Table 24 Annual mean critical levels of S02 (after Hettelingh and de Leeuw, 1994)
ve
cyanobacterial lichens
forest, natural
a ricultural cro s
7.2.2 Ozone
critical level [ b]
3.8
7.6
11.4
Exposure-response relationships have been determined experimentally for various plant
species (Nussbaum et al., 1995, Bennett, 1979, Foster, 1979, Sanders et al., 1994). In
view of recent findings, it seems that the risk of damage to vegetation from ozone is
increased by the presence of other pollutants such as sulfur dioxide and nitrogen dioxide
(Bender and Weigel, 1994). Experimental studies have provided evidence for two
different critical levels for ozone which vary in timescale and effect (Sanders et al.,
1994):
- ( 1) a short-term critical level which when exceeded causes visible injury to develop
which may or may not result in growth changes.
(2) a long-term critical level, for example, for the growing season, which when
exceeded results in biomass or yield change.
Critical levels for short-term exposures to ozone are given in Table 25. The proposed
long-term critical level for ozone is expressed as cumulative exposure over the
threshold concentration of 40 ppb for both agricultural crops and forest trees. This
exposure index is referred to as AOT40. The AOT40 is calculated as the sum of the

51
differences between the hourly concentrations in ppb and 40 ppb for each hour when the
concentration exceeds 40 ppb. Critical levels for some agricultural crops and tree
species relevant to Swiss forests are shown in Table 26 as accumulated exposure over
the threshold of 40 ppb, AOT40. BUW AL (1996) reports AOT40 values for six forested
areas (Norway Spruce) in 1992, between 29.3 and 43.0 ppm·h which are all above the
critical level for this kind of forests. Recently, the use of AOT40 also for short-term
exposures was proposed and a provisional short-term critical level of an AOT40 of 700
ppb·h accumulated over 3 consecutive days has been suggested for visible injury
(Fuhrer and Achermann, 1994 ).
Table 25 Critical levels for short-term exposures to ozone (after Chadwick and Hutton, 1991)
exposure duration [h]
0.5
1.0
2.0
4.0
8.0
ozone concentration [ppm]
0.150
0.075
0.055
0.040
0.030
Table 26 Critical levels of ozone (24 h day- 1 for trees, daylight hours for crops, 1
growing season) for plant biomass ( 10 % decrease in plant biomass)
vegetation critical level (AOT40) reference [ppm·h]
beech 6 Kilppers et al., 1994
oak
beech 7 Braun and Fliickiger, 1994
birch 9 Matyssek et al., 1992
Norway spruce 12
Scots pine Kilppers et al., 1994
silver fir
wheat 5.3
beans 1.7 Fuhrer, 1994
pasture 6.3

52
Critical levels for ozone for the most sensitive receptors, which include some
agricultural crops, are probably exceeded throughout western Europe, and this is likely
to be a significant factor in future negotiations on VOC and NOx control (Ashmore,
1994).
7 .2.3 Nitrogen oxides
Among the various oxides of nitrogen in the atmosphere, nitrogen dioxide (N02), nitric
oxide (NO), and nitric acid (HNO 3) are the most important pollutants. Apart from direct
effects, nitrogen oxides affect vegetation indirectly by acting as precursors of
photochemical oxidants. Some research studies showed that the continuous exposure of
orange trees to 0.5 and 1.0 ppm of nitrogen dioxide for 35 days was reported to cause
severe defoliation and leaf chlorosis (Thompson, 1979). Exposure of the trees to 0.25
ppm and lower levels cause increased leaf drop and reduced fruit yield. The critical
levels for N02 for the decline of growth, vitality or quality in individual species lie
below 30 µg m-3 annual mean, 95 µg m-3 4-hour average.
A summary of the critical levels for the adverse effects of air pollutants on plants is
given in Table 27.
Table 27 Critical levels (µg m-3) for the adverse effects of air pollutants on plant
communities and ecosystems for short and long-term exposures (after Chadwick and
Hutton, 1991)
pollutant short-term duration long-term duration (annual average)
S02 70 (24h mean) 20
03 150 (lh mean) 50
N02 95 (95th percentile of 4h mean) 30

53
8 Summary and conclusion
Air pollution is now considered to be known as changing the ecosystems especially in
Europe and North America, as a result of acid deposition, photo-oxidant and nitrogen
accumulations. These events may lead to serious deterioration of terrestrial and aquatic
ecosystems. The severity, nature and rate of environmental deteriorations depend on the
pollution, climate and sensitivity of the ecosystems. The scope of the sub-project "Air
Pollution" in the frame of the GaBE Project which addresses health risks, environmental
impacts and economic aspects asssociated with the different energy sources and
technologies, is to establish a correlation between the emission rates of species released
into the atmosphere and the resulting concentration and load pattern. In order to
interpret the concentration and deposition data in terms of damage for the environment,
information about critical levels and loads for the pollutants and the relevant
ecosystems is required. Established critical loads and levels based on measurements and
observations of the effects of air pollutants can be used to indicate where reductions in
pollutant loadings and concentrations are required.
The task of setting specific critical levels is simplified by focussing on sensitive
receptors which are in many cases ecologically or economically important plant species.
The receptors for critical loads and levels are forests, surface waters, groundwaters,
sensitive plants and ecosystems. The air pollutants considered to be the most important
ones in Europe are sulfur dioxide, nitrogen oxides and ozone. At present, the critical
loads approach can be applied to the effects of sulfur and nitrogen compounds. For
Switzerland, mapping of critical loads of acidity had already been established.
Terrestrial and aquatic ecosystems in areas with slowly weathering parent rock material,
such as granite and quartzite, are most sensitive to acid deposition. Extensive regional
surface water acidification has been reported in geologically sensitive areas with poorly
buffered waters. Such areas are located in Nordic countries, central Europe, the United
Kingdom and North America. Some acidified aquatic ecosystems show certain potential
for recovery. In the case of terrestrial ecosystems, recovery is likely to be slower ( e.g.
forests).
Regional soil acidification caused by anthropogenic sulfur and nitrogen occurs often in
sensitive, naturally acidic soils. Epiphytic lichens represent the plant community most
sensitive to S02 pollution and possibly to substrate acidification. There is little evidence
that the acidity of ambient precipitation alone has adverse effects on agricultural crops
either by direct contact with the foliage or via the soil. On the other hand, there is

54
accumulating evidence of reductions in growth and yield of sensitive agricultural crops
as a result of ozone and sulfur dioxide pollution at various European locations.
Gaseous air pollutants alone and especially with other pollutants can also damage trees
as a result of foliar uptake representing a threat to forests on soils not susceptible to
acidification.
Acute symptoms of injury from various pollutants in different horticultural and
agricultural groups are visible on the affected plant. Symptoms produced include
chlorosis, necrosis, abscission of plant parts, and effects on pigment systems. Major
pollutants which produce such injuries are sulfur dioxide, peroxyacetyl nitrate,
fluorides, chlorides, nitrogen dioxide, ozone and particulate matter; minor pollutants are
ethylene, chlorine, ammonia, and hydrogen chloride.
The biological effects of repeated exposure to low levels of air pollutants are defined as
chronic damages. The symptoms are reduced growth, leaf size, stem length, root
weight, flower production, and delay in the onset of floral initiation. This kind of
reduction in total plant growth or population growth is distinguished from acute effects
which in general, cause injury to plants or plant parts, but do not necessarily affect the
total growth.
At several sites of Europe, ozone concentrations are sufficiently high to induce visible
injury and yield reductions in some crops. Critical levels for ozone for the most
sensitive receptors, which include some agricultural crops, are probably exceeded
throughout western Europe, and this is likely to be a significant factor in future
negotiations on VOC and NOx control. Ozone exposure-response functions for various
crop species obtained from the experiments carried out in several countries can be used
to calculate the relative yield loss of a particular species due to the elevated ambient
ozone concentrations. This kind of estimations performed for the years 1987 and 198 8
in Switzerland indicated that ozone is the only possible risk factor of importance for
crop loss whereas hydrogen fluoride is of local importance. The highest yield loss due
to ozone was calculated for pastures and grapevines and lowest for the field vegetables
and corn. However, the uncertainty concerning the response of Swiss crops to ozone as
compared to foreign crops for which the exposure-response functions were derived, has
to be taken into account in this kind of calculations.
Several countries agreed on using the long-term critical level for ozone as cumulative
exposure over the threshold concentration of 40 ppb, AOT40. For agricultural crops, the

55
AOT40 is calculated for daylight hours, defined as those hours with a mean global
radiation of 50 W m-2 or greater, and for three months.
A short-term critical level is defined provisionally for the development of visible injury
on crops. This level was set as AOT40 of 700 ppb · h accumulated over 3 consecutive
days. The critical level for ozone for the European forest trees is at the moment, AOT40
of 10 ppm · h. It is calculated for 24 hours a day during a 6-month period.
Critical levels from direct adverse effects of air pollutants on sensitive plants, plant
communities and ecosystems include among others : 20 µg m-3 as an annual mean value
for sulfur dioxide, 30 µg m-3 as an annual mean value for nitrogen dioxide in the
presence of varying concentrations of sulfur dioxide and ozone, 150 µg m-3 as a 1-hour
mean for ozone, and 100 µg m-3 as a monthly mean for ammonia.
Although the primary scope of this report was to review the impacts of air pollutants on
ecosystems, the impacts on the human health and materials were also briefly reviewed.
The health effects of summer- and winter-type smog exposure and the limits of
pollutants recommended by the World Health Organization are evaluated. The damage
types caused by various air pollutants on several materials such as metals, stones,
polymers, natural and man-made silicates were reviewed and the corrosion mechanisms
were briefly discussed.
Acknowledgements
I gratefully acknowledge the valuable comments of J. Keller and W. Graber on the
manuscript.

56
References
Ackermann-Liebrich U., Rapp R., Conzelmann C. (1993) "Luftverschmutzung und
Gesundheit III" Schriftenreihe Umwelt, No. 211, Bundesamt filr Umwelt, Wald und
Landschaft (BUW AL), Bern
Andreani-Aksoyoglu S. and Keller J. (1994) "Estimates of the natural non-methane
VOC emissions from vegetation in Switzerland". In "Air Pollution II" Volume 2 :
"Pollution Control and Monitoring". Eds. Baldasano J.M., Brebbia C.A., Power H.,
Zannetti P., pp. 115-122, Computational Mechanics Publications
Andreani-Aksoyoglu S. and Keller J. (1995) "Estimates of monoterpene and isoprene
emissions from the forests in Switzerland". J. Atmos. Chem., 20, pp. 71-87
Andreani-Aksoyoglu S., Graber W.K. and Keller J. (1995a) "Preliminary simulation of
a summer smog situation in Switzerland using the Urban Airshed Model (U AM)" In
"Air Pollution III" Volume 1 "Air Pollution Theory and Simulation" Eds. Power H.,
Moussiopoulos N ., Brebbia C.A., pp. 343-350, Computational Mechanics Publications
Andreani-Aksoyoglu S., Graber W.K. and Keller J. (1995b) "Three dimensional
modeling of photochemical air pollution in Switzerland and comparison with a multi
parcel Lagrangian model". (submitted to J. A. W. M.A.)
Ashmore M.R. (1994) "Critical levels and agriculture in Europe" In "Critical levels for
ozone" I.Fuhrer and B.Achermann (eds.) pp. 22-40, Report from a UN-ECE Workshop
held at Bern, Switzerland, 1-4 November, 1993, published by the Swiss Federal
Research Station for Agricultural Chemistry and Environmental Hygiene,
Schriftenreihe der FAC, Nr. 16, Liebefeld, Bern
Bak.er J.P. and Schofield C.L. (1980) "Aluminum toxicity to fish as related to acid
precipitation and Adirondack surface water quality" In Proceedings of an International
Conference "Ecological impact of acid precipitation", pp. 292-293, Sandefjord,
Norway, March 11-14, 1980, D.Drablos and A. Tollan (eds.)
Banwart W.L., Porter P.M., Ziegler E.L., and Hassett J.J. (1988) "Growth parameter
and yield component response of field corn to simulated acid rain" Environmental and
Experimental Botany, 28, pp. 43-51
Bender J. and Weigel H.-J. (1994) "The role of other pollutants in modifying plant
responses to ozone" In "Critical levels for ozone" J.Fuhrer and B.Achermann (eds.) pp.
57
240-246, Report from a UN-ECE Workshop held at Bern, Switzerland, 1-4 November,
1993, published by the Swiss Federal Research Station for Agricultural Chemistry and
Environmental Hygiene, Schriftenreihe der FAC, No. 16, Liebefeld, Bern
Bennett J.P. (1979) "Effects of air pollutants on vegetable crops grown in the San
Joaquin Valley" In "Proceedings of Air Pollution and Agriculture Seminar" pp. 53-62,
Bakersfield, CA
Braun S. and Fliickiger W. ( 1994) "Critical levels of ambient ozone for growth of tree
seedlings" In "Critical levels for ozone" J.Fuhrer and B.Achermann (eds.) pp. 88-97,
Report from a UN-ECE Workshop held at Bern, Switzerland, 1-4 November, 1993,
published by the Swiss Federal Research Station for Agricultural Chemistry and
Environmental Hygiene, Schriftenreihe der FAC, No. 16, Liebefeld, Bern
BUW AL ( 1996) "Belastung des Gebirgswaldes : Ansatze zu einer Risiko Beurteilung.
Fallstudie im Urner Reusstal" BUW AL Report (in press)
Burki D. and Keller J. (1994) "GaBE/Air Pollution. Part 2: Concentrations of major air
pollutants in Switzerland and transboundary contributions" Technical Report TM-52-
94-03, PSI Villigen
CEC (1987) "The state of the environment in the European Community", EEC,
Luxembourg
Chadwick M.J. and Hutton M. (eds. ) (1991) "Acid deposition in Europe :
Environmental effects, control strategies and policy options" Stockholm Environment
Institute, Oxford
Chameides W .L. and Stelson A. W. (1992) "Aqueous-phase chemical processes in
deliquescent seasalt aerosols" Ber. Bunsenges. Phys. Chem. 96, No. 3, pp. 461-470
Cronan C.S. (1984) "Biogeochernical responses of forest canopies to acid precipitation"
In "Direct and indirect effects of acidic deposition on vegetation" R.A.Linthurst (ed.),
pp. 65-79, Butterworth Publishers
Dassler H.G. and Bortitz S. (eds.) (1988) "Air pollution and its influence on vegetation"
Dr W. Junk Publishers
Davidson C.I. and Wu Y.-L. (1990) "Dry deposition of particles and vapors" In "Acidic
Precipitation, Volume 3: Sources, deposition, and canopy interactions" Lindberg S.E.,
Page A.L., Norton S.A. (eds.), pp. 103-216, Springer-Verlag

58
Dietrich D.R. (1988) "Aluminum toxicity to salmonids at low pH". PhD. Thesis, ETH
No. 8715, Zurich
Dommen J., Neftel A., Sigg A., Jacob D.J. (1995) "Ozone and hydrogen peroxide
during summer smog episodes over the Swiss Plateau : Measurements and model
simulations" J. Geophys. Res., 100, No. D5, pp. 8953-8966
Downing R.J., Hettelingh J.-P., de Smet P.A.M. (eds.) (1993) "Calculation and mapping
of critical loads in Europe: Status report 1993" Coordination Center for Effects.
National Institute of Public Health and Environmental Protection, Bilthoven, the
Netherlands
Evans L.S., Lewin K.F., Patt M.J., Cunningham E.A. (1983) "Productivity of field
grown soybeans exposed to simulated acidic rain" New Phytol., 93, pp. 377-388
Feder W.A. (1973) "Cumulative effects of chronic exposure of plants to low levels of
air pollutants" In "Air pollution damage to vegetation" J.A.Naegele (ed.) pp. 21-30,
American Chemical Society, Washington D.C.
Finlayson-Pitts B.J. and Pitts J.N.Jr. (1986) "Atmospheric Chemistry" John Wiley &
Sons
Foster K.W. (1979) "Effects of air pollution on potatoes grown in California" In
"Proceedings Air Pollution and Agriculture Seminar", pp. 46-52, Bakersfield, CA
Fowler D., Cape J.N., Sutton M.A., Mourne R., Hargreaves K.J., Duyzer J.H., Gallaher
M.W. (1992) "Deposition of acidifying compounds" In "Acidification Research:
Evaluation and Policy Applications" T. Schneider (ed.), pp. 553-569, Elsevier Science
Publishers
Fuhrer J., Lehnherr B., Stadelmann F.X. ( 1989) "Luftverschmutzung und
landwirtschaftliche Kulturpflanzen in der Schweiz" Schriftenreihe der FAC, Liebefeld,
No. 3.
Fuhrer J. and Achermann B. (eds.) (1994) "Critical levels for ozone" Report from a UN
ECE workshop held at Bern, 1-4 November, 1993, published by the Swiss Federal
Research Station for Agricultural Chemistry and Environmental Hygiene,
Schriftenreihe der FAC, No. 16, Liebefeld, Bern
Fuhrer J. ( 1994) "The critical level for ozone to protect agricultural crops- An
assessment of data from European open-top chamber experiments" In ''Critical levels
for ozone" I.Fuhrer and B.Achermann (eds.) pp. 42-57, Report from a UN-ECE
59
Workshop held at Bern, Switzerland, 1-4 November, 1993, published by the Swiss
Federal Research Station for Agricultural Chemistry and Environmental Hygiene,
Schriftenreihe der FAC, No. 16, Liebefeld, Bern
Heath R.L. (1988) "Biochemical mechanisms of pollutant stress" In "Assessment of
crop loss from air pollutants" Heck W.W., Taylor O.C., Tingey D.T. (eds.) pp. 259-286,
Elsevier Science Publishers Ltd.
Henriksen A., Dickson W., Brakke D.F. (1986) "Estimates for critical loads for sulphur
to surface waters". In 11 Critical Loads for Nitrogen and Sulphur11• (ed. by J. Nilsson) pp.
87-120. Miljorapport 1988:11. Nordic Council of Ministers.
Hertstein U., Griinhage L., Jager H.-J. (1995) "Assessment of past, present, and future
impacts of ozone and carbon dioxide on crop yields" Atm. Environ., 29, No. 16, pp.
2031-2039
Hettelingh J.-P. and De Leeuw F.A.A.M. (1994) "Mapping critical loads and levels in
Europe 11 In "Critical levels for ozone" I.Fuhrer and B.Achermann (eds.) pp. 168-182,
Report from a UN-ECE Workshop held at Bern, Switzerland, 1-4 November, 1993,
published by the Swiss Federal Research Station for Agricultural Chemistry and
Environmental Hygiene, Schriftenreihe der FAC, No. 16, Liebefeld, Bern
Hirschberg S., Dones R., Kypreos S. (1994) "Comprehensive assessment of energy
systems : Approach and current results of the Swiss activities" Jahrestagung
Kerntechnik '94, 17-19 May, 1994, Stuttgart, Germany
Hogsett W.E., Tingey D.T., Lee E.H. (1988) "Ozone exposure indices : Concepts for
development and evaluation of their use" In "Assessment of crop loss from air
pollutants 11 Heck W.W., Taylor O.C., Tingey D.T. (eds.) pp. 107-138, Elsevier Science
Publishers Ltd.
Isidorov V.A. (1990) "Organic chemistry of the earth's atmosphere". Springer-Verlag,
Berlin, Heidelberg
Keller J., Andreani-Aksoyoglu S., and Joss U. (1995) "Inventory of natural emissions in
Switzerland". In "Air Pollution III" Volume 2 "Air Pollution Engineering and
Management" Eds. Power H., Moussiopoulos N., Brebbia C.A., pp. 339-346,
Computational Mechanics Publications

60
Keller J. and Andreani-Aksoyoglu S. (1994) "GaBE/Air Pollution. Part 1 : Properties,
emissions, exposure limits and impacts of air pollutants" Technical Report TM-52-94-
01, PSI Villigen
Kreiser A.M., Patrick S.T., Battarbee R.W. (1993) "Critical acidity load for UK
freshwaters- Introduction, sampling strategy and use of maps" In "Critical Loads :
Concept and Applications 11 Hornung M. and Skeffington R.A. (eds.), pp. 94-98,
Institute of Terrestrial Ecology,
Ki.ippers K., Boomers J., Hestermann C., Hanstein S., Guderian R. (1994) ''Reaction of
forest trees to different eposure profiles of ozone-dominated air pollution mixtures" In
"Critical levels for ozone" I.Fuhrer and B.Achermann (eds.) pp. 98-110, Report from a
UN-ECE Workshop held at Bern, Switzerland, 1-4 November, 1993, published by the
Swiss Federal Research Station for Agricultural Chemistry and Environmental Hygiene,
Schriftenreihe der FAC, No. 16, Liebefeld, Bern
Larcher W. (1994) "Okophysiologie der Pflanzen" Verlag Eugen Ulmer GmbH & Co.
Stuttgart
LRV (1992) "Luftreinhalte-Verordnung" Bundesamt fur Umwelt, Wald und Landschaft,
Bern
Matyssek R., Giinthardt-Georg S., Saurer M., Keller T. (1992) "Seasonal growth, 813C
in leaves and stem and phloem structure of birch (betula pendula) under low ozone
concentrations". Trees, .6, pp. 69-7 6
Matzner E. (1992) 11 Acidification of forests and forest soils: Current status" In
"Acidification Research. Evaluation and Policy Applications" T. Schneider (ed.) pp. 77-
86, Elsevier Science Publishers.
McCormick J. (1989) "Acid Earth : The global threat of acid pollution" London,
Earthscan Publications Ltd., London
McLeod A.R. and Skeffington R.A. ( 1995) "The Liphook forest fumigation project : An
overview" Plant, Cell and Environment, 18., pp. 327-335
Middleton J.T., Kendrick J.B., Schwalm H.W. (1950) "Injury to herbaceous plants by
smog or air pollution" Plants Dis. Rep., 34, pp. 245
Miller J.E. (1988) "Effects on photosynthesis, carbon allocation, and plant growth
associated with air pollutant stress". In "Assessment of crop loss from air pollutants 11

61
W.W.Heck, O.C.Taylor, D.T.Tingey (eds.), pp. 287-314, Elsevier Science Publishers,
London and New York
Mudd J.B. (1973) "Biochemical effects of some air pollutants on plants" In "Air
pollution damage to vegetation" Naegele J.A. (ed.) pp. 31-47, Advances in Chemistry
Series, No. 122, American Chemical Society, Washington D.C.
Nilsson J. and Cowling E. (1992) "A comparison of some national assessments" In
"Acidification Research. Evaluation and Policy Application" T. Schneider (ed.), pp.
463-517, Elsevier Science Publications
Nussbaum S., Geissman M., Fuhrer J. (1995) "Ozone exposure-response relationships
for mixtures of perennial ryegrass and white clover depend on ozone exposure patterns"
Atmos. Environ., 29, No.9, pp. 989-995
Pell E.J. and Puente M. ( 1987) "Impact of simulated acid rain on yield of a field-grown
oat crop" Environmental and Experimental Botany, 27, pp. 403-407
Pell E.J ., Arny CJ., and Pearson N .S. (1987) "Impact of simulated acidic precipitation
on quantity and quality of a filed-grown potato crop" Environmental and Experimental
Botany, 27, pp. 7-14
Porter P.M., Banwart W.L., Hassett J.J., Finke R.L. (1987) "Effects of simulated acid
rain on yield response of two soybean cultivars" J. Environ. Qual., 1.6., No 4, pp. 433-
437
Posch M., Hettelingh J.-P., Sverdrup H.U., Bull K., de Vries W. (1993) "Guidelines for
the computation and mapping of critical loads and exceedances of sulfur and nitrogen in
Europe" In "Calculation and mapping of critical loads in Europe : Status Report 1993"
Downing R.J., Hetteling J.-P., de Smet P.A.M. (eds.), pp. 25-38, Coordination Center
for Effects. National Institute of Public Health and Environmental Protection,
Bilthoven, the Netherlands
Prevot A. ( 1994) "Photooxidantien und Primarluftschadstoffe in der planetaren
Grenzschicht in der Schweiz nordlich und sildlich der Al pen". PhD. Thesis, ETH Zurich
Rihm B., Kunz S., Engel J. (1992) "Mapping critical loads for Switzerland" Working
Paper, Meteotest, Bern
Rihm B. (1994) "Critical loads and acidity for forest soils and alpine lakes" BUWAL
Report, Environmental Series, No. 234, Bern

62
Rogers H.H. and Dahlman R.C. (1993) "Crop responses to CO2 enrichment" Vegetatio,
104/105, pp. 117-131
Ryder E.J. (1973) "Selecting and breeding plants for increased resistance to au
pollutants" In "Air pollution damage to vegetation" Naegele J.A. (ed.) pp. 75-84,
Advances in Chemistry Series, No. 122, American Chemical Society, Washington D.C.
Sanders G., Balls G., Booth C. (1994) "Ozone critical levels for agricultural crops
Analysis and interpretation of the results from the UN-ECE International Cooperative
Programme for crops" In "Critical levels for ozone" J.Fuhrer and B.Achermann (eds.)
pp. 58-72, Report from a UN-ECE Workshop held at Bern, Switzerland, 1-4 November,
1993, published by the Swiss Federal Research Station for Agricultural Chemistry and
Environmental Hygiene, Schriftenreihe der FAC, No. 16, Liebefeld, Bern
Schlaepfer R. (1992) "Forest vegetation and acidification : A critical review" In
"Acidification research. Evaluation and Policy Applications". T. Schneider (ed.), pp.
27-44, Elsevier Science Publishers
Schuurkes J.A.A.R., Elbers M.A., Gudden J.J.F., and Roelofs J.G.M. (1987) "Effects of
simulated acid rain on acidification, water quality and flore of small-scale soft-water
systems. Aquatic Botany, 28, pp. 199-226
Smith W.H., Geballe G., Fuhrer J. (1984) "Effects of acidic deposition on forest
vegetation: Interaction with insect and microbial agents of stress" In "Direct and
indirect effects of acidic deposition on vegetation" R.A.Linthurst (ed.), pp. 33-49,
Butterworth Publishers
Stumm W. and Morgan J.J. (1981). "Aquatic Chemistry". John Wiley & Sons
Taylor O.C. (1973) "Acute responses of plants to aerial pollutants" In "Air pollution
damage to vegetation" J.A. Naegele (ed.) pp. 9-20. Advances in Chemistry Series, No.
122, American Chemical Society, Washington D.C.
Thomas M.D. (1961) In "Air Pollution". World Health Organization, Monograph Series
No.46
Thompson C.R. (1979) "Effects of air pollutants on tree and vine crops in California" In
"Proc. Air Pollution and agriculture seminar", pp. 63-65, Bakersfield, CA.
UN-BCE (1988) ECE Critical levels workshop final draft report, Bad Harzburg, Federal
Republic of Germany

63
UN-ECE (1990) Draft manual on methodologies and criteria for mapping critical
levels/loads and geographical areas where they are exceeded. Convention on Long
Range Transboundary Air Pollution, Task force on mapping, Geneva.
UN-ECE (1992a) UN-ECE Critical levels workshop report. Egham, UK, March 1992
UN-ECE (1992b) "Impacts of long-range transboundary air pollution", Air Pollution
Studies, No. 8, United Nations, New York
WHO (1987) "Air quality guidelines for Europe" WHO, Copenhagen
WHO (1992) "Acute effects on health of smog episodes" Report on a WHO meeting, 's
Hertogenbosch, Netherlands, 30 October-2 November 1990, WHO Regional
Publications. European Series; No. 43, World Health Organization Regional Office for
Europe, Copenhagen
Wilson E.J. (1993) "Current methods of calculating critical loads for nitrogen :
application to the excess nitrogen experiment with Norway spruce" In "Critical loads:
concept and applications" , Hornung M. and Skeffington R.A. (eds.), pp. 79-89,
Institute of Terrestrial Ecology

64
Glossary
air pollution : the gaseous and dust substances which can enter the air from
anthropogenic sources such as power plants, chemical factories, motor traffic, etc.
AOT40: Accumulated exposure to ozone Over a Threshold of 40 ppb (unit= ppb * h).
Calculated as the sum of differences between the hourly ozone concentrations in ppb
and 40 ppb for each hour when the concentration exceeds 40 ppb.
base cations : Ca2+, Mg 2+, and K + , they are taken up by the roots of plants as nutrients
biological response : the culmination of a series of events, physical, biochemical, and
physiological, beginning with pollutant uptake by the plant and ending with a
measurable biological effect on the plant.
critical levels : concentrations of pollutants in the atmosphere above which direct
adverse effects on receptors, such as plants, ecosystems or materials, may occur
according to the present know ledge.
critical load : a quantitative estimate of an exposure to one or more pollutants below
which significant harmful effects on specified sensitive elements of the environment do
not occur according to the present know ledge.
dose : a product of the concentration of the toxicant in the organism and the duration of
exposure to the concentration.
immision: a term used mainly in Germany to define the concentrations of air pollutants
at the site where they take effect.
regeneration capacity: the extent and speed with which the plant can regain its initial
state before exposure with regard to metabolism, formation of new leaf organs, etc.
tolerance : the capacity of plants to bear certain pollution effects.


