Impacts of an Unconditional Cash Transfer on Household Food and Nutrition Security in Malawi Kristen Brugh, 1 Gustavo Angeles, 1 Peter Mvula, 2 & Maxton Tsoka 2 Giving Cash to the Poor? Impacts of Africa’s Unconditional Cash Transfers APPAM 2015 Fall Research Conference The Malawi SCTP Evaluation Team 1 University of North Carolina at Chapel Hill 2 Centre for Social Research, University of Malawi
Transcript
Impacts of an Unconditional Cash Transfer on Household Food and Nutrition Security in Malawi
Kristen Brugh,1
Gustavo Angeles,1 Peter Mvula,2 & Maxton Tsoka2
Giving Cash to the Poor? Impacts of Africa’s Unconditional Cash Transfers
APPAM 2015 Fall Research Conference
The Malawi SCTP Evaluation Team1 University of North Carolina at Chapel Hill
2 Centre for Social Research, University of Malawi
Research Questions
Does the Malawi Social Cash Transfer Program (SCTP) have an impact on household food and nutrition security?
• Improve current economic vulnerability to food insecurity?
• Increase food consumption?
• Improve diet quality?
Summary
Does the Malawi Social Cash Transfer Program (SCTP) have an impact on household food and nutrition security?
• Improve current economic vulnerability to food insecurity?
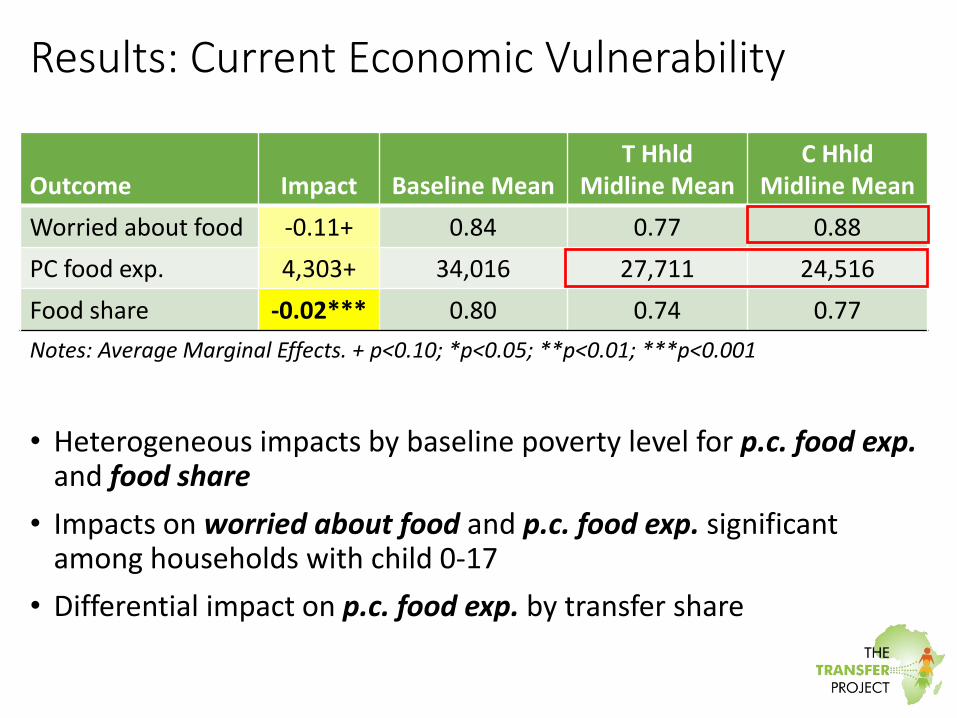
‒ Yes, weak evidence
• Less likely to worry about having enough food
• Increase expenditures on food
• Decrease food share
Summary
Does the Malawi Social Cash Transfer Program (SCTP) have an impact on household food and nutrition security?
• Increase food consumption?
‒ Yes, strong evidence
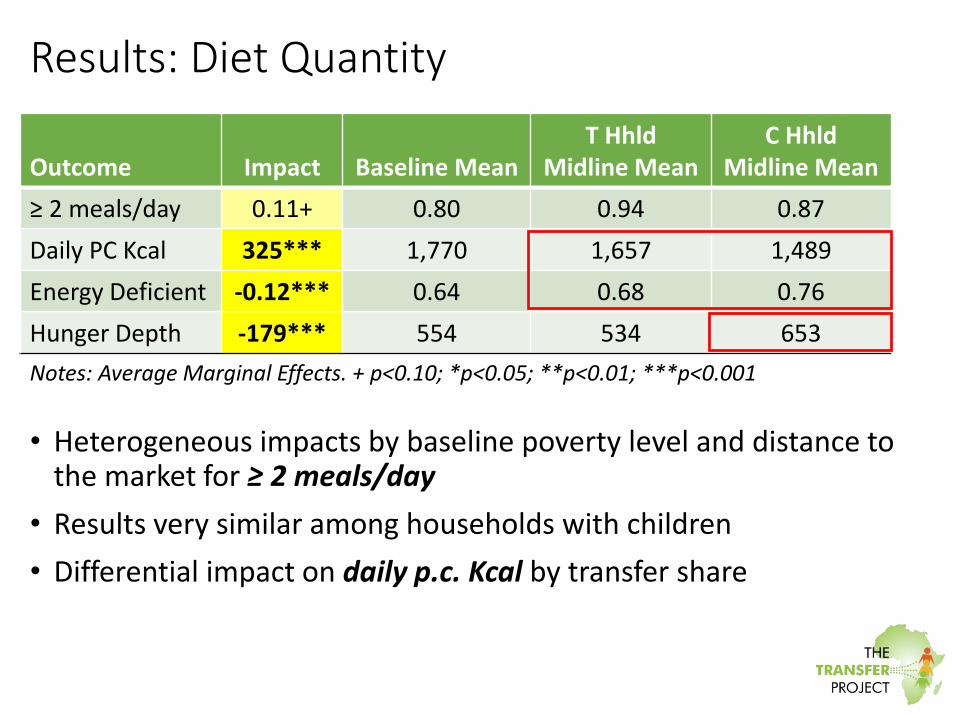
• More likely to have ≥2 meals/day
• Consume more calories
• Less likely to be food energy deficient
• Smaller hunger deficit
Summary
Does the Malawi Social Cash Transfer Program (SCTP) have an impact on household food and nutrition security?
• Improve diet quality?
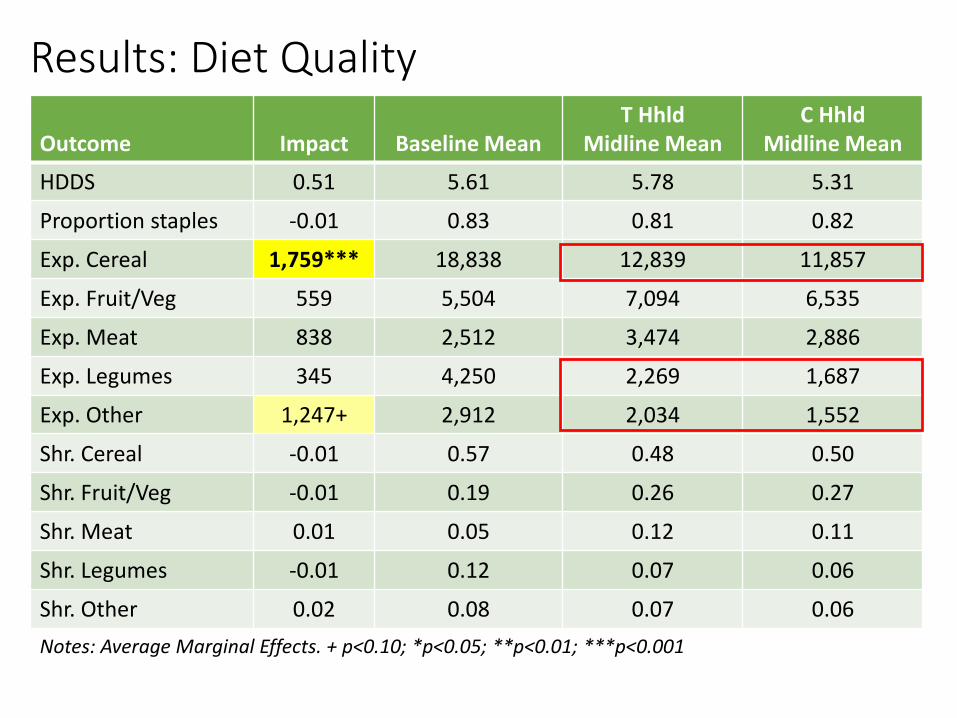
‒ No evidence
Theory of Change
Engel’s Law
• As income increases, household decreases its budget share of food
Bennett’s Law
• As income increases, households reduce food budget share of starchy staples and substitute toward fruits, vegetables, dairy, and meat
Poor households
• Higher expenditure elasticity for food
• Higher marginal utility for calories
Theory of Change
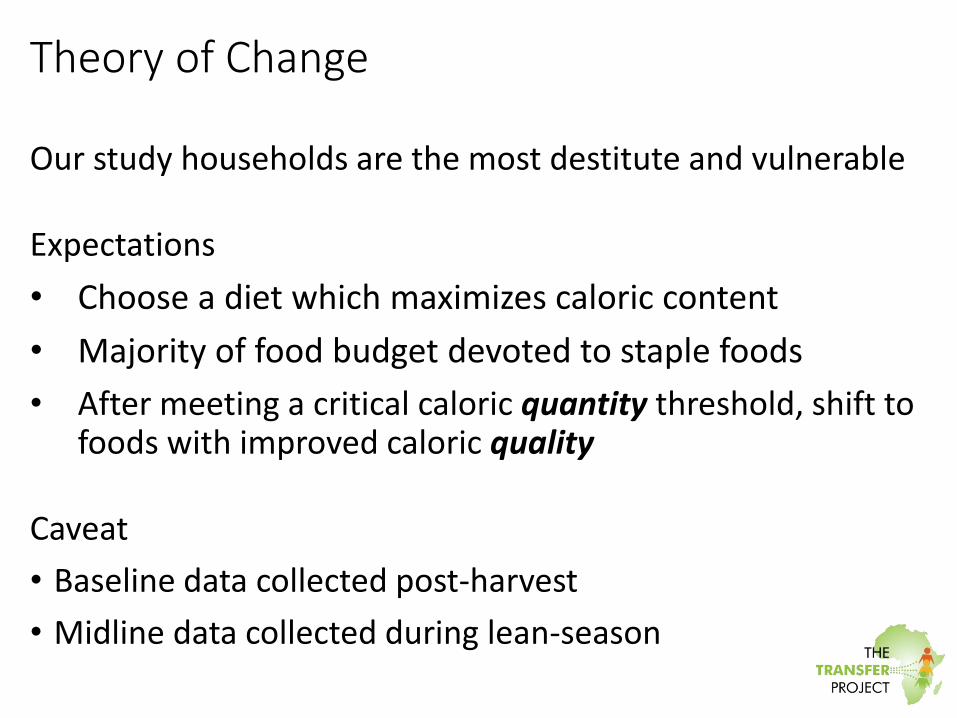
Our study households are the most destitute and vulnerable
Expectations
• Choose a diet which maximizes caloric content
• Majority of food budget devoted to staple foods
• After meeting a critical caloric quantity threshold, shift to foods with improved caloric quality
Caveat
• Baseline data collected post-harvest
• Midline data collected during lean-season
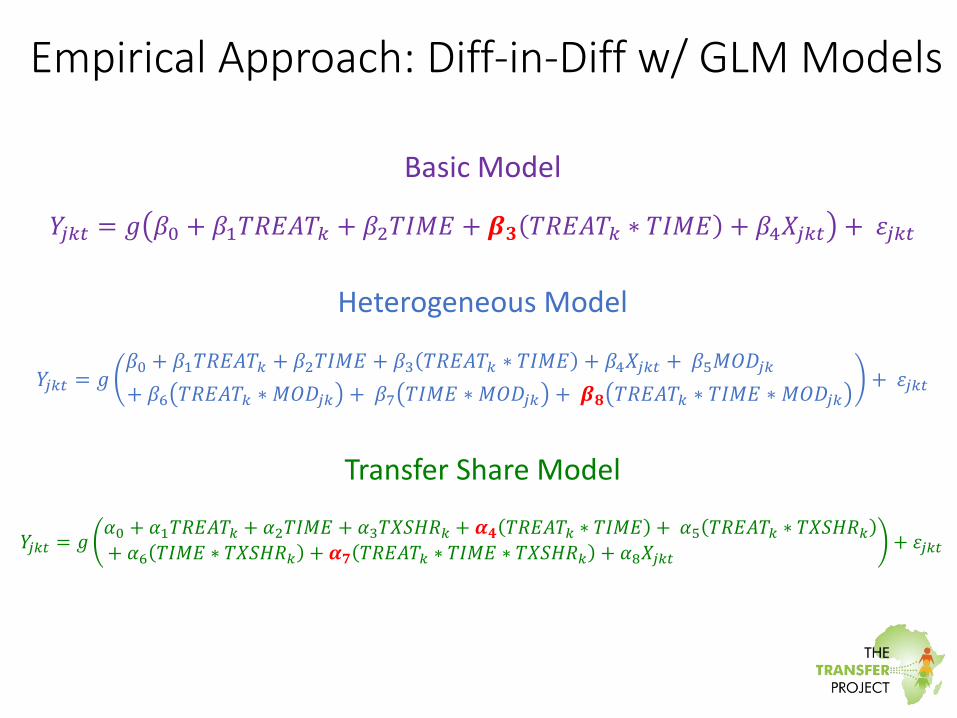
Empirical Approach: Outcome Measures
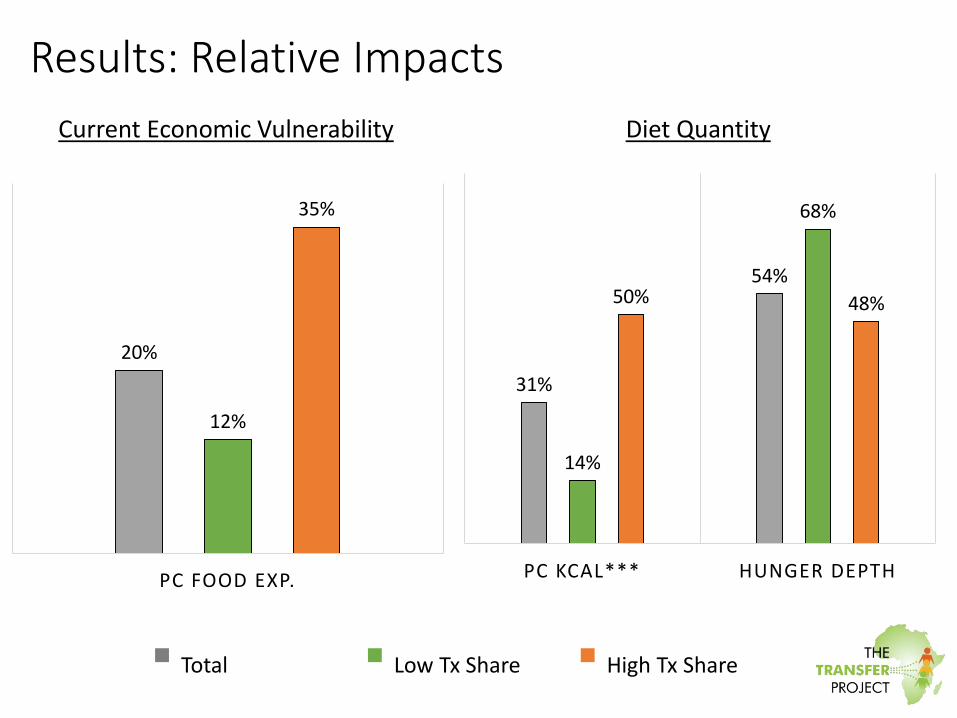
Current Economic Vulnerability• Worried not enough food during past week• Annualized real p.c. food expenditures (MWK Aug ‘13)• Food share
Diet Quantity• Consumed ≥ 2 meals/day• P.C. daily energy acquisition• Food energy deficient • Hunger Depth
Diet Quality • Household Diet Diversity Score (HDDS)• Proportion food energy from staples• Expenditures – 5 food groups• Food share – 5 food groups