POLICY BRIEF FEBRUARY 2021 IMPACTS OF COVID-19 ON LABOR MARKETS AND HOUSEHOLD WELL-BEING IN PAKISTAN: EVIDENCE FROM AN ONLINE JOB PLATFORM This brief uses the administrave database of Pakistan’s largest online job plaorm and an online COVID-19 survey to examine the gender impacts of the COVID-19 pandemic on labor markets and other well-being indicators. The analysis shows that the pandemic led to an unprecedented level of economic insecurity, resulng in widespread job loss, business closures, slowdown in business acvity, and reduced working hours. The sectors where women are more likely to be employed, such as educaon and health, were more severely affected, yet the post-pandemic recovery was faster for males. The pandemic has also led to a disproporonate increase in women’s unpaid care work, as well as increasing their reported rates of stress, anxiety and exposure to violence. These findings suggest that impacts resulng from COVID-19 might lead to further declines in women’s parcipaon in the economy in Pakistan, where women’s labor force parcipaon is already among the world’s lowest. SUMMARY The COVID-19 pandemic has caused unprecedented disrupons to labor markets around the world. As lockdowns were put in place to migate spread of the disease, economic acvity plummeted, resulng in large drops in employment in virtually every country. Internaonal organizaons have predicted that 158 to 242 million full-me jobs will be lost globally, and 71 million people will fall below the extreme poverty line in low-income countries (Asian Development Bank 2020; World Bank 2020). Economic shocks of this magnitude can have differing impacts on men and women, even if the net effects of the shock conceal these differences. Workers concentrated in sectors that are insulated from an economic shock may be protected during the crisis (Rubery 2010; Rubery and Rafferty 2013) and since most labor markets exhibit occupaonal segregaon by gender, effects on men and women can be different. Social norms can also affect the employment of men and women during crises. If norms dictate preservaon of men’s “breadwinner” status, when jobs get scarce, women are likely to bear the brunt, geng BACKGROUND Emcet O. Taş 1 , Tanima Ahmed 1 , Norihiko Matsuda 2 , and Shinsaku Nomura 1 1 World Bank, 2 Florida Internaonal University laid off in downswings and hired in upswings (Elson 2010). Since women are overrepresented in insecure, low-paying jobs, they are typically the first to be fired during crises (Cho and Newhouse 2011), but female labor force parcipaon can also grow if households that need the addional income ask female family members to look for work (Rubery 2010; Starr 2014). Economic crises can also worsen exisng gender inequalies and reinforce gender roles within households. Loss of income and employment oſten requires households to adjust expenditures to cope with the crisis. Since women usually have responsibility for the survival of household members, they may cut back on their consumpon or increase unpaid work as an alternave to purchasing household goods (Elson 2010). In countries where social norms perceive women as caregivers and men as breadwinners, women might face an added burden of unpaid work at home, including childcare and eldercare (Karamessini and Rubery 2013). During COVID-19, lockdowns that required adults to work from home and children to aend school remotely have added disproporonate amounts of unpaid work on women (United Naons 2020). Public Disclosure Authorized Public Disclosure Authorized Public Disclosure Authorized Public Disclosure Authorized
Transcript
POLICY BRIEFFEBRUARY 2021
IMPACTS OF COVID-19 ON LABOR MARKETS AND HOUSEHOLD WELL-BEING IN PAKISTAN: EVIDENCE FROM AN ONLINE JOB PLATFORM
This brief uses the administrative database of Pakistan’s largest online job platform and an online COVID-19 survey to examine the gender impacts of the COVID-19 pandemic on labor markets and other well-being indicators. The analysis shows that the pandemic led to an unprecedented level of economic insecurity, resulting in widespread job loss, business closures, slowdown in business activity, and reduced working hours. The sectors where women are more likely to be employed, such as education and health, were more severely affected, yet the post-pandemic recovery was faster for males. The pandemic has also led to a disproportionate increase in women’s unpaid care work, as well as increasing their reported rates of stress, anxiety and exposure to violence. These findings suggest that impacts resulting from COVID-19 might lead to further declines in women’s participation in the economy in Pakistan, where women’s labor force participation is already among the world’s lowest.
SUMMARY
The COVID-19 pandemic has caused unprecedented disruptions to labor markets around the world. As lockdowns were put in place to mitigate spread of the disease, economic activity plummeted, resulting in large drops in employment in virtually every country. International organizations have predicted that 158 to 242 million full-time jobs will be lost globally, and 71 million people will fall below the extreme poverty line in low-income countries (Asian Development Bank 2020; World Bank 2020).
Economic shocks of this magnitude can have differing impacts on men and women, even if the net effects of the shock conceal these differences. Workers concentrated in sectors that are insulated from an economic shock may be protected during the crisis (Rubery 2010; Rubery and Rafferty 2013) and since most labor markets exhibit occupational segregation by gender, effects on men and women can be different. Social norms can also affect the employment of men and women during crises. If norms dictate preservation of men’s “breadwinner” status, when jobs get scarce, women are likely to bear the brunt, getting
BACKGROUND
Emcet O. Taş1, Tanima Ahmed1, Norihiko Matsuda2, and Shinsaku Nomura1
1 World Bank, 2 Florida International University
laid off in downswings and hired in upswings (Elson 2010). Since women are overrepresented in insecure, low-paying jobs, they are typically the first to be fired during crises (Cho and Newhouse 2011), but female labor force participation can also grow if households that need the additional income ask female family members to look for work (Rubery 2010; Starr 2014).
Economic crises can also worsen existing gender inequalities and reinforce gender roles within households. Loss of income and employment often requires households to adjust expenditures to cope with the crisis. Since women usually have responsibility for the survival of household members, they may cut back on their consumption or increase unpaid work as an alternative to purchasing household goods (Elson 2010). In countries where social norms perceive women as caregivers and men as breadwinners, women might face an added burden of unpaid work at home, including childcare and eldercare (Karamessini and Rubery 2013). During COVID-19, lockdowns that required adults to work from home and children to attend school remotely have added disproportionate amounts of unpaid work on women (United Nations 2020).
Pub
lic D
iscl
osur
e A
utho
rized
Pub
lic D
iscl
osur
e A
utho
rized
Pub
lic D
iscl
osur
e A
utho
rized
Pub
lic D
iscl
osur
e A
utho
rized
2 | POLICY BRIEF
This note examines the gender impacts of the COVID-19 pandemic on labor markets and other well-being indicators in Pakistan, where women’s labor force participation is among the world’s lowest. Although women account for 49.2 percent of Pakistan’s population (Pakistan Bureau of Statistics, Labor Force Survey), their labor market participation is among the lowest in the world, especially in urban areas. The female labor force participation (FLFP) rate in Pakistan increased steadily from 13 percent in 1992 to 25 percent in 2015, before declining back to 23 percent in 2018. It remains considerably lower than the FLP for men, which has fluctuated around 82 percent for nearly three decades (Amir et al. 2018; Pakistan Bureau of Statistics 2019). Most of the increase in FLFP from 1992 to 2015 was fueled by unpaid work in agriculture in rural areas, while FLFP in urban areas remained almost unchanged, only rising from about 7 percent to 11 percent. Many explanations have been offered for the low FLFP in Pakistan’s urban areas, including limited human capital, concerns about women’s safety, mobility constraints, workplace discrimination, marriage, and disproportionate domestic responsibilities (Amir et al. 2018). Impacts resulting from COVID-19 might lead to further declines in women’s participation in the economy, as well as putting the limited gains of the last few decades at risk.
This brief uses two data sources to examine labor market trends pre- and post-COVID-19, and to identify the multidimensional impacts of the pandemic on businesses and households. COVID-19 was first confirmed in Pakistan at the end of February 2020, and the cumulative number of confirmed cases hit half a million by December 2020.1 As a containment measure, federal and provincial governments closed schools in mid-March and started a lockdown on March 21, 2020. The first lockdown lasted until May 9, 2020; thereafter, sporadic temporary lockdowns continued until the writing of this brief in early 2021. The analysis in this note covers the period until August 2020.
The first data source used in this brief is the administrative database of Pakistan’s largest online job platform. Rozee.pk contains information on about 75,000 job advertisements and 7.5 million job applicants for the periods January–August 2019 and January–August 2020. The administrative data provide detailed information on job advertisements placed by employers and job applications submitted by jobseekers, therefore capturing real transactions in the labor
DATA
market. Analysis of these data can inform decision making while traditional labor market data are being collected. This is important during an evolving pandemic, when quick decisions on response and recovery are needed. The main limitation of this dataset is that it represents a top segment of the labor market, primarily well-educated young people who live in cities and have access to the Internet.2
The second data source is an online COVID-19 survey of registered users of the Rozee.pk platform during July–August 2020. This specialized survey includes detailed information about the socioeconomic status and coping strategies of about 9,000 jobseekers and 500 employers.3 The survey uses Rozee’s registered users as its sampling frame, so it may not be representative of the entire labor force in Pakistan. Moreover, the number of observations is not uniform across questions because different parts of the survey were administered to three subsamples of users to manage survey length, and participants also had the choice of skipping the questions.
The rest of this note discusses descriptive findings using both datasets, as well as multivariate results from linear and multinomial probability models included in the Appendix.
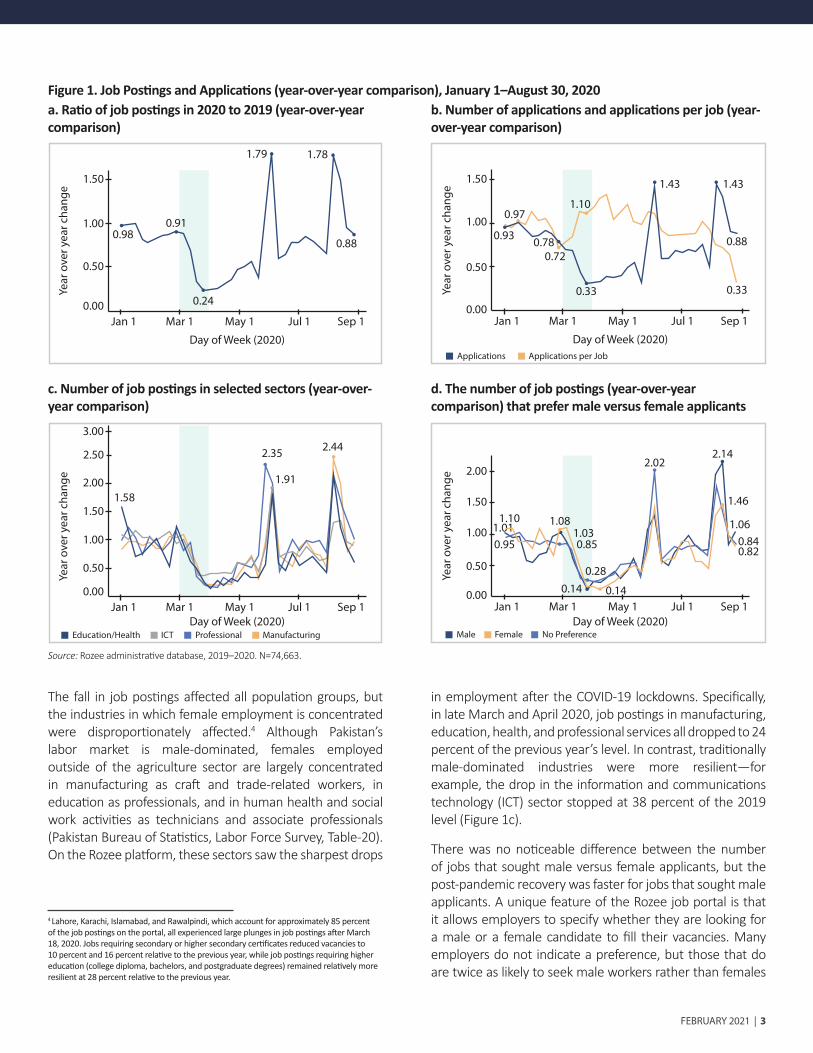
The pandemic resulted in a sudden drop in labor demand, as measured by the number of job advertisements, increasing the competition for jobs. When countrywide lockdown measures were introduced in mid-March 2020, the number of job advertisements plunged by 76 percent compared to the same period in 2019 (Figure 1a). Given that the number of job postings in February 2020 was at 91 percent of the previous year, the drop is clearly associated with the COVID-19 lockdown. With fewer jobs available, the number of job applications fell sharply to 33 percent of the previous year in the last week of March 2020, while the average number of applications per job increased, especially after March 18 (Figure 1b). In short, the labor market became increasingly competitive for jobseekers, a pattern that persisted even when the number of job advertisements recovered slightly to 36 percent of the previous year by the end of August 2020 (Figure 1a).
IMPACTS ON LABOR DEMAND
DECLINE IN JOB ADVERTISEMENTS
2 See Matsuda, Ahmed, and Nomura (2019) for a more detailed discussion about the demographic comparison between the Pakistan labor force survey and Rozee.pk’s online platform users. 3 The active users of Rozee.pk were sent reminders to participate in the survey until the desired number of observations was reached.
1 Government of Pakistan. “Pakistan Confirmed Cases.” https://covid.gov.pk/stats/pakistan (accessed January 4, 2021).
The fall in job postings affected all population groups, but the industries in which female employment is concentrated were disproportionately affected.4 Although Pakistan’s labor market is male-dominated, females employed outside of the agriculture sector are largely concentrated in manufacturing as craft and trade-related workers, in education as professionals, and in human health and social work activities as technicians and associate professionals (Pakistan Bureau of Statistics, Labor Force Survey, Table-20). On the Rozee platform, these sectors saw the sharpest drops
Jan 1 Mar 1 May 1 Jul 1 Sep 1
Day of Week (2020)
0.00
0.50
1.00
1.50
0.980.91
0.24
1.79 1.78
0.88
Jan 1 Mar 1 May 1 Jul 1 Sep 1
Day of Week (2020)
0.00
0.50
1.000.93 0.78
0.33
0.88
0.33
1.431.43
1.10
0.72
0.97
1.50
Applications Applications per Job
Figure 1. Job Postings and Applications (year-over-year comparison), January 1–August 30, 2020
Jan 1 Mar 1 May 1 Jul 1 Sep 1Day of Week (2020)
0.00
0.50
1.00
1.501.58
Jan 1 Mar 1 May 1 Jul 1 Sep 1Day of Week (2020)
0.00
0.50
1.001.10
1.50
2.00
2.50
3.00
1.91
2.35 2.44
Education/Health ICT Professional Manufacturing
2.00
Male Female No Preference
0.951.01 1.08
0.851.03
0.140.28
0.14
2.022.14
1.46
1.060.840.82
in employment after the COVID-19 lockdowns. Specifically, in late March and April 2020, job postings in manufacturing, education, health, and professional services all dropped to 24 percent of the previous year’s level. In contrast, traditionally male-dominated industries were more resilient—for example, the drop in the information and communications technology (ICT) sector stopped at 38 percent of the 2019 level (Figure 1c).
There was no noticeable difference between the number of jobs that sought male versus female applicants, but the post-pandemic recovery was faster for jobs that sought male applicants. A unique feature of the Rozee job portal is that it allows employers to specify whether they are looking for a male or a female candidate to fill their vacancies. Many employers do not indicate a preference, but those that do are twice as likely to seek male workers rather than females
4 Lahore, Karachi, Islamabad, and Rawalpindi, which account for approximately 85 percent of the job postings on the portal, all experienced large plunges in job postings after March 18, 2020. Jobs requiring secondary or higher secondary certificates reduced vacancies to 10 percent and 16 percent relative to the previous year, while job postings requiring higher education (college diploma, bachelors, and postgraduate degrees) remained relatively more resilient at 28 percent relative to the previous year.
a. Ratio of job postings in 2020 to 2019 (year-over-year comparison)
b. Number of applications and applications per job (year-over-year comparison)
c. Number of job postings in selected sectors (year-over-year comparison)
d. The number of job postings (year-over-year comparison) that prefer male versus female applicants
4 | POLICY BRIEF
The onset of the pandemic was accompanied by a noticeable decline in employment and an increase in the number of people looking for jobs. The jobseekers sampled for the online COVID-19 survey confirmed that the labor market became tighter, as previously indicated by administrative data from Rozee.pk. The share of individuals working post-COVID-19 fell from 65 to 51 percent of respondents, while those looking for jobs increased from 68 to 88 percent of respondents (Figure 3). The magnitude of these changes is validated by multivariate analysis (Appendix Table 4) of the change in the probability of working and job search before and after COVID-19.
These labor market patterns were triggered by substantial job losses across urban Pakistan, with disproportional impacts on women and other vulnerable groups. Fifty-two percent of
IMPACTS ON LABOR SUPPLY
INCREASE IN UNEMPLOYMENT AND JOB SEARCH
(20 percent of jobs advertised seek males, compared to 9 percent that seek females). Job postings that sought men and women declined in the week of March 25, 2020, to 14 percent and 17 percent of the previous year’s levels, respectively. In August 2020, however, jobs preferring male applicants showed a more robust rebound than those preferring female applicants. In August, male-preferred jobs rebounded to 149 percent of the previous year, while female-preferred jobs rebounded to 114 percent (Figure 1d). The sectoral composition suggests that the first wave of job recovery mainly came from professionals and ICT, both male-dominated sectors, while the second wave of job recovery largely came from manufacturing.
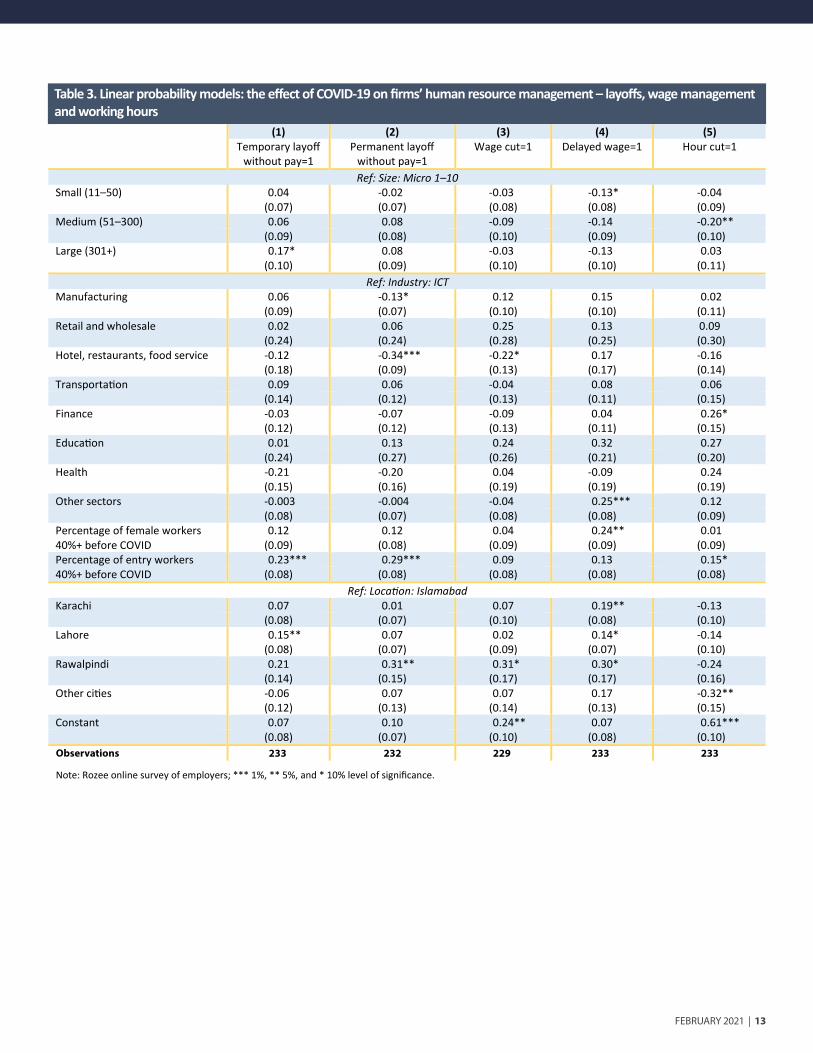
The online COVID-19 survey reveals more about the pandemic’s impacts on businesses across Pakistan, including closures, reduced working hours, and slowdown in business activity. The survey of employers shows that 32 percent of the businesses that responded were temporarily closed due to the pandemic, while another 8 percent were permanently closed (Figure 2a). Of the firms that remained open, 51 percent reduced their working hours (Figure 2d), 49 percent of the firms reported a reduction in the demand for their products, and 66 percent showed a decline in their revenues (Figure 2b). With the decrease in demand and revenue, 25 percent of the open businesses reported slowing down their activities either very much or immensely (multivariate models in Appendix Tables 1–3 show the determinants of business activity).
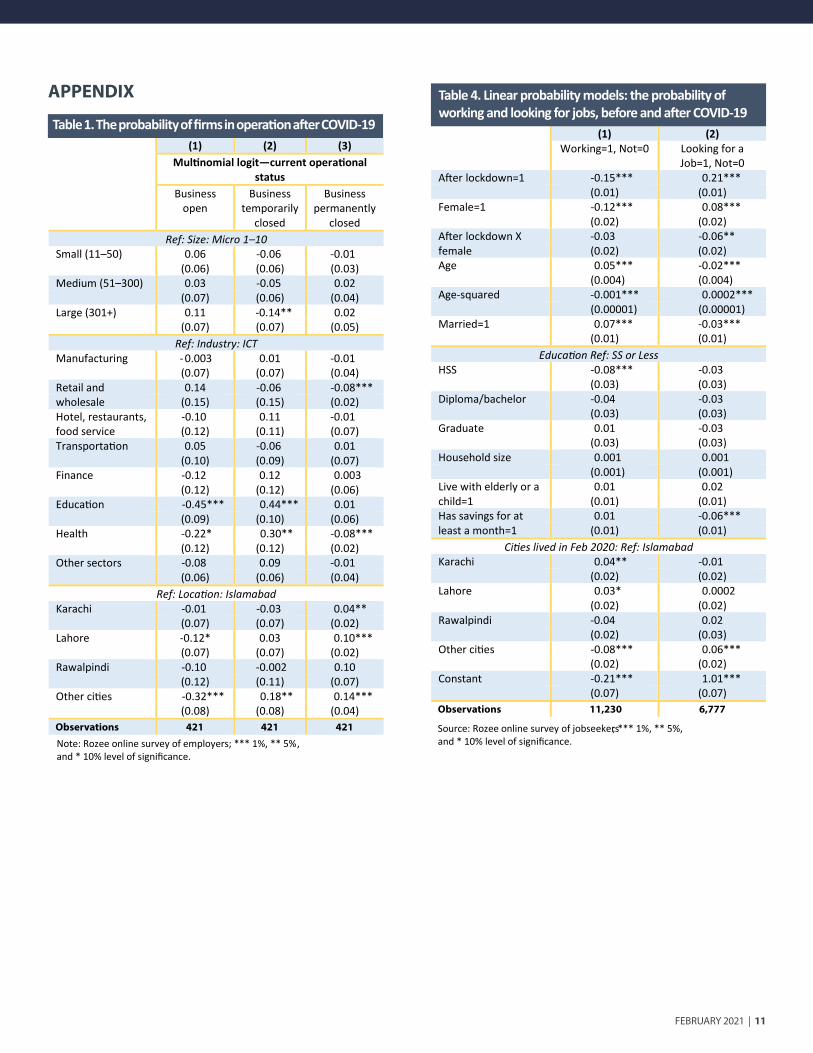
These impacts were disproportionately felt in the health industry, where women’s formal wage employment is heavily concentrated. In the online COVID-19 survey, 53 percent of the firms in the health industry reported being temporarily closed—among the highest rates for firms reporting temporary closures (Figure 2a). In addition, 89 percent of firms in the health industry reported worker absenteeism as a problem during the pandemic, which is the highest among firms reporting on that metric (Figure 2c). Multivariate findings confirm these patterns (see Appendix Tables 1 and 2).5 Taken together, these findings are consistent with reports documenting that healthcare services unrelated to COVID-19 slowed down, many primary health care services were suspended, and the low-paid health care jobs held
REDUCED BUSINESS ACTIVITY
by female workers (such as community health workers, vaccinators, and midwives) did not operate fully during the pandemic (World Health Organization 2020).
The education industry is another sector where females’ formal employment is heavily concentrated, and where the impacts of the pandemic have been severe.6 The online COVID-19 survey of employers indicates that 69 percent of the companies in the education sector were temporarily closed—the highest among all industries—and another 12 percent were permanently closed (Figure 2a).7 Those that remained open during the pandemic reported a fall in their revenues (67 percent), slowdown in their activities (50 percent), and decline in the demand for their services (50 percent) (Figure 2b). Further, they reported difficulties in operation due to workers’ absenteeism (67 percent) (Figure 2c).8 As a result, the education industry implemented some of the toughest measures against their employees, together with the retail and wholesale and health industries. Two-thirds of the education firms cut working hours, one-half delayed wage payments to their employees, one-third cut wages, and another one-third implemented permanent layoffs (see Figure 2d).
6 According to the World Development Indicators (WDI), women’s share in primary school teaching was 55.6 percent in 2019. The WDI indicator includes both public and private schools, while most education institutions on the Rozee platform were private. 7 The multinomial logit estimates suggest that educational institutes were 45 percentage points less likely than the reference ICT industry to be open, as well as 44 percentage points more likely to be temporarily closed (Appendix, Table 1). 8 The linear probability model shows that, compared to ICT businesses (reference category), firms in the education industry were 55 percentage points more likely to report slowdown in activities and 46 percentage points more likely to report worker absenteeism as an issue (Appendix, Table 2).
5 The multinomial logit estimation controlling for firm size, industry, and location shows that, compared to ICT businesses (reference category), firms in the health industry were 30 percentage points more likely to be temporarily closed in the period between April and August 2020 (Appendix, Table 1). In addition, in a linear probability model, firms in the health industry were 30 percentage points more likely than the reference ICT sector firms to report worker absenteeism as a problem during the pandemic (Appendix, Table 2).
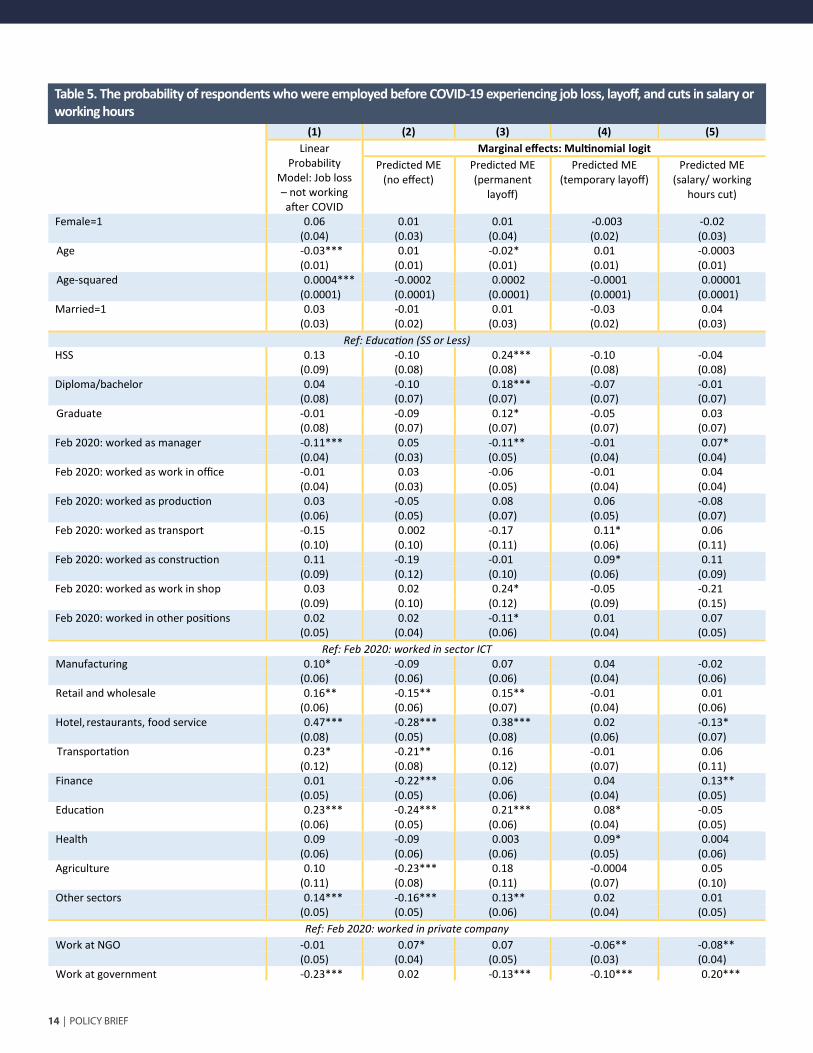
the individuals who reported working before COVID-19 were no longer working when the online survey was conducted in July–August 2020 (Figure 5). Of this group, 46 percent experienced permanent layoffs, 13 percent experienced temporary layoffs, and 26 percent experienced cuts in their salary or working hours (Figure 4). Women were more likely to lose their jobs than men—a greater share of previously employed female respondents (59 percent) reported that they lost their jobs after the pandemic, compared with previously employed male respondents (50 percent). Job losses also hit other vulnerable groups, including those living in secondary cities, as well as low-skilled or entry-level workers who had the highest rate of job loss (managers had the lowest).9,10
Job losses were substantial in the education sector, which employs a high share of women, but male-dominated sectors such as hotels, restaurants, food service, and transportation also were hit hard. In the survey of jobseekers, 64 percent of individuals who worked in the education sector reported
FEBRUARY 2021 | 5
Manufacturing
ICT
All
Retail and wholesale
Hotel, restaurant, food services
Transportation
Finance
Education
Health
Other sectors
Open Temporarily closed Permanently closed
60
68
64
78
59
73
50
19
47
59 35
53
69
38
18
35
22
27
25
32 8
7
9
0
12
12
6
0
Manufacturing
ICT
All
Retail and wholesale
Hotel, restaurant, food services
Transportation
Finance
Education
Health
Other sectors
Demand lowered Revenue lowered Activity: slowed a lot
49 66 25
9
6
41 58 20
59 71 26
71 86 43
60 60 25
71 65 13
39 33
50 67 50
33 1775
50 80 34
36
Manufacturing
ICT
All
Retail and wholesale
Hotel, restaurant, food services
Transportation
Finance
Education
Health
Other sectors
Worker absenteeism Rise in price of raw materials (if used)
c. Share of open firms that experienced input disruptions d. Share of open firms that laid off workers, cut salary/working hours and/or delayed wages
Source: Rozee online COVID-19 survey of employers. N=433 (panel a), N=216 (panel b), N=126 (panel c), and N=263 (panel d).
Working Looking for a job
100
80
60
40
20
0Before
lockdownBefore
lockdownBefore
lockdownAfter
lockdownAfter
lockdownAfter
lockdownAll Women Men
65 68
51
88
54
75
39
91
69 6655
87
Figure 3. Share of respondents working and looking for jobs, before and after COVID-19
losing their jobs. Meanwhile, 79 percent of those working in hotels, restaurants, and food services and 76 percent of those working in transportation lost their jobs (Figure 5). The linear and multinomial probability models indicate that people who worked in the female-dominated education sector were 23 percentage points more likely to lose their jobs compared to those in the ICT sector. Those working in hotels, restaurants, and food services were 47 percentage points more likely to lose their jobs than those in the ICT sector (Appendix Table 5).
Source: Rozee online COVID-19 survey of jobseekers. N=2,388 (before lockdown) and N=6,182 (after lockdown).
9 The effect of the pandemic on job losses was lower in cities like Islamabad, Karachi, Lahore, and Rawalpindi than in other urban centers (Appendix, Table 5). 10 The multinomial logit estimates show that individuals who worked in shops are 24 percentage points more likely to have experienced permanent layoffs compared to individuals who worked in the ICT sector (reference category). In addition, managers had the lowest likelihood of job loss and the lowest likelihood of permanent layoffs (see Appendix, Table 5).
6 | POLICY BRIEF
The labor market effects of COVID-19 were accompanied by coping strategies to mitigate the impact of income loss on household well-being. Due to work loss during COVID-19, 68 percent of females and 61 percent of males in the online COVID-19 survey reported a reduction in household income (Figure 6a). Women who were employed during COVID-19 were 11 percentage points more likely to report a decline in household incomes than men (Appendix Table 6). In addition, women who were employed were more likely than men to report redistribution of household expenditures to cope with the loss of income, possibly to support food consumption by other household members. For example, 93 percent of employed women reported reducing spending on meals, durables, clothes, education, or tobacco, as opposed to 89 percent of employed men (Figure 6b), a difference confirmed by a linear probability model (Appendix Table 6). Despite their responsibility for household maintenance on shrunk budgets, women were 10 percentage points less
IMPACTS ON HOUSEHOLD WELL-BEING
LOSS OF INCOME AND CONSUMPTION
Not only were women not insulated from job losses, they were also less likely to look for jobs during COVID-19. Before the pandemic, women, compared to men, were 12 percentage points less likely to be employed and 8 percentage points more likely to be looking for jobs, controlling for individual, household, and regional characteristics (Appendix Table 4). These preexisting disparities did not insulate women from job losses during COVID-19—in fact, men and women experienced similar rates of decline in employment (14 and 15 percentage points; Figure 3). Yet, the increase in the share of women looking for jobs after COVID-19 was smaller than it was for men—the share of women looking for jobs increased from 75 to 91 percent (a 16 percentage point increase), while for men it increased from 66 to 87 percent (a 21 percentage point increase) (Figure 3). That women’s propensity to look for jobs was lower than men’s, despite both groups experiencing similar rates of job loss, suggests that the norm of men being the breadwinner and women the homemaker in urban Pakistan, or the belief that men have more rights to jobs during times of scarcity, may have become more prevalent during the pandemic.11
11 In Appendix Table 4, the interaction term between the female and post-lockdown dummies is not significant in the model that includes working status as the dependent variable. This suggests that being a female during the pandemic did not have a statistically significant impact on women’s likelihood of employment, which is largely determined by structural gaps in the urban labor market in Pakistan. However, in the model that includes job search status as the dependent variable, the interaction term between the female and post-lockdown dummy is negative and statistically significant, suggesting that women were less likely to look for jobs during the pandemic.
41
47
58
79
76
32
64
44
51
53
32
Manufacturing
ICT
All
Retail and Wholesale
Hotel, restaurant, food services
Transportation
Finance
Education
Health
Other sectors
Agriculture
All Women Men
52 59 50
41 52 39
47 44 47
58 67 57
79 91 77
76 50 77
32 37 30
64 70 58
44 55 39
51 60 50
53 51 53
Figure 5. Share of respondents who were employed before COVID-19, but experienced job loss
Source: Rozee online COVID-19 survey of jobseekers. N=2,201.
MenWomenAll
No e�ect
Permanent layo�
Temporary layo�
Salary/hours cut
Men
Women
All
No e�ect
Permanent layo�
Temporary layo�
Salary/hours cut
15
46
13
26
14
45
17
24
15
46
12
27
1317
12
2624
27
15
1514
4546
46
Figure 4. Share of respondents who had jobs before COVID-19, but experienced layoffs or reduction in salary or working hours
Source: Rozee online COVID-19 survey of jobseekers. N=1,887
Respondents, especially women, complemented their coping strategies with unpaid work. It is well-established that women perform more unpaid work than men globally, but this disparity is worse in Pakistan than any other country in the world (UN Women 2020). According to UN Women, Pakistani women spend additional 11 hours on unpaid household chores and caregiving for every hour spent by men on the same activities. In the online COVID-19 survey, which covered urban areas, 83 percent of women and 79 percent of men reported that the need for unpaid household work increased after COVID-19 (Figure 7). A larger share of women than men report an increase in unpaid work regardless of employment status, but this gender gap is the largest between working men and working women. The linear probability estimates suggest that individuals with jobs
INCREASE IN UNPAID WORK
likely to take loans to balance household expenditures and 5 percentage points less likely to receive external assistance (Figure 6b).
FEBRUARY 2021 | 7
All Currentlyworking
Currently not
working
All
All Currentlyworking
Currently not
working
Women
All Currentlyworking
Currently not
working
Men
Household income lowered Income not su�cient to pay for consumption
Reduced spending in meals, education, durables, clothes and tobacco
92
59
63
90
52
52
94
67
75
94
59
68
93
58
60
94
60
73
91
60
61
89
51
50
94
70
76
8
47
8
44
7
50
4
40
4
38
4
41
9
50
9
46
8
55
All Currentlyworking
Currently not
working
All
All Currentlyworking
Currently not
working
Women
All Currentlyworking
Currently not
working
Men
Take loan Received assistance from government or NGO
Figure 6. Share of respondents who coped with reduced income and consumption during COVID-19
Source: Rozee online COVID-19 survey of jobseekers. N=7,599 (panel a) and N=7,700 (panel b).
b. External Assistance
All Currentlyworking
Currently not
working
All
All Currentlyworking
Currently not
working
Women
All Currentlyworking
Currently not
working
Men
Household income lowered Income not su�cient to pay for consumption
Reduced spending in meals, education, durables, clothes and tobacco
92
59
63
90
52
52
94
67
75
94
59
68
93
58
60
94
60
73
91
60
61
89
51
50
94
70
76
8
47
8
44
7
50
4
40
4
38
4
41
9
50
9
46
8
55
All Currentlyworking
Currently not
working
All
All Currentlyworking
Currently not
working
Women
All Currentlyworking
Currently not
working
Men
Take loan Received assistance from government or NGO
a. Household income and consumption
were 9 percentage points less likely to report an increase in household work and this impact was smaller for women who were working during the pandemic, at about 5 percentage points. This finding points to the double burden of work faced by working women.
Women’s care work responsibilities have increased disproportionately in households with children and elderly members. Individuals living in households with elders and children reported an increased likelihood of income loss (by 2 percentage points) and insufficient income to pay
Do more household chores than before COVID
If lived with elders/children, did more caregiving
If lived with elders/children, children are doing home-based schooling
All
Currently working
Currently not working
All
Currently working
Currently not working
All
Currently working
Currently not working
84 77 88
75 74 89
79 75 89
85 77 90
81 78 91
83 77 91
84 77 88
76 75 90
80 76 89
All
Wom
enM
en
Figure 7. Share of respondents who increased time spent on household chores and caregiving after COVID-19
Source: Rozee online COVID-19 survey of jobseekers. N=7,223 (more chores), N=5,961 (more caregiving) and N=5,229 (home-based schooling).
for consumption (by 4 percentage points) (Figure 8). In addition, 89 percent of respondents reported that children were attending school online (Figure 7). The care needs of these household were met through increased unpaid work. Households with children and elders reported a greater increase in household chores (81 percent) compared to those without children or elders (75 percent) (Figure 8). The linear probability model (Appendix Table 6) suggests that living in a household with elderly and children is associated with a 4 percentage point increase in the likelihood of doing more household chores during COVID-19 than before. However, the increase in unpaid work is higher among women (by 7 percentage points) than it is among men (Appendix Table 6).
Women experienced more anxiety and stress due to COVID-19 than men. Since the COVID-19 outbreak, 76 percent of individuals reported having experienced at least one of the following: getting angry quickly, getting into frequent arguments, frequently praying, inability to sleep, inability to concentrate, and feeling anxious or depressed (Figure 9). These symptoms were more prevalent among women than men—82 percent of women, compared to 74 percent of men reported at least one of these symptoms. However, these stress symptoms were lower among individuals who were working (72 percent) than those who were not working (80 percent). As women are responsible for household management, a fall in household income and a rise in unpaid work might have led to more stress for them. The linear probability estimates controlling for individual, household, and regional characteristics support this point (Appendix Table 7).
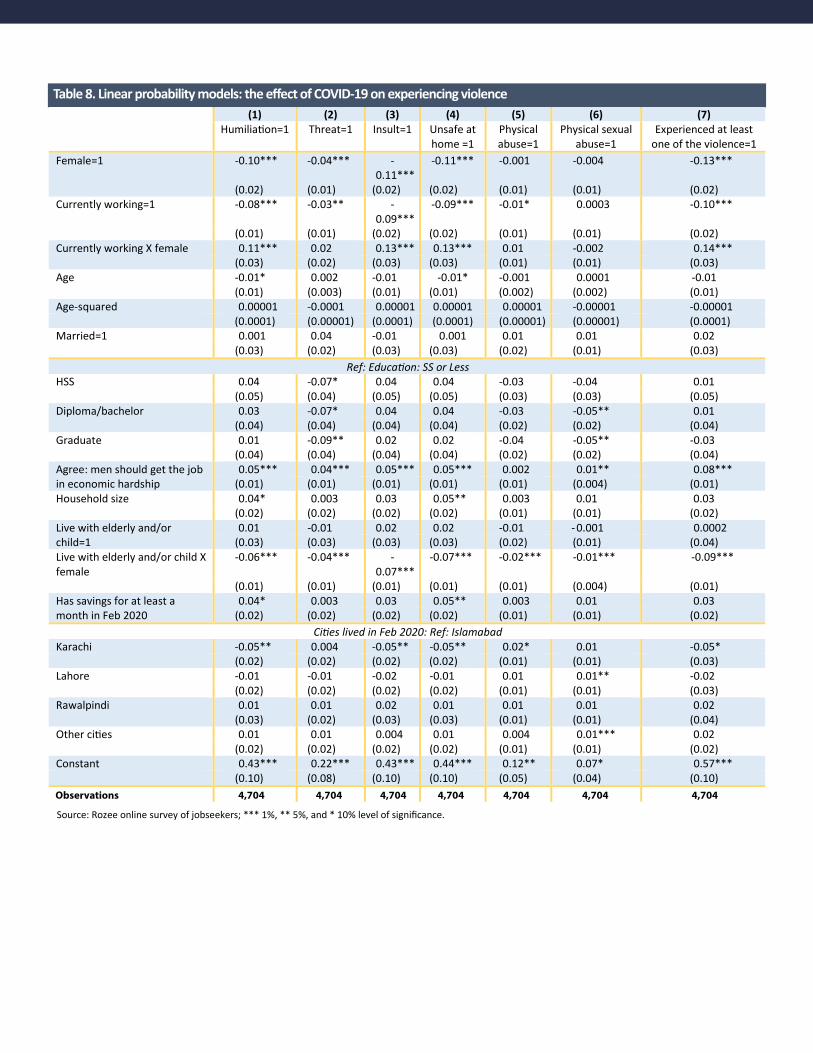
Men and women both reported an increase in domestic violence during COVID-19, but working women, in particular, experienced more violence than non-working women.12 Thirty percent of individuals reported having experienced at least one type of violence (humiliation, threat, insult, felt unsafe at home, physical abuse, or physical sexual abuse) during COVID-19 (Figure 10). Working women reported experiencing more violence (26 percent) than non-
INCREASE IN STRESS AND HOUSEHOLD TENSIONS
12 The online survey included safeguards to ensure that respondents were presented the violence questions only after confirming that they were (a) alone or able to maintain privacy of their responses, and (b) willing and able to respond to questions about intra-household relations. Those respondents who reported any type of violence were provided the contact information of counseling organizations and shelters in their province. The questions included the following: When people feel stressed and economically insecure during crises, they often knowingly or unknowingly hurt those around them. Since the beginning of March 2020, when coronavirus spread across Pakistan, have you experienced any of the following? (a) your partner saying or doing something to humiliate you in front of others; (b) threaten to hurt or harm you or someone you care about; (c) insult you or make you feel bad about yourself; (d) hit, slap, kick or do anything else to hurt you physically; (e) physically force you to have intercourse or force you to perform any other sexual acts against your will.
8 | POLICY BRIEF
Household income lowered
Reduced spending in meals, education, durables, clothes or tobacco
Received assistance from government or NGO
Income not su�cient to pay for consumption
Taken loan
Do more household chores than before COVID
81
Living with elders/
children
Not living with elders/
children
Living with elders/
children
Not living with elders/
children
Living with elders/
children
Not living with elders/
children
All Women Men
850
92
60
63
75
737
91
56
61
85
441
94
60
69
78
535
92
58
64
80
9
52
91
61
62
73
838
90
55
60
Figure 8. Share of respondents living in households with children and elderly, who coped with reduced income and consumption during COVID-19
working women (24 percent). In contrast, a greater share of unemployed men, 37 percent, reported experiencing at least one type of violence since COVID-19, as opposed to 27 percent for men with employment. Multivariate analysis verifies these findings (Appendix Table 8) and
Quick anger
Frequent argument
Frequent prayer
Unable to sleep
Unable to concentrate
Feel anxious or depressed
Experienced at least one of the stress symptoms
Currently not working
Currently working
All
Currently not working
Currently working
All
Currently not working
Currently working
All
46 26 49 51 31 57 78
39 23 42 43 26 50 70
42 25 45 47 28 53 74
52 33 54 56 30 68 84
48 29 50 51 28 63 81
50 32 52 54 29 66 82
48 29 50 53 31 60 80
41 24 44 45 26 53 72
44 27 47 49 28 56 76
All
Wom
enM
en
Figure 9. Share of respondents experienced stress symptoms during COVID-19
Source: Rozee online COVID-19 survey of jobseekers. N=7,606.
points to increased rates of humiliation and household tensions associated with the unemployment of men. It is consistent with a recent study using data from 31 developing countries, which showed that a 1 percent increase in the male unemployment rate is associated with an increase in
FEBRUARY 2021 | 9
the incidence of physical violence against women by 0.5 percentage points or 2.8 percent (Bhalotra, Kambhampati, Rawlings, and Siddique 2020).
Currently not working
Currently working
All
Currently not working
Currently working
All
Currently not working
Currently working
All
Humiliation Threat Input Unsafe at home Physical abuse
Physical sexual abuse Experienced at least one of the violence
28 13 30 30 4 3 37
19 11 20 20 3 3 27
23 12 24 25 4 3 32
17 8 19 19 4 2 24
20 7 21 22 4 2 26
18 8 20 20 4 2 25
24 11 26 26 4 2 33
19 10 20 21 3 2 27
22 11 23 23 4 2 30
All
Wom
enM
enFigure 10. Share of respondents experienced violence after COVID-19
Labor force participation among Pakistani women is among the lowest in the world, especially in urban areas. With the employment prospects so unfavorable for women, any disproportionate gender effects of the COVID-19 pandemic will worsen these gaps. As businesses closed, either temporarily or permanently, jobs have disappeared for both men and women. However, the sectors where women are more likely to be employed, such as education and health, were more severely affected. Likewise, the COVID-19 pandemic has led to a disproportionate increase in women’s unpaid care work. The fall in household income and the rise in unpaid work are likely factors in higher stress and anxiety among women, as well as leading to an increase in domestic violence.
These findings present some alarming trends that need to be considered in COVID-19 recovery efforts. If women endure the added burden of unpaid household and care work for a prolonged period, they are more likely to quit the
CONCLUSION
labor market altogether. Similarly, the longer the economic recovery takes, the fewer women may remain in or return to the labor force. COVID-19 recovery efforts that do not address the disproportional impacts on women’s employment will likely result in larger gender gaps after the pandemic.
For sustained recovery, there must be greater recognition of women’s economic role and unpaid work, as well as targeted social safety net and support services that address the care burden and other stresses women face at home. These services must be targeted toward women previously employed in sectors where the decline in employment was most severe, such as healthcare and education. For example, firms can be incentivized to provide unemployment insurance and other temporary benefits to their workers, while those who have lost their jobs in these sectors can serve as frontline workers to roll out public COVID-19 response programs for contact tracing, testing, vaccination and remote learning. In the short term, there is also a dire need to address the pandemic’s toll on women’s physical, emotional and mental health, such as by investing in multi-purpose helplines and nongovernmental organizations that provide women with financial assistance, psychosocial support and shelter. Without immediate and long-term interventions to establish work-family policies, it is possible that the labor market participation of women will decline even further.
10 | POLICY BRIEF
Amir, Saman, Aphichoke Kotikula, Rohini P. Pande, Laurent Loic Yves Bossavie, and Upasana Khadka. 2018. Female Labor Force Participation in Pakistan: What Do We Know? The World Bank.
Asian Development Bank. 2020. “An Updated Assessment of the Economic Impact of COVID-19.” ADB Briefs 133, https://www.adb.org/sites/default/files/publication/604206/adb-brief-133-updated-economic-impact-covid-19.pdf (accessed November 1, 2020).
Bhalotra, Sonia, Uma Kambhampati, Samantha Rawlings, and Zahra Siddique. 2020. Intimate Partner Violence: The Influence of Job Opportunities for Men and Women. Policy Research Working Paper 9118. The World Bank.
Cho, Yoonyoung, and David Newhouse. 2011. How Did the Great Recession Affect Different Types of Workers? Evidence From 17 Middle-Income Countries. The World Bank.
Elson, Diane. 2010. “Gender and the Global Economic Crisis in Developing Countries: A Framework for Analysis.” Gender & Development 18(2): 201–212.
Karamessini, Maria, and Jill Rubery, eds. 2013. Women and Austerity: The Economic Crisis and the Future for Gender Equality. Routledge.
Matsuda, Norihiko, Tutan Ahmed, and Shinsaku Nomura. 2019. Labor Market Analysis Using Big Data: The Case of a Pakistani Online Job Portal. Policy Research Working Paper 9063. The World Bank.
Pakistan Bureau of Statistics. 2019. Employment Trends 2018: Pakistan. The Government of Pakistan.
Pakistan Bureau of Statistics, Labor Force Survey. “Table-1 Percentage distribution of population by age, sex and area: Pakistan & Provinces,” http://www.pbs.gov.pk/content/labour-force-statistics (accessed November 1, 2020).
REFERENCES Pakistan Bureau of Statistics, Labor Force Survey. “Table-20 Percentage distribution of employed persons 10 years of age and over by major industry divisions, occupation groups and sex: Pakistan & Provinces, Rural & Urban,” http://www.pbs.gov.pk/content/labour-force-statistics (accessed November 1, 2020).
Rubery, Jill, ed. 2010. Women and Recession (Routledge Revivals). Routledge.
Rubery, Jill, and Anthony Rafferty. 2013. “Women and Recession Revisited.” Work, Employment and Society 27(3): 414–432.
Starr, Martha A. 2014. “Gender, Added-Worker Effects, and the 2007–2009 Recession: Looking Within the Household.” Review of Economics of the Household 12(2): 209–235.
United Nations. 2020. “Policy Brief: The Impact of COVID-19 on Women,” https://www.unwomen.org/-/media/headquarters/attachments/sections/library/publications/ 2020/policy-brief-the-impact-of-covid-19-on-women-en.pdf?la=en&vs=1406 (accessed November 1, 2020).
UN Women. 2019. Progress of the World’s Women 2019–2020: Families in a Changing World. United Nations.
World Bank. 2020. “Projected Poverty Impacts of COVID-19 (Coronavirus),” http://pubdocs.worldbank.org/en/4616015 91649316722/Projected-poverty-impacts-of-COVID-19.pdf (accessed November 1, 2020).
World Health Organization. 2020. “Pakistan’s Drive to Restore Essential Health Services During COVID-19,” https://docs.google.com/viewerng/viewer?url=https://www.uhcpartnership.net/wp-content/uploads/2020/10/Stories-from-the-field_issue4_Pakistan.pdf (accessed November 1, 2020).
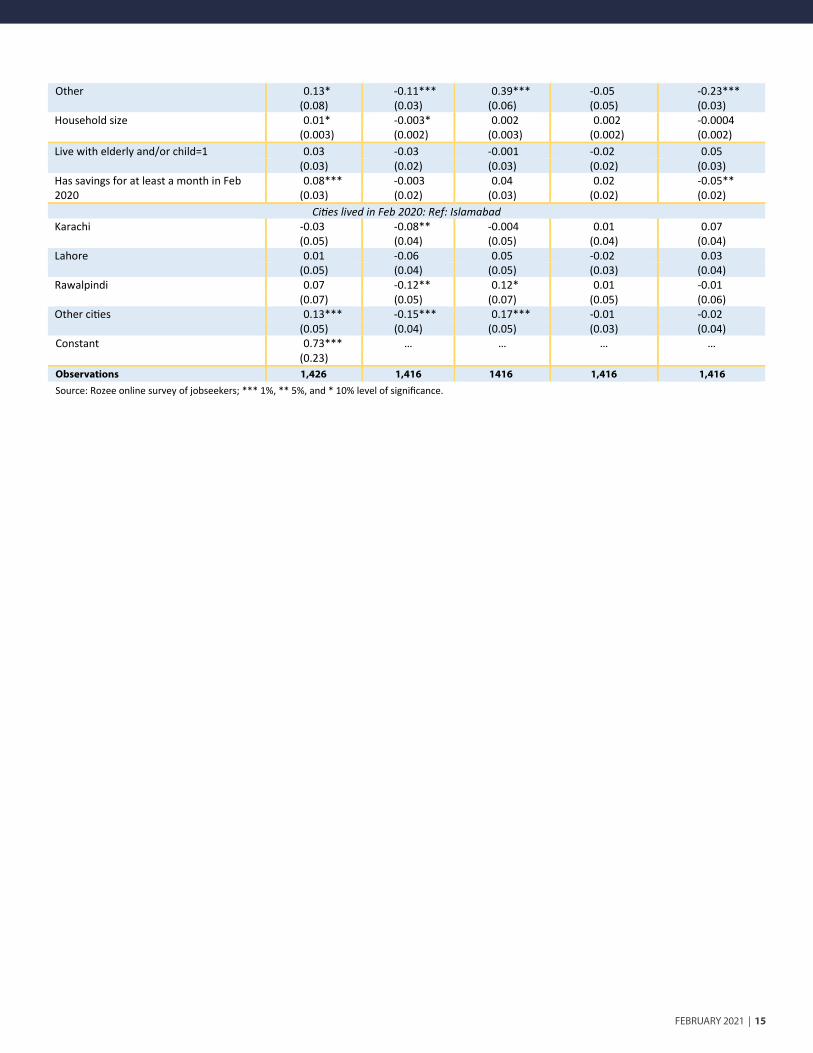
Education Ref: SS or Less HSS -0.08*** -0.03 (0.03) (0.03) Diploma/bachelor -0.04 -0.03 (0.03) (0.03) Graduate 0.01 -0.03 (0.03) (0.03) Household size 0.001 0.001 (0.001) (0.001) Live with elderly or a 0.01 0.02 child=1 (0.01) (0.01) Has savings for at 0.01 -0.06*** least a month=1 (0.01) (0.01)
(0.08) (0.07) (0.07) (0.07) (0.07) Feb 2020: worked as manager -0.11*** 0.05 -0.11** -0.01 0.07* (0.04) (0.03) (0.05) (0.04) (0.04) Feb 2020: worked as work in office -0.01 0.03 -0.06 -0.01 0.04 (0.04) (0.03) (0.05) (0.04) (0.04) Feb 2020: worked as produc�on 0.03 -0.05 0.08 0.06 -0.08 (0.06) (0.05) (0.07) (0.05) (0.07) Feb 2020: worked as transport -0.15 0.002 -0.17 0.11* 0.06 (0.10) (0.10) (0.11) (0.06) (0.11) Feb 2020: worked as construc�on 0.11 -0.19 -0.01 0.09* 0.11 (0.09) (0.12) (0.10) (0.06) (0.09) Feb 2020: worked as work in shop 0.03 0.02 0.24* -0.05 -0.21 (0.09) (0.10) (0.12) (0.09) (0.15) Feb 2020: worked in other posi�ons 0.02 0.02 -0.11* 0.01 0.07
(0.05) (0.04) (0.06) (0.04) (0.05) Ref: Feb 2020: worked in sector ICT
Ref: Feb 2020: worked in private company Work at NGO -0.01 0.07* 0.07 -0.06** -0.08** (0.05) (0.04) (0.05) (0.03) (0.04)
Work at government -0.23*** 0.02 -0.13*** -0.10*** 0.20*** (0.04) (0.04) (0.05) (0.02) (0.05)
Other 0.13* -0.11*** 0.39*** -0.05 -0.23*** (0.08) (0.03) (0.06) (0.05) (0.03) Household size 0.01* -0.003* 0.002 0.002 -0.0004 (0.003) (0.002) (0.003) (0.002) (0.002) Live with elderly and/or child=1 0.03 -0.03 -0.001 -0.02 0.05 (0.03) (0.02) (0.03) (0.02) (0.03) Has savings for at least a month in Feb 2020