25
Impacts of Electric Vehicles – Summary report Report Delft, April 2011 Compiled by: Huib van Essen Bettina Kampman
Impacts of Electric Vehicles – Summary report
Report Delft, April 2011 Compiled by: Huib van Essen Bettina Kampman

2 April 2011 4.058.1 – Impacts of Electric Vehicles – Summary report
Publication Data
Bibliographical data: Huib van Essen, Bettina Kampman
Impacts of Electric Vehicles – Summary report
Delft, CE Delft, April 2011
Electric Vehicles / Production / Government / Industry / Investment / Research / Market /
Economy / Analysis
Publication number: 11.4058.26
CE-publications are available from www.cedelft.eu
Commissioned by: European Commission.
Further information on this study can be obtained from the contact person Huib van Essen.
© copyright, CE Delft, Delft
CE Delft
Committed to the Environment
CE Delft is an independent research and consultancy organisation specialised in
developing structural and innovative solutions to environmental problems.
CE Delft’s solutions are characterised in being politically feasible,
technologically sound, economically prudent and socially equitable.

3 April 2011 4.058.1 – Impacts of Electric Vehicles – Summary report
Contents
1 Introduction 5 1.1 Background 5 1.2 Aim and scope of the study 5 1.3 Approach and deliverables 6
2 Electric Vehicles on the market and in development 7 2.1 Introduction 7 2.2 Specifications of electric cars 7 2.3 Developments in other electric road vehicles 9 2.4 Research and government programs on EVs 9
3 Electric vehicle and battery technology 11 3.1 Introduction 11 3.2 Battery technology and cost 11 3.3 Other EV components 12 3.4 Safety Issues 12
4 Future electricity sector 13 4.1 Introduction 13 4.2 Related trends in the electricity sector 13 4.3 Interaction between electricity production and EVs 14 4.4 Charging technology 14
5 Economic analysis and business models 17 5.1 Introduction 17 5.2 Total cost of ownership 17 5.3 Existing government policies 18 5.4 Business models 19
6 Impact analysis and policy recommendations 21 6.1 Introduction 21 6.2 Impacts of market uptake of Electric Vehicles 22 6.3 Main policy implications 24 6.4 Recommendations for further study 25

4 April 2011 4.058.1 – Impacts of Electric Vehicles – Summary report
5 April 2011 4.058.1 – Impacts of Electric Vehicles – Summary report
1 Introduction
1.1 Background
Electric Vehicles (EVs) are a promising technology for drastically reducing the environmental burden of road transport. More than a decade ago and also more recently, they were advocated by various actors as an important element in reducing emissions of CO2, air pollutants and noise of particularly passenger cars and light commercial vehicles. At the same time, the electric passenger cars that are being developed are not yet competitive with conventional vehicle technology. Costs are still high and battery technology is still being developed, and there exist many uncertainties with respect to crucial issues such as: Battery technology (energy capacity in relation to vehicle range, charging
speed, durability, availability and environmental impacts of materials). Well–to-wheel impacts on emissions. Interaction with electricity generation. Cost and business case of large scale introduction.
1.2 Aim and scope of the study
For EU policy makers, it is important to get a reliable and independent assessment of the state of the art of these issues in order to develop targeted and appropriate greenhouse gas (GHG) reduction policy for transport. Therefore the Directorate-General for Climate Action (DG CLIMA) commissioned CE Delft, ICF and Ecologic to carry out a study on the potential impacts of large scale market penetration of EVs in the EU, with a focus on passenger cars and light commercial vehicles. This study includes an assessment of both the transport part (e.g. composition of vehicle fleet) and electricity production and provides estimates of the impacts on well-to-wheel GHG emissions, pollutant emissions, other environmental impacts, costs, etc. In this study three types of EVs are distinguished: Full Electric Vehicles (FEVs) that have an electric engine and batteries for
energy storage, no internal combustion engine (ICE). Plug-in Hybrid Electric Vehicles (PHEVs) that have both an ICE and an
electric engine, with a battery that can be charged on the grid. Electric Vehicles with a Range Extender (EREVs) that have an electric
engine and an ICE that can be used to charge the battery and so extend the vehicle’s range. The battery of an EREV can be charged on the grid.
The results of the study should help the European Commission with developing GHG policy for transport, in particular in the field of EV and in relation to the wider EU transport policy and EU policy for the electricity sector.

6 April 2011 4.058.1 – Impacts of Electric Vehicles – Summary report
1.3 Approach and deliverables
The project is organised around seven work packages (WPs): WP 1 Current status of EV development and market introduction. WP 2 Assessment of vehicle and battery technology and cost. WP 3 Assessment of impacts on future energy sector. WP 4 Economic analysis and business models. WP 5 Workshop on developments and expectations. WP 6 Scenario analysis. WP 7 Policy implications. The following graph (Figure 1) gives an overview of the main interactions between the various WPs.
Figure 1 Project overview
WP 1 – Currentstatus EV
development and market
introduction
WP 2 – Assessment of vehicle and batterytechnology and cost
WP 3 – Assessment of impacts of future
energy sector
WP 6 – Scenario analysis
WP 5 – Workshop ondevelopments and
expectationsWP 7 – Policiyimplications
WP 4 – Economicanalysis and business
models
The results of this project are presented in five deliverables: Deliverables 1 to 4 presenting the results of WP 1 to 4 and a final Deliverable 5 with the results of WP 5, 6 and 7. This summary report summarizes the results of all five deliverables.
7 April 2011 4.058.1 – Impacts of Electric Vehicles – Summary report
2 Electric Vehicles on the market and in development
2.1 Introduction
In recent years, many EVs were announced and many prototypes presented. In this project, an analysis was made of these models: 106 different passenger cars and a smaller number of non-passenger cars coming to the market by 2011-12 up to 2015. The relatively limited data in the sample, together with the fact that some of the vehicles are still announcements or prototypes of which specifications might change in the coming year(s), calls for caution when drawing firm conclusions. Nonetheless, the analysis resulted in a number of valuable insights which can be useful when considering the future of EVs.
2.2 Specifications of electric cars
When examining the technical aspects of EVs and judging from the available data, battery capacity correlates very directly with battery mass. Thus, more battery capacity implies a heavier and larger car. However, the assessment of the announced cars shows that there is no clear indication for a real shift regarding vehicle mass or design. They are on average not significantly heavier than today’s European cars, implying either that the heavy battery weight will be compensated with weight reduction in other elements or that there will be more small cars in the market than at present. No fundamental shift in the short term towards light weight composite materials as in aircraft design could be observed. This may not hold true in the long term as composite materials may become market-ready in the future. The gathered information also indicates that the actual body should not differ much from today’s mid-sized European cars, at least until 2015. On average, the chassis is expected to be significantly lighter than today’s US cars and slightly lighter than today’s European cars. This seems to indicate a trend towards smaller cars. Ranges are still very much limited and pure electric driving will be limited to short and medium range applications for the near-term future. In the long run, the ranges of full electric vehicles (FEVs) might increase significantly and extend the cars’ typical fields of application beyond city-only use. Based on electric urban drive ranges, FEVs are primarily in the 100-200 km ranges, PHEVs in the ranges below 100 km. This is linked both to vehicle mass and battery performance. In terms of maximum speed and acceleration, EVs are not expected to differ significantly from today’s cars. However, EVs can only run at top speed for a very short time due to overheating issues. Their performance will increase over time, which will also allow electric driving beyond urban and local traffic.
8 April 2011 4.058.1 – Impacts of Electric Vehicles – Summary report
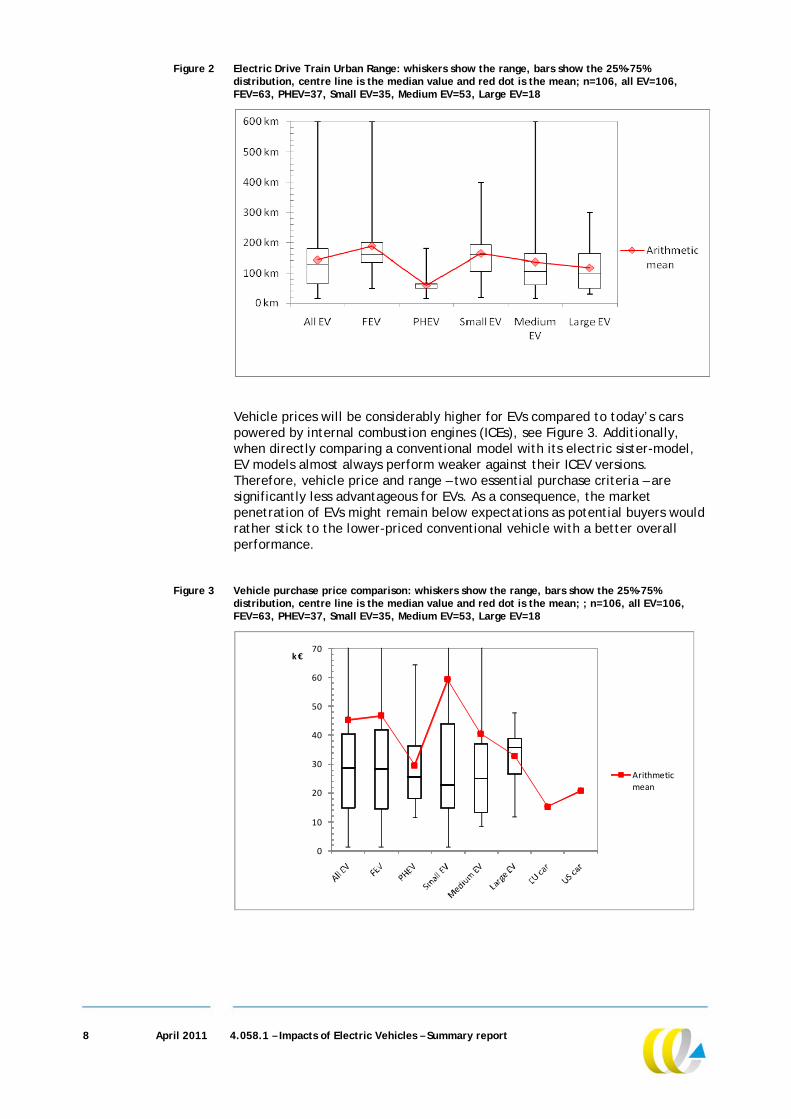
Figure 2 Electric Drive Train Urban Range: whiskers show the range, bars show the 25%-75% distribution, centre line is the median value and red dot is the mean; n=106, all EV=106, FEV=63, PHEV=37, Small EV=35, Medium EV=53, Large EV=18
Vehicle prices will be considerably higher for EVs compared to today’s cars powered by internal combustion engines (ICEs), see Figure 3. Additionally, when directly comparing a conventional model with its electric sister-model, EV models almost always perform weaker against their ICEV versions. Therefore, vehicle price and range – two essential purchase criteria – are significantly less advantageous for EVs. As a consequence, the market penetration of EVs might remain below expectations as potential buyers would rather stick to the lower-priced conventional vehicle with a better overall performance.
Figure 3 Vehicle purchase price comparison: whiskers show the range, bars show the 25%-75% distribution, centre line is the median value and red dot is the mean; ; n=106, all EV=106, FEV=63, PHEV=37, Small EV=35, Medium EV=53, Large EV=18
0
10
20
30
40
50
60
70k €
Arithmetic mean
9 April 2011 4.058.1 – Impacts of Electric Vehicles – Summary report
2.3 Developments in other electric road vehicles
Apart from passenger cars, many different vehicle types will be electrified in the future. Generally, these vehicles are very heterogeneous and can be subdivided into several variable subgroups: city cruisers, racing and off-road motorbikes, city bicycles (‘Pedelecs’), trucks and vans. As many of the vehicles are only produced in small quantities, individual modifications are often possible. In some countries, non-passenger-car EVs already represent market shares of up to 10%, as do electric bicycles in the Netherlands, indicating a significant market potential for non-car electric mobility. Further signs of burgeoning market penetration can be observed as postal and messenger services and other companies are increasingly equipping their inner-city fleets with short-range electric vans and trucks. These fields might be a potential key application of EVs with a much higher potential than for passenger cars (in terms of EV share, not necessarily in absolute numbers).
2.4 Research and government programs on EVs
There are various government and industry support and investment programs for EVs. The majority of the investments from 2008 to 2011 (€ 22 billion) have been initiated in the USA and the EU1. The tendency has been to support subsidy programs for EV dispersion, where the USA is the world leader. Most of the countries within the EU and beyond have introduced CO2-based car taxes favouring EVs. Tax incentives and rebates are additional measures and have been instituted in many countries. The types of programs for electric mobility (target numbers, infrastructure, pilot projects, traffic rights, etc.) vary globally, but also within the EU. Infrastructure for EVs is often developed and installed in cooperation with private companies and in public private partnership, indicating that there is not only a public interest in EV technology, but also economic potential. Research activities are abundant in the USA and the EU, but also in Japan and China. Research activities in virtually all areas of electric mobility are highest in the USA, especially in universities and national laboratories, while all other countries trail significantly in both categories. Japan remains the world leader in battery research and development. National-level research activities within the EU often go along with huge subsidies originating from national economic stimuli packages. Most projects are pilot and demonstration projects and include companies, universities, research institutes, and public institutions. Especially Germany, France, and the United Kingdom are active in this field.
1 The assessment includes available information up to the Geneva car show 2010 (i.e. March 14,
2010). Note that very recently China has announced significant investments in EV technology. These are not included here.

10 April 2011 4.058.1 – Impacts of Electric Vehicles – Summary report
11 April 2011 4.058.1 – Impacts of Electric Vehicles – Summary report
3 Electric vehicle and battery technology
3.1 Introduction
The developments in battery technology and other EV components are a critical issue in the future market uptake of EVs. The main trends and expectations are summarized below. Since these systems are very new and technologies are developing rapidly, a detailed forecast of the future development of these technologies is based on the opinions of experts at battery manufacturers, car manufacturers and research institutes.
3.2 Battery technology and cost
The range of FEVs and the All Electric Range (AER) of PHEVs and EREVs continue to be a major determinant of costs as it drives the size of the battery and the cost of energy storage continues to be relatively high. Battery cost and performance still is the single greatest challenge to the commercialisation of all type of EV models. Battery manufacturers indicate that each battery generation is likely to be in production for four to five years at least to recoup capital investments and R&D costs, so that 2011/2012 introduction of the first generation of automotive lithium-ion batteries implies that the second-generation batteries could be commercialised in 2016/17 and third-generation batteries in the early 2020 time frame. Based on a survey of battery technology developments, we anticipate the following developments relative to a 2010 battery: Improvements of 20 to 25% in specific energy with a similar reduction in
cost by 2016 primarily due to improved battery design and packaging. Improvements of 70 to 75% in specific energy and 50% reduction in cost per
kWh by 2020 to 2022 with the introduction of advanced materials for the anodes and cathodes, such as silicon anodes.
Potential for a tripling of specific energy and 70% cost reduction per kWh by 2030 with the introduction of lithium-sulfur batteries.
Based on available analysis and current battery data, it appears that current (2010) battery life should exceed seven years and may be around ten years for ‘average’ use. However, there is still much uncertainty regarding battery calendar life at more severe ambient temperatures while more moderate temperatures may allow real world battery life to be around ten years on average. We also anticipate continued improvement to 2020 by which time, average life might be in the thirteen to fifteen year range. It is generally understood that, unlike cadmium and lead based batteries, current known formulations of the Li-Ion battery materials do not present significant environmental concerns beyond fire safety and landfill utilisation. We believe that there are no major concerns that would distinguish recycling Li-Ion batteries relative to current lead acid and nickel metal hydride batteries. Battery recycling economics appear to be difficult and hard to
12 April 2011 4.058.1 – Impacts of Electric Vehicles – Summary report
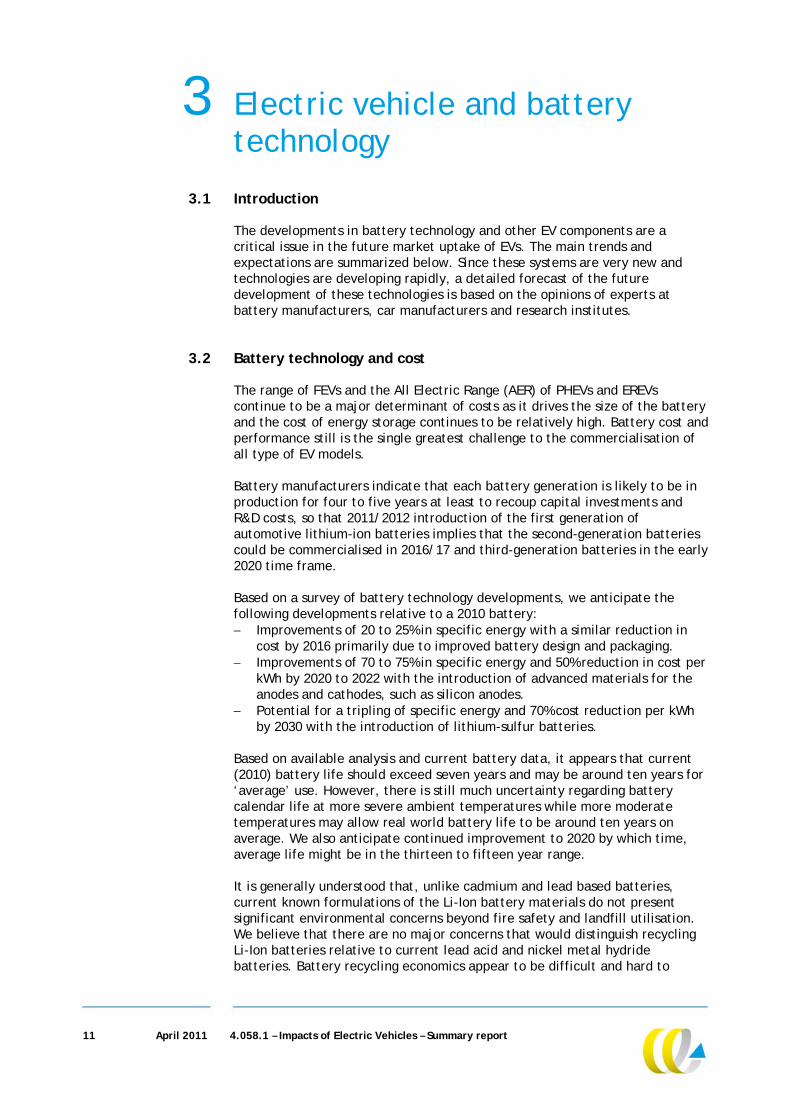
predict ten years into the future but will likely require government mandates or subsidies to be economical. The use of lithium batteries for FEV and PHEV/EREV fleets in large numbers has raised concerns about lithium supply and future availability of lithium in large quantities. In comparison to known global reserves, the demand from EVs is very small. If, as an extreme example, by 2040, all of the world’s 2 billion cars are FEVs, the total lithium used would be about 6 million tons, which is equivalent to less than 25% of the world’s known reserves. Hence, there does not appear to be any case for long term supply shortages. The current costs of lithium batteries are based on battery manufacturer quotations to car manufacturers at rates of about 20 thousand batteries per year for supply starting in 2011/2012. Future costs to 2020 and 2030 are based on using current cost numbers and accounting for effects of volume, scale and in the case of the battery, new technology, as shown in Table 1.
Table 1 Unsubsidised battery costs over time (Manufacturer costs, no retail prices)
Battery type Specific Energy density in Wh/kg Cost to OEM*
2012 lithium Mn Spinel 105 ± 5 € 200 per battery + € 620 per kWh
2020 Li Mn Spinel
2020 Silicon lithium
125 ± 5
160 ± 5
€ 180 per battery + € 310 per kWh
€ 200 per battery + € 350 per kWh
2025 Silicon lithium
2030 Silicon Li-S
190 ± 10
300 ± 20
€ 180 per battery + € 185 per kWh
€ 200 per battery + € 200 per kWh
Cost of 20 kWh battery in 2012 will be € 200 + € 620 per kWh * 20 kWh or € 12,600. The electric energy use of complete EVs is generally considerably higher than specified by the manufacturer and strongly dependent on driving and weather conditions and use of auxiliaries. Like for conventional cars, the vehicle energy use will remain the dominant part of total life cycle energy use, although the EV does require more energy to produce and recycle relative to a conventional car.
3.3 Other EV components
There are a number of other components on an EV that are unique to such a vehicle and different from those in a conventional vehicle. The motor, inverter and controller are the most expensive components after the battery and special attention is paid to these components. The other components of interest include the DC/DC converter for 14 Volt supply for the lights and ignition (in a PHEV), high voltage wiring harness, the special heating ventilator, air conditioning (HVAC) unit and the regenerative brakes. Detailed cost estimates to 2030 for each of these components were developed.
3.4 Safety Issues
There are concerns expressed by various safety groups that ‘silent’ vehicles present a safety hazard for visually impaired, cyclists, runners, small children, and other pedestrians. The problem can be especially acute at urban intersections with loud background noise and where blind pedestrians make decisions about crossing streets based on what they can hear in their environment. The current trend appears to be moving toward the vehicle based solutions as the most practical implementation measure.
13 April 2011 4.058.1 – Impacts of Electric Vehicles – Summary report
4 Future electricity sector
4.1 Introduction
The impacts of EV market uptake are not limited to the transport sector, but also affect the electricity sector. The environmental impacts, for example, depend for a large part on the interaction with electricity generation. Also, EV market uptake adds to the grid load, requires charging infrastructure and creates opportunities for smart charging. This interaction means that the developments in the electricity sector and related policy are very relevant to the EV developments.
4.2 Related trends in the electricity sector
The EU energy framework seeks to meet shared energy challenges of the member states with a common strategy and coherent external energy policy. However, these efforts are still far from alleviating the overall dependency of EU member states on energy imports, and vast differences still exist between the member states. While some already have very high shares of renewable energy in the electricity mix - such as Austria with 65% - others trail far behind, such as Poland, Belgium or the UK. At the same time, electricity grids, i.e. both transmission and distribution grids vary considerably in terms of resilience to external pressures. Some member states regularly experience power outages of considerable duration (mostly in Eastern and Southern Europe), while other systems perform much better (mostly in Western Europe). As part of this project, the expected future electricity market of the EU was calculated based on the PRIMES model using the IPM® model to depict the expected future electricity market in the EU through 2050. The analysis finds that in the reference scenario, energy demand in the EU rises from around 3,300 TWh in 2010 to 4,920 TWh in 2050. Similarly, peak demand rises at an average of 1% annually, from approximately 500 GW in 2008 to 740 GW in 2050. Renewable generation provides the largest market swing over time: from 19% of generation in 2010, it holds 32% in 2020 and is expected to grow to 50% by 2050. The largest share of renewable generation is wind, which contributes to 5% of generation in 2010 and grows to 25% by 2050. Peak prices increase significantly over time, especially after 2015, while base load and off-peak prices remain almost constant. Additionally, given the increasing CO2 prices and large renewable penetration into the system, our modelling results show substantial reductions in emissions, which fall from 1,200 million tonnes in 2010 to 1,085 million tonnes by 2020 and fall as low as 670 million tonnes by the end of the study period. Intermittent energy sources such as wind and solar are difficult to coordinate with existing power generation capacities and load curves. Wind energy, for example, is mostly available at night time when demand is lowest. Without updates to the current electricity grid, zero prices and even negative prices will affect electricity markets. Already now, negative energy prices can occur
14 April 2011 4.058.1 – Impacts of Electric Vehicles – Summary report
at peak wind generation times that very often do not coincide with peak load periods. For times with high load and low wind intensity, sufficient back-up generating power has to be available, reducing the overall system efficiency, i.e. increasing the cost per kWh.
4.3 Interaction between electricity production and EVs
The absolute increase in electricity demand from a market uptake of EVs will be relatively small. Even a complete electrification of the European fleet would result in an additional demand in the order of 10-15%. It is therefore very likely that generating capacity will be able to meet the additional demand, at least in the short to medium term. However, uncontrolled charging can significantly increase peak load and thus incur a high cost burden. If uncontrolled EV charging is added to the system, this can have effects both at the distribution and at the generation level. In countries with a well developed distribution grid, no significant risk for distribution or transmission grids could be identified even for high shares of electric vehicles, as long as charging uses household connections. In member states with relatively weak electricity infrastructure, however, even small scale EV introduction can cause local power-outages if charging is uncontrolled. Fast charging applications could change the picture and lead to bottlenecks in all member states. Smart charging requires smart grid updates to the entire electricity sector, incurring substantial investments. Controlled charging – or smart charging – will allow a much greater number of cars in the system without local overload. It allows EVs to penetrate the market at higher growth rates than the electricity generating and grid capacity needs to grow, since it can make use of off-peak over-capacities. This results in considerable potential benefit for smart charging, possibly through price incentives such as dynamic tariffs, in order to cut off peak demand and smooth electricity demand curves. Smart charging might also allow load balancing both at sub-station and at the grid level, particularly with charging at peak wind supply times. This type of using EV battery capacity for storing electric energy may ease the integration of large scale intermittent electricity sources such as off-shore wind energy. However, the potential for this, especially in combination with feeding back the energy at peak demand times, seems limited. The total storage capacity of EVs is quite limited and other forms of storage technology such as pump storage or compressed air are more cost-effective. Moreover, serious concerns regarding battery cycling have to be addressed before vehicle owners might be willing to commit to grid stabilisation. Therefore, in the medium-term, there is little potential of EVs operating as batteries for the electricity grid.
4.4 Charging technology
Charging can be segmented into three categories: household connections, fast charging and battery swap systems. A major obstacle in Europe is that most car owners do not own a garage but park their car at the curb. This requires a multitude of capital intensive public charging stations. Given the immense investment needs and low electricity prices, no viable business concept has emerged so far. Especially swap stations seem to have a particularly low return on investment. Current charging stations are either free or at least
15 April 2011 4.058.1 – Impacts of Electric Vehicles – Summary report
highly subsidised by either electricity providers, car manufacturers or (local) governments. Future business models might charge rather for the parking space than for the electricity.
Figure 4 Commercial vehicle charging station
Presently, three standards for connecting EVs to charging stations (power plug) compete for worldwide recognition: one from the American SAE, one from the European International Electro-technical Commission (IEC) and one from the Japanese CHAdeMO. Even though all players insist that they support a uniform standard, allowing any vehicle to charge at any station, also reducing the total number of charging stations needed, the outcome of this race for an international standard is still widely open. National governments are also involved – such as the German government who is supporting the IEC–based ‘Mennekes’ plug. A common standard is expected in 2017. A look into the mid-term future (around 2020) reveals that induction charging might become a safe and user-friendly solution to charging EVs. Monitoring EV electricity consumption is relevant for transport sector statistics, for accounting for the use of renewable energy in transport and for measuring GHG emissions in relation to targets in transport. In the future, monitoring can probably best be done through data from smart metering supplied by electricity providers. Electricity consumption by electric vehicles can be monitored by separate meters if outlets are not compatible with standard electric power outlets. Metering at the charging station is preferable to on-board monitoring. This monitoring is an essential prerequisite for EVs to contribute to reaching the targets laid out in the EUs Fuel Quality Directive (FQD) and Renewable Energy Directives (RED).

16 April 2011 4.058.1 – Impacts of Electric Vehicles – Summary report
17 April 2011 4.058.1 – Impacts of Electric Vehicles – Summary report
5 Economic analysis and business models
5.1 Introduction
One of the main barriers to short and medium term uptake of EVs are their cost, in particular the cost of the batteries, and uncertainties regarding vehicle and battery lifetime. Even though the cost per kilometre (vehicle use) is generally lower, the current high battery costs typically result in both a different cost structure and in unfavourable total cost of ownership (TCO), compared to conventional vehicles of comparable size.
5.2 Total cost of ownership
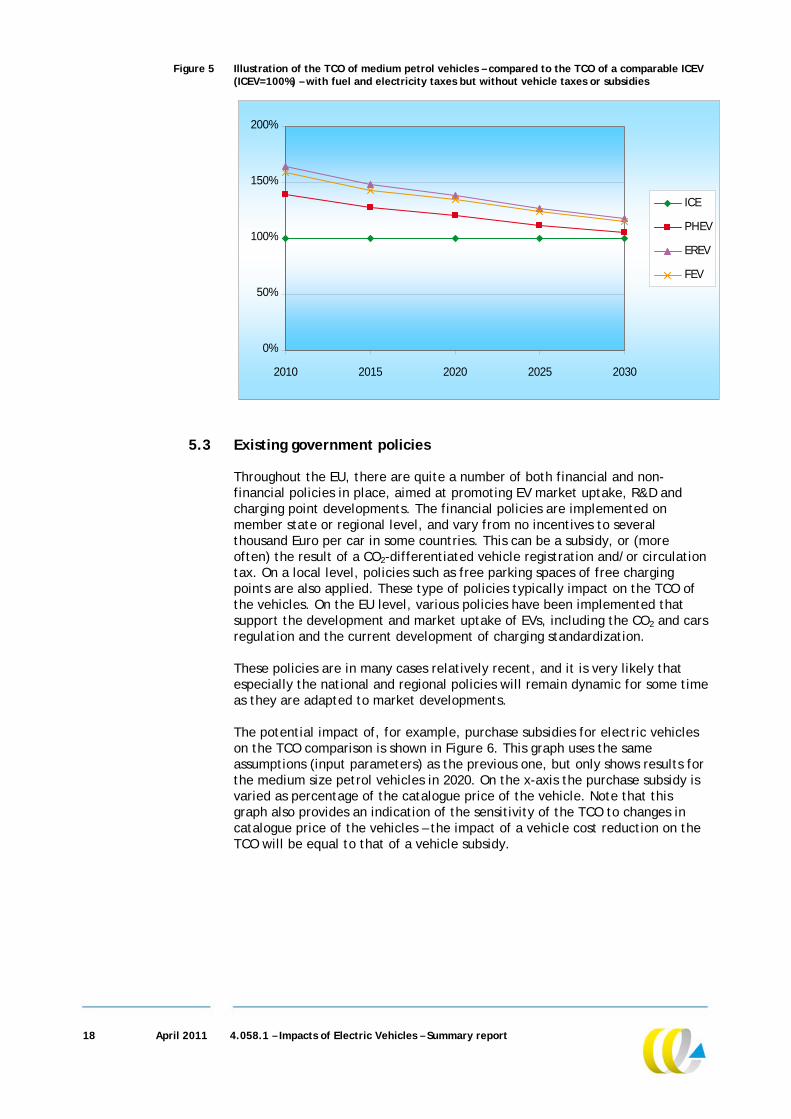
In order to compare vehicles that have different cost structures, one should use the TCO over the lifetime of the vehicle rather than only look at purchase costs – significant differences in cost of use are then taken into account. However, there are quite a large number of variables involved in these calculations, ranging from vehicle cost, vehicle taxes and subsidies, fuel and electricity use per kilometre and cost per unit, annual kilometres, battery lifetime, etc. As many of these parameters are still relatively uncertain, it is difficult to provide an accurate prediction of developments of TCO. In order to still provide insight into the trends and developments that might be expected, a basic set of assumptions was derived, for all the parameters needed for this TCO calculation. These data result in TCO curves for the different types of vehicles investigated in this project: ICEV, PHEV, EREV and FEV. Some illustrative results are shown in Figure 5, where the TCO is shown for medium-size petrol cars. Clearly, the ICEV has the lowest TCO in 2010 - 2030, but, as it is assumed that the purchase cost of the EVs reduce over time and vehicle (and battery) lifetime increases, the TCO of the EVs move towards that of the conventional vehicles. With the assumptions used, the additional cost of PHEVs is much lower than that of the vehicles types with more batteries on board (EREV and FEV), resulting in a more competitive position at an earlier time. Note that fuel and electricity taxes were included in the calculations for this graph, but no government subsidies or vehicle taxes. These can obviously change the relative cost of the various vehicle types. Also, external developments may well affect the outcome of these calculations. A sensitivity analysis shows that especially a cost reduction of the vehicles (either due to reduced vehicle cost or due to government incentives) and a fuel price increase may have quite significant impact on the TCO comparison.
18 April 2011 4.058.1 – Impacts of Electric Vehicles – Summary report
Figure 5 Illustration of the TCO of medium petrol vehicles – compared to the TCO of a comparable ICEV (ICEV=100%) – with fuel and electricity taxes but without vehicle taxes or subsidies
0%
50%
100%
150%
200%
2010 2015 2020 2025 2030
ICE
PHEV
EREV
FEV
5.3 Existing government policies
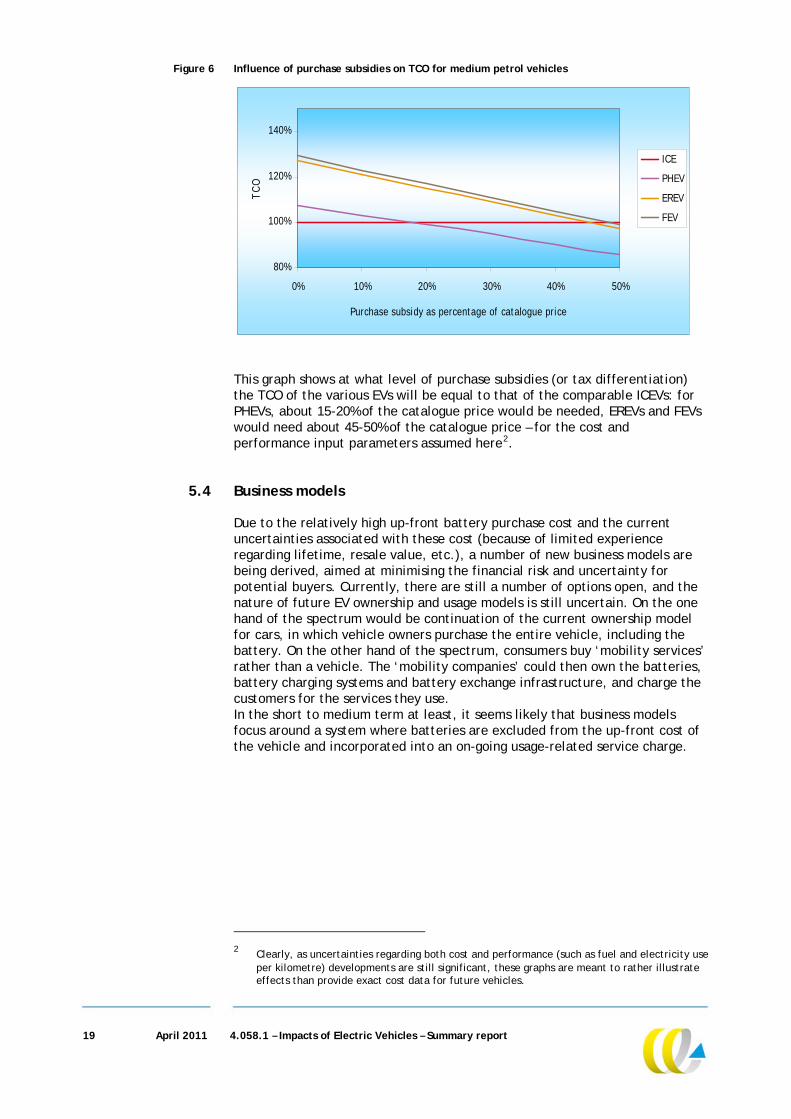
Throughout the EU, there are quite a number of both financial and non-financial policies in place, aimed at promoting EV market uptake, R&D and charging point developments. The financial policies are implemented on member state or regional level, and vary from no incentives to several thousand Euro per car in some countries. This can be a subsidy, or (more often) the result of a CO2-differentiated vehicle registration and/or circulation tax. On a local level, policies such as free parking spaces of free charging points are also applied. These type of policies typically impact on the TCO of the vehicles. On the EU level, various policies have been implemented that support the development and market uptake of EVs, including the CO2 and cars regulation and the current development of charging standardization. These policies are in many cases relatively recent, and it is very likely that especially the national and regional policies will remain dynamic for some time as they are adapted to market developments. The potential impact of, for example, purchase subsidies for electric vehicles on the TCO comparison is shown in Figure 6. This graph uses the same assumptions (input parameters) as the previous one, but only shows results for the medium size petrol vehicles in 2020. On the x-axis the purchase subsidy is varied as percentage of the catalogue price of the vehicle. Note that this graph also provides an indication of the sensitivity of the TCO to changes in catalogue price of the vehicles – the impact of a vehicle cost reduction on the TCO will be equal to that of a vehicle subsidy.
19 April 2011 4.058.1 – Impacts of Electric Vehicles – Summary report
Figure 6 Influence of purchase subsidies on TCO for medium petrol vehicles
80%
100%
120%
140%
0% 10% 20% 30% 40% 50%
Purchase subsidy as percentage of catalogue price
TC
O
ICE
PHEV
EREV
FEV
This graph shows at what level of purchase subsidies (or tax differentiation) the TCO of the various EVs will be equal to that of the comparable ICEVs: for PHEVs, about 15-20% of the catalogue price would be needed, EREVs and FEVs would need about 45-50% of the catalogue price – for the cost and performance input parameters assumed here2.
5.4 Business models
Due to the relatively high up-front battery purchase cost and the current uncertainties associated with these cost (because of limited experience regarding lifetime, resale value, etc.), a number of new business models are being derived, aimed at minimising the financial risk and uncertainty for potential buyers. Currently, there are still a number of options open, and the nature of future EV ownership and usage models is still uncertain. On the one hand of the spectrum would be continuation of the current ownership model for cars, in which vehicle owners purchase the entire vehicle, including the battery. On the other hand of the spectrum, consumers buy ‘mobility services’ rather than a vehicle. The ‘mobility companies’ could then own the batteries, battery charging systems and battery exchange infrastructure, and charge the customers for the services they use. In the short to medium term at least, it seems likely that business models focus around a system where batteries are excluded from the up-front cost of the vehicle and incorporated into an on-going usage-related service charge.
2 Clearly, as uncertainties regarding both cost and performance (such as fuel and electricity use
per kilometre) developments are still significant, these graphs are meant to rather illustrate effects than provide exact cost data for future vehicles.

20 April 2011 4.058.1 – Impacts of Electric Vehicles – Summary report
21 April 2011 4.058.1 – Impacts of Electric Vehicles – Summary report
6 Impact analysis and policy recommendations
6.1 Introduction
In the final stage of the project, the impacts of EVs were assessed for a number of scenarios that reflect various possible futures. For each scenario the impacts on the vehicle fleet, electricity and fuel use, electricity production, emissions and government revenues were assessed. The aim of these scenarios is to describe the possible playing field. To achieve this, the key variables that impact the development but are currently still uncertain are varied in these scenarios: Cost of the vehicles and/or batteries, in combination with the vehicle and
battery lifetime. Customer response to cost and ranges of PHEVs, EREVs and FEVs. Charging point availability and grid limitations to charging. Government policy. Battery and EV production capacity limitations. In addition, assumptions are made regarding the distribution of battery charging over the day: will batteries be charged mainly in the evenings, when many car owners return from work, during the day, or will there be some sort of ‘smart charging’, where a large part of the charging will take place at times of low electricity demand, during night time? This scenario analysis was carried out using CE Delft’s newly developed model MELVIN, in conjunction with the IPM model of ICF that can model the impact of the additional electricity demand on electricity production in the EU. The time frame of the scenario analysis is 2010-2030. The modelling was limited to passenger cars only and built on the TREMOVE (version 3.3.1) and PRIMES baseline scenarios. Note that the modelling was carried out on national or regional levels; results shown here are the EU-level results. Three EV scenarios were developed in which the various types of EVs are brought onto the market, to replace part of the conventional vehicles of the baseline. Key input variables such as the ones listed above are varied, leading to different market uptake developments over time of FEVs, PHEVs and EREVs. The main characteristics of the various scenarios are as follows: Scenario 1: A ‘most realistic’ scenario, which is based on current best
estimates of cost and performance development of EVs and conventional cars, and current government incentives and fiscal policies. This scenario leads to about 3.3 million EVs in the EU in 2020, but sales increase rapidly afterwards, to more than 50 million EVs on the EU roads in 2030. Most of these EVs are Plug-in Hybrids (about 60% of all EVs), the remainder are FEVs and EREVs. Smart charging is assumed to become standard after 2020, to avoid grid overload problems.
22 April 2011 4.058.1 – Impacts of Electric Vehicles – Summary report
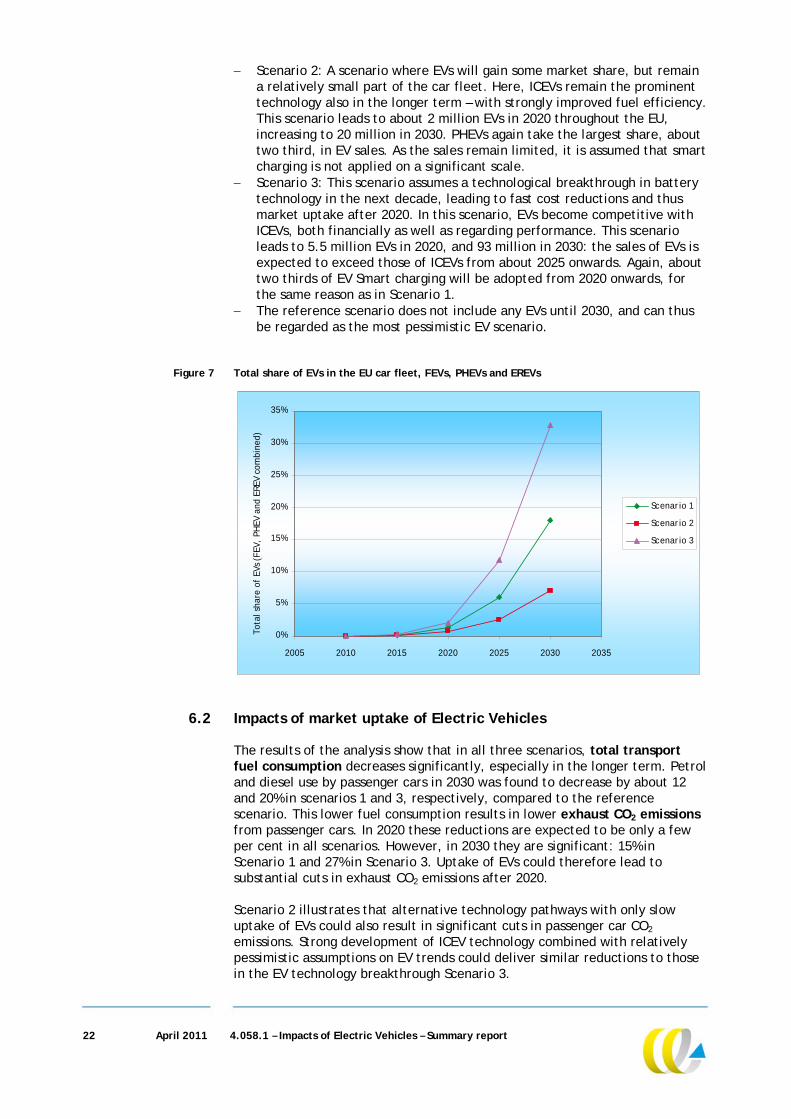
Scenario 2: A scenario where EVs will gain some market share, but remain a relatively small part of the car fleet. Here, ICEVs remain the prominent technology also in the longer term – with strongly improved fuel efficiency. This scenario leads to about 2 million EVs in 2020 throughout the EU, increasing to 20 million in 2030. PHEVs again take the largest share, about two third, in EV sales. As the sales remain limited, it is assumed that smart charging is not applied on a significant scale.
Scenario 3: This scenario assumes a technological breakthrough in battery technology in the next decade, leading to fast cost reductions and thus market uptake after 2020. In this scenario, EVs become competitive with ICEVs, both financially as well as regarding performance. This scenario leads to 5.5 million EVs in 2020, and 93 million in 2030: the sales of EVs is expected to exceed those of ICEVs from about 2025 onwards. Again, about two thirds of EV Smart charging will be adopted from 2020 onwards, for the same reason as in Scenario 1.
The reference scenario does not include any EVs until 2030, and can thus be regarded as the most pessimistic EV scenario.
Figure 7 Total share of EVs in the EU car fleet, FEVs, PHEVs and EREVs
0%
5%
10%
15%
20%
25%
30%
35%
2005 2010 2015 2020 2025 2030 2035
Tota
l sha
re o
f EV
s (F
EV,
PHEV
and
ERE
V co
mbi
ned)
Scenario 1
Scenario 2
Scenario 3
6.2 Impacts of market uptake of Electric Vehicles
The results of the analysis show that in all three scenarios, total transport fuel consumption decreases significantly, especially in the longer term. Petrol and diesel use by passenger cars in 2030 was found to decrease by about 12 and 20% in scenarios 1 and 3, respectively, compared to the reference scenario. This lower fuel consumption results in lower exhaust CO2 emissions from passenger cars. In 2020 these reductions are expected to be only a few per cent in all scenarios. However, in 2030 they are significant: 15% in Scenario 1 and 27% in Scenario 3. Uptake of EVs could therefore lead to substantial cuts in exhaust CO2 emissions after 2020. Scenario 2 illustrates that alternative technology pathways with only slow uptake of EVs could also result in significant cuts in passenger car CO2 emissions. Strong development of ICEV technology combined with relatively pessimistic assumptions on EV trends could deliver similar reductions to those in the EV technology breakthrough Scenario 3.
23 April 2011 4.058.1 – Impacts of Electric Vehicles – Summary report
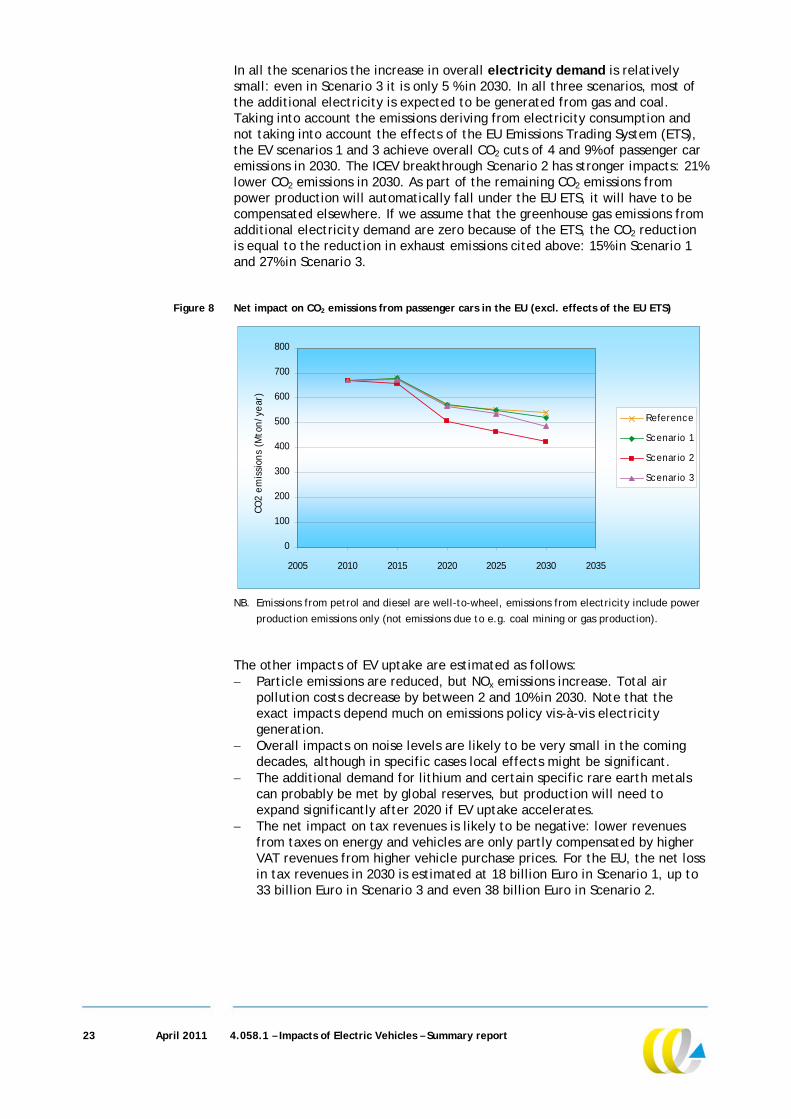
In all the scenarios the increase in overall electricity demand is relatively small: even in Scenario 3 it is only 5 % in 2030. In all three scenarios, most of the additional electricity is expected to be generated from gas and coal. Taking into account the emissions deriving from electricity consumption and not taking into account the effects of the EU Emissions Trading System (ETS), the EV scenarios 1 and 3 achieve overall CO2 cuts of 4 and 9% of passenger car emissions in 2030. The ICEV breakthrough Scenario 2 has stronger impacts: 21% lower CO2 emissions in 2030. As part of the remaining CO2 emissions from power production will automatically fall under the EU ETS, it will have to be compensated elsewhere. If we assume that the greenhouse gas emissions from additional electricity demand are zero because of the ETS, the CO2 reduction is equal to the reduction in exhaust emissions cited above: 15% in Scenario 1 and 27% in Scenario 3.
Figure 8 Net impact on CO2 emissions from passenger cars in the EU (excl. effects of the EU ETS)
0
100
200
300
400
500
600
700
800
2005 2010 2015 2020 2025 2030 2035
CO
2 e
mis
sion
s (M
ton
/ye
ar)
Reference
Scenario 1
Scenario 2
Scenario 3
NB. Emissions from petrol and diesel are well-to-wheel, emissions from electricity include power
production emissions only (not emissions due to e.g. coal mining or gas production). The other impacts of EV uptake are estimated as follows: Particle emissions are reduced, but NOx emissions increase. Total air
pollution costs decrease by between 2 and 10% in 2030. Note that the exact impacts depend much on emissions policy vis-à-vis electricity generation.
Overall impacts on noise levels are likely to be very small in the coming decades, although in specific cases local effects might be significant.
The additional demand for lithium and certain specific rare earth metals can probably be met by global reserves, but production will need to expand significantly after 2020 if EV uptake accelerates.
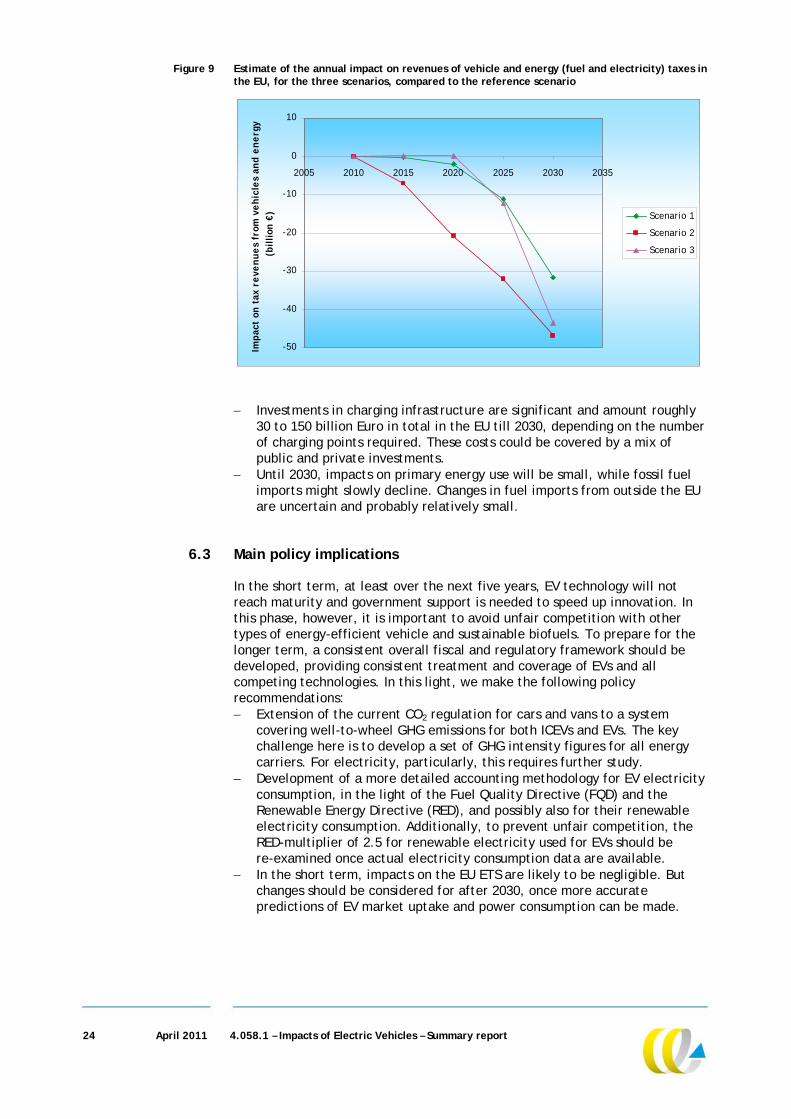
The net impact on tax revenues is likely to be negative: lower revenues from taxes on energy and vehicles are only partly compensated by higher VAT revenues from higher vehicle purchase prices. For the EU, the net loss in tax revenues in 2030 is estimated at 18 billion Euro in Scenario 1, up to 33 billion Euro in Scenario 3 and even 38 billion Euro in Scenario 2.
24 April 2011 4.058.1 – Impacts of Electric Vehicles – Summary report
Figure 9 Estimate of the annual impact on revenues of vehicle and energy (fuel and electricity) taxes in the EU, for the three scenarios, compared to the reference scenario
-50
-40
-30
-20
-10
0
10
2005 2010 2015 2020 2025 2030 2035
Imp
act
on t
ax r
eve
nu
es
from
ve
hic
les
and
en
erg
y
(bil
lion
€) Scenario 1
Scenario 2
Scenario 3
Investments in charging infrastructure are significant and amount roughly
30 to 150 billion Euro in total in the EU till 2030, depending on the number of charging points required. These costs could be covered by a mix of public and private investments.
Until 2030, impacts on primary energy use will be small, while fossil fuel imports might slowly decline. Changes in fuel imports from outside the EU are uncertain and probably relatively small.
6.3 Main policy implications
In the short term, at least over the next five years, EV technology will not reach maturity and government support is needed to speed up innovation. In this phase, however, it is important to avoid unfair competition with other types of energy-efficient vehicle and sustainable biofuels. To prepare for the longer term, a consistent overall fiscal and regulatory framework should be developed, providing consistent treatment and coverage of EVs and all competing technologies. In this light, we make the following policy recommendations: Extension of the current CO2 regulation for cars and vans to a system
covering well-to-wheel GHG emissions for both ICEVs and EVs. The key challenge here is to develop a set of GHG intensity figures for all energy carriers. For electricity, particularly, this requires further study.
Development of a more detailed accounting methodology for EV electricity consumption, in the light of the Fuel Quality Directive (FQD) and the Renewable Energy Directive (RED), and possibly also for their renewable electricity consumption. Additionally, to prevent unfair competition, the RED-multiplier of 2.5 for renewable electricity used for EVs should be re-examined once actual electricity consumption data are available.
In the short term, impacts on the EU ETS are likely to be negligible. But changes should be considered for after 2030, once more accurate predictions of EV market uptake and power consumption can be made.

25 April 2011 4.058.1 – Impacts of Electric Vehicles – Summary report
Options for compensating potential losses of tax revenues, like raising energy taxation levels for both electricity and transport fuels and/or road charging, should be studied further. In this light it is recommended to assess options for separate metering and taxation of electricity for EVs. Harmonisation of the various circulation and purchase tax differentiations should also be considered.
To ensure that local distribution grids become EV-ready, the European Commission can initiate best-practice exchange and support pilot and demonstrations projects. Regulations could be developed obliging power generators to implement smart charging at a certain stage, e.g. when the share of EVs in the vehicle fleet in their distribution district reaches 5%.
Common plug and charging standards and protocols for data exchange need to be developed as soon as possible.
6.4 Recommendations for further study
This study identified a number of topics and issues that would require further research before more definite conclusions can be drawn: Assessment of costs and benefits of EVs, compared to other GHG reduction
options in transport. Further assessment and elaboration on potential benefits of smart
charging, including an assessment of other options for grid stabilisation and power storage, and a comparison of costs and benefits
Standardisation of smart charging. Identification of requirements from the electricity sector, battery technology and users and design of potential technical standards that could meet or facilitate these needs.
Further assessment and elaboration of conversion of current CO2 vehicle regulation to a well-to-wheel approach. Various options are discussed in this study, these should be further assessed and the best option then needs to be develop further. Particularly the development of an appropriate GHG intensity of electricity requires further study, reflecting either marginal or average emissions.
Monitoring of EV electricity use. This is an important issue from both monitoring and policy point of view which needs to be addressed in the future.
Development of potential alternative methodologies to incorporate EVs in the Renewable Energy Directive (RED) and the Fuel Quality Directive (FQD). Both regulations include electricity used for transport, but still quite crudely. This may be improved in the future, to provide a stronger incentive for renewable or low carbon electricity sources and to prevent the implementation of less cost effective options. Monitoring of electricity use in transport is an important precondition for this development.
Harmonisation of EV incentives and policies in the EU. There may be benefits to align specific parts of EV policies that are implemented on a national or regional level, in order to prevent competition between member states and to improve the overall efficiency of these policies by offering a larger, harmonised market to the car industry.
Cost-benefit analysis of battery recycling options, including an assessment of options to reduce cost of recycling of lithium-ion batteries for cars, and of the possibilities to recover the lithium and rare earth elements for reuse in new batteries.
Potential of other types of electric vehicles, e.g. electric bicycles, scooters, vans, buses and heavy duty vehicles.


