In recent years, there has been a convergence of international trade with traditional domestic markets.As imports continue to increase in many coal producing regions, the influence of trade on domesticmarkets has been twofold. Firstly, imported coal displaces domestic production and, secondly,international price trends may drive prices of what remains of the indigenous market for coal.
While international trade does not provide any additional benefits in terms of reduced CO2 at coal-fired power stations, importing coal provides many benefits, such as cost savings, improved coalquality, enhanced supply diversity, and often fills a gap which domestic supply is unable to fulfil. Thisreport examines how coal markets have evolved over the decades with utilities and heavy industrymoving away from their seemingly secure yet captive markets of domestic coal to procuring moresupplies from the international market to satisfy the need of cost reduction and better and consistentquality of fuel product. The various factors that have led to a rise in popularity of seaborne tradedcoal, and the future of domestically produced coal in the Pacific market are discussed.
This is in one of three reports which examine the changing trends in coal imports over the long termin three geographical regions: a global perspective, the Atlantic market and the Pacific market.
Acronyms and abbreviations
2 IEA CLEAN COAL CENTRE
API2 coal price indices for northwest EuropeAR as receivedARA Amsterdam, Rotterdam, and AntwerpAUS AustraliaBAFA German domestic pricing systemBAT best available technologyCa CalciumCAA Clean Air Act (USA)CAPP Central AppalachiaCCGT combined cycle gas turbineCFBC circulating fluidised bed combustionCIF cost, insurance and freight (coal price at destination port prior to unloading)CIL Coal India LimitedCl chlorineCNCIEC China National Coal Import Export CommissionCOL ColombiaCOP Conference of the PartiesCrore 10 millionDB Deutsche BahnDES delivered ex-shipDGTREN Directorate General of Transport and Energy (EU)dwt dead weight (freight capacity, typically the maximum cargo capacity)EC European CommissionEIA Energy Information Administration (US Department of Energy)ELV emission limit valuesEUETS European Union Emissions Trading SystemFGD flue gas desulphurisationFOB free on board (coal price at export port)GDP gross domestic productGJ/t gigajoule per metric tonneGt gigatonne (1000 Mt)GWe gigawatt electrical generating capacity (= 1000 MWe, one watt = 1 joule per second)ha hectareHCl hydrogen chlorideHEPCO Hokkaido Electric Power CompanyHGI Hardgrove Grindability IndexIDT Fusibility of AshIEA International Energy AgencyIEA CCC International Energy Agency Clean Coal CentreIED Industrial Emissions DirectiveIGCC integrated gasification in combined cycleINDO IndonesiaINR Indian rupeesIPP independent power producer/productionkcal/kg kilocalorie per kilogramme (typically net), referring to the heating value of steam
coalkm kilometreKRW Korean Won (currency)Lakh 100 units, 102
LCPD Large Combustion Plant Directive (EU)
LHV lower heating valueMCIS McCloskey Coal Information ServicesMETI Ministry of Economy, Trade, and IndustryMg magnesiummg/m3 milligrammes per cubic metreMJ/kg megajoules per kilogrammeMoU memorandum of understandingMPa mega PascalMt million tonnesMtce million tonnes of coal equivalent (multiply by 0.7 to obtain Mtoe)Mtoe million tonnes of oil equivalent (divide by 0.7 to obtain Mtce)MWe megawatt electricMWth megawatt thermalNAPP Northern AppalachiaNAR net as received, for coal pricingNCV net calorific valueNDRC National Development and Reform Commissionnm nautical mileNOx nitrogen oxide compoundsNWE northwest EuropeOECD Organisation for Economic Cooperation and Development (OECD)POL PolandPRB Powder River BasinR&D Research and developmentR/P reserves to production ratioRB Richard’s Bay (same as RBCT)RBCT Richard’s Bay Coal Terminal (Republic of South Africa)RMB Chinese renminbi (currency)RUSS RussiaScoTa Standard Coal Trading AgreementSCR selective catalytic reductionSOx sulphur oxide compoundsSSY Simpson, Spence, and Youngt metric tonneTEPCO Tokyo Electric Power CompanyTPES Total primary energy supply (net balance of production, trade, storage and losses)TWh terawatt hour (equal to 1000 GWh; 1,000,000 MWh)UMPP ultra mega power projectWTO World Trade Organisation
3Impacts of seaborne trade on coal importing counries – Pacific market
5Impacts of seaborne trade on coal importing counries – Pacific market
Internationally traded coal has matured over the last 30–40 years with immense potential for furthergrowth. Yet for some time, international trade has accounted for some 15–20% of world supply,which means locally produced coal still accounts for more than 80% of all the coal consumed in theworld.
In recent years, there has been a convergence of international trade with traditional domestic markets,with imports increasing into many coal producing regions. The influence of trade on domestic marketshas been twofold. Firstly, imported coal displaces domestic production; secondly, international pricetrends may drive prices of what remains of the indigenous market for coal if imports are significantenough.
In many regions, where transport allows, imported coal has displaced locally produced coal for onereason or another. Key questions that arises are: to what extent imports displace domesticallyproduced coal; and what have been the key drivers of this displacement. There is no one reason for thedecline of coal production in many OECD countries. This makes the assessment of domestic coalproduction, based on the effects of imported coal alone, a less than straightforward exercise.
This report covers the Pacific markets of Japan, Korea, India and China. This country selectionincludes some of the largest importers of steam coal in the world; India and China are coveredextensively by many analysts worldwide, not least by the IEA CCC, and these countries areconsidered the future leading coal importers. Under various scenarios, past editions of the IEA WorldEnergy Outlook place China and India as the two nations that are foremost to push coal demandhigher into the future. China’s coal demand alone accounts for half of global demand; the Chinesemarket will therefore be the linchpin for the global market for some years. India is also set to play anincreasing role and, over the next few decades, could displace the USA as the second largest coalmarket in the world.
However, it is easy to ignore the importance of countries like Japan and Korea which remain thelargest importers of hard coal in the world. Both countries are in the top three coal importing countrieswith China, while Chinese Taipei (formerly Taiwan) is the fourth largest importer.
For both industrialised and industrialising Asia, imported coal offers a source of coal undercircumstances where domestic producers are less able to supply. In the case of China and India whichare rich in coal reserves, this is purely a function of inadequate transportation infrastructure. Japan andKorea on the other hand have low coal reserves that suffer from high costs of extraction.
Non-OECD nations will account for all the growth in coal demand in coming years, regardless ofwhich scenario in the WEO is considered. Even when taking into account a reduction in OECDdemand, world demand could increase by between 1000 Mtce and 3000 Mtce in the period 2009 to2035 under the New Policies and Current Policies scenarios respectively.
While it is straightforward to identify the various factors that influence coal switching to importedsupplies, it is less straightforward to quantify the degree of these influences. This report on the Pacificmarket provides an understanding of some of the rudimentary concepts that determine the penetrationof coal into coal importing markets:� coal’s role in primary energy supply;� coal supply trends and the increasing role of international trade;� the demand for steam coal in the power generating sector;� cost advantages of coal importing;� coal import logistics.
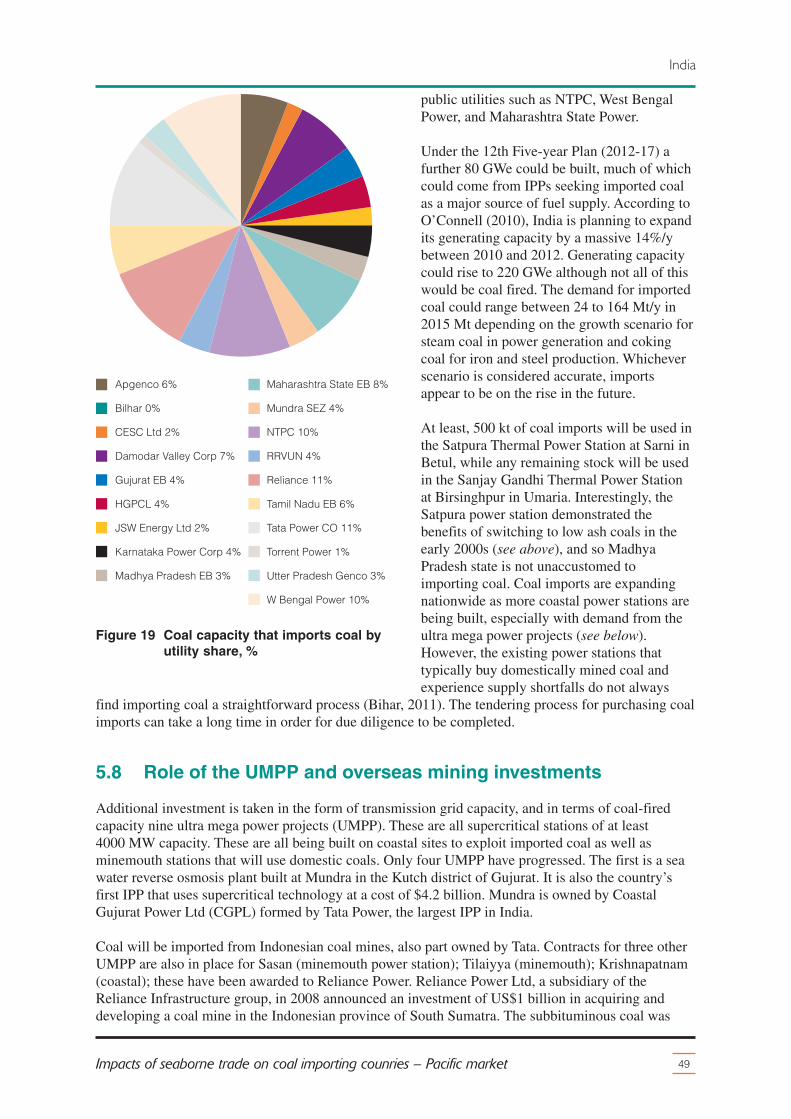
The analysis includes the mapping and location of power stations that might use foreign importedcoal, along with the mode of inland transport, possible routes, and the likely ports of entry. There isalso discussion on the structure of the coal mining industry, the comparative cost of mining hard coalwithin each country with imported coals, and where applicable the financial aid that might be awardedto the hard coal industries.
6 IEA CLEAN COAL CENTRE
Introduction
2 Japan
7Impacts of seaborne trade on coal importing counries – Pacific market
Japan is a country roughly the same land area as Germany and has a population of 127 million.Population growth has seen a decline and Japan is considered an ageing country, although this is morean indication of life expectancy which is better than in most OECD nations. The labour market isoften criticised for being less flexible than that in Europe or the USA, but generally highly educated.The Japanese economy remains a global leader in high tech design and manufacturing and personalwealth is high with spending based more on savings than debt, although national debt is high. Japan’seconomy relies on manufacturing exports, but the recent global economic troubles and naturaldisasters in Japan have dented prospects in the near term.
In past decades, Japan’s annual economic growth has been spectacular, averaging 10%/y in the 1960s,5%/y in the 1970s, 4%/y 1980s, but then by the 1990s, growth slowed to 1.7%/y following the Tokyostock market crash of 1990. Despite this economic downturn, Japan was still the second largesteconomy in the world behind the USA, but the situation changed with the emergence of newsuperpowers. In 2001 Japan was overtaken by the China in terms of economic size, making Japan thethird largest economy in the world which it remains today. Government debt is double that of GDP,with GDP estimated at US$ 4.3 trillion. Japan suffers from deflation; the value of goods in theeconomy appears to be shrinking, and so perhaps are overvalued.
Of course Japan’s most recent recession has been due to the global downturn and reduced demand forexport goods, but interestingly, Japan was less exposed to subprime mortgages or their derivativeinstruments, and so the economy weathered some of the mistakes made by western lending practices.In early 2011, the natural disaster and resulting incident at the Fukushima Daiichai power plantaffected homes, industry, and manufacturing which compounded the problems already experienced bythe global economic downturn.
Currency rates have been a blessing and a curse for Japan. Between 2000 and 2008, the US$ wastrading at 110–120 yen, but in 2009 the dollar dropped below 100 yen. By 2011, the dollar haddropped to 80 yen. The devaluation of the US dollar has been harmful in terms of making Japanesedomestic currency revenues from export trade much worse than five years ago. Yet, the currencymovement would also go some way to soften the blow of the rising price of fossil fuel imports, onwhich the country is dependent.
2.1 Primary energy
At almost 710 Mtce (500 Mtoe), the entire Japanese energy market is almost twice that of Korea. Coalprovided 20–30% of the total primary energy supply (TPES) in 2010, while gas was around 15–17%,and oil was 38–41%. According to IEA (2010) data, Japan imported 86% of its primary energy. InJune 2010, the Ministry of Economy, Trade, Industry (METI) announced the intention to increaseenergy self sufficiency to 70% by 2030. Energy security and cutting CO2 emissions however were thepriorities, forging stronger relationships with energy producing countries (notably the Australian coalindustry) and, at the time, increasing the role played by nuclear power.
Almost all of the country’s coal supply is imported and used within the country; the same applies tonatural gas (LNG) supplies. Oil imports (120 Mtoe of crude and 33 Mtoe of products) are re-exportedas products. Some 60% of oil is used within the economy but 40% is re-exported as oil products(45 Mtoe) or consumed in international bunkers (13 Mtoe). Renewables are a small percentage of thetotal energy supply, but energy policy in Japan is gearing up renewable-based generation and energyefficiency development in the light of the possible demise of nuclear and coal-fired power within thecountry for environmental reasons.
Under the 15th Conference of the Parties (COP15) of United Nations Framework Convention onClimate (Copenhagen, December 2009), Japan registered a 25% reduction of greenhouse gasemissions as a target for 2020, compared to a 1990 base year. Amongst a suite of aims and objectives,Japan had planned to replace fossil fuelled stations with nuclear, but this objective may face greateropposition in favour of renewable energies, biomass, hydroelectricity, geothermal, and smart grids.Japan’s history of R&D is impressive, but energy costs are already high, many business run efficiently,and the development of renewables has been slow for cost reasons.
Coal is considered a secure and established fuel for power generation. In some parts of the world, coalis considered a depleting resource but, internationally, coal is far from scarce. For Japan, coal-firedpower is an essential and relatively stable component of the power station fleet, as electricity accountsfor more than 50% of household energy consumption, compared with just 27% in Korea; this is a highproportion, similar to countries such as the USA.
Current energy policy is in a state of uncertainty in the aftermath of the Fukushima incident. While itis likely that the building of nuclear plants may be shelved, it is possible that within 10–20 years thegovernment will need to come to terms with cutting CO2 emissions, and nuclear power expansion maywell resume. Despite the recent negative events, Japan remains an enviable world leader in R&D,industrial production, and in terms of coal-fired power stations it achieves some of the highestefficiency and cleanest power plants of their kind in the world.
2.2 Coal demand and supply
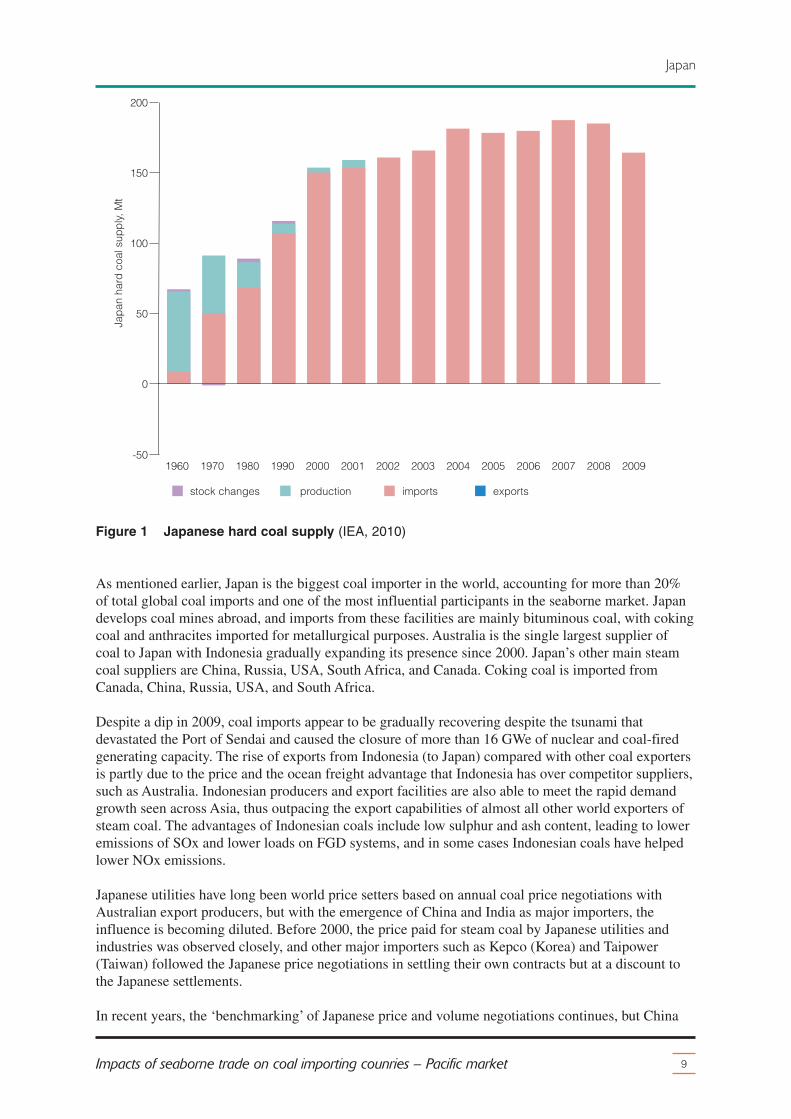
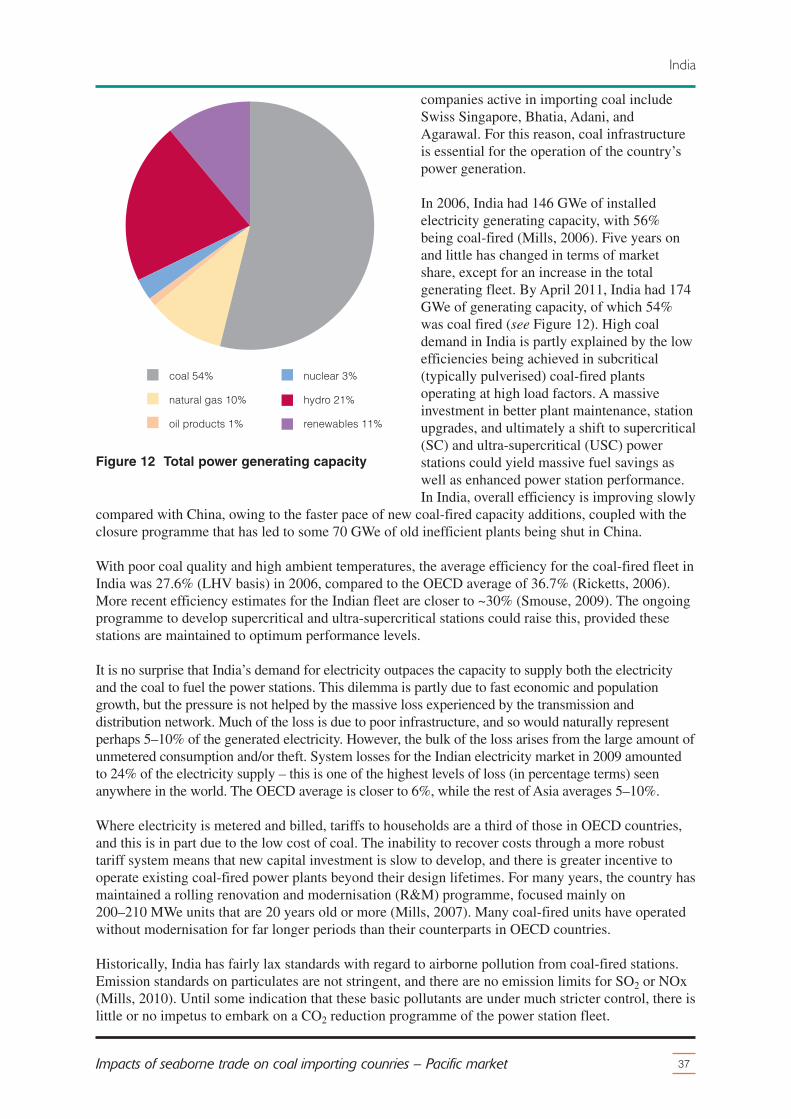
In 2008, primary coal consumption increased by 3.6% from the previous year, reflecting the increaseddemand for electricity. Coal accounted for 23% of the total primary energy supply and 27% of totalpower generation. Japan consumed 177 Mtce (123.7 Mtoe) of coal in 2010, more than double theconsumption in the 1980s, during the period of Japan’s highest economic growth. Domestic coalproduction only accounts for 0.4% of the country’s needs; Japan therefore is almost wholly reliant onimported coal (see Figure 1).
Coal will continue to play a role in Japan’s energy sector, mainly for power generation, and certainindustrial sectors such as iron and steel manufacture, cement, and paper and pulp. In 2008, theJapanese power sector had 44 GWe of coal-fired generating capacity in operation (a range of estimatesput capacity at 42–46 GWe). Coal accounted for 16% of the total power generating capacity in thecountry which was 280.5 GWe in 2008. The coal fleet emitted 414 Mt of CO2 and produced 288 TWhof electricity in 2008, a fall of 5% on 2007. In 2009, production continued to drop by 3%, butrecovered in 2010 to levels of generation last seen in 2008.
The structure of Japan’s power market is divided into ten geographical regions or prefectures, eachdominated by one privately owned monopoly which controls generation, transmission, anddistribution. The largest utility is the Tokyo Electric Power Company (TEPCO). All power utilitiesaccount for 75% of the country’s public generating capacity; the remainder consists of two majororganisations, the Japan Atomic Power Company (JAPC) which operates three nuclear plants, andJ-Power which operates 16 GWe of thermal and hydroelectric capacity.
In the north is the large island of Hokkaido where coal-fired and nuclear power plants provide a significantproportion of the prefecture’s power supply. Hokkaido’s climate is such that the winters can be severe andnuclear and coal-fired power account for a bulk of the baseload generation. Domestic coal featuresprominently, ahead of oil and renewables for this region. Seven coal mines are located in Hokkaidoprefecture, producing coal for local power generation plants. In 2006, coal was produced mainly by anunderground mine operated by Kushiro Coal Mine Co Ltd, and six other small-scale open pit mines. TheKushiro mine, which was a centre for transferring Japanese coal technology to other countries in Asia,produces about 800,000 t; the remaining six mining companies produce a total of about 540,000 t.
8 IEA CLEAN COAL CENTRE
Japan
As mentioned earlier, Japan is the biggest coal importer in the world, accounting for more than 20%of total global coal imports and one of the most influential participants in the seaborne market. Japandevelops coal mines abroad, and imports from these facilities are mainly bituminous coal, with cokingcoal and anthracites imported for metallurgical purposes. Australia is the single largest supplier ofcoal to Japan with Indonesia gradually expanding its presence since 2000. Japan’s other main steamcoal suppliers are China, Russia, USA, South Africa, and Canada. Coking coal is imported fromCanada, China, Russia, USA, and South Africa.
Despite a dip in 2009, coal imports appear to be gradually recovering despite the tsunami thatdevastated the Port of Sendai and caused the closure of more than 16 GWe of nuclear and coal-firedgenerating capacity. The rise of exports from Indonesia (to Japan) compared with other coal exportersis partly due to the price and the ocean freight advantage that Indonesia has over competitor suppliers,such as Australia. Indonesian producers and export facilities are also able to meet the rapid demandgrowth seen across Asia, thus outpacing the export capabilities of almost all other world exporters ofsteam coal. The advantages of Indonesian coals include low sulphur and ash content, leading to loweremissions of SOx and lower loads on FGD systems, and in some cases Indonesian coals have helpedlower NOx emissions.
Japanese utilities have long been world price setters based on annual coal price negotiations withAustralian export producers, but with the emergence of China and India as major importers, theinfluence is becoming diluted. Before 2000, the price paid for steam coal by Japanese utilities andindustries was observed closely, and other major importers such as Kepco (Korea) and Taipower(Taiwan) followed the Japanese price negotiations in settling their own contracts but at a discount tothe Japanese settlements.
In recent years, the ‘benchmarking’ of Japanese price and volume negotiations continues, but China
9Impacts of seaborne trade on coal importing counries – Pacific market
tends to be influenced by domestic market factors. The higher prices paid by Japanese buyers reflectsthe value placed on locking in production and investment to ensure security of supply from preferredcoal companies. During the price slump of 2009, the steam coal business would have been worthUS$9.4 billion, while coking coal imports would have been worth approximately US$6.5 billion,making the Japanese coal import market worth US$16 billion.
Japan’s role as a leading importer of hard coal is set to decline, although it will remain significant.Uchiyama (2009) carried out research at the Institute of Energy Economics of Japan (IEEJ) andconcluded that coal imports to Japan could see a fall in future decades, while most major economieselsewhere in Asia will see growth. This pattern of coal trade is consistent with projections by otherworld analytical groups such as the IEA, with non-OECD nations accounting for an increasingproportion of imports.
2.3 Domestic coal production
According to APEC (2010), Japan has a small reserve of bituminous coal at just 355 Mt; at currentproduction rates Japan’s reserves could last more than 370 years. However, Japan’s reserves are sosmall they could not meet the country’s needs. With steam coal demand at 125 Mt in 2010, this wouldhave exhausted Japan’s reserves in less than three years.
In the 1990s, the coal industry in Japan underwent major restructuring due to its low competitiveness,and domestic production decreased by over 60% to 3 Mt in 2001. By 2002, the industry produced just0.7 Mt after the closure of the Ikeshima mine and reorganisation of Taiheyo mine in 2001. In 2010,the BP Statistical Review of World Energy put Japanese coal production at 0.9 Mt, even though theIEA (2010) shows all production ending in 2002. In the past Japan had a large coal mining industry,but as working seams became increasingly deep and more remote the cost of domestically mined coalrose to approximately three times that of imported coal. The government subsidised the domestic coalmining industry in order to maintain its viability; however, through structural adjustments, subsidieswere reduced and coal production gradually decreased.
The IEA Japan 2008 Review stated that Japan had eight remaining mines in 2008, so thereforerecently recognised the existence of these mines. While production was negligible, one undergroundand seven opencast mines were in operation. In 2002, subsidies were eliminated. NEDO (2011)confirms the operation of eight coal mines operating with production data for 2009. In the early1950s, Japan had almost 950 mines producing 47 Mt of coal per year. Interestingly, the countryunderwent a massive cut in mine numbers with a minimal cut in production in the 1960s. By 1992,Japan had less than 20 operating mines which produced just over 8 Mt/y.
One of the last of Japan’s coal mines is the Kushiro mine which has been mining coal under the seafor more than 7 km. The seam is gently dipping at 5–6 degrees and spreads 2.2 km east to west, and4 km north to south. The calorific value of the coal is 6100 kcal/kg, with 0.2–0.3% sulphur content,making Japan’s coal an enviable product by world standards. With these average coal qualities, clearlythe demand for imports is based on economics and cost. Every coal-fired power station in Japan isequipped with FGD to meet strict air quality, but this does not have any bearing on any switch toimported coal. If it were economic or practical to do so, theoretically Japan could be an exporter ofsteam coal based on quality alone.
Coal at the Kushiro mine is extracted using a longwall system operating over a 320 metre face.Continuous mining is also being exploited. Production was some 0.5 Mt/y at the Kushiro mine, theonly underground mine in Japan. At Kushiro coal mine, about 2.5 million m3/y of methane gas isrecovered from mined-out areas and is utilised as fuel for a utility boiler at the mine. The remainingseven opencast mines accounted for 0.8 Mt/y production in 2008. Government policy now onlysupports clean coal technologies and upstream coal resource development in other countries such as
10 IEA CLEAN COAL CENTRE
Japan
Vietnam. The mining companies now have responsibility for mining liabilities such as subsidence andmining pollution.
Japan today offers extensive training and exploration expertise for other countries, not least to China,Vietnam, and the world’s (current) leading steam coal exporter, Indonesia. Mining engineeringservices in mechanised mining systems, safety, and management are all provided. The organisationJCoal (Japan Coal Energy Center) was commissioned by NEDO to carry out coal exploration to targetcoal resources in other countries. Japan’s expertise in coal resource assessment and mine operations istherefore as essential now as when the Japanese domestic industry was at its peak. In addition tomining expertise, Japan is world renowned for developing various aspects of clean coal technology forpower generation from eliminating airborne pollutants and fly ash from flue gases to work on CO2
storage.
METI plans to begin construction of CCS test facilities in Hokkaido with the aim to bring thistechnology into operation in April 2016 (JT, 2012). The plan calls for CO2 emitted from oil refineriesin Tomakomai and Muroran, in Hokkaido, to be captured and shipped via tankers and pipelines to twosandstone beds under the sea. One of the sandstone beds is 1.1 to 1.2 km below the ocean floor, andthe other is 2.4 to 3 km below the seabed. Both zones have deep layers of mudstone to help preventany CO2 release. METI experimented between 2003 and 2005 in storing about 10 kt of CO2 under theground in Nagaoka, Niigata Prefecture, and concluded the gas could be contained safely for at leastten centuries.
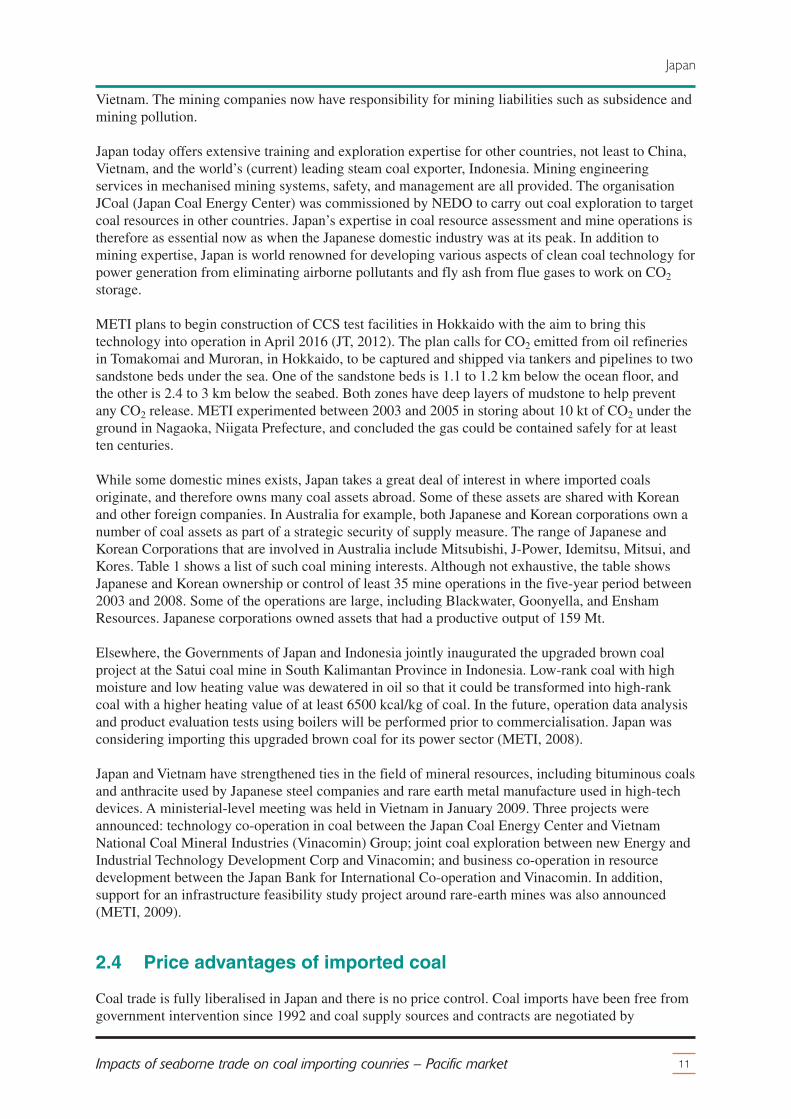
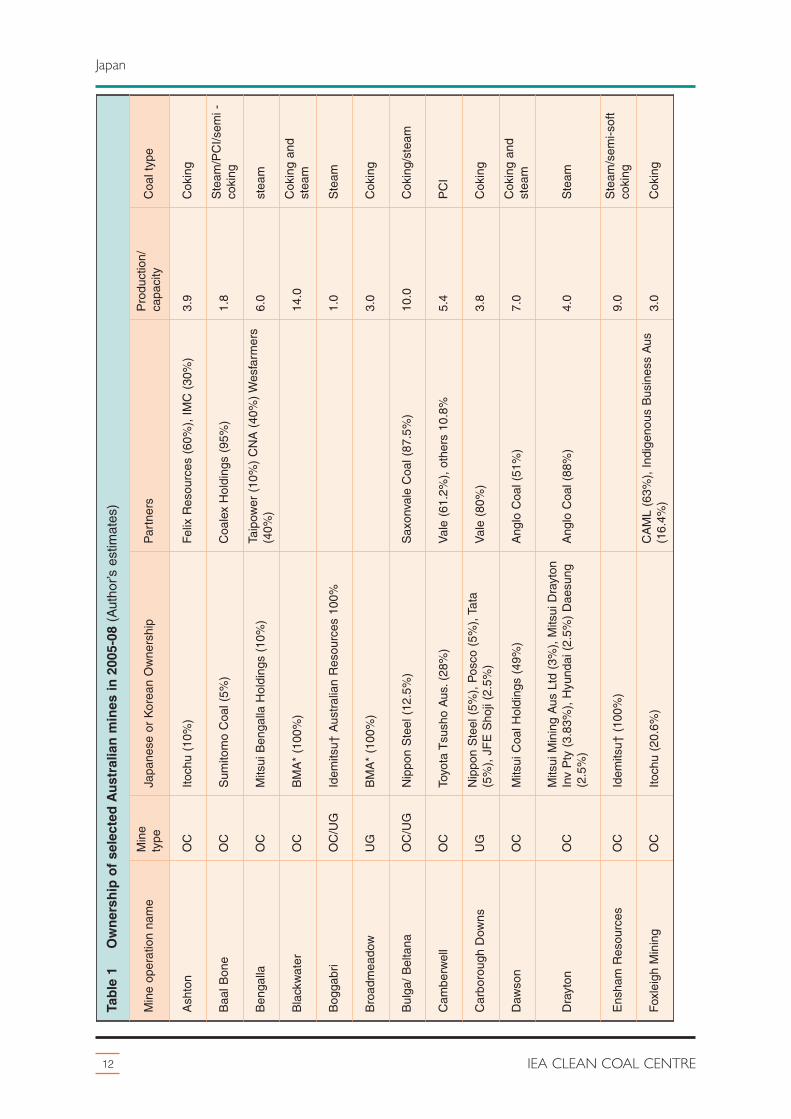
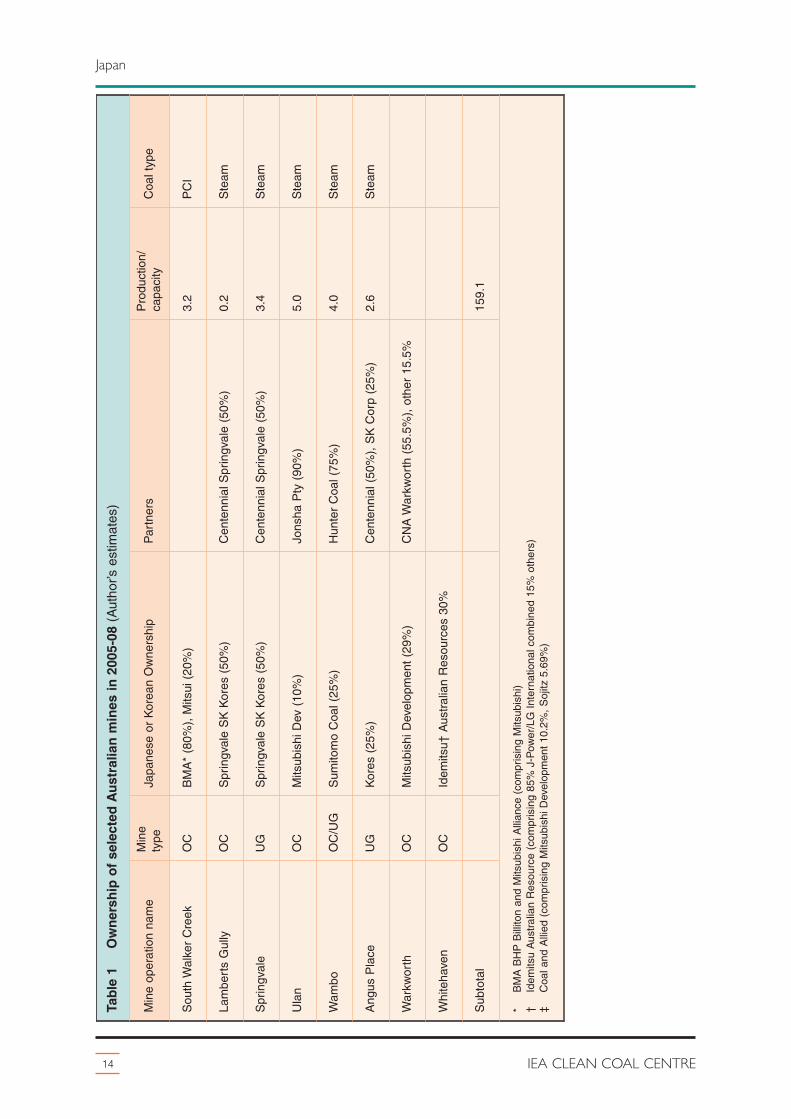
While some domestic mines exists, Japan takes a great deal of interest in where imported coalsoriginate, and therefore owns many coal assets abroad. Some of these assets are shared with Koreanand other foreign companies. In Australia for example, both Japanese and Korean corporations own anumber of coal assets as part of a strategic security of supply measure. The range of Japanese andKorean Corporations that are involved in Australia include Mitsubishi, J-Power, Idemitsu, Mitsui, andKores. Table 1 shows a list of such coal mining interests. Although not exhaustive, the table showsJapanese and Korean ownership or control of least 35 mine operations in the five-year period between2003 and 2008. Some of the operations are large, including Blackwater, Goonyella, and EnshamResources. Japanese corporations owned assets that had a productive output of 159 Mt.
Elsewhere, the Governments of Japan and Indonesia jointly inaugurated the upgraded brown coalproject at the Satui coal mine in South Kalimantan Province in Indonesia. Low-rank coal with highmoisture and low heating value was dewatered in oil so that it could be transformed into high-rankcoal with a higher heating value of at least 6500 kcal/kg of coal. In the future, operation data analysisand product evaluation tests using boilers will be performed prior to commercialisation. Japan wasconsidering importing this upgraded brown coal for its power sector (METI, 2008).
Japan and Vietnam have strengthened ties in the field of mineral resources, including bituminous coalsand anthracite used by Japanese steel companies and rare earth metal manufacture used in high-techdevices. A ministerial-level meeting was held in Vietnam in January 2009. Three projects wereannounced: technology co-operation in coal between the Japan Coal Energy Center and VietnamNational Coal Mineral Industries (Vinacomin) Group; joint coal exploration between new Energy andIndustrial Technology Development Corp and Vinacomin; and business co-operation in resourcedevelopment between the Japan Bank for International Co-operation and Vinacomin. In addition,support for an infrastructure feasibility study project around rare-earth mines was also announced(METI, 2009).
2.4 Price advantages of imported coal
Coal trade is fully liberalised in Japan and there is no price control. Coal imports have been free fromgovernment intervention since 1992 and coal supply sources and contracts are negotiated by
11Impacts of seaborne trade on coal importing counries – Pacific market
Japan
12 IEA CLEAN COAL CENTRE
Japan
Table 1 Ownership of selected Australian mines in 2005-08 (
Aut
hor’s
est
imat
es)
Min
e op
erat
ion
nam
eM
ine
type
Japa
nese
or
Kor
ean
Ow
ners
hip
Par
tner
sP
rodu
ctio
n/ca
paci
ty
Coa
l typ
e
Ash
ton
OC
Itoch
u (1
0%)
Fel
ix R
esou
rces
(60
%),
IM
C (
30%
)3.
9C
okin
g
Baa
l Bon
eO
CS
umito
mo
Coa
l (5%
)C
oale
x H
oldi
ngs
(95%
)1.
8S
team
/PC
I/sem
i -co
king
Ben
galla
OC
Mits
ui B
enga
lla H
oldi
ngs
(10%
)Ta
ipow
er (
10%
) C
NA
(40
%)
Wes
farm
ers
(40%
)6.
0st
eam
Bla
ckw
ater
OC
BM
A*
(100
%)
14.0
Cok
ing
and
stea
m
Bog
gabr
iO
C/U
GId
emits
u† A
ustr
alia
n R
esou
rces
100
%1.
0S
team
Bro
adm
eado
wU
GB
MA
* (1
00%
)3.
0C
okin
g
Bul
ga/
Bel
tana
OC
/UG
Nip
pon
Ste
el (
12.5
%)
Sax
onva
le C
oal (
87.5
%)
10.0
Cok
ing/
stea
m
Cam
berw
ell
OC
Toyo
ta T
sush
o A
us. (
28%
)V
ale
(61.
2%),
oth
ers
10.8
%5.
4P
CI
Car
boro
ugh
Dow
nsU
GN
ippo
n S
teel
(5%
), P
osco
(5%
), T
ata
(5%
), J
FE
Sho
ji (2
.5%
)V
ale
(80%
)3.
8C
okin
g
Daw
son
OC
Mits
ui C
oal H
oldi
ngs
(49%
)A
nglo
Coa
l (51
%)
7.0
Cok
ing
and
stea
m
Dra
yton
OC
Mits
ui M
inin
g A
us L
td (
3%),
Mits
ui D
rayt
onIn
v P
ty (
3.83
%),
Hyu
ndai
(2.
5%)
Dae
sung
(2.5
%)
Ang
lo C
oal (
88%
)4.
0S
team
Ens
ham
Res
ourc
esO
CId
emits
u† (
100%
)9.
0S
team
/sem
i-sof
tco
king
Fox
leig
h M
inin
gO
CIto
chu
(20.
6%)
CA
ML
(63%
), I
ndig
enou
s B
usin
ess
Aus
(16.
4%)
3.0
Cok
ing
13Impacts of seaborne trade on coal importing counries – Pacific market
Japan
Table 1 Ownership of selected Australian mines in 2005-08 (
Aut
hor’s
est
imat
es)
Min
e op
erat
ion
nam
eM
ine
type
Japa
nese
or
Kor
ean
Ow
ners
hip
Par
tner
sP
rodu
ctio
n/ca
paci
ty
Coa
l typ
e
Gle
nnie
s C
reek
UG
Toyo
ta T
sush
o (2
8%)
Val
e (6
1.2%
), o
ther
s 10
.8%
1.3
Sem
i-sof
t co
king
Goo
nyel
la R
iver
side
OC
BM
A*
(100
%)
14.0
Cok
ing
Gre
gory
Crin
umU
G/O
CB
MA
* (1
00%
)
Hun
ter
Val
ley
OC
Coa
l and
Alli
ed (
Mits
ubis
hi 1
0.2%
, S
ojitz
Cor
p 5.
69%
)R
io R
into
(75
.71%
), O
ther
s (8
.4%
)11
.0S
team
Lidd
ell
OC
Mits
ui M
atsu
shim
a (3
2.5%
)E
nex
(35%
) G
abun
e (3
2.5%
)3.
0S
emi-s
oft
coki
ng
Min
erva
OC
Soj
itz C
orp
(45%
), K
ores
(K
orea
Res
ourc
eC
orp
4%)
Fel
ix R
esou
rces
(51
%)
2.5
Ste
am
Moo
larb
enO
C/U
GS
ojitz
Cor
p (1
0%),
Kor
es/K
epco
/Han
wha
Cor
p (1
0%)
Fel
ix R
esou
rces
(80
%)
10.0
Ste
am
Mt T
horle
yO
CP
osco
(20
%),
Coa
l & A
llied
‡ (8
0%)
Mus
wel
lbro
okO
CId
emits
u† (
100%
)1.
0S
team
Nor
wic
h P
ark
OC
BM
A*
(100
%)
5.5
Cok
ing
Pea
k D
owns
OC
BM
A*
(100
%)
9.0
Cok
ing
Poi
trel
OC
BM
A*
(80%
), M
itsui
(20
%)
3.0
San
dy C
reek
UG
Idem
itsu†
(10
0%)
0.5
Ste
am
Sar
aji
OC
BM
A*
(100
%)
8.0
Cok
ing
14 IEA CLEAN COAL CENTRE
Japan
Table 1 Ownership of selected Australian mines in 2005-08 (
Aut
hor’s
est
imat
es)
Min
e op
erat
ion
nam
eM
ine
type
Japa
nese
or
Kor
ean
Ow
ners
hip
Par
tner
sP
rodu
ctio
n/ca
paci
ty
Coa
l typ
e
Sou
th W
alke
r C
reek
OC
BM
A*
(80%
), M
itsui
(20
%)
3.2
PC
I
Lam
bert
s G
ully
OC
Spr
ingv
ale
SK
Kor
es (
50%
)C
ente
nnia
l Spr
ingv
ale
(50%
)0.
2S
team
Spr
ingv
ale
UG
Spr
ingv
ale
SK
Kor
es (
50%
)C
ente
nnia
l Spr
ingv
ale
(50%
)3.
4S
team
Ula
nO
CM
itsub
ishi
Dev
(10
%)
Jons
ha P
ty (
90%
)5.
0S
team
Wam
boO
C/U
GS
umito
mo
Coa
l (25
%)
Hun
ter
Coa
l (75
%)
4.0
Ste
am
Ang
us P
lace
UG
Kor
es (
25%
)C
ente
nnia
l (50
%),
SK
Cor
p (2
5%)
2.6
Ste
am
War
kwor
thO
CM
itsub
ishi
Dev
elop
men
t (2
9%)
CN
A W
arkw
orth
(55
.5%
), o
ther
15.
5%
Whi
teha
ven
OC
Idem
itsu†
Aus
tral
ian
Res
ourc
es 3
0%
Sub
tota
l15
9.1
*
BM
A B
HP
Bill
iton
and
Mits
ubis
hi A
llian
ce (
com
pris
ing
Mits
ubis
hi)
†
Id
emits
u A
ustr
alia
n R
esou
rce
(com
pris
ing
85%
J-P
ower
/LG
Int
erna
tiona
l com
bine
d 15
% o
ther
s)
‡
Coa
l and
Alli
ed (
com
pris
ing
Mits
ubis
hi D
evel
opm
ent
10.2
%,
Soj
itz 5
.69%
)
individual power utilities and steel companies with their respective suppliers. Traditionally, at least50% of steam coal imports are based on contracts of 3–5 years, 30% on one-year contracts, and 20%on the spot market. In the coking coal market, 80% are one-year contracts, and 20% are on a longerterm basis. Price negotiations are undergoing a period of uncertainty in 2012 with some majorproducers looking to increase the frequency of negotiations or consider an index linked style pricingsystem based on an agreed standardised coal quality.
Japanese coals are high in quality and fall within the specification of internationally traded coals.However, the increasingly difficult geology and extraction costs mean costs remain high. Historically,Japan maintained a heavily subsidised coal industry, partly on the grounds of security of supply.Throughout the 1990s, producer subsidies provided at least 105–139 US$/t of aid to keep Japanesecoal competitive with imported coal; around 90% of the subsidy was a price support, while the restwas for restructuring, safety upgrades, and modernisation of coal pits (IEA, 1999).
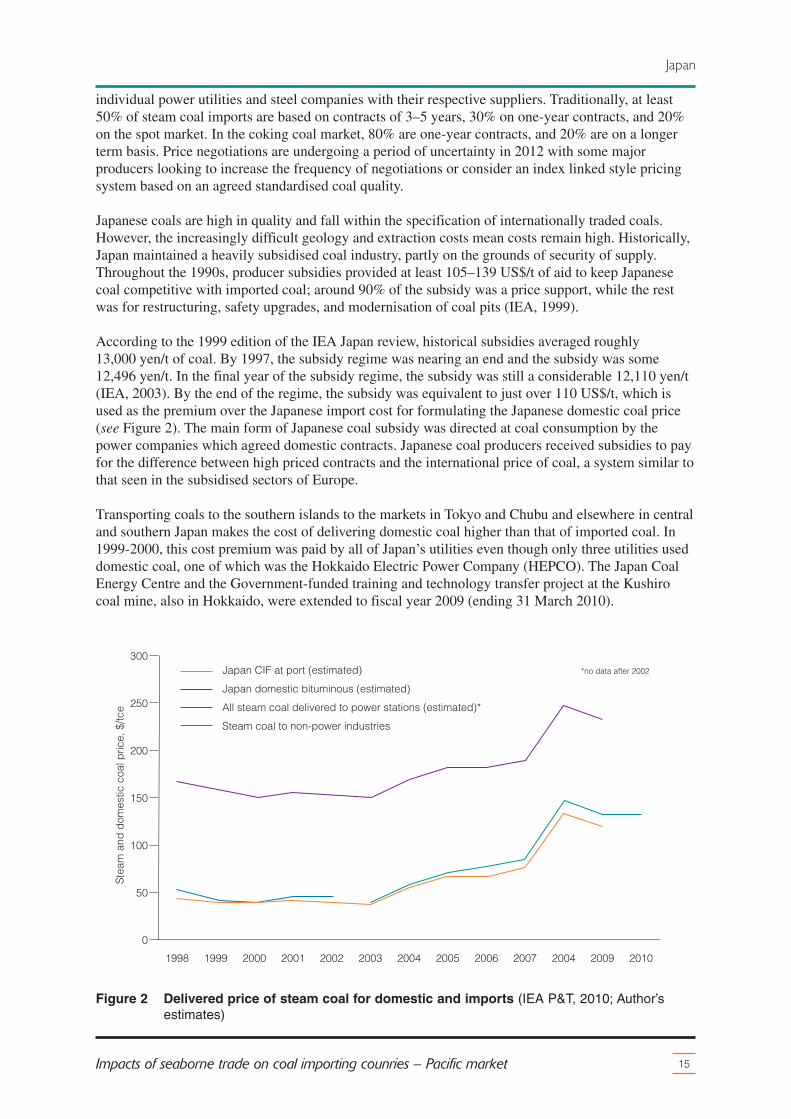
According to the 1999 edition of the IEA Japan review, historical subsidies averaged roughly13,000 yen/t of coal. By 1997, the subsidy regime was nearing an end and the subsidy was some12,496 yen/t. In the final year of the subsidy regime, the subsidy was still a considerable 12,110 yen/t(IEA, 2003). By the end of the regime, the subsidy was equivalent to just over 110 US$/t, which isused as the premium over the Japanese import cost for formulating the Japanese domestic coal price(see Figure 2). The main form of Japanese coal subsidy was directed at coal consumption by thepower companies which agreed domestic contracts. Japanese coal producers received subsidies to payfor the difference between high priced contracts and the international price of coal, a system similar tothat seen in the subsidised sectors of Europe.
Transporting coals to the southern islands to the markets in Tokyo and Chubu and elsewhere in centraland southern Japan makes the cost of delivering domestic coal higher than that of imported coal. In1999-2000, this cost premium was paid by all of Japan’s utilities even though only three utilities useddomestic coal, one of which was the Hokkaido Electric Power Company (HEPCO). The Japan CoalEnergy Centre and the Government-funded training and technology transfer project at the Kushirocoal mine, also in Hokkaido, were extended to fiscal year 2009 (ending 31 March 2010).
15Impacts of seaborne trade on coal importing counries – Pacific market
Japan CIF at port (estimated)Japan domestic bituminous (estimated)All steam coal delivered to power stations (estimated)*Steam coal to non-power industries
*no data after 2002
Figure 2 Delivered price of steam coal for domestic and imports (IEA P&T, 2010; Author’sestimates)
After 2002, the Japanese coal industry continued to produce, but free of subsidy. The power utilityHokkaido Electric, continued to pay the price of coal to keep operations going. However, whether theprice of coal is benchmarked against international prices is not clear. In theory, the industry couldfeasibly continue at its historical pre-2002 price of approximately 150 US$/t, but in reality it wouldstruggle in the steam coal market, although the PCI market could be considered. However, elements ofthe operational costs (such as diesel, electricity, steel products, maintenance, tyres) will have undergoneinflation, although Japan has also suffered from deflation and the softening of domestic prices.
2.5 Coal logistics and ports
As well as estimating differences in the cost between domestic and imported coal, Figure 2 alsoprovides information that enables an estimate of inland logistics. The figure shows the price of coaldelivered to a typical power station in Japan as published by the IEA Prices and Taxes (IEA P&T,2010), however, this price reporting ended in 2002. The only indication of steam coal prices paid bylarge users in Japan after 2002-03 is that paid by the industrial sector.
Using the delivered cost of coal to the consumer and deducting the CIF price of coal at the importterminal, a representative inland infrastructure cost can be estimated. This margin would cover thecosts of coal unloading, storage, and onward transport to the power station stockpile. As Figure 2shows, the difference between the average CIF cost of steam coal and the delivered cost to powerstations and industry varied yearly between the late 1990s and 2009. However, over this time the costof inland infrastructure averaged 8–10 US$/t. It is possible the costs have risen in recent years but thisrange seems plausible.
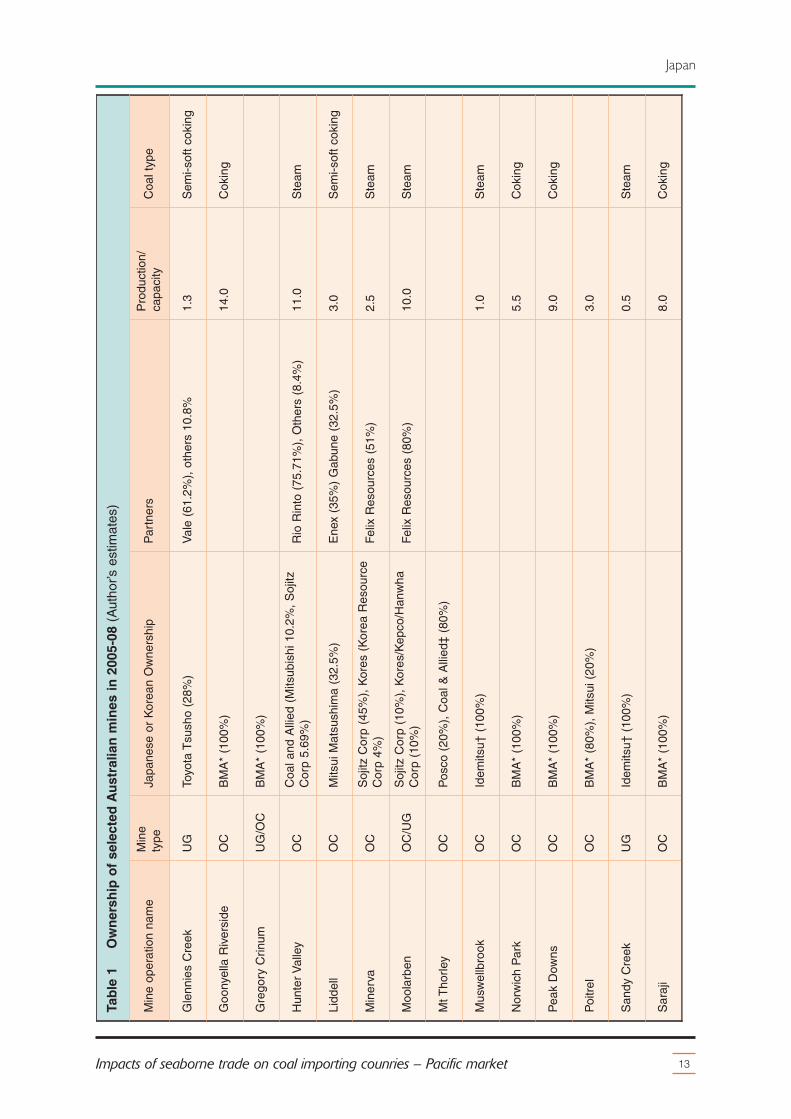
Figure 3 illustrates the distribution of coal-fired power stations in Japan, and demonstrates that most ifnot all stations are sited on the coast, a feature common with many power stations in Asia.
The map shows around 38 of Japan’s larger coal-fired stations (including three stations on the islandof Okinawa off the southern coast of Japan that are not shown). Japan has around 62 coal-firedstations (comprising of 126 units), which access coal supplies via various import terminals and ‘coalcentres’. Many of the smaller stations are onsite autoproduction plants owned and operated by heavyindustrial corporations, such as Nippon Paper and Kobe Steel.
There are at least 14 ports and coal centres where hard coal is stored and blended for consumers allaround the coast. All power stations have their own jetty facilities, or are close to storage sites many ofwhich are deep water, in addition to the nine or so dedicated coal terminals. Covered conveyor beltsare the normal methods of transferring coal a short distance from the ship to the station stockpiles, andonwards to milling facilities. As such, rail infrastructure is either not required for inland coaltransportation, or is at best limited to a few stations.
In Hokkaido, some plants that use domestic coal might receive the coal by truck, which adds to thealready high cost of production for the 1 Mt or so of steam coal that is produced every year. Figure 3is partly based on current knowledge of operating power stations, but also on maps created by the IEAin the 2003 edition of Coal Information, which was based on information published in 1999-2000. Inthis latter source are ‘coal centres’, which are described as warehouse and storage facilities, but arelikely to also be storage facilities for product blending and storage.
The IEA (2007) reported on a recently-built power plant commissioned by J-Power, called the Isogo Iin Yokohama, which was designed to use international coals as well as domestic Japanese coals. Likemany coal-fired stations in Japan, the location is close to densely populated urban locations.Consequently, the use of high efficiency technology and very low emission technology is important.The design efficiency is 42% (net LHV) necessary to minimise the coal throughput and otherwisereduce the need for burning, transporting, and storing coal.
16 IEA CLEAN COAL CENTRE
Japan
Under local Yokohama emissions regulations, emissions of pollutants are limited to 20 mg/m3 of NOx,6 mg/m3 of SOx, and 1 mg/m3 of particulates. These emission levels are lower than those specified forBAT performance under the European Large Combustion Plant Directives for gas-fired power plants.
SOx control is done using a dry FGD system using regenerable activated coke, which producessulphuric acid as a by-product. The station is costly, but designed with efficiency in mind. Importedcoal is unloaded at port facilities at Sodegaura, on the other side of the bay to where Isogo is situated,as well as Ougishima. The coal is then transferred in small 5000–6000 dwt self unloading ships. Coalis then conveyed by belt to four silos, each with a capacity of 25,000 t, which are filled and unloadedusing enclosed conveyors that use compressed air to support the conveyor belt. The coal is thenconveyed from silos to bunkers above four vertical spindle roller mills incorporating rotary classifiers.The whole transportation system is aimed at minimising dust emissions and noise.
17Impacts of seaborne trade on coal importing counries – Pacific market
Japan
South Korea
North Korea
China
Russia
power stationport
TokyoHiroshima
Fukuoka
Idemitsu coal terminal
Chiba Factory Asahi
IsogoChubu coal centre
Hirohato coal terminal
KobeSaijo
Niihamanashi
OkayamaWakayama coal terminal
Niihama coal centreMatsushima
Reihoku
Matsura KokuraKokura coal terminal Tokuyama
Hibiki coal centreMisumi Hitachinaka
Takehara Hekinan
Port of Onahama
Ishinomaki Paper MillSendaiShinchi
Hirono Unit 5Nakoso IGCC
IwanumaHaramachi or Fukushima
Sakata
Toyama-ShinkoNanao-Ota
TsurugaMaizura SC
Kamaishi
Noshiro
Tomato-Atsuma Kushiro
Sunagawa Naie
Takosago or HirohatoKakogawa
ChinaChina
Russia
North KoreaNorth Korea
Sunagawa
o
Naiea
oKushirushirmaomato-Atsuma
Kamaishi
TTomato-Atsuma
Noshir
Kokura coal ter
South Korea
Matsushimaak hkehara
South Korea
ki c
shimT OO
Misumi
Ta
Mise
okuyamaHibiki coal centr
minal TTokuyamaura
Kokura coal terKokuraMatsuraa
atsushima Niihama coal centr
OaOara
NiihihamanashiSaijaijokuokaFukuo
mHiroshim
Maizura SC
oy
okyoya
TTokyo
oyama-ShinkoTTToyama-ShinkoToyama-Shinko
I
Sakata
Iwanu
H
Sendai
Hekinanaakayama
eema c am coal centrm nalminakayama co terakayama coal t
ka Wyama
hato c
Kobe
minalohato coal ter
e
Hir
e rChubu coal centrIs goIsogo
maChiba Factor
ma
Nanao-OtOta
Maizura SC surugaTTsuruga
Kakogawaohatoakosago or HirTTakosago or Hir
Haramachi or Fukushima
Sakata
Iwanuma
Nakoso IGCC
Sendai
ono Unit 5Hir
Shinchishinomaki Paper MillIs
t of Onahama
Fa
PorHitachinaka
y Asahi actor
minalIdemitsu coal ter
Kamaishi
ReihokukNiihhamanashi
tporpower station
Figure 3 Map of coal-fired power stations and ports and handling terminals in Japan
3 Korea
18 IEA CLEAN COAL CENTRE
The Republic of Korea is a peninsular in the Sea of Japan bordered only by North Korea. It has apopulation of 49 million. More than 80% of the country is mountainous and two thirds is forested somajor centres of population and commerce are located on the coast. The country is the world’s largestshipbuilder, the top three companies being Hyundai, Samsung and Daewoo. Other heavy industriessuch as Doosan Power are world players in the design and manufacture of thermal power stations,while Samsung and LG are leading high-tech electronic manufacturers. Korea is the sixth largest steelproducer in the world, with coking coal imports of 26 Mt/y and iron ore imports of 64 Mt. Korea’sheavy industry is the largest consumer of steel per capita in the world.
Korea also has an impressive track record of long-term economic growth. In the 1970s, Korea’s percapita GDP was comparable with poorer countries in Africa and Asia. The country was under militaryrule until the late 1980s. Today, Korea is a democracy and has a GDP of 1.4–1.5 trillion US$ and isranked within the top 20 economies in the world. In 2009 economic growth slowed to 0.2%, which isstill stronger than the negative growth seen in parts of OECD Europe. The US dollar has fluctuatedagainst the Korean Won, ranging from 900 to 1400 Won between 2000 and 2011, with the highest rateseen in 2001 and the lowest in 2007. In 2011, the rate averaged 1100 Won, roughly the average for theprevious ten years.
3.1 Primary energy
In 2010, Korean TPES reached 352 Mtce (247 Mtoe) roughly half that of Japan, of which 29.4% wasprovided by coal. Oil and oil products command a large share of the TPES which is similar to manyother countries. Hydroelectricity and renewables are small, with less than 1.5% of the TPES beingprovided from these sources.
3.2 Coal in electricity generation
The electricity market is dominated by the Korean Electric Power Company (Kepco). The Koreangovernment owns a majority share of Kepco which operates 65 GWe of electrical generating capacity.Kepco comprises of six generating companies as well as other engineering subsidiaries. The sixgenerating companies include five regional monopolies that operate thermal fossil-fuelled plants, anda single national hydro and nuclear company. Each regional monopoly operates roughly 9–10 GWe ofthermal capacity. Coal is incredibly important to the Korean economy, with 44% of the nation’selectricity generation coming from coal (218 TWh out of 478 TWh in 2010). Nuclear power accountsfor 30% while natural gas CCGT is just 21%. The balance is provided by oil, hydro and renewables.
All Korea’s coal-fired fleet, operated by these five regional companies, is located on the coast and soalmost always uses imported steam coal. Some of Korea’s projects within the last decade include theYounghung thermal power plant. According to IEA (2007) the Younghung plant comprises of800 MWe units capable 43% net efficiency (LHV). The steam parameters are 24.7 MPa/566°C/566°C.The Younghung stations, operated by the Korean Southern Electricity Power Company, came online in2004, with two units, and two more in 2008 and 2009.
With 44% of Korean power coming from coal, and with coal accounting for 29% of the primaryenergy consumption, Korea is likely to maintain a massive market for coal within its own country forthe foreseeable future. Korean-based Doosan Power, a coal-fired boiler manufacturer, is one exampleof the importance of coal to Korea. Throughout the 1980s and 1990s, Korea adopted the practice ofmodular construction for their coal-fired fleet, manufacturing power units of identical size and
specification. This approach to building stations reduced capital expenditure costs, and made planningeasier. A typical unit to be commissioned using this modular system was a 500 MWe capacity withsupercritical steam conditions, many using ABB boilers and GE steam turbines, with Doosan Powerbeing a key supplier of later boilers. All of the major stations were also equipped with FGD eitherfrom new or retrofitted.
Power plants burning indigenous coal have a role to play despite the apparent higher cost of the fuel(see below). Kepco operational data for plants show how the plant utilisation for anthracite-burningstations averages 84–86% in 2010, generating a total of 7.7 TWh (net) from just 1125 MWe ofanthracite capacity. By global standards this is an extremely high load factor, normally reserved fornuclear power stations. The plants that burn imported bituminous coals are achieving an even higherload factor of 91.1%. At these load factors the stations are probably running at optimum efficiency andare without a doubt essential baseload generators for the Korean market. In 2010, this bituminousimport-coal fleet generated 181 TWh (net) from 23 GWe of capacity, eclipsing the domestic coalcapacity.
3.3 Coal supply
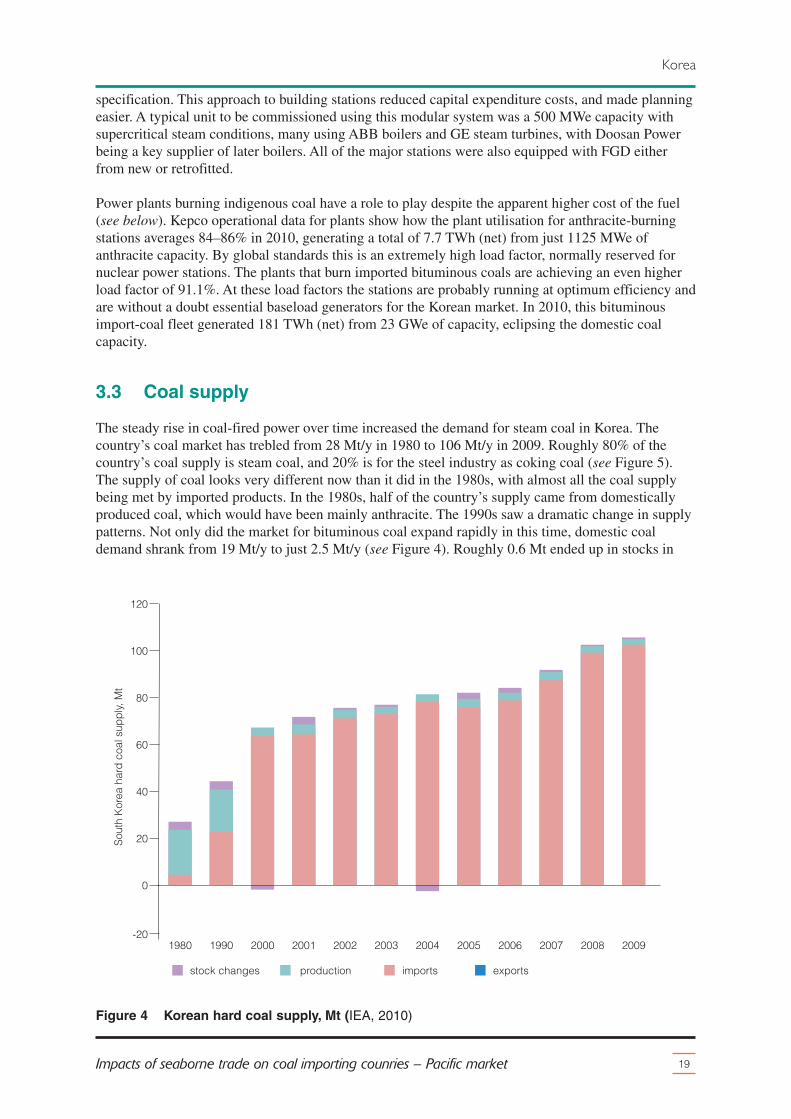
The steady rise in coal-fired power over time increased the demand for steam coal in Korea. Thecountry’s coal market has trebled from 28 Mt/y in 1980 to 106 Mt/y in 2009. Roughly 80% of thecountry’s coal supply is steam coal, and 20% is for the steel industry as coking coal (see Figure 5).The supply of coal looks very different now than it did in the 1980s, with almost all the coal supplybeing met by imported products. In the 1980s, half of the country’s supply came from domesticallyproduced coal, which would have been mainly anthracite. The 1990s saw a dramatic change in supplypatterns. Not only did the market for bituminous coal expand rapidly in this time, domestic coaldemand shrank from 19 Mt/y to just 2.5 Mt/y (see Figure 4). Roughly 0.6 Mt ended up in stocks in
19Impacts of seaborne trade on coal importing counries – Pacific market
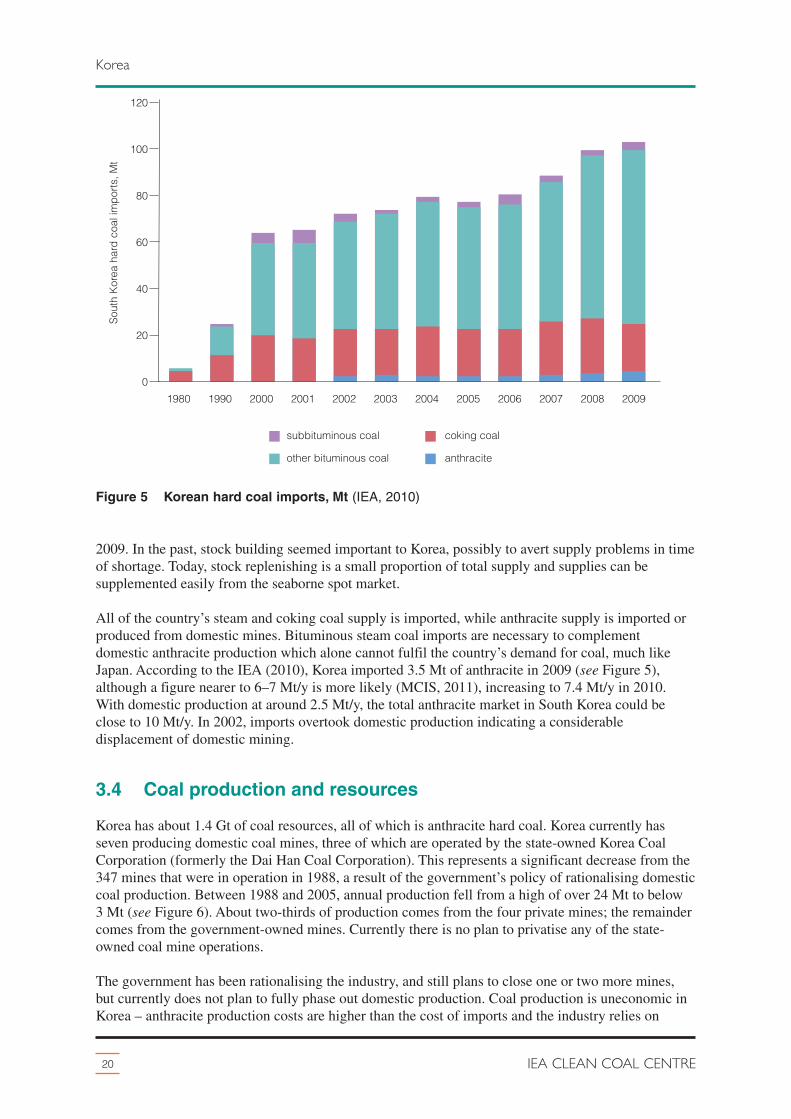
2009. In the past, stock building seemed important to Korea, possibly to avert supply problems in timeof shortage. Today, stock replenishing is a small proportion of total supply and supplies can besupplemented easily from the seaborne spot market.
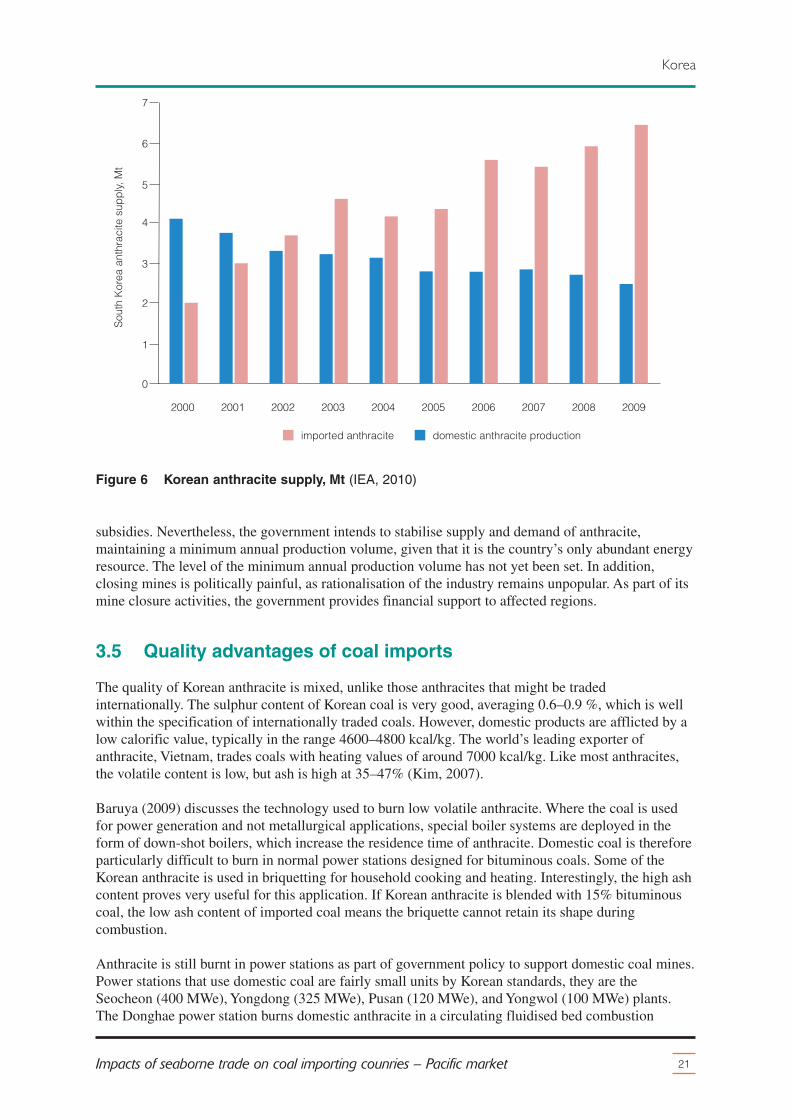
All of the country’s steam and coking coal supply is imported, while anthracite supply is imported orproduced from domestic mines. Bituminous steam coal imports are necessary to complementdomestic anthracite production which alone cannot fulfil the country’s demand for coal, much likeJapan. According to the IEA (2010), Korea imported 3.5 Mt of anthracite in 2009 (see Figure 5),although a figure nearer to 6–7 Mt/y is more likely (MCIS, 2011), increasing to 7.4 Mt/y in 2010.With domestic production at around 2.5 Mt/y, the total anthracite market in South Korea could beclose to 10 Mt/y. In 2002, imports overtook domestic production indicating a considerabledisplacement of domestic mining.
3.4 Coal production and resources
Korea has about 1.4 Gt of coal resources, all of which is anthracite hard coal. Korea currently hasseven producing domestic coal mines, three of which are operated by the state-owned Korea CoalCorporation (formerly the Dai Han Coal Corporation). This represents a significant decrease from the347 mines that were in operation in 1988, a result of the government’s policy of rationalising domesticcoal production. Between 1988 and 2005, annual production fell from a high of over 24 Mt to below3 Mt (see Figure 6). About two-thirds of production comes from the four private mines; the remaindercomes from the government-owned mines. Currently there is no plan to privatise any of the state-owned coal mine operations.
The government has been rationalising the industry, and still plans to close one or two more mines,but currently does not plan to fully phase out domestic production. Coal production is uneconomic inKorea – anthracite production costs are higher than the cost of imports and the industry relies on
21Impacts of seaborne trade on coal importing counries – Pacific market
Korea
0
2
1
3
4
6
7
5
2000 2001 2002 2003 2004 2005 2006 2007 2008 2009
Sout
h Ko
rea
anth
raci
te s
uppl
y, M
t
imported anthracite domestic anthracite production
Figure 6 Korean anthracite supply, Mt (IEA, 2010)
subsidies. Nevertheless, the government intends to stabilise supply and demand of anthracite,maintaining a minimum annual production volume, given that it is the country’s only abundant energyresource. The level of the minimum annual production volume has not yet been set. In addition,closing mines is politically painful, as rationalisation of the industry remains unpopular. As part of itsmine closure activities, the government provides financial support to affected regions.
3.5 Quality advantages of coal imports
The quality of Korean anthracite is mixed, unlike those anthracites that might be tradedinternationally. The sulphur content of Korean coal is very good, averaging 0.6–0.9 %, which is wellwithin the specification of internationally traded coals. However, domestic products are afflicted by alow calorific value, typically in the range 4600–4800 kcal/kg. The world’s leading exporter ofanthracite, Vietnam, trades coals with heating values of around 7000 kcal/kg. Like most anthracites,the volatile content is low, but ash is high at 35–47% (Kim, 2007).
Baruya (2009) discusses the technology used to burn low volatile anthracite. Where the coal is usedfor power generation and not metallurgical applications, special boiler systems are deployed in theform of down-shot boilers, which increase the residence time of anthracite. Domestic coal is thereforeparticularly difficult to burn in normal power stations designed for bituminous coals. Some of theKorean anthracite is used in briquetting for household cooking and heating. Interestingly, the high ashcontent proves very useful for this application. If Korean anthracite is blended with 15% bituminouscoal, the low ash content of imported coal means the briquette cannot retain its shape duringcombustion.
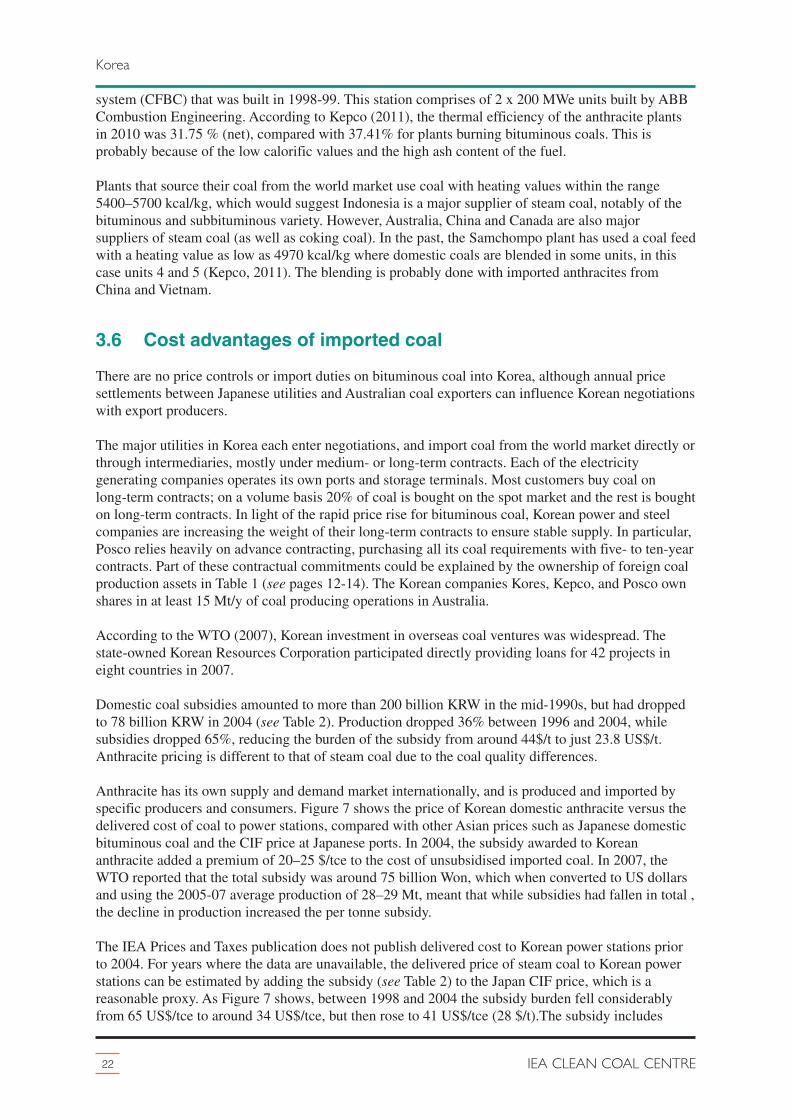
Anthracite is still burnt in power stations as part of government policy to support domestic coal mines.Power stations that use domestic coal are fairly small units by Korean standards, they are theSeocheon (400 MWe), Yongdong (325 MWe), Pusan (120 MWe), and Yongwol (100 MWe) plants.The Donghae power station burns domestic anthracite in a circulating fluidised bed combustion
system (CFBC) that was built in 1998-99. This station comprises of 2 x 200 MWe units built by ABBCombustion Engineering. According to Kepco (2011), the thermal efficiency of the anthracite plantsin 2010 was 31.75 % (net), compared with 37.41% for plants burning bituminous coals. This isprobably because of the low calorific values and the high ash content of the fuel.
Plants that source their coal from the world market use coal with heating values within the range5400–5700 kcal/kg, which would suggest Indonesia is a major supplier of steam coal, notably of thebituminous and subbituminous variety. However, Australia, China and Canada are also majorsuppliers of steam coal (as well as coking coal). In the past, the Samchompo plant has used a coal feedwith a heating value as low as 4970 kcal/kg where domestic coals are blended in some units, in thiscase units 4 and 5 (Kepco, 2011). The blending is probably done with imported anthracites fromChina and Vietnam.
3.6 Cost advantages of imported coal
There are no price controls or import duties on bituminous coal into Korea, although annual pricesettlements between Japanese utilities and Australian coal exporters can influence Korean negotiationswith export producers.
The major utilities in Korea each enter negotiations, and import coal from the world market directly orthrough intermediaries, mostly under medium- or long-term contracts. Each of the electricitygenerating companies operates its own ports and storage terminals. Most customers buy coal onlong-term contracts; on a volume basis 20% of coal is bought on the spot market and the rest is boughton long-term contracts. In light of the rapid price rise for bituminous coal, Korean power and steelcompanies are increasing the weight of their long-term contracts to ensure stable supply. In particular,Posco relies heavily on advance contracting, purchasing all its coal requirements with five- to ten-yearcontracts. Part of these contractual commitments could be explained by the ownership of foreign coalproduction assets in Table 1 (see pages 12-14). The Korean companies Kores, Kepco, and Posco ownshares in at least 15 Mt/y of coal producing operations in Australia.
According to the WTO (2007), Korean investment in overseas coal ventures was widespread. Thestate-owned Korean Resources Corporation participated directly providing loans for 42 projects ineight countries in 2007.
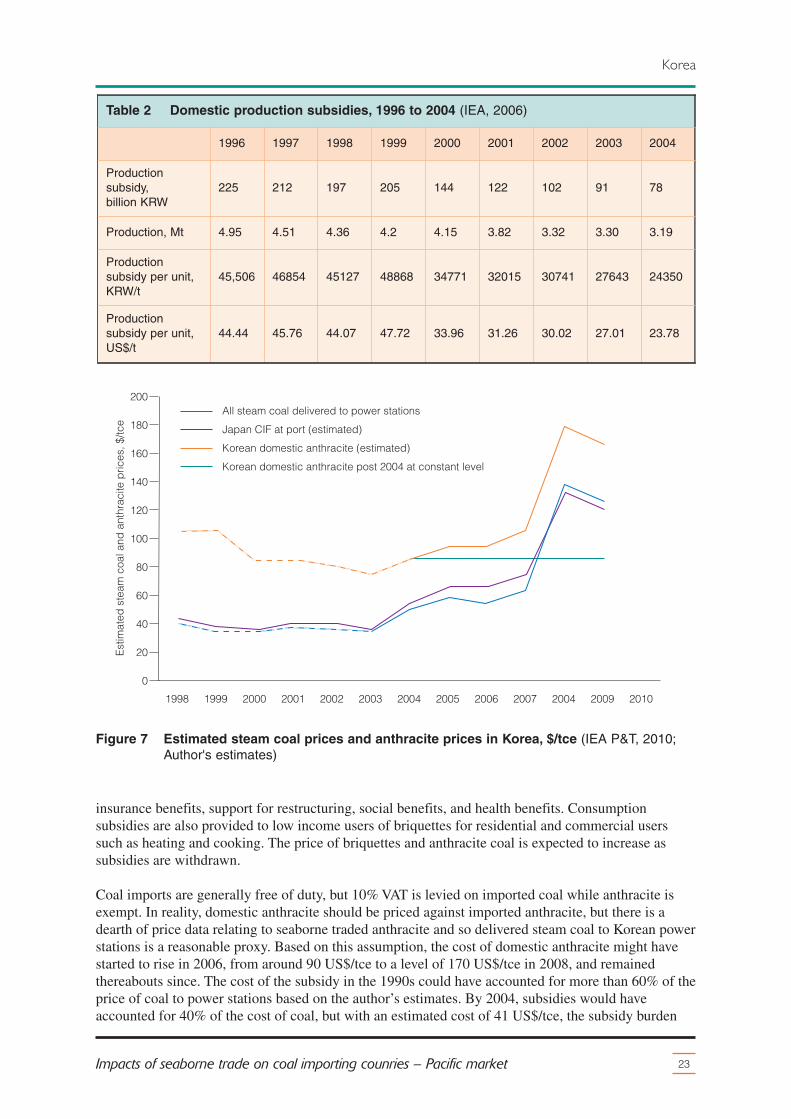
Domestic coal subsidies amounted to more than 200 billion KRW in the mid-1990s, but had droppedto 78 billion KRW in 2004 (see Table 2). Production dropped 36% between 1996 and 2004, whilesubsidies dropped 65%, reducing the burden of the subsidy from around 44$/t to just 23.8 US$/t.Anthracite pricing is different to that of steam coal due to the coal quality differences.
Anthracite has its own supply and demand market internationally, and is produced and imported byspecific producers and consumers. Figure 7 shows the price of Korean domestic anthracite versus thedelivered cost of coal to power stations, compared with other Asian prices such as Japanese domesticbituminous coal and the CIF price at Japanese ports. In 2004, the subsidy awarded to Koreananthracite added a premium of 20–25 $/tce to the cost of unsubsidised imported coal. In 2007, theWTO reported that the total subsidy was around 75 billion Won, which when converted to US dollarsand using the 2005-07 average production of 28–29 Mt, meant that while subsidies had fallen in total ,the decline in production increased the per tonne subsidy.
The IEA Prices and Taxes publication does not publish delivered cost to Korean power stations priorto 2004. For years where the data are unavailable, the delivered price of steam coal to Korean powerstations can be estimated by adding the subsidy (see Table 2) to the Japan CIF price, which is areasonable proxy. As Figure 7 shows, between 1998 and 2004 the subsidy burden fell considerablyfrom 65 US$/tce to around 34 US$/tce, but then rose to 41 US$/tce (28 $/t).The subsidy includes
22 IEA CLEAN COAL CENTRE
Korea
insurance benefits, support for restructuring, social benefits, and health benefits. Consumptionsubsidies are also provided to low income users of briquettes for residential and commercial userssuch as heating and cooking. The price of briquettes and anthracite coal is expected to increase assubsidies are withdrawn.
Coal imports are generally free of duty, but 10% VAT is levied on imported coal while anthracite isexempt. In reality, domestic anthracite should be priced against imported anthracite, but there is adearth of price data relating to seaborne traded anthracite and so delivered steam coal to Korean powerstations is a reasonable proxy. Based on this assumption, the cost of domestic anthracite might havestarted to rise in 2006, from around 90 US$/tce to a level of 170 US$/tce in 2008, and remainedthereabouts since. The cost of the subsidy in the 1990s could have accounted for more than 60% of theprice of coal to power stations based on the author’s estimates. By 2004, subsidies would haveaccounted for 40% of the cost of coal, but with an estimated cost of 41 US$/tce, the subsidy burden
23Impacts of seaborne trade on coal importing counries – Pacific market
All steam coal delivered to power stationsJapan CIF at port (estimated)Korean domestic anthracite (estimated)Korean domestic anthracite post 2004 at constant level
Figure 7 Estimated steam coal prices and anthracite prices in Korea, $/tce (IEA P&T, 2010;Author's estimates)
Table 2 Domestic production subsidies, 1996 to 2004 (IEA, 2006)
increased to around 60% again. No doubt asthe price of domestic anthracite is increased,subsidies can decrease but while there is apolicy to keep burning local coals, the utilitieswill have to raise tariffs to accommodate thehigher cost coal. If domestic coal pricesfollowed a cost plus trajectory, and weredelinked from world prices, it is possible,although unlikely, that the cost of anthracitetoday is cheaper than the cost of imported coalas seen in Figure 7 by the flat line for Koreandomestic anthracite held at 2007 levels. If thatwere the case, the price of anthracite couldbecome more economic if the price of steamcoal were to remain above 100 US$/tce.
24 IEA CLEAN COAL CENTRE
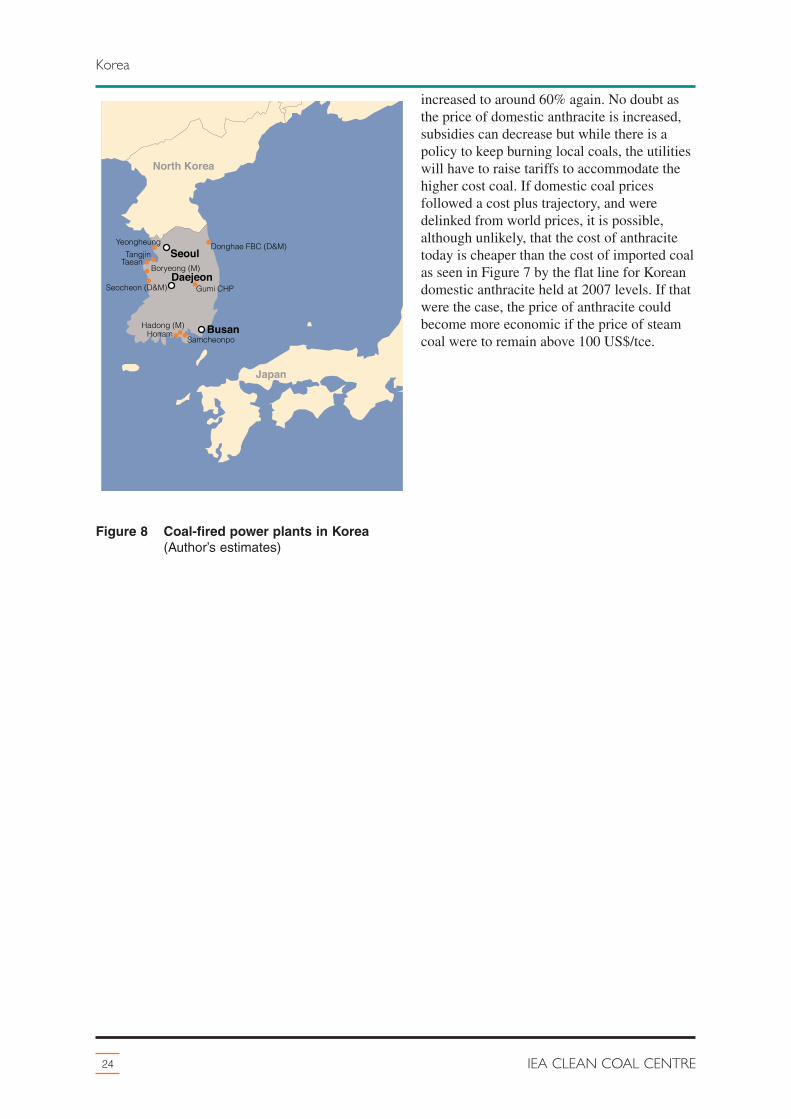
Korea
North Korea
Japan
Seoul
Daejeon
BusanHadong (M)
Gumi CHP
Donghae FBC (D&M)
Honam Samcheonpo
Boryeong (M)
Yeongheung
TaeanTangjin
Seocheon (D&M)
Figure 8 Coal-fired power plants in Korea(Author’s estimates)
4 China
25Impacts of seaborne trade on coal importing counries – Pacific market
China’s economic growth has been in double digits for almost ten years, although recent estimatessuggest that growth in 2011-12 might have dropped to around 8–9%/y. China is a $7 trillion economy,with some provinces the size of some small OECD countries. China’s modern history began in 1979when the communist party adopted a market economy approach, and manufacturing and intellectualproperty expanded. The population of 1.35 billion means China is the most populous country. Percapita electricity consumption is 2741 kWh/head (2008), four times that of India, but less than halfthat of OECD Europe.
China has considerable coal and hydroelectric resources, and has exploited both sources of primaryenergy to drive the economy. In 2010, China overtook the USA as the largest energy market and thelargest emitter of CO2 in the world. Despite the size of the energy market, per capita CO2 emissionsare a quarter of those of the USA. According to IEA World Energy Outlook (WEO, 2011), Chinacould account for a third of the future growth in global primary energy demand (an additional1564 Mtoe between 2009 and 2035). Despite some of the vast coal and hydro projects that have beendeveloped over the last twenty years, the government is aware of energy efficiency, sustainability andenvironmental issues. China now has some of the largest wind turbine manufacturers in the world, andis the world’s top investor in renewable energy having committed US$120–160 billion between 2007and 2010.
4.1 Coal in power generation
Coal-fired power generation is discussed at length in a number of reports published by IEA CCC suchas Coal use in the new economies of China, India and South Africa (Mills, 2010), Developments inChina’s coal-fired power sector (Minchener, 2010), CCS challenges and opportunities for China(Minchener, 2011), and so this Section will briefly describe the current status of coal-fired power atthe time of writing, while the significance of imported coal is discussed later.
According to the WEO (2011), in 2008 China had 792 GWe of total generating capacity; by 2009, thishad grown to 874 GWe while thermal generating capacity in 2009 increased 8% to 652 GWe. Thelargest growth occurred in wind power where it almost doubled to 16 GWe, reaching the amount ofwind power capacity that the USA and Spain had in 2007. China is fast becoming one of the mostdynamic of global wind markets, therefore partly answering the critics of coal-fired power in China.In 2010, China produced more hydroelectric output (196 GWe) than the whole of South and CentralAmerica combined.
The IEA projected a possible doubling of total generating capacity to 2378 GWe by 2035 (WEO,2011). Coal-fired capacity will rise but it will decline as a share of total capacity – 650 GWe (70%) to1159 GWe (49%) – under the new policies scenario. Coal-fired power could still account for 50–60%of the total generation. Domestic coal production will still form a large proportion of the country’ssupplies, but it is possible that imports may grow if China’s production is unable to keep pace withdemand.
4.2 Coal supply
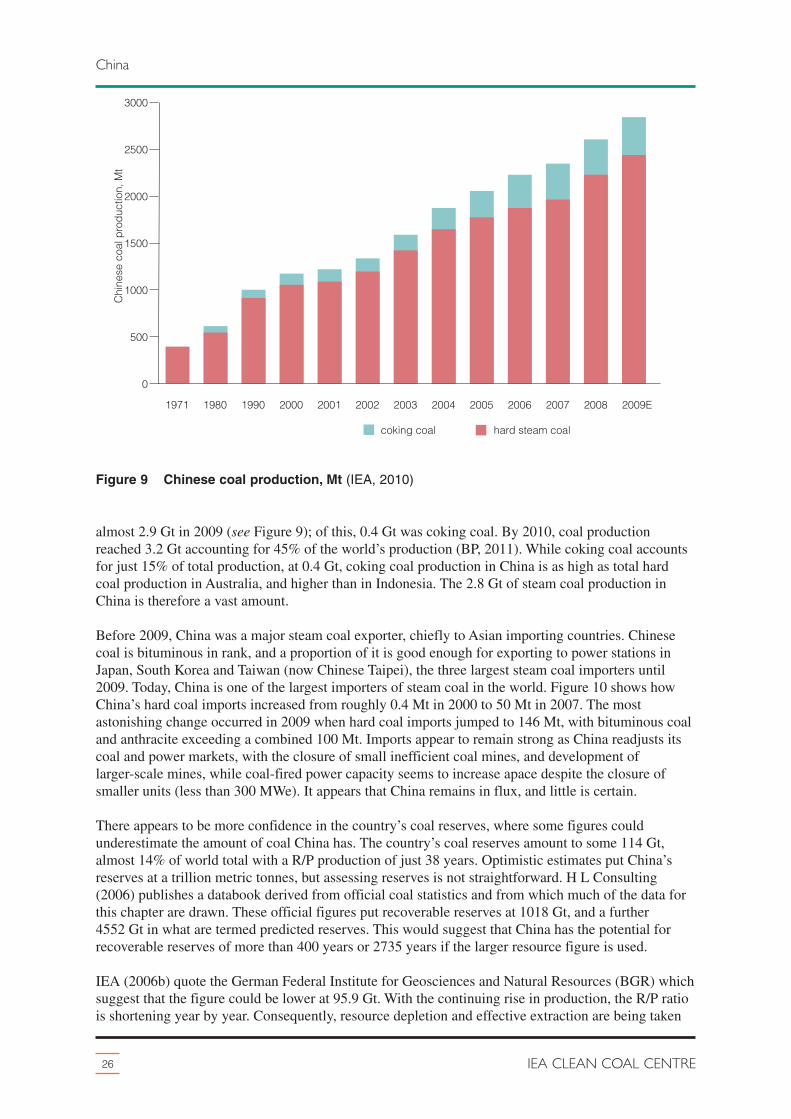
Steam or coking coal is consumed in every region of China, but mass production occurs in just a few.The coal industry in China has undergone a massive transformation since the 1970s. Moves toconsolidate the industry through the formation of supermines means the supply chain should besimplified in the future. Chinese coal production has grown from less than 0.5 Gt in the 1970s to
almost 2.9 Gt in 2009 (see Figure 9); of this, 0.4 Gt was coking coal. By 2010, coal productionreached 3.2 Gt accounting for 45% of the world’s production (BP, 2011). While coking coal accountsfor just 15% of total production, at 0.4 Gt, coking coal production in China is as high as total hardcoal production in Australia, and higher than in Indonesia. The 2.8 Gt of steam coal production inChina is therefore a vast amount.
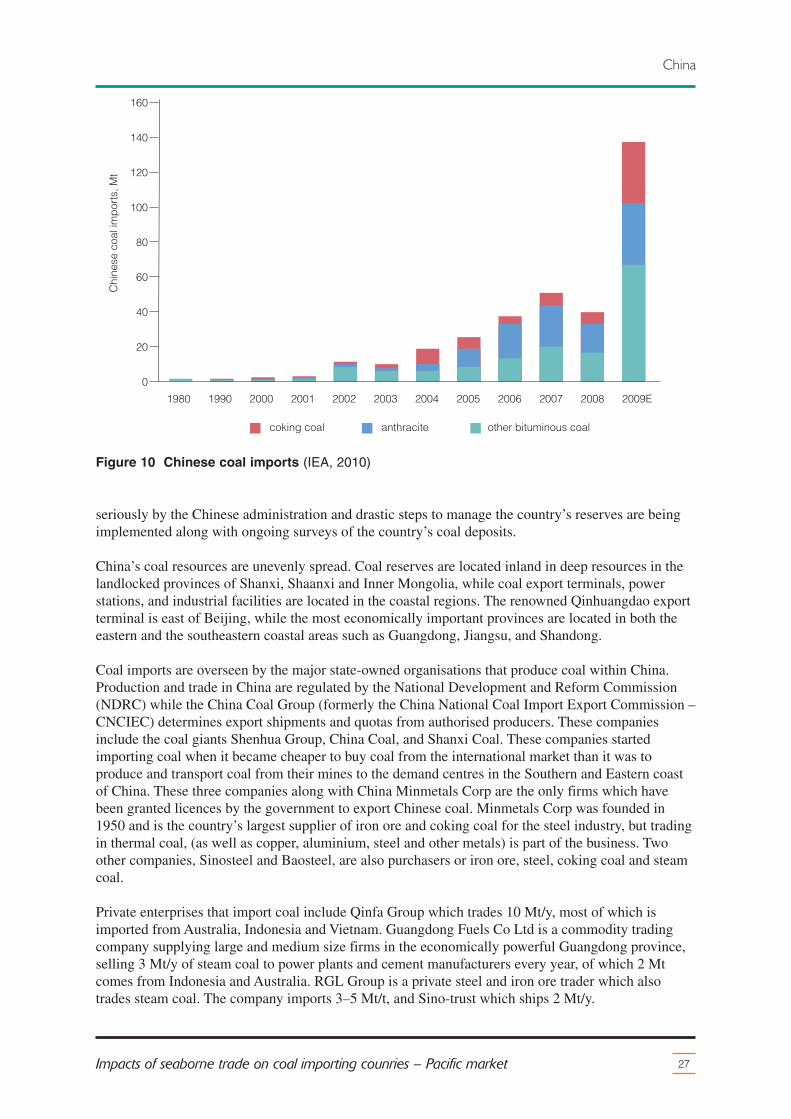
Before 2009, China was a major steam coal exporter, chiefly to Asian importing countries. Chinesecoal is bituminous in rank, and a proportion of it is good enough for exporting to power stations inJapan, South Korea and Taiwan (now Chinese Taipei), the three largest steam coal importers until2009. Today, China is one of the largest importers of steam coal in the world. Figure 10 shows howChina’s hard coal imports increased from roughly 0.4 Mt in 2000 to 50 Mt in 2007. The mostastonishing change occurred in 2009 when hard coal imports jumped to 146 Mt, with bituminous coaland anthracite exceeding a combined 100 Mt. Imports appear to remain strong as China readjusts itscoal and power markets, with the closure of small inefficient coal mines, and development oflarger-scale mines, while coal-fired power capacity seems to increase apace despite the closure ofsmaller units (less than 300 MWe). It appears that China remains in flux, and little is certain.
There appears to be more confidence in the country’s coal reserves, where some figures couldunderestimate the amount of coal China has. The country’s coal reserves amount to some 114 Gt,almost 14% of world total with a R/P production of just 38 years. Optimistic estimates put China’sreserves at a trillion metric tonnes, but assessing reserves is not straightforward. H L Consulting(2006) publishes a databook derived from official coal statistics and from which much of the data forthis chapter are drawn. These official figures put recoverable reserves at 1018 Gt, and a further4552 Gt in what are termed predicted reserves. This would suggest that China has the potential forrecoverable reserves of more than 400 years or 2735 years if the larger resource figure is used.
IEA (2006b) quote the German Federal Institute for Geosciences and Natural Resources (BGR) whichsuggest that the figure could be lower at 95.9 Gt. With the continuing rise in production, the R/P ratiois shortening year by year. Consequently, resource depletion and effective extraction are being taken
seriously by the Chinese administration and drastic steps to manage the country’s reserves are beingimplemented along with ongoing surveys of the country’s coal deposits.
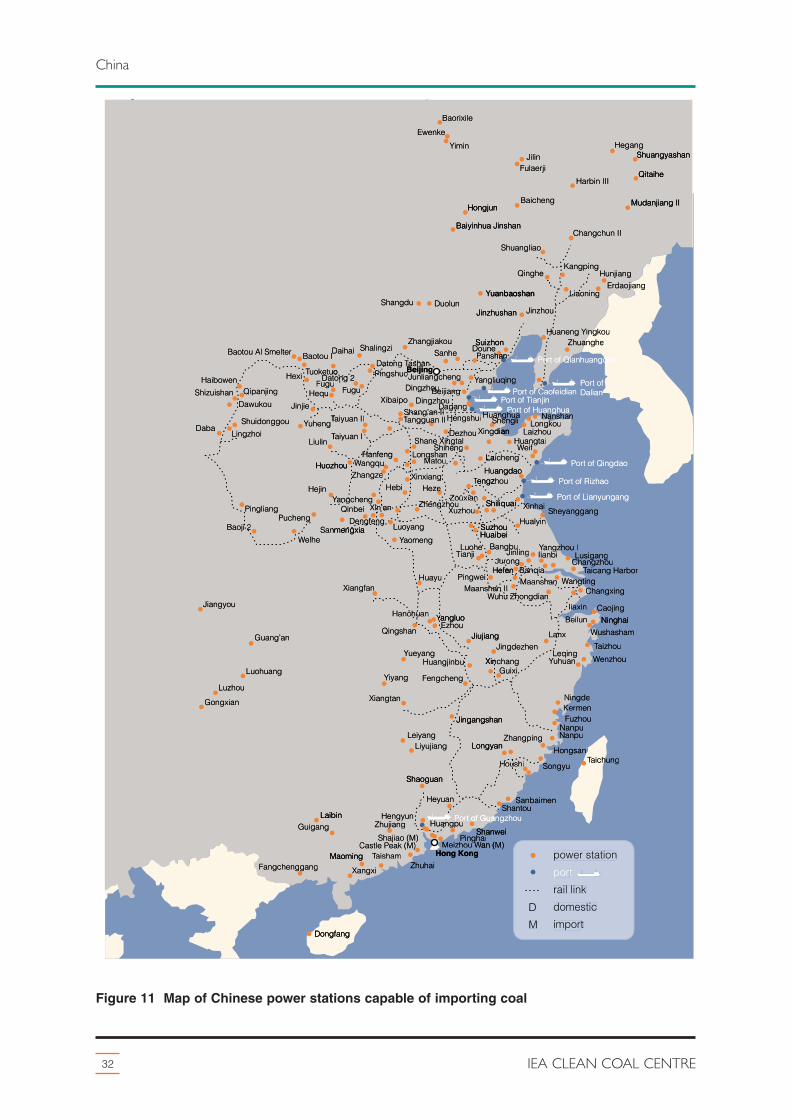
China’s coal resources are unevenly spread. Coal reserves are located inland in deep resources in thelandlocked provinces of Shanxi, Shaanxi and Inner Mongolia, while coal export terminals, powerstations, and industrial facilities are located in the coastal regions. The renowned Qinhuangdao exportterminal is east of Beijing, while the most economically important provinces are located in both theeastern and the southeastern coastal areas such as Guangdong, Jiangsu, and Shandong.
Coal imports are overseen by the major state-owned organisations that produce coal within China.Production and trade in China are regulated by the National Development and Reform Commission(NDRC) while the China Coal Group (formerly the China National Coal Import Export Commission –CNCIEC) determines export shipments and quotas from authorised producers. These companiesinclude the coal giants Shenhua Group, China Coal, and Shanxi Coal. These companies startedimporting coal when it became cheaper to buy coal from the international market than it was toproduce and transport coal from their mines to the demand centres in the Southern and Eastern coastof China. These three companies along with China Minmetals Corp are the only firms which havebeen granted licences by the government to export Chinese coal. Minmetals Corp was founded in1950 and is the country’s largest supplier of iron ore and coking coal for the steel industry, but tradingin thermal coal, (as well as copper, aluminium, steel and other metals) is part of the business. Twoother companies, Sinosteel and Baosteel, are also purchasers or iron ore, steel, coking coal and steamcoal.
Private enterprises that import coal include Qinfa Group which trades 10 Mt/y, most of which isimported from Australia, Indonesia and Vietnam. Guangdong Fuels Co Ltd is a commodity tradingcompany supplying large and medium size firms in the economically powerful Guangdong province,selling 3 Mt/y of steam coal to power plants and cement manufacturers every year, of which 2 Mtcomes from Indonesia and Australia. RGL Group is a private steel and iron ore trader which alsotrades steam coal. The company imports 3–5 Mt/t, and Sino-trust which ships 2 Mt/y.
27Impacts of seaborne trade on coal importing counries – Pacific market
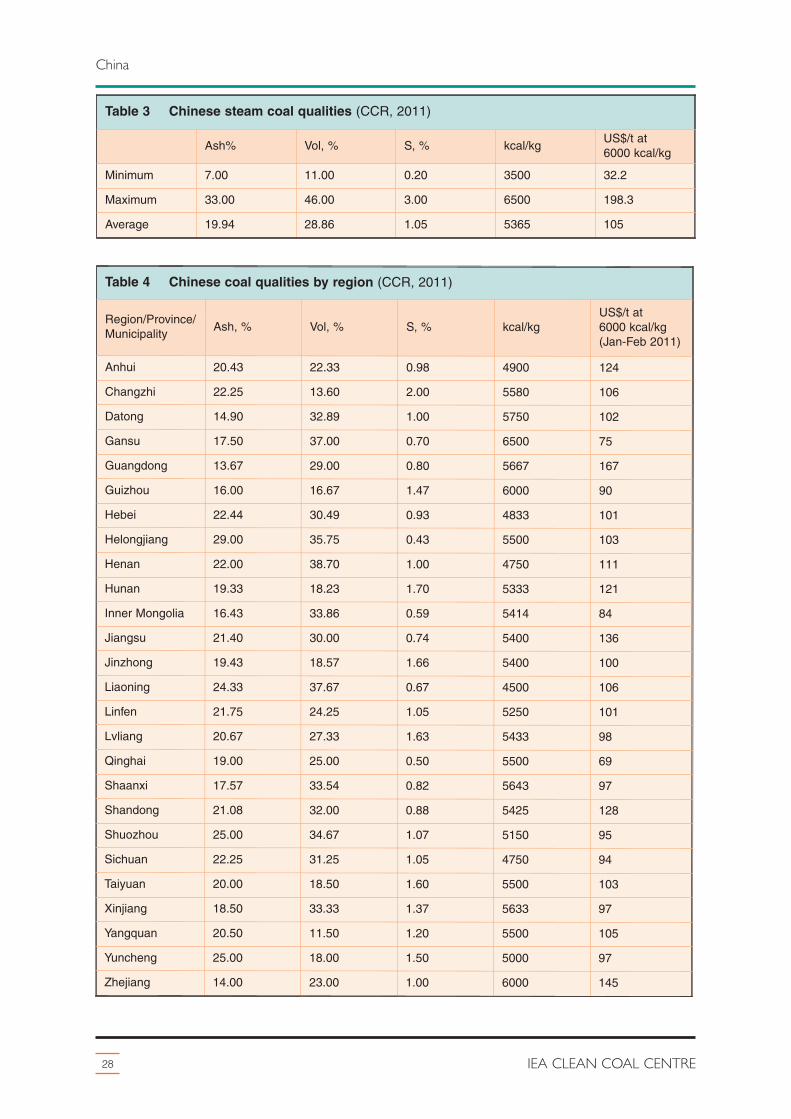
The bulk of Chinese coal is bituminous in rank, probably accounting for 85% of the reserves; a further5% is lignite, and 10% is anthracite. A quarter of the bituminous coal is suitable for coking purposes.A large proportion of Chinese coals are of low to medium ash content, and the overall sulphur contentis little more than 2% by mass, with the majority less than 1%. Chinese coal is therefore relativelygood quality that may be exported, or may be blended with imported coal with few problems.
The China Coal Resource publishes price and volume statistics for every region of China. As well asprice information, coal qualities are also provided. For the period Jan-Feb 2011, price data for 26provinces were published and the data showed the following coal quality ranges. Tables 3 and 4 showthe quality of hard coals, but given that the highest heating value is 6500 kcal/kg, these are likely torefer to hard steam coal products. The average heating value of Chinese coals across the entire rangeis 5365 kcal/kg, which is close to the 5500 kcal/kg coals that are sometimes quoted in the industrypress for price indices purposes. The sulphur content averages 1.05%, while ash contents are roughly20% and with a modest heating value of 5365 kcal/kg, the overall coal quality for China’s coal supplyis on par with lower quality internationally traded coal. Some high sulphur products are sold in anumber of regions, and so in these regions it is desirable that sulphur reduction technologies aredeployed at power stations.
The average ash content of around 20% is higher than the ideal international coal, which would bearound 10%. Australian and Russian coal imports range from 6300 to 6700 kcal/kg, and sosupplement the lower heating value Chinese coals. All imports are low in sulphur and ash so theblending of coals, especially Indonesian, can decrease the environmental impact of burning Chinesecoal alone.
4.4 Cost advantage of imports
Morse and He (2010) carried out research on the interaction between coal imports and domesticproduction depending on coal prices at certain delivery points around China’s key economic zones.China’s import behaviour is in some ways typical of many countries, but the transparency of theChinese market prices is such that it is easier to see arbitrage in more frequent time periods.
Morse and He (2010) describe how China’s role as the world’s largest arbitrageur has a significantimplication for the global market: it links international coal prices to China’s domestic price (at leastin the Pacific market). In other words, what happens in mines in Shanxi could affect the price of coalin North West Europe. Morse and He (2010) discuss the fact that China is a cost minimising market,and that it sees the purchase of coal fluctuate between imported and domestic coal as the price of eachchanges in relation to the other. This fluctuation is greater than is seen in countries such as India.There is some regulation in the shipment of exports outside China, which remains under the guidanceof the NDRC that determines the volume quotas for coal trade. The NDRC is also responsible forgearing up domestic production and oversees any closure programmes of wasteful or inefficient mineoperations.
Analysis was carried out comparing the cost of Chinese and internationally traded coal shipped to alocation in the southern most regions of China, in the province of Guangdong. Transporting Chinesecoal from the north to the south can constitute 50–60% of the delivered price to Guangzhou. This costis comprised of rail transport to the export ports of Qinhuangdao, Rizhao, or Lianyungang, plus thecost of shipping to the southern port of Guangzhou. The coastal city of Guangzhou was deemed asuitable location, not far from Hong Kong and considered a hub for Chinese steam coal imports.Guangdong province is heavily industrialised, but geographically far from the coal producingprovinces in the north of the country. In 2009, Guangdong was the largest importer of coal of all themajor coastal provinces (34 Mt/y out of a total 126 Mt/y), although other zones nearby exhibit similar
29Impacts of seaborne trade on coal importing counries – Pacific market
China
trade and price relationships (which Morse and He analysed). Much of the coal that is consumed inChina is negotiated on contract. For marginal spot purchasing, buyers might compare the CIF cost ofcoal landed in Guangzhou for both Chinese coal and internationally traded material, and the cheapestcoal will be preferred.
China suffers from two seasonal problems – the dry period in China’s summer, and the severe winterssuffered in the colder months. Therefore, seasonal coal price fluctuations occur with regularity, butoccasionally markets can be taken by surprise. Prolonged drought can lead to poor hydroelectricavailability, and therefore put pressure on coal-fired power output, deplete coal stockpiles, andincrease demand. Other economic influences such as the exchange rate relaxation of the Yuan in June2010, making the cost of exports less attractive but imports more attractive, might have had someimpact on the increase of imported coal. The FOB price at Qinhuangdao versus the FOB price atNewcastle (Australia), Kalimantan (Indonesia), and Vostochny (Russia) in recent years has favouredcoal imported into China.
The relative effect of the global recession hit China less hard than other coal importing regions of theworld, and so energy demand within China remained stronger creating a demand pull effect ondomestic prices, while elsewhere energy demand was much softer and so prices dipped more severely,albeit to recover later. While demand for international coal reduced globally, and domestic Chinesecoal was in shorter supply due to infrastructure constraints, imports became more freely available atlower cost.
Evidence of this is provided in Morse and He (2009), where the price advantage of imported coal atGuangzhou improved in the period Feb 2009 to Feb 2010. In this period, imports were 10–40 $/tcheaper than Chinese coal delivered to this same port. Volumes of coal being shipped to China fromAustralia, Russia and Indonesia in the same period increased by 8–12 Mt/y per month. While the FOBcost of coal was higher for Chinese coal (at Qinghuangdao), freight rates to ship coal from thenorthern Chinese ports to the southern Chinese ports of Shanghai and Guangzhou also played a part inthis arbitrage.
At the same time, the international shipping industry went into a major oversupply situation for drybulk, and freight rates for internationally traded coal to the Port of Shanghai fell sharply in 2008, byas much as 80%. China’s domestic maritime rates fell by 50% of the 2007-08 levels. Both drops arestaggering, but the difference might go some way to explain the deeper cuts faced by foreignsuppliers. China’s maritime freight is measured by the Shanghai Shipping Index comprising relativelysmall vessels of around 40–50,000 dwt, while foreign coal may arrive in international capesize vesselsof 100,000 dwt or more which have a lower per tonne rate (albeit at higher daily charter rate).International freight rates therefore seemed more attractive, further softening international pricescompared with China’s suppliers. By 2011, freight rates barely recovered, and export FOB pricesglobally returned to the 2007-08 levels, thus making imported coal more expensive, and possiblycreating a switch back to Chinese coal.
Since the market is dominated by coal, there is almost no alternative (for example natural gas) forutilities to switch to in times of excessive coal prices. Utilities’ costs of operation are therefore boundby the costs of the price of coal. Inflation in electricity tariffs is heavily regulated, while coal pricesare more fluid. This therefore affects the profitability of coal-fired generation in China, if coal priceinflation is high. Since the cost of coal is more market-based, it is heavily affected by winter weather,infrastructure disruptions, and occasionally hydroelectric performance.
Utilities are more free to switch to imported coals than previously, and so small aberrations in themarket can lead to a flurry of speculation and interest in import levels and prices. However, this is notalways the case. China’s import tax was phased out in 2007, and had little discernible impact on theimport surge that occurred in 2009 (see Figure 10). Other additional charges include VAT which ischarged on all coals (on a CIF basis) and transaction costs for Chinese coals that are around 3 $/t.
30 IEA CLEAN COAL CENTRE
China
31Impacts of seaborne trade on coal importing counries – Pacific market
China
These additional charges are not negligible, but nonetheless have less of an impact than overall marketdrivers. As long as the zones for economic development remain in the regions located close to thesouth and south eastern coast of China, the arbitrage between domestic and international coal will stillbe an important dynamic in China. Even the massive coalfields of Mongolia are located too far inlandto make a major impact as yet, but the situation may change in the future.
4.5 Coal importing power stations
In 2010, China imported an estimated 166 Mt of hard coal, of which 92 Mt was steam coal (MCIS,2011). Coking coal imports were 47 Mt in 2010, and anthracite was 27 Mt. In terms of steam coal,Indonesia was the chief supplier at around 28 Mt, Australia accounted for 17 Mt, South Africa 7 Mt,and Russia 6 Mt. Vietnam was the chief anthracite supplier, while Mongolia and Australia were thetop coking coal suppliers. While most of these countries will maintain an export industry, Vietnam isone case where the country is shifting its market to serve domestic industry and power generation andcould feasibly withdraw from the export market.
Establishing a map of coal-fired power stations in China is problematic given the rapid build rate ofplants, and the extensive closure programme for smaller plants. The map therefore only captures themain stations that are likely to burn imported coal, or have access to ports by rail or river. Figure 11shows a multitude of coal-fired stations that are located across the entire coastline of China from thesouthernmost province of Guangxi to the northernmost province of Liaoning. There are nineprovinces that have coastlines, and several others which are within 500 km rail distance of the ports.While coal logistics and price are often quoted as the reason for arbitrage between domestic andimported coal, what is mentioned less often is the regulation on sulphur emissions which restrictsemissions from many newer power stations to 400 mg/m3 and particulates to 50 mg/m3. Tighteremission regulations will have reinforced the effect of supply availability and price arbitrage in Chinain recent years and helped the drive to increase imported coal.
Prior to 2004, China had undemanding coal-fired power plant emissions compared with OECDcountries (Minchener, 2004), but MEP and the State Bureau of Technical Supervision, Inspection andQuarantine jointly formulated new standards. In 2003, The Emissions Standards of Air Pollutants forThermal Power Plants (GB 13223-2003) was issued, becoming effective from 1 January 2004 (Wangand Zeng, 2008). These standards apply as national emission standards, but in large metropolitan areassuch as Beijing, Shanghai, Guanghzou, Hangzhou and Guilin, local EPA can issue stricter emissionsstandards. However, in 2011 the Chinese authorities adopted a new set of emission standards(Emission standards of air pollution for thermal power plants GB 13223-2011) which could makeChinese power stations subject to standards that would exceed those in the EU and USA, but perhapsnot as stringent as some local standards in Japan.
The standards were introduced in January 2012, and provide existing plants with a 2.5-year period ofgrace before they need to comply with the new standards, while new plants will be affectedimmediately. Even tighter rules will apply to gas-fired plants in accordance to the cleaner nature of thefuel. A full text of the standards is available at:http://www.zhb.gov.cn/gkml/hbb/qt/201109/t20110921_217526.htm
Table 5 shows the emission standards that could apply to coal-fired stations, based on stack or flues.
The implication for coal imports is that power plants built after 1 January 2012 that are not fitted withFGD to achieve emissions of less than 200 mg/m3 cannot burn coal containing more than 0.3–0.4%sulphur, a level which can be achieved with few internationally traded coals. All coal-fired stationswill therefore have to be fitted with FGD, and for existing plants retrofits will need to be installed by2015. Compliance could be rewarded, as plants fitted with FGD can charge an additional0.015 RMB/kWh. An emissions tax has also been levied at a rate of 0.65 RMB/kg on SO2 and NOx.
32 IEA CLEAN COAL CENTRE
China
Hong Kong
Beijing
DM
power station
domesticimport
portrail link
Port of Dalian
Port of Qianhuangdao
Port of TianjinPort of Caofeidian
Port of Qingdao
Port of Rizhao
Port of Lianyungang
Port of Huanghua
Port of Guangzhou
BaorixileEwenke
YiminJilin
Fulaerji
HegangShuangyashan
Qitaihe
Mudanjiang II
Harbin III
BaichengHongjun
Baiyinhua JinshanChangchun II
Shuangliao
QingheKangping
HunjiangErdaojiang
LiaoningYuanbaoshanShangdu Duolun
Jinzhushan Jinzhou
Huaneng YingkouZhuangheSuizhon
DouneZhangjiakou
Shalingzi
Datong TashanPingshuo
DaihaiBaotou Al Smelter Baotou I
Tuoketuo
Hequ
HexiFugu
Datong 2Fugu
PanshanSanhe
YangliuqingBeijiang
Junliangcheng
DagangNanshan
LongkouLaizhou
Huanghua
HaibowenQipanjing
DawukouShizuishan
Daba LingzhoiShuidonggou
Jinjie
Liulin
YuhengTaiyuan I
Taiyuan II
DingzhouDingzhouXibaipo
Shang’an IITangguan II Hengshui
Dezhou
Hejin
Huozhou
Shane XingtalLongshanHanfeng
MatouWangquXinxiang
Shiheng
ZhangzeHezeHebi
Yangcheng ZhengzhouXin’anQinbeiDengfeng
Sanmengxia LuoyangYaomeng
ShengliXingdian
HuangtaiWeif
LaichengHuangdao
Tengzhou
Zouxian Shiliquai Xinhai SheyanggangHualyin
Xuzhou
SuzhouHuaibei
XiangfanHuayu
Luohe BangbuTianji Jinling
Jurong
PingweiHefen
Maanshan IIWuhu Zhongdian
Yangzhou ILusigangIianbi
ChangzhouTaicang Harbor
WangtingMaanshanBanqia
Changxing
CaojingNinghaiBeilun
Iiaxin
WushashamLanxTaizhouWenzhouYuhuan
Leqing
Hanchuan YangluoEzhou
JiujiangJingdezhen
XinchangGuixi
Huangjinbu
FengchengYiyang
Qingshan
Yueyang
Xiangtan
Jingangshan
LeiyangLiyujiang Longyan
NingdeKermenFuzhou
Nanpu
Taichung
NanpuZhangpingHongsan
SongyuHoushi
SanbaimenShantou
Shaoguan
Heyuan
ShanweiPinghai
Huangpu
Meizhou Wan (M)
HengyunZhujiangShajiao (M)
Castle Peak (M)
ZhuhaiTaishamMaoming
Xangxi
LaibinGuigang
Fangchenggang
Dongfang
Jiangyou
Guang’an
Luohuang
Luzhou
Gongxian
Pingliang
Baoji 2Welhe
Pucheng
Baorixile
Y
Baiyinhua Jinshan
Hongjun
iminYEwenke
uanbaoshanjiang
Li idaojiEr
HunjiangKangping
Qinghe
Shuangliao
Changchun IIBaiyinhua Jinshan
HongjunBaicheng
Harbin III
Mudanjiang II
Qitaihe
ShuangyashanHegang
FulaerjiJilin
Mudanjiang II
Qitaihe
Shuangyashan
T
Q
TuhengY
Liulin
Jinjie
ShuidonggouLingzhoiDaba
ShizuishanDawukou
QipanjingHaibowen Da
FuguHexi
Hequ
uoketuoT
Baotou IBaotou Al Smelter
H
BoPi
en
H
ng
TXingdian
ua S
SHua
Shiheng nShane Xingtal
LongshanHanfeng h g
Shih
He
Dezhou
Hengshuig
angguan IITTangguan IIShang an IShang’an IIDagang
Xibaipo DingzhouD II
DingzhouBeijiang
aiyuan IITTaiyuan II
aiyuan ITTaiyuan I
S
li
D
ng
Junliangcheng
BeijiangD ouangliY
Sanhe Panshan
Fuguatong 2
ou
uo
Daihai
PingshuoB hanashanato Datong T TashanBeijing
ShalingziZhangjiakou
DouneSuizhon
JinzhushanDuolunShangdu
uanbaoshanY
t a
f
n o
L a
daoan
Porh
t of CaofeidianPor
t of Qi
t of TianjinPor
Qianhuangd
Dalian
Por
anghe
eif
H
t of Por
an
ha
HuangtaiW ifW
diaSheengliananghuanghuaengliangShe
gN h
Por
LaizhoukLongkou
Na shanNanshant of Huanghua
uuqing
hanSuizhon Zhua
ngkouinHuaneng Y
JinzhouJinzhushan
uanbaoshan Liaoning
Pucheng 2
elheWBaoji 2
Pingliang
Jiangyou
Sanmengxia
Huozhou
Hejin
angluou
e
ha a
Ych
an
L
ng’a
Zoue
e
H
YHanchuan
W
n
Maansha
HefenPingwei
TianjiBLuohe
Huayu
ian
Xiangfan
HuaibeiSuzhou
XuzhouZhengzhou ShiliquaiZouxian
engzTTengzhouHuangdaoLa
aomengYLuoyangnmengxia
Dengfengg gQinbei XiXin’an X
Zh ngangchengY
W
Hebi HezeZhangze Xinxiang
angquW MatouLongshanHanfeng g
M tHuozhou
t of Lianyungang
Iia
ganq
u Z
B
Por
t of RizhaoPor
t of QingdaoPor
axin
ilB
C
NinghaiCaojing
Changxing
BanqiangtingMaanshanha
enangt
Zh
Waicang HarborTTTaicang Harbor
ChChangzhouIianbi Lusigangg g
Ch h
angz zhou IY
Sheyanggang
uhu Zhongdianan IIan
HefenongJuJurJinling
angbugbuJi l
HuaibeiSuzhou
Hualyin
XinhXinhaiShiliquai
engzhouangdao
Laicheng
Gongxian
Luzhou
Luohuang
Guang’an
Shaoguan
n
Y
LongyanLiyujiangLeiyang
Jingangshan
Xiangtan
ueyangY
Qingshan
iyangY Fengcheng
Huangjinbu Xin
JiujiangEzhouangluoY
SongyuHoushiH u
an
aich
ZhangpingHongsan
Nanpu
hung
K
Nanpu
TTaichung
FuzhoumenKer
ingdeNin
enzhou
Longyan
Jingangshan
GuixiXinchang
JingdezhenJiujiang
LeqinguhuanY
Lanx
WaizhouTTaizhouushashamWW
BBeilun Ninghai
Fangchenggang
Dongfang
g
GuigangLaibin
Maoming Hong Kong
t of Guaan a
Dongfang
Po
Zhuhai
Laibinj
)
XangxiMaoming aishamTTaisham
Castle Peak (M) an (Shajiao (M)
ZhujiangHengyun
Huangpu
PinghaiMeizhou W
gh W
Por
Heyuan
Shanwei
Shaoguan
rail link
t of Guangzhou
tpor
timpordomestic
power station
MD
an (M)Shanwei
ShantouSanbaimen
Figure 11 Map of Chinese power stations capable of importing coal
By the end of 2008, there were at least 29 FGD suppliers manufacturing mainly limestone scrubberspossibly accounting for 75% of global FGD installations every year and fitted at a price 50% belowthat of the international price (PEI, 2009). In 2009, some 365 GWe of Chinese power stations hadFGD fitted; by 2020, China could have 723 GWe.
Table 6 shows a list of power stations within the key importing region of Guangdong where the port ofGuangzhou is located. In this province there are at least 27 power stations operating or underconstruction with a total generating capacity of 54.5 GWe. If developments continue, GuangdongProvince will have more coal-fired capacity than Japan or Germany within a few years. Around thePort of Guangzhou, there is a cluster of nine power stations around the mouth of the Pearl River whichopens up to Hong Kong where three of the power stations are located.
Petrocom is a Hong Kong based company that is building a coal blending facility in the Port ofLianyungang on the eastern coast of China. Coal blending can vary in sophistication, from usingbulldozers to mix coarse grades of coal, to using stockpiling methods such as stacking different layersof different quality coals on top of another, and then accessing the coal vertically. Petrocom arebuilding a series of silos each of which will contain a different quality of coal. Large conveyor beltsand weighing scales are mounted beneath the silos, and coal from each silo is weighed within the siloand sprayed onto the conveyor belt before onward transport by rail or conveyor to the power station.The silos can process 10 Mt/y. According to Petrocom, the cost of blending coal in such a precisesystem is around 5 $/t, which at current import costs is perhaps 5% of the cost of coal.
4.6 Coal import logistics
Given China’s GDP of $6–7 trillion and a current account balance of $300 billion, most of thecountry’s ports are geared towards exporting goods. Historically, these ports exported coal to theinternational seaborne market, but for now China is a massive net importer. The export ports in thenorth of China now serve as a transfer point before coal is shipped southwards to the Chinese coalimporting ports. Instead, the coal is railed along rail lines such as the Da-Qin and Shuo-Huang raillinks to the coastal ports of Qinhuangdao, Jingtan and Caofeidian, Tianjin, and Huanghua. Central
33Impacts of seaborne trade on coal importing counries – Pacific market
China
Table 5 Thermal power boiler air pollutants emission concentration limits, mg/m3 (Sloss,2011)
Type of energy conversion facility and fuel Pollutant Condidtions Limits
Coal-fired boilers
Soot (pariculates) All 30
SO2
New boiler100200*
Existing boiler200400*
NO2 All100200†
Hg and Hgcompounds
All 0.03
* To be located in Guangxi Zhuang Autonomous Region, Chongqing Municipality, Sichuan Province and GuizhouProvince, where the limits will be implemented with coal-fired boilers.
† Implementing limits on W-type thermal power generation boilers or furnace chamber flame boilers, circulating fluidizedbed (CFB) boilers, and boilers put into operation as of 31 December 2003 or through the construction project’senvironmental impact report’s approval of coal-fired power boilers
coalfields and southern Shanxi coalfields railcoal along lines which are exported throughQingdao, Rizhao and Lianyungang. Accordingto the NDRC, in 2006 the rail capacity in coalproducing provinces was 690 Mt, but thecapacity was oversubscribed by 14%,suggesting that coal producing provinces needaccess to at least 790 Mt of rail capacity toadequately meet domestic demand (Shenhua,2007). This percentage is expected to improveto around 11% despite a forecast rise indemand due to the planned investment in railcapacity.
Apart from dedicated rail links, rail distancesfor coal transport in China average 550 km,similar to distances between South Africancoal mines (Witbank) and the Richard’s BayCoal Terminal. In China, the rail to portdistance can range from 50 km to 1400 km forsome provinces. For example, the distancefrom Shanxi to Qinhuangdao port is between500 km and 800 km depending on location ofthe coalfield.
Based on author’s estimates, around 100 coalpower stations are located on the coast, orclose to the river outlets which exit into theSouth and East China Seas. The greatestconcentration of power stations occurs alongthe massive Yangtze River between Jiujiangand the Eastern China Sea where there are atleast 20 coal-fired stations. These coal plantsare however much closer to the Chinesecoalfields by rail.
The cost of transporting coal by rail rangesfrom 6.0 to 9.9 US$/t. The system forregulating freight prices is set by the StatePlanning Commission based on a rate pertonne-km in nine basic categories of freight.Rail fees are further determined by negotiationbetween the Ministry of Railways, the largercoal mines and provincial governments. Feestend to be highest on more technicallyadvanced lines, such as those with the latest
infrastructure developments which are electrified and double tracked. Fees on short haul journeys areas low as 0.07 yuan/t km (0.8 US cents/t km) or can be as high as 8 US cents for longer journeys (Balland others, 2003). Ball and others (2003) also published average figures for rail fees on four majorwest-east coal trunklines at 1.85 US cents/t km. For a 500 km rail journey, the cost of transit would bearound 9–10 US$/t. While this is costly, it is still half the costs of transporting some Russian coalsfrom their mines to Baltic export ports.
Transport links are vital to maintaining coal supplies to power plants: these links account for 60–70%
34 IEA CLEAN COAL CENTRE
China
Table 6 Coal importing power stations inGuangdong (CoalPower, 2011;Author's estimates)
Plant nameOperational or underconstruction, MWe
Haimen 4000
Sanbaimen 3200
Shantou 1200
Huilai 3200
Dapu 1200
Shanwei 2520
Heyuan 1200
Pinghai 2000
Huizhou 660
Mawan 1800
Shajiao 3880
Yunfu 1120
Zhujiang 1200
Huangpu 2670
Guangzhou Huaran 660
Hengyun 1120
Zhuhai 4600
Taishan 5000
Yangxi 2400
Qiaoyuan 1200
Shaoguan 3200
Yuelian 520
Maoming 1100
Zhanjiang 2400
Hengmen 250
Nanhai I 1000
Hangyi 1200
of rail freight operations (Melanie and Austin, 2006). The pressure on rail infrastructure continues tomount, but spare capacity has been achieved with little expense. Such increases have been achievedthrough improving the existing services for both passengers and freight. For example, since 1997,China has raised its train speeds, boosting passenger train speeds to 120 km/h on 22,100 km of tracks,160 km/h on 14,000 km of tracks, and 200 km/h on 5370 km of track. The increased passengerefficiency also frees up capacity for freight movements on certain routes. The speed of freight trainson the above-mentioned tracks has been raised to 120 km/h. Previously, China’s trains used to travel atjust 60 km/h. Despite the vast improvements to the rail system, transport bottlenecks still exist.
Infrastructure is a major issues that determines the flow of coal within China, and the supply chainlinking China’s coalfields to the demand centres in the south via the export ports and coastal shippingmeans competition between imported coal and domestic coal may well be intense. There willprobably be no clear winner as the rise in demand will increase business for both domestic andseaborne markets for some years as the country locks into coal-fired power as a preferred form ofelectricity generation.
35Impacts of seaborne trade on coal importing counries – Pacific market
China
5 India
36 IEA CLEAN COAL CENTRE
India enjoyed a GDP growth almost equal to that of China, estimated at just under 9%/y for 2011 and2012, during a period when OECD economies were experiencing extremely cautious growth,especially in Europe. Yet, much of India’s population remains impoverished in energy terms andconsumer inflation in 2010 was almost 14%. Per capita electricity consumption ranged from 600 to700 kWh/head (2008), while the rest of the world consumed 3240 kWh/head, and OECD nationsconsumed between 6200 and 10,500 kWh/head. It is unlikely India and China will reach such highconsumption levels (per head) for the foreseeable future, given the vast population such levels wouldprobably be unsustainable. Yet even modest increases will lead to vast increases in the total demandfor electricity, which in India is chiefly coal-fired power.
In terms of demand, China exerts a considerable force in world coal markets and India is reinforcingChina’s ‘pull’ on the seaborne hard coal markets. India is altering trade flows in the seaborne marketand driving demand in a way that may not have been considered seriously 15 or 20 years ago,although analysts may have alluded to it briefly. For instance, Europe’s diminishing market wouldhave caused concern for South African exporters, which previously relied on the Atlantic market forits main customers. India now buys South African coal, and could draw more coal from the fledglingindustries growing in the rest of Southern Africa, such as Mozambique, Botswana, and Zimbabwe.Richard’s Bay Coal Terminal is perfectly situated to deliver coal to India being within 3800 miles ofthe western coast (avoiding the waters affected by Somali piracy activity). The east coast of India iseven closer to Indonesia, being 2000 miles from South Sumatra and 2600 miles from SouthKalimantan (www.netpas.com). These trade relationships with major exporters are important as Indiafaces pressing challenges, which include a number of issues, from environmental performance of itsgenerating fleet to the internal shortage of coal at the nation’s power stations. Coal production keepsgrowing, but not at a pace that can yet keep up with demand.
India is currently the second largest non-OECD hard coal producer, and third largest producer of coalin the world. In 2009, production reached 490 Mt according to IEA data, an almost threefold increaseon 1990. Given that production is always chasing a burgeoning demand, this threefold increase inoutput almost certainly indicates a threefold increase in demand, since India does not export coal.
Imports have also grown; India was described by the Australian Bureau of Agriculture and ResourceEconomics (ABARE) as the fastest growing importer of thermal coal (O’Connell, 2010). WhileIndia’s coal supply remains dominated by domestic production, energy security is a key component ofthe nation’s energy policy. Crude oil and natural gas are almost entirely obtained from theinternational market, and therefore subject to the volatility of world prices. Only coal, hydroelectricity,waste and biomass, and renewable energy are available in India as indigenous sources of primaryenergy at present. Whether India finds new oil and gas reserves is not certain, but the possibilityexists. In the absence of indigenous reserves of oil and gas, India is securing such fossil fuel suppliesby buying foreign assets that produce these necessary fuels.
5.1 Coal-fired power
Coal-fired power generation is discussed at length in a number of reports published by IEA CCC suchas Coal use in the new economies of China, India and South Africa (Mills, 2010) and Prospects forcoal and clean coal technologies in India (Mills, 2007). This Section is a brief overview of the state ofcoal-fired power in general in the country; the significance of imported coal is discussed later.
Coal is currently supplied to state-owned generators and seven of the largest IPPs that include TataPower, Reliance Energy, and the Calcutta Electric Supply Corporation (Jha, 2005). Other important
companies active in importing coal includeSwiss Singapore, Bhatia, Adani, andAgarawal. For this reason, coal infrastructureis essential for the operation of the country’spower generation.
In 2006, India had 146 GWe of installedelectricity generating capacity, with 56%being coal-fired (Mills, 2006). Five years onand little has changed in terms of marketshare, except for an increase in the totalgenerating fleet. By April 2011, India had 174GWe of generating capacity, of which 54%was coal fired (see Figure 12). High coaldemand in India is partly explained by the lowefficiencies being achieved in subcritical(typically pulverised) coal-fired plantsoperating at high load factors. A massiveinvestment in better plant maintenance, stationupgrades, and ultimately a shift to supercritical(SC) and ultra-supercritical (USC) powerstations could yield massive fuel savings aswell as enhanced power station performance.In India, overall efficiency is improving slowly
compared with China, owing to the faster pace of new coal-fired capacity additions, coupled with theclosure programme that has led to some 70 GWe of old inefficient plants being shut in China.
With poor coal quality and high ambient temperatures, the average efficiency for the coal-fired fleet inIndia was 27.6% (LHV basis) in 2006, compared to the OECD average of 36.7% (Ricketts, 2006).More recent efficiency estimates for the Indian fleet are closer to ~30% (Smouse, 2009). The ongoingprogramme to develop supercritical and ultra-supercritical stations could raise this, provided thesestations are maintained to optimum performance levels.
It is no surprise that India’s demand for electricity outpaces the capacity to supply both the electricityand the coal to fuel the power stations. This dilemma is partly due to fast economic and populationgrowth, but the pressure is not helped by the massive loss experienced by the transmission anddistribution network. Much of the loss is due to poor infrastructure, and so would naturally representperhaps 5–10% of the generated electricity. However, the bulk of the loss arises from the large amount ofunmetered consumption and/or theft. System losses for the Indian electricity market in 2009 amountedto 24% of the electricity supply – this is one of the highest levels of loss (in percentage terms) seenanywhere in the world. The OECD average is closer to 6%, while the rest of Asia averages 5–10%.
Where electricity is metered and billed, tariffs to households are a third of those in OECD countries,and this is in part due to the low cost of coal. The inability to recover costs through a more robusttariff system means that new capital investment is slow to develop, and there is greater incentive tooperate existing coal-fired power plants beyond their design lifetimes. For many years, the country hasmaintained a rolling renovation and modernisation (R&M) programme, focused mainly on200–210 MWe units that are 20 years old or more (Mills, 2007). Many coal-fired units have operatedwithout modernisation for far longer periods than their counterparts in OECD countries.
Historically, India has fairly lax standards with regard to airborne pollution from coal-fired stations.Emission standards on particulates are not stringent, and there are no emission limits for SO2 or NOx(Mills, 2010). Until some indication that these basic pollutants are under much stricter control, there islittle or no impetus to embark on a CO2 reduction programme of the power station fleet.
37Impacts of seaborne trade on coal importing counries – Pacific market
India
coal 54%
natural gas 10%
oil products 1%
nuclear 3%
hydro 21%
renewables 11%
Figure 12 Total power generating capacity
5.2 Coal supply
Coal exists in at least 14 of the 28 states in India and coal resources total 277 Gt, although only106 Gt are proven and recoverable. Based on production today, the R/P ratio exceeds 200 years, closeto that of the USA and perhaps five times that of China (CIL, 2011).
India is a strong-coal based economy and, being self-sufficient in coal, the only security of supplyissue it faces is transporting coal from the coalfields in the central regions of the country to powerstations across the whole country. Energy security nevertheless remains high on the political agendaand in 2005 the Indian President set 2030 as a target year to achieve energy independence fromimports. The President highlighted the need to minimise fossil fuel imports, which are demonstratedby the large oil and oil products import figures. While the country is expected to wean itself off oil,India is expected to maximise hydro and nuclear potential, and to increase power generation fromrenewable energy technologies to 25% (currently ~5%).
Energy security is currently being achieved most effectively with coal. Coal mining in India isrelatively low cost by world standards, but the coal is generally low in quality. Imported coal providesadded quality and security of supply advantages to indigenous supplies. Also, domestic coal supplyproblems, whether mine or transport infrastructure related, tend to cause more disruption and concernfor Indian power utilities than imported supplies, although minemouth power stations will still have asecure, if not captive, indigenous supply. Even for non-minemouth stations, domestic coal has longbeen the keystone in the development of coal-fired power in India.
During the 12th Five-year plan, the state utility National Thermal Power Company planned to build15 GWe of extra capacity by 2018. This would be mainly supplied by domestic coal, much of whichwould come from new mines. However, on environmental grounds, the government cancelled fivecoal blocks that were allocated to power utilities for development into dedicated coal mines to theirpower stations (Steelguru, 2011). Until the dichotomy created by the desperate need for moredomestic coal supplies and the need to satisfy environmental standards and practice is overcome, thegovernment should recognise the importance of coal imports for some years to come.
Despite these problems, Indian coal production has increased fivefold since 1980 (see Figure 13). Allof the growth was from hard steam coal, while lignite and coking coal production have remained asmall proportion of total supply and barely increased in decades. India imports almost all of its cokingcoal, making Indian steel mills major players in the metallurgical market.
Domestic coal production therefore consists of mainly steam-type products. Coal India Ltd (CIL) isthe largest producer of coal in India, with production at over 431 Mt in the 2010 financial year (Jha,2011). CIL is also the largest coal producer in the world. CIL is 90% owned by the Government ofIndia, and 10% by other institutions. However in 2010, CIL cut production targets three times. In thefinancial year 2010, coal-fired power also reduced target output by 4%. Coal stocks were also just afew days, compared with a normal stockpile of 21 days and many stations were at a ‘critical’ statuswith seven days of stock remaining. To fill the coal supply gap, steam coal imports have thereforebeen necessary, and expected to exceed 100 Mt by 2012, of which 60–80 Mt might be steam coal.
CIL have identified 142 new coal mining projects with an ultimate capacity of 380 Mt/y (Jha, 2011).Some 107 of these projects are opencast and 35 are underground. The total capital expenditure couldbe as much as US$7.7 billion. A further 20 washeries with a capacity of 111.1 Mt/y costingUS$510 million are planned. Expansion of CIL’s operations under the provisional 12th Five-year plancould see production rising by 87–186 Mt by 2016-17.
The Singareni Collieries Company Ltd (SCCL) is the second largest coal producer which is a jointventure between the Government of Andhra Pradesh and the Government of India with each owningroughly half of the company. The official government target production for 2009-10 shows that CIL
38 IEA CLEAN COAL CENTRE
India
would account for 82% of Indian production. SCCL would produce 8% and the remaining 10% wouldbe produced by a variety of producers (see Table 7), many of which would be captive producersmining coal for their own use or short haul transport.
Under the Coal Mines (Nationalisation) Act 1973, coal mining was reserved for the public sector. AnAmendment to the act in 1976 enabled two exceptions to the policy permitting captive miningassociated with iron and steel production, or private companies operating in local markets, providedthey did not transport coal using the rail network. Captive consumption includes a number of methodsof coal exploitation where the Government can permit coal production for captive power generation,iron and steel facilities, cement production, syngas production, coal gasification, and coalliquefaction. The allocation of coal blocks is done through inter-governmental and departmentalbodies called the Screening Committee. The Committee is represented by the Ministries of Steel,Power, Industry and Commerce, Environment and Forests, Railways, and CIL, amongst other smallerparties. As such, the exploitation of all coal reserves remains largely within the confines of Indianbased organisations.
39Impacts of seaborne trade on coal importing counries – Pacific market
Table 7 Structure of Indian coal production 2007-10, Mt (MoC, 2010)
CompanyTargetproduction,2009-10
Actualproduction toJanuary 2010
Achievement, %
Actualproduction,January 2007-March 2008
Growth, %
CIL 437.4 338.42 77.37 316.44 6.95
SCCL 45.00 41.03 91.17 36.75 11.65
Others 52.83 37.02 70.07 31.83 16.31
Total 535.23 416.47 78.16 385.02 8.17
5.3 Coal import trends
While imports are a growing feature of hard steam coal supplies, it remains a small proportion ofoverall supplies (see Figure 14). Imported coal serves two criteria; one is a blend coal for lowering theash content of coals to coal-fired power stations, which is discussed later. The second criterion is thatimported supplies bridge the gap created by local supply problems. The plant load factor of thermalpower stations in Madhya Pradesh fell from 63% in 2010 to 61.1% in 2011, due to a lack of coalsupplies. In response, the Madhya Pradesh government urged the Madhya Pradesh Power GeneratingCompany Limited (MPPGCL) to import 0.8 Mt of coal in 2011 (SP, 2011).
Imported hard coal in the 1980s and 1990s consisted mainly of coking coal (approximately 10 Mt/y inthe latter decade) By 2000, steam coal imports accelerated to 9.9 Mt/y, almost matching coking coaltrade. By 2005, India was importing 21.7 Mt/y of steam coal, overtaking coking coal for the first time.Steam coal trade has since grown year-on-year.
By 2009, Bloomberg reported that thermal coal imports rose to 60 Mt, although a figure of 75 Mt/y isprobably more realistic. Table 8 shows the target coal imports for 2009-10. The largest importerappears to be the National Thermal Power Company, which could double its coal-fired capacity to75 GWe by 2017, making it potentially one of the largest importers in the country. There are plans toimport 14.5 Mt of steam coal in 2011-12.
According to MCIS (2012), steam coal imports reached 92.5 Mt/y (plus 32.9 Mt of coking coal) in2011. With the new coal-fired capacity coming online, steam coal imports were envisaged to rise to200 Mt in 2012 (Sharples, 2010). This equates roughly to 50–60 GWe of new coal-fired capacity,which is not unrealistic, but delays in commissioning this capacity are possible. Hence, with 200 Mt/yof thermal coal becoming the norm in coming years, the timing of such import levels is uncertain, asof 2012.
Given the problems that are experienced withshort-term stocks at Indian power stations,limited port capacity and rail availabilityissues, large step increases in imports could bedelayed, but not indefinitely. Yet, domesticsupplies struggle to keep pace with demand,partly due to rail services that are unable tomove the coal from mine stockpiles to thepower stations. More long- to medium-termissues include the poor productivity ofdomestic mines and the difficulty of gainingpermission to expand operations onenvironmental grounds, often determined bythe Ministry of Environment and Forests. Ifthe obstacles to growth are overcome, coalimports to India could double in the comingyears to 250–300 Mt/y.
Indonesian coal currently dominates the Indianimport market as a result of its geographicaladvantage and its rapid production growth inrecent years. South Africa has shifted businessaway from the European region to Asia, notleast India, thus preserving its importantexport potential of almost 100 Mt/y.
In the future, several new market entrantscould change the situation. Within a few years,Bangladesh in particular could have between 5Mt/y and 15 Mt/y of coal available for export.This is likely to be more expensive thanIndonesian coal, but cheaper than India’s othercurrent suppliers.
5.4 Quality advantages of coal imports
While Indian coals are generally considered poor quality, they are often low in both sulphur and traceelements. Ash contents are high (25–55%), but the ash forming mineral matter is bound within thecoal matrix making ash removal using standard coal cleaning processes difficult (Venkataraman,2006). Indian coals are high in silica and highly abrasive. Such coal properties can increase wear oncoal and ash handling equipment, coal milling equipment, and flue gas particulate control. The effecton milling equipment could mean achieving the correct particle size is more difficult in the pulveriser,thus reducing the efficiency of particle burn-out. Typical coal qualities of Indian coal are as follows:� Ash content is 25–55%, although most probably averages 41% (often 11% higher than most
boiler designs). Other impurities might include shale, stones and iron.� Moisture content is low, typically 4–7%, and so derating from drying moisture is minimal.� Sulphur content ranges from 0.2% to 7.0%.� Gross CV varies from 3100 to 5100 kcal/kg, averaging 4200 kcal/kg.
In one example, the Suratgarh power station was built by BHEL and designed to use domestic coals of45% ash supplied by CIL, some of which comes from the Northern Coalfield Ltd (NCL). Importedcoals are blended with domestic supplies to reduce the ash content to 30%, which is still high, butcomplies with the government imposed limits of 34% above which coal is not permitted to be railed
41Impacts of seaborne trade on coal importing counries – Pacific market
India
Table 8 Utilities with coal import targets(CEA, 2009)
UtilityAnnual target ofimported coal,Mt (2009-10)
Haryana Power 0.6
Punjab SEB 0.6
Rajasthan RV Utpandam Nigam 0.8
UPRVUNL 0.4
Madyha Pradesh GENCO 0.6
Torrent AEC 0.5
Gujurat SEB 1.48
Maharashta SEB 2.2
Reliance 0.5
Andhra Pradesh Genco 0.8
Tamil Nadu EB 1.8
KPCL 0.8
OPGC 0.02
DVC 0.8
CESC 0.5
West Bengal Power Dev. Co 0.8
NTPC 12.5
TROMBAY 3
TOTAL 28.7
over long distances (see below). Even coking coals are blended to achieve the desired ash qualities.For example, SAIL uses up to 12 different sources of coal for coke production (Mills, 2006).
Blending techniques adopted by power plants are often rudimentary and there may be little in the wayof formalised procedures, so coal properties within a single consignment can vary greatly (Couch,2007). In a few cases, there has been some movement towards the adoption of more advancedblending systems. At Reliance Energy’s Dahanu power plant, the fuel management system is nowused to control the blending of high ash indigenous coal with low ash Indonesian imports. This isclaimed to be the first such application in India (Mills, 2006).
Table 9 shows three examples of how altering the coal feed can benefit power station operation. Threestations analysed by Dua (2003) switched to lower ash coals, and in doing so managed to increaseplant availability, load factors, boiler efficiency, reduce mill power consumption, reduce auxiliarypower consumption, and reduce oil back-up consumption. Clearly, importing coal can provide benefitsto some power utilities in these respects, as well as improving the health prospects of citizens,especially those that are already subject to poor living standards, and are residing close to powergenerating plants with inadequate control equipment to reduce stack emissions.
Similar experiences elsewhere were shown by Chandra and Chandra (2004) who analysed the impactof importing Australian coal at the Bardarpur power station located in New Delhi. This is an unusualexample as the power station is far inland, but perhaps proves that coal imports are possible in all ofIndia’s power stations if the infrastructure is in place. The Indian coals had an ash content of 21–40%,moisture content of 1.9–7.8%, and heating values at a low 3910–4300 kcal/kg. If it were not for thelow moisture content, such heating values are normally seen in lower ranks coals such as lignites andsubbituminous coals.
While much is said of the low quality of Indian domestic coals, much of the indigenous supplies to
42 IEA CLEAN COAL CENTRE
India
Table 9 Examples of power plants switching to lower ash coals (Dua, 2003)
Satpura TPS Dadri TPS Dahanu TPS
PLF, % Increased from 73% to 96% Increased by 4%Increased from 76.6% to88.7%
Coal consumption Reduced from 0.77 to 0.55kcal/kWh (28.5% reduction)
Reduced by 0.05kg/kWh
Boiler efficiency Increased by 3% Increased by 1.2%
AvailabilityIncreased from 92% to98%
Mill powerconsumption, kWh
48% reduction
Auxiliary powerconsumption
Reduced by 5.4%
Support oil None now requiredReduced by0.35 ml/kWh
Reduced by 0.31 ml/kWh
Operating hours Increased by 10%
Daily generation Increased by 2.4 MU Increased by 1.48 MU
power plants suffer from contamination. As opencast mining dominates Indian coal mining practice,and extractions often crude, coal quality is often compromised by the inclusion of soil and othermaterial from the overburden. To counter these effects, in 2002, the long distance transport of coalwith an ash content of more than 34% was prohibited. Of the country’s 81 major thermal powerplants, 39 are now required to use cleaned coal with ash below this prescribed level.
Since the prohibition of transporting 34% ash coals was introduced, rail costs per tonne have reduced,along with reductions in the amount of bottom ash, flyash, and CO2 emitted (Pandey and Tyagi,2007). The Maharashta State Power Generation Co (Mahagenco) is reported to require coal with agross heating value of no less than 6300 kcal/kg, although some coal imports can be as low as5500 kcal/kg (TOI, 2010). However, at the time imports were considerably more expensive thandomestic coal, some six times the cost, but given the lack of environmental controls on Indian powerstations, that statement probably did not account for the environmental benefits and the improvedperformance of the power plant, in some ways justifying the cost of the coal (Chaudhary andSethuram, 2010).
5.5 Cost advantage of imported coal
This Section examines the cost advantages offered by imported coal compared with domestic coals.Almost 88% of the country’s production comes from opencast mines, while 12% comes fromunderground deep mines. Geological conditions for the underground mines are difficult, while theopencast seams are generally thick and close to the surface. CIL has a planned capital outlay of Rps18,000 crore (approximately US$ 400 million), part of which will go towards larger payload trucks(240 Mt) and larger shovels supplied by US equipment suppliers Caterpillar and Bucyrus InternationalInc. This investment is the first step in the direction for higher productivity, but there is still a greatdeal of modernisation yet to be achieved.
With 397,000 employees and a total production of 431 Mt, labour productivity in the Indian coalindustry remains low. In 2009-10, mine productivity was roughly 1100 tonnes per man year. This isprobably comparable with many mines in China. The next largest producer Singareni CollieriesCompany Ltd, had a lower level of productivity in 2011 estimated at 770 tonnes/man year. Whencompared with other major producing countries, Australia productivity is in the range8,000–12,000 t/man year for both opencast and underground mines. So with abundant coal reservesand the potential to improve productivity, India could be a world class producer of coal; however thispotential seems a long way off.
The most important factor that keeps Indian coal competitive with imported coals is the cost ofproduction per tonne. Figure 15 shows the US$ cost of producing coal in India, the most importantnumber being that for opencast mines. The cost of opencast mining has risen in recent years, probablydue to increasing diesel costs, explosives, and labour on a per tonne basis; cost inflation is beingexperienced in mine operations worldwide.
According to Jha (2011), the cost of coal in 2009-10 was just 11.5 US$/t. Given this is for a lowheating value and high ash coal, then it is not directly comparable with internationally traded coal, butadjusting for a 6000 kcal/kg South African coal could put Indian coal at a cost equivalent to15–20 US$/t, still placing Indian coal some way below the cost of export mines across the world.Consequently, India is similar to some other non-OECD nations where coal imports have offered littleor no cost advantage (on an equivalent heating value and per tonne basis).
The price trend of steam coal destined for power generators is published by the IEA in the Prices andTaxes databook and shows that the delivered cost of coal is on average low. Coal is subject to aStowing Excise Duty (SED), which was at a rate of 3.5 INR/t prior to 2003, and raised to 10 INR/tfrom June 2003. Royalties have increased in steps, presumably as the demand for coal has risen. The
43Impacts of seaborne trade on coal importing counries – Pacific market
India
current rate of 124.5 INR/t was introduced in August 2007, from 85 INR/t previously. The pricespublished by the IEA are based on non-coking coal Grade E (ROM, non-long flame) from theRajmahal Area of Eastern Coal Ltd (ECL) a subsidiary of CIL. The net heating value is estimated tobe 4560 kcal/kg.
It is difficult to standardise steam coal prices in India since the regional differences in prices must bewide. The rail costs alone are difficult to establish as the distances can vary widely, but reports suggestthat rail costs may be as little as 1.7 $/t or 2.3 $/t on a 6000 kcal/kg basis (DB, 2008). However,
Figure 16 Steam coal prices for power generation in India
according to ICC (2009) coal costs at the power station are often double, due to the cost of inlandfreight. Much of this is attributed to artificially elevated freight rates due to the cross-subsidisation toaid lower passenger fares. This would suggest that the cost of rail could be in the range 7–16 $/tassuming the figures in Figure 16 are used for comparison. This might be a more sensible figure ascoal sent by rail is often sidelined in favour of passenger traffic sharing the same railway lines, alongwith congestion and demurrage charges due to delays which will worsen as production capacityincreases.
In the past, CIL operated a Domestic Price Fixation system for certain coal grades (grades E to G)until January 2000, with a clause to update prices every six months to reflect a cost index based on anescalation formula that was contained in the 1987 report of the Bureau of Industrial Cost & Prices.After January 2000, CIL was free to fix prices of any grade in relation to market prices.
5.6 Infrastructure and logistics
Coal reserves are concentrated in the east and south of the country, while consumption is spreadacross the country. Getting the coal to the west and northern states is therefore done using inlandtransportation. The major mode of inland transport for coal in India is rail, although small quantitiesare transported by road.
Coal is moved in a variety of ways, rail, sea, road, MGR (merry-go-round) closed loop for minemouthplants, belt conveyor, or even ropeway. Rail infrastructure is by far the largest system, and coal is thelargest single commodity being carried around India. Rail carries 53% of the coal in the country.MGR moves 23%, road is 21%, belts 2% and ropeways 1.5%. However in the 1980s, as much as 70%of coal was moved by rail. Likewise for the railways, coal is an important commodity accounting for46% of freight loading and 38% of total freight earnings (Mills, 2006). Short haul transport includesconveyor systems and ropeways.
Delays in the development of the Indian rail system in terms of freight capacity expansion through railline capacity and wagon/rolling stock could pose an obstacle to growth in indigenous coal production.New freight lines are being considered, and one proposal is a dedicated freight corridor (DFC) fromHowrah to Delhi which could relieve some of the congestion for coal movements.
A 43 km rail link in the Ib Valley has been approved while other proposals might see a tripling of thefreight line between Bhubaneswar to Vishakhapatnam, double and triple lines between Rajatgarh toKhurda, and a link between Talcher and Paradip (ICC, 2009). In North Karanpura, a double rail linkof 93 km has been proposed for which the company is seeking forest clearance from the EnvironmentMinistry as of May 2011. The new coalfield Mand-Raigarh is being linked to Korba coalfield, whichwill be eventually linked to the Pendra Road-Amritpur line.
In 2010, while rail lines were available, a lack of rolling stock was cited as a problem for someregions. Orissa state has seen coal imports being affected by this problem seeing less steam andcoking coal being transported to Indian consumers due to few wagons being supplied by the railcompanies (Singh, 2010). Part of this is rail shortage is due to the recent ban on iron ore export in July2010 which means fewer rail cars are available to return (backhaul) with coal imports or highercharges to move the stockpiled imports. The ban applies to ore mined in Karnataka in India’s southwest as a last ditch attempt by the government to reduce illegal mining that avoided tax.
Coal importers loaded stock onto wagons that arrived at export ports with iron ore for backhauljourneys. The worst affected ports included Gangavaram, Krishnapatnam, Chennai, Vizag, andParadip. Vessel congestion increased and even CIL has had problems acquiring empty backhaul trainsto take coal from its own stockpiles to power stations. This manifested itself as a shortage of coal atpower stations, and hence a reduction in available capacity. Some of the reduced capacity was helped
45Impacts of seaborne trade on coal importing counries – Pacific market
India
by the reduction in industrial demand ahead ofthe monsoon season when industrial facilitiesoverproduce cement and metals to carry themthrough the monsoon period. Ganagavaram (orVisakhpatnam) is capable of taking capesizevessels and is considered the deepest port inIndia. West coast ports have been less affected,and the western coast ports of Mundra,Pipavav, Navlakhi, and Kandla generallyhandle South African imports. East coast portstend to handle Indonesian coal imports.
A shortage of line and wagon availabilityforced CIL to store a large quantity of thefuel itself, with stocks as high as 63 Mt inMarch 2010 (WSJ, 2011). CIL may investheavily in coming years on railwayinfrastructure, which could be dedicated tocoal transport and so could provide a greatersecurity of supply to India’s domestic supply.Three new rail links could be built totalling350 km, requiring in excess of Rs 2000 crore(US$45 million). The rail lines would link IbValley, North Karanpura, and the Mand-Raigarh coalfields.
According to official railway policy, companies wanting dedicated services, like CIL, will have tofund the construction of the rail link, along with land acquisition costs. Ownership, operation, andmaintenance of the services and assets will be the responsibility of Indian Railways. Investing firmssuch as CIL can recover their costs through the levy of ‘surcharge’ on the freight rates, over a10–25-year period. Companies can recover the costs through development charges from various usersof the line, or can also be compensated by the surcharge – but the Railway Ministry is yet to finalisethe model concession agreement for implementing the policy. New routes that could boost importshave been proposed to connect New Mangalore, Kandla, Tuticonrin, and Diamond Harbore to mainlines and cities.
Hard coal is imported through a number of ports, according to the ICC (2009), India has 12 majorports and about 180 minor ports. The cargo handling capacity of major Indian ports was 530 Mt in2008. Many ports still lack vessel traffic management systems (VTMS) used for berthing shipsalthough most ports have adequate tugs and launches to assist individual vessels.
Figure 17 shows the distribution of commodities handled at Indian ports. Major ports in India handlemore than 70% of the cargo volume but the share of cargo handled by minor ports has been increasingover the last twenty years. The biggest tonnages are handled by the ports of Paradip (the biggest),Ennore, Tuticorin, Haldia, Visakhapatnam and Chennai. However, not all major ports (for instance,Calcutta) are engaged in coal traffic (Indian Ports Association, 2006). Various means of coal dischargeare deployed. These include shore crane/grab-conveyor systems used at Haldia (8000 t/d), Paradip(9000 t/d) and Chennai, and ship crane/grab transfers from jetty to stockyards at Haldia, Paradip andVizag. Recently, three state-owned power plants (one each in Maharashtra,West Bengal and Bihar)have begun importing coal through eastern ports.
The Maharashtra State Electricity Board is importing coal via Visakhapatnam to supply its Koradihpower station, NTPC is importing through Haldia for its Kahalgaon plant, and West Bengal PowerDevelopment Corporation is bringing in coal through Haldia for its Kolaghat plant. To date, NTPC has
46 IEA CLEAN COAL CENTRE
India
POI 32%
containers 18%
coking coal 5%
thermal coal 8%
fert raw 1%
fin raw 2%
iron ore 18%
others 16%
Figure 17 Commodities handled at Indian portsin 2007-08
been the major importer of coal through all three east coast ports, also bringing in supplies for itsFarakka, Simadri and Talcher stations.
Equipment at ports breaks down frequently due to poor (and lack of ongoing) maintenance. Longresponse times and a lack of spares means longer periods of downtime while carrying out remedialrepairs. Port facilities are expected to rise sharply due to the rise in the number of ultramega powerprojects. The abolition of the steam coal import tax (equivalent to 5% of the price) may well helpimporters shoulder some increase in costs needed to build capacity for the inland rail system. Theabolition expires in 2014, after which the tax could be reinstated.
India’s prospects for coal imports are as dynamic as they are for China, except for major constraintson domestic supply and import infrastructure. While China has a market that has been able to swingfrom export to import, and could swing back again in years to come, India appears to have no suchcapability at present. India is therefore a more predictable market than China. The main issues forIndia are that the development of domestic coal production faces obstacles that are common in manyOECD economies. In the case of India, the domestic industry may be criticised for not developingmine capacity to keep up with demand, but developments can be delayed if the Environment Ministryis not satisfied with the submission of environmental impact assessments and/or relevant permitapplications. Despite the apparent slowness in developing Indian coal production, productivity couldbe improved at existing mine facilities. Nevertheless, while steam coal production continues toincrease, albeit not enough to meet the rising demand, the supply of coking coal may not improve.
5.7 Coal importing power stations
Figure 18 is a map of coal-fired power stations in India, and while coal production is concentrated inthe eastern and southern states, coal-fired power is spread widely across the entire country. Almostevery major utility in India imports coal. Imports are also known to have supplied inland powerstations such Chandrapur and Torenagella, but many stations that import coal are located coastally,some within a few km of the coastal ports.
In June 2009, the target imports for 2009-10 amounted to 28.7 Mt, imported by eighteen utilities. Outof 43 GWe of power capacity that had been awarded through competitive bidding, 13 GWe aredependent on imports. This roughly equates to a maximum 26 Mt of coal if all the capacity wasburning imports.
Table 10 lists a number of power stations that use imported coal, mostly in blend with domestic coal,but few rely on imported coal. The list is not exhaustive and only shows those stations where there isknowledge of coal imports, either through IEA CCC internal databases or from evidence from theIndian Central Electricity Authority (CEA). Where the coal quality of the power station is known,many show that the main fuel is domestic, given that the ash contents are 34% or above, and theheating values are low at less than 20 MJ/kg (typically net). The list has 42 stations either importing,or earmarked to import coal. This list is likely to lengthen as time goes on. Figure 19 shows howdiverse the companies are that are either building dedicated coal-fired capacity for imported coal, orare increasingly blending domestic with imported coal.
Every month, the CEA (2010) lists power stations which are undergoing emergency stock levels ofless than seven days. This problem has become worse in recent years, and confusingly, these stationsare called critical and supercritical power stations (supercritical where stocks are less than four days).Therefore, these terms do not refer to those commonly applied to the steam conditions employed forhigh efficiency thermal power generation. This stock level list includes reasons for supply shortfallsdue to mine disruption, transport failures, a shortfall in imported sources, or port delivery problems.Estimates for the generating plants with access to imported coal are around 48 GWe, this means apotential 100 Mt/y of coal could be imported for these stations if they switched to imported coal
47Impacts of seaborne trade on coal importing counries – Pacific market
India
completely. There are nineteen companies shown here, with some companies having more capacitythat can burn imported coal than others, some of which include privately owned corporations such asReliance and Tata Power Company (see Figure 19). Other companies that import coal include the
48 IEA CLEAN COAL CENTRE
India
DM
power station
domesticimport
port
Tibet
Shri Goro Gobind
Deenbandhu ChhotuShri Guru Hargobind
Bathinda
Rajiv GandhiSuratgarh Panipat
DadriBadarpur
Faridabad
Jhajjar (proposed)
Giral
KotoChhabra
Parichha
Panki
Feroz Gandhi
Tanda
Nepal
Kanti
Mundra (D&M)Sabarmati Wanakbori
Gandhinagar (D&M)
Satpura
Lanco Amarkantak
Obra
RihandSasan UMPP
AnparaVindhyachal
Singrauli
Jindal Budge Budge (D&M)
Orissa UMPPAkaltara UMPP
IB ThermalBhilai
SipalManikpur
Dr SPM or Korba East
Talcher
Chandrapur (D&M)
KoradiKhaperkheda (D&M)UKai (D&M)
Deepnagar or Bhusawal (D&M)Paras (D&M)
Nasik (D&M)Dahanu (D&M)
Trombay (M) Parli (D&M)
Ramugandam (D)Ramagundam
Kothagudem (D)Simhadri
Lanco or Kakatiya (D)Raichur (D&M)
Toranagallu (M)Rayalaseema
Krishnapatnam (D&M)
North ChennaiEnnore
Port of Ennore
MetturNeyveli
Sampur
Tuticorin
Sri Lanka
Girye UMPP
KahalgonFarakka
SagardighiMaithon site
Durgapur steelBakreshwarMejia
Titagarh (D)
Kolaghat
Port of Haldia
Port of Paradip
Port of Visakhpatnam
Port of Tuticorin
Pakistan
Bhutan
Burma
New Delhi
Hyderabad
Mumbai
ibetT
Pakistan
Giral
Suratg
oposed)Jhajjar (pr
Faridabadgarh
Rajiv GandhiR
indaBathin bindShri Guru Hargob
Pakistan
T
ibetT
u
oz GandhiFer
Panki
oposed)
Faridabad
BadarpurDadri
Panipat
Deenbandhu Chhotu
o Gobi bindShri Gor
New Delhi
Kanti
Nepal
andaBurma
TTa
oz Gandhi
Bhutan
Burma
Bhutan
D De
Mundra (D&M)
Bhus epnagar or B sawal (D&M)
Kai UK (D&M) Khaperkheda (D&M)
Satpura
Gandhinagar (D&M)
anakboriWmatiSabarMundra (D&M)
Koto
Giral
Paras (D&M)
k
Khaperkheda (D&M)Koradi
Dr SPM or Korba EastManikpur
Bhilai
SingrauliindhyachalV
Anpara
Sasan UMPPLanco Amarkantak
Satpura
oz GandhiFerParichha
ChhabraKoto
t of Haldia
Kolaag
Por
Titag aga Mejia
pur seshwarBakr Durgapur steel
Maithon site dighi
Farakk
Sagar
kkaKahalgalgon
alcherTTa
Sipal
malIB TherAkaltara UMPPOrissa UMPP
Budge Budge (D&M)Jindal
Sasan UMPPRihand
Obra
Kantioz Gandhi
t of Haldia
Kolaghat
Titagarh (D)
Durgapur steel
dighi
ombay (M)
ye UMPPGir
Ramugandam (D)
Parli (D&M)
Nasik (D&M)
rT
Dahanu (D&M)
Mumbai
maRayalaseem
aka
oranagallu (M)T
Raichur (D&M)Lanco or Ka
SimhadriKothagudem (D)
RamagundamRamugandam (D)
Chandrapur (D&M)
HyderabadisakhpatnamSimhadri t of VPor
t of ParadipPor
Lanco or Kakatiya (D)
t of Paradip
yveli
uticorinT
Ney
t of Ennor
Mettur
e
Por
Krishnapatnam (D&M)
Ennorth ChennaiNor
t
e
por
timpordomestic
power station
MD
t of Ennor
Krishnapatnam (D&M)
t of TPor o uticorin
Sri Lanka
of T SampurS
Figure 18 Power station map of India
public utilities such as NTPC, West BengalPower, and Maharashtra State Power.
Under the 12th Five-year Plan (2012-17) afurther 80 GWe could be built, much of whichcould come from IPPs seeking imported coalas a major source of fuel supply. According toO’Connell (2010), India is planning to expandits generating capacity by a massive 14%/ybetween 2010 and 2012. Generating capacitycould rise to 220 GWe although not all of thiswould be coal fired. The demand for importedcoal could range between 24 to 164 Mt/y in2015 Mt depending on the growth scenario forsteam coal in power generation and cokingcoal for iron and steel production. Whicheverscenario is considered accurate, importsappear to be on the rise in the future.
At least, 500 kt of coal imports will be used inthe Satpura Thermal Power Station at Sarni inBetul, while any remaining stock will be usedin the Sanjay Gandhi Thermal Power Stationat Birsinghpur in Umaria. Interestingly, theSatpura power station demonstrated thebenefits of switching to low ash coals in theearly 2000s (see above), and so MadhyaPradesh state is not unaccustomed toimporting coal. Coal imports are expandingnationwide as more coastal power stations arebeing built, especially with demand from theultra mega power projects (see below).However, the existing power stations thattypically buy domestically mined coal andexperience supply shortfalls do not always
find importing coal a straightforward process (Bihar, 2011). The tendering process for purchasing coalimports can take a long time in order for due diligence to be completed.
5.8 Role of the UMPP and overseas mining investments
Additional investment is taken in the form of transmission grid capacity, and in terms of coal-firedcapacity nine ultra mega power projects (UMPP). These are all supercritical stations of at least4000 MW capacity. These are all being built on coastal sites to exploit imported coal as well asminemouth stations that will use domestic coals. Only four UMPP have progressed. The first is a seawater reverse osmosis plant built at Mundra in the Kutch district of Gujurat. It is also the country’sfirst IPP that uses supercritical technology at a cost of $4.2 billion. Mundra is owned by CoastalGujurat Power Ltd (CGPL) formed by Tata Power, the largest IPP in India.
Coal will be imported from Indonesian coal mines, also part owned by Tata. Contracts for three otherUMPP are also in place for Sasan (minemouth power station); Tilaiyya (minemouth); Krishnapatnam(coastal); these have been awarded to Reliance Power. Reliance Power Ltd, a subsidiary of theReliance Infrastructure group, in 2008 announced an investment of US$1 billion in acquiring anddeveloping a coal mine in the Indonesian province of South Sumatra. The subbituminous coal was
49Impacts of seaborne trade on coal importing counries – Pacific market
India
Apgenco 6%
Bilhar 0%
CESC Ltd 2%
Damodar Valley Corp 7%
Gujurat EB 4%
HGPCL 4%
JSW Energy Ltd 2%
Karnataka Power Corp 4%
Madhya Pradesh EB 3%
Maharashtra State EB 8%
Mundra SEZ 4%
NTPC 10%
RRVUN 4%
Reliance 11%
Tamil Nadu EB 6%
Tata Power CO 11%
Torrent Power 1%
Utter Pradesh Genco 3%
W Bengal Power 10%
Figure 19 Coal capacity that imports coal byutility share, %
50 IEA CLEAN COAL CENTRE
India
Table 10 Sam
ple list of coal-fired stations known to im
port coal (
Coa
lPow
er,
2011
; CE
A,
2010
)
Pla
nt n
ame
Ow
ners
hip
MW
eS
tatu
sN
et C
VA
sh,
%To
tal a
nnua
lco
nsum
ptio
n (D
omes
tic+
Im
port
s) M
t/y
Dr
N T
ata
Rao
/Vija
yaw
eda
And
hra
Pra
desh
Gen
erat
ing
Co
(AP
GE
NC
O)
1760
OP
R
Ray
alas
eem
aA
ndhr
a P
rade
sh G
ener
atin
g C
o (A
PG
EN
CO
)10
50O
PR
Muz
affa
rpur
Bih
ar S
EB
220
OP
R
Bud
ge B
udge
CE
SC
Ltd
750
OP
R17
.02.
2
Tita
garh
CE
SC
Ltd
240
OP
R18
.01.
2
Cha
ndra
pura
Dam
odar
Val
ley
Cor
p17
50O
PR
40.0
1.5
Mej
iaD
amod
ar V
alle
y C
orp
1340
OP
R3.
7
Uka
iG
ujur
at E
B85
0O
PR
13.5
34.6
3.6
Gan
dhin
agar
Guj
urat
EB
870
OP
R12
.935
.03.
2
Pan
ipat
Har
yana
Pow
er G
ener
atin
g C
o Lt
d (H
GP
CL)
1360
OP
R5.
8
Yam
una
Nag
arH
arya
na P
ower
Gen
erat
ing
Co
Ltd
(HG
PC
L)60
0O
PR
Tora
naga
lluJS
W E
nerg
y Lt
d86
0O
PR
25.1
11.0
0.6
Rai
chur
Kar
nata
ka P
ower
Cor
p17
20O
PR
34.0
6.0
San
jay
Gan
dhi
Mad
hya
Pra
desh
EB
1340
OP
R3.
7
Dee
pnag
ar/B
husa
wal
Mah
aras
htra
Sta
te E
B47
8O
PR
2.4
Nas
ikM
ahar
asht
ra S
tate
EB
910
OP
R
Par
liM
ahar
asht
ra S
tate
EB
1170
OP
R38
.03.
8
Par
asM
ahar
asht
ra S
tate
EB
558
OP
R18
.034
.00.
3
Kha
park
heda
II
Mah
aras
htra
Sta
te E
B84
0O
PR
Mun
dra
Mun
dra
SE
Z19
80O
PR
51Impacts of seaborne trade on coal importing counries – Pacific market
India
Table 10 Sam
ple list of coal-fired stations known to im
port coal (
Coa
lPow
er,
2011
; CE
A,
2010
)
Kah
alga
onN
TP
C23
40O
PR
10.8
40.0
5.8
Bhi
lai
NT
PC
574
OP
R
Sim
hadr
iN
TP
C15
00O
PR
5.9
Talc
her
NT
PC
460
OP
R2.
8
Chh
abra
Raj
asth
an R
ajya
Vid
yut
Utp
anda
n N
ijam
500
CO
N
Sur
atga
rhR
ajas
than
Raj
ya V
idyu
t U
tpan
dan
Nija
m15
00O
PR
6.0
Ros
aR
elia
nce
600
OP
R
Dah
anu
Rel
ianc
e50
0O
PR
34.0
2.3
Kris
hnap
atna
mR
elia
nce
3960
CO
NIn
done
sian
Enn
ore
Tam
il N
adu
EB
450
OP
R0.
6
Met
tur
Tam
il N
adu
EB
840
OP
R4.
0
Nor
th C
henn
aiTa
mil
Nad
u E
B63
0O
PR
2.5
Tutic
orin
Tam
il N
adu
EB
1050
OP
R5.
7
Mun
dra
Tata
Pow
er C
O40
00P
LNIn
done
sian
Trom
bay
Tata
Pow
er C
O14
00O
PR
Impo
rted
Sab
erm
ati
Torr
ent
Pow
er40
0O
PR
2.0
Obr
aU
tter
Pra
desh
Gen
co15
50O
PR
4.8
Ban
del
W B
enga
l Pow
er53
0O
PR
1.3
Kol
agha
tW
Ben
gal P
ower
1260
OP
R5.
0
Sag
ardi
ghi
W B
enga
l Pow
er60
0O
PR
San
tald
ihW
Ben
gal P
ower
980
OP
R
Kol
agha
tW
Ben
gal P
ower
1260
OP
R5.
0
Tota
l47
530
91.7
destined for the 4000 MWe UMPP at Krishnapatnam and Andhra Pradesh, which is due online in2013. Coal would also supply the 4000 MWe Shahapur project in Mahrashtra.
By 2011, two Memoranda of Understanding (MoU) had been planned for the total project investmentof $5 billion, to involve a 2 Mt/y coal mine, 200 km railway, port and a 2000 MWe project costingtotal of US$3.5 billion. A further project in Indonesia, the Jambi project, consisted of another coalmine and transport and export infrastructure costing $1.5 billion. It was expected that the project inSumatra would be completed by 2016. In 2010, Reliance acquired three coal mines, in Sumatra fromPT Sriwijaya Tiga Energi and PT Brayan Bintang Tiga energy. The three mines cover an area of125,000 ha and contain 2 Gt of coal. All this coal was destined for Krishnapatnam.
IPPs sought government intervention in anticipation of the rise in imported coal, which entailed a risein delivered coal prices. The 14 member Association of Power Producers (APP) set up an expertcommittee to deal with the issue of imported prices. Reliance, Tata, Essar Power, Adani Power, GMREnergy and Jindal Power could face changes in law in Indonesia under the new benchmark pricingwhich means that coal exporters, many dealing with India, cannot underprice coal, but will need toadhere to a price indexation system based on past prices. In addition, Australian exporters may besubject to export taxes on excessive profits, as well as imposing carbon taxes. The estimated hike inprices could be 20–25 US$/t. Some 50% of coal imports come from Indonesia and 5% from Australia.The APP Committee wanted to pass coal price hikes through to the tariffs in a way that was agreeableto the government.
52 IEA CLEAN COAL CENTRE
India
6 Conclusions
53Impacts of seaborne trade on coal importing counries – Pacific market
In recent years, there has been a convergence of international trade with traditional domestic markets,with imports increasing in many coal producing regions. The influence of trade on domestic marketshas been twofold. Firstly, imported coal displaces domestic production; secondly, international pricetrends may drive prices of what remains of the indigenous market for coal if imports are significant.
Where transport infrastructure is adequate, imported coal has displaced locally produced coal for onereason or another. The Pacific market is interesting as there are large importing countries from both anOECD and a non-OECD perspective. All are vying for secure coal supplies from the internationalseaborne market, but some are operating under tight emission standards such as Japan and Korea.Countries like India are readily importing coal to maintain steady supplies, while operating powergenerating plants under less stringent emission standards. Interestingly, China is bridging these twotier markets, having newly adopted emission standards to rival those of OECD Europe. All countrieshave one thing in common which is the continued demand for imported coal.
China and India are rich in coal reserves, and despite the potential for economic slowdown in the shortto medium term, long-term growth in electricity demand in these two economies could push coaldemand higher. However, it is easy to ignore the importance of countries such as Japan and Koreawhich remain among the largest importers of hard coal in the world. Both countries are in the topthree coal importing countries, along with China, but India is catching up.
In the past, Japan and Korea had flourishing coal industries, but migration of working coal faces intodifficult geological conditions and ensuing rising costs has meant that they have become almostentirely dependent on imported coal. This is a pattern that may be reflected in some European hardcoal industries in the near future, such as Germany.
In the early 1950s, Japan had almost 950 mines producing 47 Mt of coal per year. Interestingly, thecountry underwent a massive cut in mine numbers in the 1960s. By 1992, Japan had less than 20mines operating and produced just over 8 Mt/y of high quality bituminous coal. Today, Japan importssome 165 Mt of hard coal, accounting for 20% of the world seaborne market. Two thirds of its importsare bituminous steam quality and the rest is coking coal. Coal-fired power stations are almost all sitedon the coast, so the logistics of importing coal are straightforward.
There is little difference in quality between domestically produced coal and imported products.Indigenous coal qualities are similar to equivalently ranked coals that are traded internationally.Domestic coal mines cannot operate at the scale needed to meet demand. In some ways there aresimilarities with India, where imported coal is bridging the gap between higher demand and lowerlocal supply. Demand for steam coal alone is 150 Mt/y.
The cost of coal delivered to all power stations in Japan is determined by the price of internationallytraded coal. In turn, Japanese utilities are some of the most important price negotiators in the world,and have long been world price setters, based on its annual negotiations with Australian exportproducers. With the emergence of China and India as major importers, this influence could diminishsomewhat.
In 2002, subsidies to the Japanese coal industry were eliminated. In Europe, Spain continues tosupport its domestic hard coal industry, but in the absence of market support, the industry couldfollow a similar path to Japan (and Germany). As well as operating a few small mines in the north ofthe country, Japan now offers extensive training and exploration expertise for other countries, not leastto China, Vietnam, and the world’s (current) leading steam coal exporter, Indonesia. Miningengineering services in mechanised mining systems, safety, and management are all provided.
Korea has had a similar history to Japan. Domestic coal consists entirely of anthracite, while importscomprise 70–80% bituminous steam coal, with 20% coking coal, and small amounts of anthracite.
Domestic production is around 2.5 Mt/y. In the 1980s, domestic coal accounted for 50% of Koreansupplies; by the 1990s, domestic production provided 30% of the nation’s supply. Today, the demandfor coal is met by imports, although a third of anthracite supplies still comes from domestic mines.Korea imports more than 100 Mt of hard coal every year, and has been one of the top three hard coalimporters for some years. The cost of all coal delivered to power stations in Korea is dependent on theprice of internationally traded coal.
In China and India, imported coal plays a marginal role in terms of volume, providing perhaps 5% and10% of these countries’ respective supply. China once produced more coal than it needed and, untilrecently, was a regular net-exporter to the international market. Between 2007 and 2009, Chinabecame a massive net-importer of hard coal, switching its role in the world market.
In China, coal imports account for such a small proportion of the market yet command a significantinfluence over coal price negotiations between domestic producers and power utilities. Chinaproduces almost half the world’s supply of coal. Its domestic mines’ activities determine the degree towhich imports are needed, and the volumes can be sizeable. As such, the draw on imports can affectinternational coal prices, and China’s markets can affect the price of coal in Europe.
The demand centres in China are located in the southern and eastern regions, along the coast of China,the most significant being Guangdong. Logistically, these regions are located a considerable distancefrom the domestic mining regions which are located inland in Shanxi, Shaanxi and Inner Mongolia.Rail infrastructure is still oversubscribed for freight routes although great strides have been made tospeed up traffic and modernise freight lines. Coal from the mining regions still requires rail transportto the northern ports before being shipped by sea down the Chinese east coast.
Seaborne traded foreign coal and seaborne domestic coal converge at various import points along theChinese coastline, competing on a delivered price at the ports. The quality of Chinese coal is generallyvery good, and in the past has been cheap enough to export, which explains why domestic andimported coal is easily interchangeable. The Chinese coal market is to some degree ‘micromanaged’by central authorities which determine the closure and restructuring of coal mines (often due to safetyreasons), and also influence trade export quotas. However at the same time, coal products arecompeting on price and tonnage, a new market based approach to coal negotiations, and changes inthe exchange rate, making imported coal increasingly attractive. Negotiations between utilities andcoal suppliers within China are influenced by international prices, despite the relatively small roleimports play in volume terms. This is in contrast to the USA, which imports small amounts, but thesehave almost no obvious influence on US domestic prices.
The influence of China may well increase in the future, and become the primary driver of worldprices. If power developments continue apace in China, the Guangdong Province alone could havemore coal-fired capacity than Japan or Germany within a few years, and much of this will be seekingcoal from the internationally traded seaborne market.
In India, imported coal serves two criteria: one is a blend coal for lowering the ash content of coals tocoal-fired power stations; the second is that imported supplies bridge the gap created by local supplyproblems. India also has the potential for coal imports to penetrate local markets which are alreadydoing so in more than 40 GWe of coal-fired generating capacity. However, there seems less, if any,arbitrage between imports and domestic supplies compared to the Chinese market. Import demandtends to even out fluctuations in demand and power station stock levels resulting from disruptionsfrom local suppliers, but there seems less reported evidence of price competition. A few projectshowever are contractually bound to coal sourced from Indonesia, especially among the new ultra megapower projects.
54 IEA CLEAN COAL CENTRE
Conclusions
Indian coal is generally low in production and transportation costs, but imports offer better availabilityand quality. Coal quality in India is good in some respects, such as heating value, but ash content isvery high and the coal is difficult to clean using conventional coal preparation methods – ash removaltherefore becomes an issue for the power generator.
There has been a threefold rise in coal production since 1990 (fivefold since the 1980s) and thecountry produces almost 500 Mt/y, making it the third largest producers in the world behind Chinaand the USA. This is a considerable effort, yet pressure remains on domestic producers to developnew mine capacity. Coal mines in India are located in the north of the country and inland. Manyoperations are overmanned and unproductive by world export standards, using small-scalemechanisation. A few mines are starting to adopt large scale mechanisation, which could spreadacross the country but this will require considerably more investment. Regardless of these issues, coalmining is a low cost industry. Most mines are opencast, and many serve power stations bothminemouth and in other regions.
The high demand however is also a function of the excessive fuel requirements of less efficient coal-fired plants. China on the other hand has a programme to shut smaller and inefficient units of less than300 MWe, and so the efficiency of the fleet is progressing quickly. India has no such programme andso the fleet is progressing rather more slowly.
New so-called ultra mega power projects are garnering the opportunity to provide bulk power to localpublic utilities using larger generating units with up-to-date technology; almost all are located on thecoast and can exploit the international coal market.
In summary, with a lack of significant oil and gas reserves all the countries featured in this report relyon coal to play a role as a secure form of power generation. However, security of supply of coal can bemarred if there is complete dependence on domestic sources, which often proves inadequate wherethere are limited coal reserves or the infrastructure is inadequate to transport the coal from mine topower station (except for minemouth stations). With more power stations located closer to demandcentres, and away from mines, supplies today are always supplemented with imported coal supplies.Coal qualities can be improved through coal blending, but imports can then expose domestic marketsto the fluctuations in international prices and market dynamics outside the influence of theseindividual markets. Prices are driven in part by Japanese and Korean price negotiations, and domesticcircumstances in China. Indian domestic mining is less influenced by import coal prices.
55Impacts of seaborne trade on coal importing counries – Pacific market
Conclusions
7 References
56 IEA CLEAN COAL CENTRE
APERC (2011) APEC Energy Overview, Available at:http://www.ieej.or.jp/aperc/2010pdf/Overview2010.pdf. Asia Pacific Energy Research Centre(APERC), The Institute of Energy Economics, Tokyo, JAPAN (Mar 2011)Arauzo I, Zamorano I, Cortes C, Lacarta M (1997) Evaluation of coal switching effects in pwerplant performance: Turuel power plant operating experience. Available at:http://teide.cps.unizar.es:8080/pub/publicir.nsf/codigos/0123/$FILE/cp0123.pdfArgus (2011) Methodology and Specification Guide. Argus Coal Daily. Available at :http://www.argusmedia.com/~/media/Files/PDFs/Meth/argus_coal_daily.ashx (Jul 2011)BAFA (2010) Federal Office of Economics and Export Control, BAFA. Available from:http://www.bafa.de/bafa/en/energy/index.html (2010)Barna L J (1992) Coal blending and its affects on operations at NIPSCO. In: Thirty-first annualKentucky coal utilization conference, Lexington, KY, USA, 15-16 Apr 1992. Lexington, KY, USA,Kentucky University, 10 pp (1992)Baruya P, McConville A (1997) Coal sulphur content – impact on coal markets, IEAPER/32,London, UK, IEA Clean Coal Centre, 49 pp (Mar 1997)Baruya (2012) Impacts of seaborne trade on coal importing countries – global summary.IEA/CCC197, London, UK, IEA Clean Coal Centre, 52 pp (May 2012)Bhattacharya S (2008) Coal-fired power generation, Replacement/retrofitting of older plants,Workshop on Fuel Options for Power Generation in ASEAN, Bangkok, Thailand, 16 pp, 22-23 Sep (2008)Bihar (2011) Coal shortage may hit India power production. Bihar Prabha Available from:http://www.biharprabha.com/2011/04/coal-shortage-may-hurt-india-power-production/ (23 Apr 2011)Born M, Seifert P (1996) Chlorine corrosion in steam generators. VGB Kraftwerkstechnik - Englishissue; 76(10); 753-758 (Oct 1996)BP (2011) Statistical Review of World Energy. BP, London, UK (2010)Britton J O and others (2007)West Virginia, Mining Engineering, May 2007, p.125 (May 2007)Carpenter A M (1998) Switching to cheaper coals for power generation. CCC/01, London, UK,IEA Clean Coal Centre, 87pp (Apr 1998)Chandra A, Chandra H (2004) Impact of Indian and imported coal on Indian thermal power plants,Journal of Scientific and Industrial Research; 63 (2); 156-162 (February 2004)Chaudhary A, Sethuram D (2010) Indian State tenders for 3.38 million tons coal (Update1).Available at: http://www.coalspot.com/news-detail.php?nid=1014&page=318 (25 Mar 2010)Chinamining (2011) Factbox - China’s major coal importers and trading companies. Available at:http://www.chinamining.org/News/2011-03-11/1299806078d43633.html (11 Mar 2011)CMC (2010) Personal communication, Mr Rodrigo Echeverri - Presentation to Alstom. CoalMarketing Company, Dublin, Ireland, 17 pp (2010)Coal UK (2010) Scots hit 100% success rate again. McCloskey Coal UK, IHS Globalinsight, UK;217 (Jan 2010)CRR (2010) NTPC seeks power-plant coal in India’s biggest import. China Coal Resource. Availableat: http://en.sxcoal.com/35025/DataShow.html (31 Jul 2010)Davidson R M (1996) Chlorine and other halogens in coal. IEAPER/28, London, UK, IEA CoalResearch, 48 pp (Sep 1996)Davidson R M (2000) How coal properties influence emissions. CCC/28, London, UK, IEA CleanCoal Centre, 56 pp (Feb 2000)DB (2008) Railways hike freight rates for coal, coke and cement. Available at: http://www.domain-b.com/companies/companies_I/Indian_Railways/20081208_freight_rates.html (8 Dec 2008)DB Schenke (2010) Energy Business Segment. Available at:http://www.rail.dbschenker.co.uk/pdf/MapEnergyLocations.pdf (2010)Defra (2011) UK UPDATE No. 6, 14 July 2011, Available at:http://archive.defra.gov.uk/environment/quality/air/airquality/eu-int/eu-directives/lcpd/documents/lcpd-nationalplan-update6.pdf (14 Jul 2011)
DG TREN (2008) An evaluation of the needs for state aid to the coal industry post 2010. Frameworkcontract TREN/CC-03-2005 Lot 2: Economic Assistance Activities. 190pp (9 Dec 2008)DTI (2004) UK Coal production outlook: 2004-16. Available at:http://webarchive.nationalarchives.gov.uk/ and http://www.berr.gov.uk/files/file14151.pdf.Department of Trade and Industry, London, UK; 53 pp (Mar 2004)Dua S S (2003) Coal beneficiation needs for Indian power sector, CoalTrans India conference,Mumbai, India, 13-14 February (2003)Economist (2011) Economic and financial indicators. p105 (4-10 Jun 2011)EEA (2010) European Environment Agency. Available at: http://www.eea.europa.eu/data-and-maps/data/national-emissions-reported-to-the-convention-on-long-range-transboundary-air-pollution-lrtap-convention-4 (2010)Elcogas (2000) IGCC Puertollano, A clean coal gasification power plant. Available at:http://212.170.221.11/elcogas_body/images/IMAGEN/TECNOLOGIAGICC/thermie.pdfEuracoal (2008) Coal industry across Europe. Available from:http://www.euracoal.be/pages/medien.php?idpage=406. p 21 (2008)Fitzgerald (2009) Developments in UK ports. Coaltrans 2009, Coaltrans Conferences, 25pp (2009)Freeman M C, Smouse S M, Sastrawinata T, Walbert G F, Rastam M (1997) Believe it or not!Even a 1% ash coal can cause slagging problems. Paper presented at: Effects of coal quality onpower plants, Kansas City, MO, USA, 20-22 May 1997, 19 pp (1997)FU (2010) Company perspectives. Available at: http://www.fundinguniverse.com/company-histories/INSTITUTO-NACIONAL-DE-INDUSTRIA-Company-History.html (2010)Gatiss H (2009) Presentation to Eastern Fuel Buyers Conference, May 2009, Orlando, FL, 41 pp (2009)Globalcoal (2010) Scota specifications. Available at:http://www.globalcoal.com/Brochureware/standardTradingContract/specifications/ (2011)Gunderson J R, Selle S J, Harding N S (1994) Utility experience blending western and easterncoals: survey results. In: Engineering Foundation conference on coalblending and switching of low-sulfur western coals, Snowbird, UT, USA, 26 Sep - 1 Oct 1993. Bryers R W, Harding N S (eds) NewYork, NY, USA, American Society of Mechanical Engineers, pp 111-130 (1994)Gunderson J R, Moe T A, Selle S J, Harding N S (1996) Technology assessment for blendingwestern and eastern coal for SO2 compliance. EPRI-TR-105748, Pleasant Hill, CA, USA, EPRIDistribution Center, vp (May 1996)Heller J (2010) US coal markets: looking abroad. Hellerworx Inc, USA. Presented at Jackson KellyCoal Summit, Lexington, Kentucky (15 April 2011)HEPCO (2010) Annual Report year ending March 2010. Available from:http://www.hepco.co.jp/corporate/ir/ir_lib/pdf/annual2010.pdf (Mar 2010)Hjalmarsson A-K (1992) Interactions in emissions control for coal-fired plants. IEACR/47, London,UK, IEA Coal Research, 81 pp (Mar 1992)Hunosa (2011) Available from: www.hunosa.esICC (2009) Coal: a reliable and competitive source of energy. Indian Chamber of Commerce, 2ndIndian Coal Summit, 5 October 2009. Available from: http://www.indianchamber.org/pub_forms/25.pdfICR (2010) Market shift continues: more coal flows east. McCloskey Coal Report, IHS Global Ltd;231; 2 (19 Mar 2010)IEA (2002) Germany 2002 Review. Energy Policies of IEA Countries. IEA/OECD, Paris, France;141pp (2002)IEA (2003) Japan 2003 Review - Energy policies of IEA countries. IEA/OECD, Paris, France, 169pp(2003)IEA (2006) Republic of Korea 2006 Review. Energy Policies of IEA Countries, IEA/OECD, ParisFrance. 164pp (2006)IEA (2007) Fossil fuel-fired power generation. IEA/OECD, Paris, France, 168 pp (2007)IEA (2010a) IEA Prices and Taxes, 4th Quarter 2010. IEA/OECD, Paris, France (2010)IEA (2010b) Online statistical service. IEA/OECD, Paris, France (2010)IEA (2011) Online Statistical service. IEA/OECD, Paris, France (2011)IEA CCC (2010) CoalPower Database, IEA Clean Coal Centre, London, UK (2010)IEA CI (2010) Coal Information 2010. IEA/OECD, Paris, France; vp (2010)
57Impacts of seaborne trade on coal importing counries – Pacific market
IEA CI (2011) Coal Information 2011. IEA/OECD, Paris, France; vp (2011)IEA ICT (1997) International coal trade, the evolution of a global market. IEA/OECD, Paris,France. 210pp (1997)IEA P&T (2010) Prices and Taxes, IEA/OECD, Paris, France (2010)IR (2010) Freight rates per tonne. Available at:http://www.indianrailways.gov.in/railwayboard/uploads/directorate/traffic_comm/FREIGHT_RATE-2K10/FreightTable_2010.pdfIkeda M, Makino H, Morinaga H, Higashiyama K, Kozai Y (2003) Emissions characteristics ofNOx and unburned carbon in fly ash during combustion of blends of bituminous/sub-bituminouscoals. Fuel, 82; 1851-1857 (13 Jun 2003)IWS (2010) Waterborne Commerce of the United States - Part 5 National Summaries. Institute ofWater Resources and the US Army Corp of Engineers; 98pp (12 Nov 2010)Jha N C (2011) Meeting of the Indo-US Coal Working Group. New Delhi, India, 24 March 2011.Available from: http://www.coal.nic.in/India’s%20coal%20industry%20&%20CIL.pdfJohnson S A, Helble J J, Srinivasachar S (1994) Evaluation differences in slagging behavior ofsimilar coals. In: Engineering Foundation conference on coal-blending and switching of low-sulfurwestern coals, Snowbird, UT, USA, 26 Sep - 1 Oct 1993. Bryers R W, Harding N S (eds) New York,NY, USA, American Society of Mechanical Engineers, pp 265-279 (1994)Korytnyi E, Chudnovsky B, Perelman,M, Saveliev R, Talanker A, Bar-ziv E (2008) Sub-bituminous coals fired in boiler designed for bituminous coals, American Society of MechanicalEngineers, Power Division (Publication) PWR 2008, pp 31-36 (24 Jul 2008)Keeth R J, Baker D L, Tracy P E, Ogden G E, Ireland P A (1991) Economic evaluation of fluegas desulfurization systems. Volume 1. EPRI-GS-7193s, Pleasant Hill, CA, USA, EPRI DistributionCenter, vp (1991)Kepco (2011) Korean Electric Power Company. Available at:http://cyber.kepco.co.kr/kepco_new/common/newFileDownload.jsp?path=service&file_in=20110530103354&file_out=11%20%BC%D3%C7%A5%C1%F6_%B8%F1%C2%F7_%C3%D6%C1%BE%BA%D0.pdf (2011)Kim J (2007) Coal demand outlook in Korea. Technical Research Institute, KOCOAL. Available at:http://www.egcfe.ewg.apec.org/publications/proceedings/CFE/Xian_2007/4-3_Kim.pdf (15 Oct 2007)Marcy J C, Burger R R (1994) Unique blending practices utilized in Foster Wheeler boilers to burnOklahoma highsulfur bituminous and Wyoming Powder River Basin lowsulfur subbituminous coals.In: Engineering Foundation conference on coal-blending and switching of low-sulfur western coals,Snowbird, UT, USA, 26 Sep - 1 Oct 1993. Bryers R W, Harding N S (eds) New York, NY, USA,American Society of Mechanical Engineers, pp 231-242 (1994)McComas M, Morris C (1995) Fuel switch meets Clean Air Act and reduces power cost 17 percent.In: Proceedings of the American power conference, Chicago, IL, USA, 18-20 Apr 1995. Chicago, IL,USA, Illinois Institute of Technology, vol 57-II, pp 1627-1632 (1995)McIlmoil R, Hansen E (2010) The Decline of Central Appalachian Coal and the Need for EconomicDiversification. Downstream Strategies, Morgantown, WV, USA. Available from:http://www.downstreamstrategies.com/Documents/reports_publication/DownstreamStrategies-DeclineOfCentralAppalachianCoal-FINAL-1-19-10.pdf 38 pp (19 Jan 2010)MCIS (2012)McCloskey Coal Information Services. Available at: http://cr.mccloskeycoal.com (2012)Meehan S W, Ballinger R A, Mehta A K (1995) Blending Powder River Basin coals to meet CleanAir Compliance requirements. In: Proceedings, effects of coal quality on power plants: fourthinternational conference, Charleston, SC, USA, 17-19 Aug 1994. Harding N S, Mehta A K (eds)EPRI-TR-104982, Pleasant Hill, CA, USA, EPRI Distribution Center, pp 1.1-1.18 (Mar 1995)METI (2008) Japan and Indonesia cooperate in a project to upgrade low-rank coal. METI (Ministryof energy, trade and Industry, Japan. Available at:http://www.meti.go.jp/english/press/data/nBackIssue20081203_01.html (3 Dec 2008)METI (2009) Ministry of Economy, Trade and Industry, 2009, Results of the 2nd Japan-Vietnamcoal and mineral resources policy dialogue: Tokyo, Japan, Ministry of Economy, Trade and Industrypress release, January 16. Available at: http://www.meti.go.jp/english/press/data/20090116_01.html(2009)
Mills S J (2007) Prospects for coal and clean coal technologies in India. CCC/129, IEA Clean CoalCentre, London, UK, 73 pp (Dec 2007)Minaghan D (2007) Stakhanov to the Rescue? Russian Coal and the troubled emergence of aRussian energy strategy. Available from: www.da.mod.uk/colleges/arag/document-listings/russian/07(34)AM.pdf/ 29pp (Nov 2007)Minchener A (2004) Coal in China, CCC/87, London, UK, IEA Clean Coal Centre, 59 pp (Jul2004)MoC (2010) Annual Report 2009-2010. Ministry of Coal, Government of India. Available from:http://www.coal.nic.in/annrepmain.htm, 149 pp (2010)MPS (2011) Reliance Power to make major investment in Indonesia. Modern Power Systems,Sidcup, UK. Available from: http://www.modernpowersystems.com/story.asp?storyCode=2058759(28 Jan 2011)Nalbandian H (2007) European legislation (revised LCPD and EU ETS). CCC/121, London, UK,IEA Clean Coal Centre, 68 pp (Mar 2007)NETL(2007) 2007 Power Plant Database: Excel Database Pivot Table. National Energy TechnologyLaboratory. Available at: http://www.netl.doe.gov/energy-analyses/pubs/database/NEDO (2011) Personal communication - Mr Shunichi Yanai, NEDO (New Energy and IndustrialTechnology Development Organization), Kawasaki City, Japan (2011Netpas (2011) Netpas Distance software. Available from: www.netpas.com (2011)NYtimes (2011) A green solution, or the dark side to cleaner coal?. Available from:http://www.nytimes.com/2011/06/15/business/energy-environment/15iht-sreCHINA15.html?_r=1&pagewanted=2 (14 Jun 2011)O’Connell J (2010) India: Changing the world coal market. Available at:http://www.platts.com/IM.Platts.Content%5Caboutplatts%5Cmediacenter%5Cindiacoalinsight.pdf,International Coal Report, p 20-22 (Nov 2010)Pandey G K, Tyagi S K (2006) Management of thermal power plants in India, Better Air Quality inAsia, BAQ2006,Yogykarta, Indonesia, 13-15 December (2006)Patel S (2011) Spain: a renewable kingdom. Power. Available at:http://www.powermag.com/gas/Spain-A-Renewable-Kingdom_3722_p4.html (1 Jun 2011)PEI (2009) Chinese to add 358 000 MW of FGD by 2010. Available from: http://www.power-eng.com/articles/2009/08/chinese-to-add-358-000-mw-of-fgd-by-2020.html, Power EngineeringInternational (25 Aug 2009)Pohl J, McDonald B, Breen B (1989) Predicting the emissions from blends of fuels. In:Proceedings, Reducing power plant emissions by controlling coal quality, Bethesda, MD, USA,27-28 Oct 1987. EPRI-GS-6281, Palo Alto, CA, USA, Electric Power Research Institute, pp13.1-13.14 (Oct 1989)POR (2011) Port statistics. Available at: http://www.portofrotterdam.com/en/Port/port-statistics/Pages/default.aspx, 15pp (2010)Poyry (2010) The Industrial Emissions Directive. Briefing Note from Poyry Energy Consulting.Available at:http://www.ilexenergy.com/pages/documents/reports/electricity/IED_Briefing_Note_v1_0.pdf, 4 pp(Jul 2010)Prabha (2011) Coal shortage may hit India Power production. Available from:http://www.biharprabha.com/2011/04/coal-shortage-may-hurt-india-power-production/ (23 Apr 2011)Prakash C (2003) Consumer’s views on coal supplies, Coal and Electricity in India. At:http://www.iea.org/Textbase/work/2003/india/SESS52.pdf (2003)PSI Energy (1996) Guidelines for evaluating the impact of Powder River Basin (PRB) coal blendson power plant performance and emissions. EPRI-TR-106340, Pleasant Hill, CA, USA, EPRIDistribution Center, 355 pp (Mar 1996)Rabanal N G (2009) Coal restructuring in Spain: continuity and uncertainty? Energy Policy,Elsevier, 4373-4378 (21 Jun 2009)Rademaekers K, Eichler L, Meindert L, Morsy S, Stoicescu D, Volkerink B (2008) AnEvaluation of the needs for state aid to the coal industry post 2010. Framework Contract TREN/CC-03-2005 Lot 2: Economic Assistance Activities; Submitted to the European Commission by Ecorys,
59Impacts of seaborne trade on coal importing counries – Pacific market
Nederlands BV; 190 pp (9 Dec 2008)Rens D W, Goblirsch G M, Kermes R J (1993) Burning PRB coals in bituminous coal boilers. In:Proceedings: Lowrank coal upgrade technology workshop, St Louis, MO, USA, 2-3 Dec 1992. EPRI-TR-102700, Pleasant Hill, CA, USA, EPRI Distribution Center, pp 11.1-11.30 (Jul 1993)Reuters (2007) Constellation says started enviro upgrades on coal plan. Available at:http://www.reuters.com/article/2007/06/20/constellation-plant-upgrade-idUSN2028389320070620(20 Jun 2007)Reuters (2010) FACTBOX-Colombia coal production and exports. Available at:http://www.reuters.com/article/idUKN1745558020100617Ricketts B (2006) Focus on clean coal, Working paper, Focus on Asia Pacific, IEA/OECD, Paris,France (Nov 2006)Rupinskas R L, Rembold D F (1995) Sibley station lowsulfur coal conversion program. In:Proceedings, Effects of coal quality on power plants: fourth international conference, Charleston,SC, USA, 17-19 Aug 1994. Harding N S, Mehta A K (eds) EPRI-TR-104982, Pleasant Hill, CA,USA, EPRI Distribution Center, pp 1.41-1.57 (Mar 1995)Scott D S (1997) Improving existing power stations to comply with emerging emissions standards.IEACR/92, London, UK, IEA Clean Coal Centre, 76 pp (Mar 97)Sharples B (2010) Xstrata CEO Freyberg Says Demand for Steelmaking, Energy Coal Is `Robust’.Available at: http://www.bloomberg.com/news/2010-08-16/xstrata-ceo-freyberg-says-demand-for-steelmaking-energy-coal-is-robust-.html (16 Aug 2010)Singh R (2010) Lack of rail wagons hits east India coal supply. Reuter. Available at:http://in.reuters.com/article/2010/07/09/coal-port-india-idINSGE6680GR20100709 (9 Jul 2010)Sjostrom S (2012) Mercury Control Options to meet MATS. Power Engineering, PennwellPublishing. Available at: http://www.power-eng.com/articles/print/volume-116/issue-1/features/mercury-control-options-to-meet-mats.html (1 Jan 2012)Sondreal E A (1993) Clean utilization of low-rank coals for low-cost power generation. In:Conference proceedings, clean and efficient use of coal: the new era for low-rank coal, Budapest,Hungary, 24-27 Feb 1992. Paris, France, OECD/IEA, pp 143-185 (1993)SP (2011) MP to import 8 lakh tonne of coal to run power plants. Shipping platform. Available from:http://www.theshippingnews.info/2011/05/mp-to-import-8-lakh-tonne-of-coal-to.html (17 May 2011)Smouse S (2009) Pittsburgh, PA, USA, U.S. Department of Energy, National Energy TechnologyLaboratory, Personal communication (7 May 2009)Spiegel (2007) End of an industrial era: Germany to close its coal mines. Available from:http://www.spiegel.de/international/0,1518,463172,00.html (01/30/2007)SSY (2008) Dry Bulk Market, Monthly Shipping Review (15 January 2008)SSY (2011) SSY Fleet Database. Simpson Spence and Young Consultancy and Research Ltd, LloydsChambers, London, UK, (Feb-Mar 2011)Steelguru (2011) NTPC loses 3 blocks due to failure in development. Available at:http://www.steelguru.com/search/index.html#210345 (19 Jun 2011)Tait N (2011) Opposition to Spanish coal subsidies grows. FT, Available from:http://www.ft.com/cms/s/0/2d8c92ae-3908-11e0-b0f6-00144feabdc0,s01=1.html#axzz1TrSPAvba(15 Feb 2011)TEE (2011) Reliance and Tata seek govt help on imported coal price. The Economic Times.Available from: http://economictimes.indiatimes.com/news/economy/foreign-trade/reliance-and-tata-seek-govt-help- on-imported-coal-price/articleshow/8952990.cms (22 Jun 2011)Teicher L (2008) Evolving coal qualities. Paper presented at: 28th Coaltrans Conference, 19-21October 2008, Prague Congress Centre, Prague, Czech Republic (2008)TOI (2010) Coal importers Bhatia, Adani get the boot. Times of India. Available from:http://articles.timesofindia.indiatimes.com/2010-12-20/nagpur/28261447_1_mahagenco-adani-coal(20 Dec 2010)Tillman D A, Duong D, Miller B (2009) Chlorine in solid fuels in pulverized fuel boilers - sources,forms, reactions, and consequences: a literature review. Energy & Fuels, v23; 3379-3391 (10 Feb2009)Tsadari V (2006) Better regulation and the need for consistency of policies. In: Proceedings of the
60 IEA CLEAN COAL CENTRE
References
IPG ’06 conference: implementing EC emission directives, Leipzig, Germany, 15-16 Nov 2006,pp 15-19 (Nov 2006)Uchiyama M (2009) The outlook for thermal coal consumption in Japan. Presented at Coaltrans2009, 25-27 October 2009, Queen Elizabeth II Centre, London UK; 15pp (Oct 2009)UKCF (2010) Coal Forum's Paper for the Annual Coal Industry meeting on 9 December 2010.docx.Available at: http://www.vmine.net/coalforum/doc/coal-forum-annual-2010.PDFUK Coal (various) Annual reports 2011, 2010, 2009, 2008, 2007. Available at:http://www.ukcoal.com/investors/reports-and-presentationsUNESA (2010) Personal communication - Mr Angel Vivar, UNESA (Asociacion Española de laIndustria Electrica), Spain (2010)USGS 2001 Mercury in U.S. Coal—Abundance, Distribution, and Modes of Occurrence. USGS FactSheet FS–095–01, US Department of the Interior, US Geological Survey. Available at:http://pubs.usgs.gov/fs/fs095-01/fs095-01.pdf (Sep 2001)USGS (2008) 2006 Mineral Yearbook - Japan. Available at:http://minerals.usgs.gov/minerals/pubs/country/2006/myb3-2006-ja.pdf; 29pp (Mar 2008)Vachal K, Hough J, Griffin G (2005) U.S. Waterways - A Barge Sector Industrial OrganizationAnalysis, 52pp (Mar 15 2005)VdK (2010) Annual report 2010. Verein der Kohlenimporteur (VdK), Hamburg, Germany; ISSN1612-5371; 130pp (Jul 2010)Venkataraman V K (2006) India profile and energy issues in the Indian mining industry, Economicbarriers and solutions to energy issues in mining, MEMS 2006 15th annual conference, Miningenergy outlook, Colorado, USA, 19-21 April (2006)Wadke R (2008) Reliance Power acquiring coal mine in Indonesia. The Hindu, Chennai, India.Available from: http://www.thehindubusinessline.in/2008/05/02/stories/2008050251400300.htm(2 May 2008)Walker S (2001) Experience from coal industry restructuring. CCC/48, London, UK, IEA CleanCoal Centre, 73 pp (Jul 2001)Wang Y, Zeng S (2008) Environment protection regulations and practices on emission reduction ofcoal-fired power plants in China. Presented at Cleaner Coal Workshop on Solutions to Asia’sGrowing energy and Environmental Challenges, Ha Long City, Vietnam (19-21 August 2008)World Coal (2007) The changing face of the UK. World Coal, February 2007, v16 (2); p 9 (Feb2007)WSJ (2011) Coal India plans investment in railway lines, wagons. Wall Street Journal, 8 March2011. Available at:http://online.wsj.com/article/SB10001424052748704623404576187633547984332.htmlWTO (2007) Trade Policy Review. Available at: www.wto.org/english/tratop_e/tpr_e/s204-04_e.doc(2007)Zakis E, Krameric B A, Rupinskas R L (1996) Experience modifying power plant systems forswitching to Powder River Basin (PRB) coal. In: Power-Gen international ‘96, Orlando, FL, USA,46 Dec 1996. Houston, TX, USA, PennWell Conferences and Exhibitions, Book 2 (vols 4-6),pp 361-377 (1996)
61Impacts of seaborne trade on coal importing counries – Pacific market