20
Impacts of Single-Stream Recycling: The Philadelphia Story Northeast Recycling Council 2015 Spring Conference Phil Bresee Director of Recycling City of Philadelphia
Impacts of Single-Stream Recycling: The Philadelphia Story
Northeast Recycling Council 2015 Spring Conference
Phil Bresee
Director of Recycling City of Philadelphia
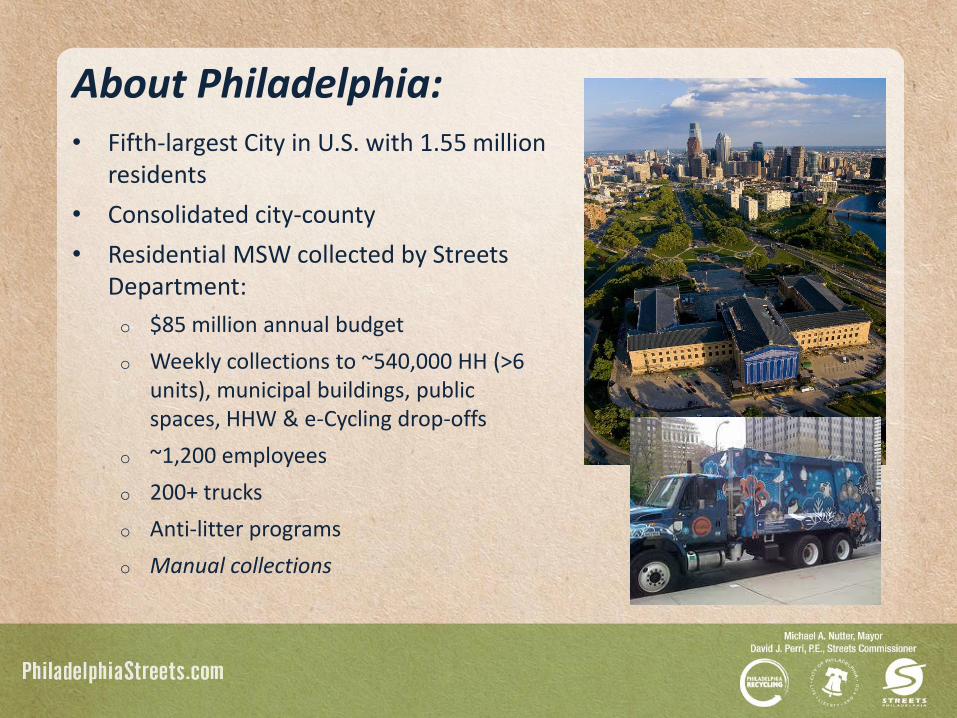
About Philadelphia:
• Fifth-largest City in U.S. with 1.55 million residents
• Consolidated city-county
• Residential MSW collected by Streets Department:
o $85 million annual budget
o Weekly collections to ~540,000 HH (>6 units), municipal buildings, public spaces, HHW & e-Cycling drop-offs
o ~1,200 employees
o 200+ trucks
o Anti-litter programs
o Manual collections
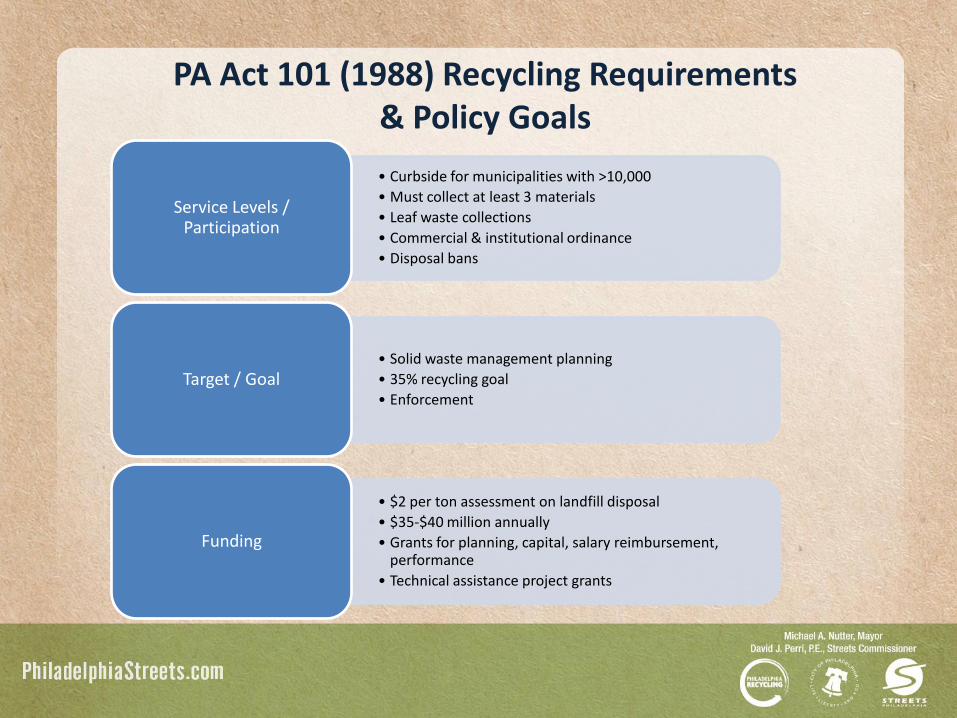
PA Act 101 (1988) Recycling Requirements & Policy Goals
• Curbside for municipalities with >10,000
• Must collect at least 3 materials
• Leaf waste collections
• Commercial & institutional ordinance
• Disposal bans
Service Levels / Participation
• Solid waste management planning
• 35% recycling goal
• Enforcement Target / Goal
• $2 per ton assessment on landfill disposal
• $35-$40 million annually
• Grants for planning, capital, salary reimbursement, performance
• Technical assistance project grants
Funding

Philadelphia Curbside Recycling 1990’s-2000’s
• Program much-maligned…fear of tickets biggest driver of participation
• City fiscal crises • PA DEP Consent
Decree • Recycling chief
revolving door • Lack of political
support
34,000
36,000
38,000
40,000
42,000
44,000
46,000
2000 2001 2002 2003 2004 2005
Philadelphia Curbside Recycling FY 2000 - FY 2005
Tons Per Year

2006: Single-stream phases-in…
• City’s MRF vendor retrofitted in 2006
• Initial Recyclebank pilots were single-stream
• Created opportunity to streamline operations, as well as promote “new” program

2008: Easier still…weekly recycling

2008: By bus, trolley and train…

2010: Website Enhancements & New Materials

2010: Mural Arts Program branding adds
visual excitement…
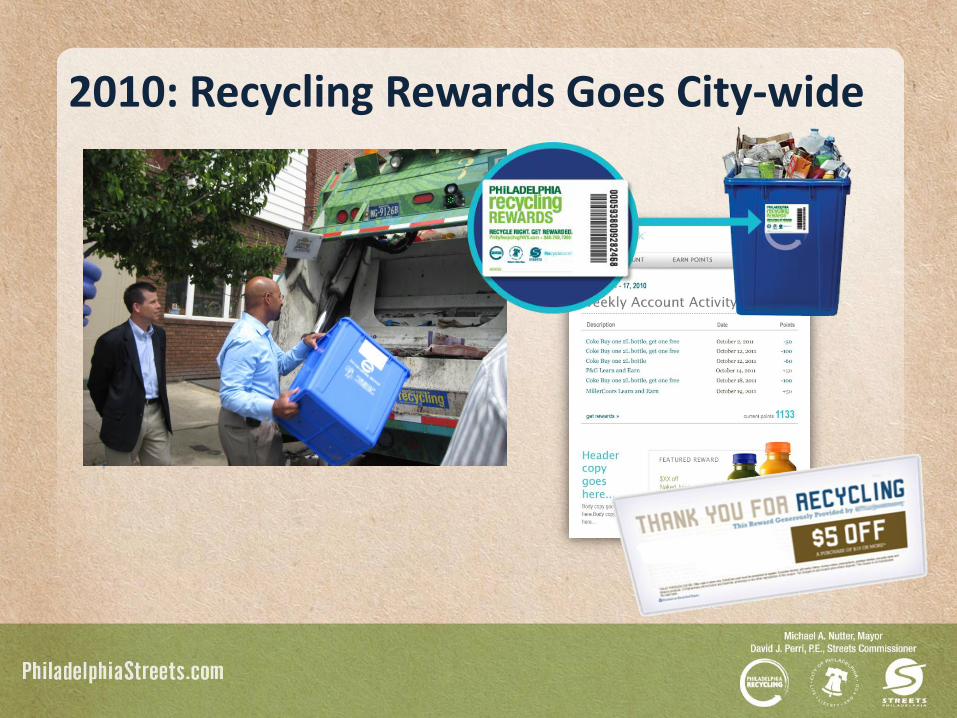
2010: Recycling Rewards Goes City-wide

2012: Cartons Added

Philadelphia Curbside Recycling FY 2005 – FY 2014
-
20,000
40,000
60,000
80,000
100,000
120,000
140,000
FY 2005 FY 2006 FY 2007 FY 2008 FY 2009 FY 2010 FY 2011 FY 2012 FY 2013 FY 2014
Ton
s p
er-
year
Recyclebank Pilot
Plastics & OCC
Single-stream phase-in
City-wide single-stream
Weekly pickup
Mayor Nutter’s election
#3-7
Recyclebank goes city-wide
Cartons added

Philly’s Success Phantastic!
• Curbside recycling tonnages up ~155% since FY 2008
o Per HH yield of ~465 lbs./yr.
o Diversion rate through single-stream = 21%
• Residential disposal tonnages down 31% from peak year (FY 2004)
• Total residential MSW generation down 19% from FY 2004
• Fiscal benefits between $9.7 and $15 million per year FY 2008 to FY 2014
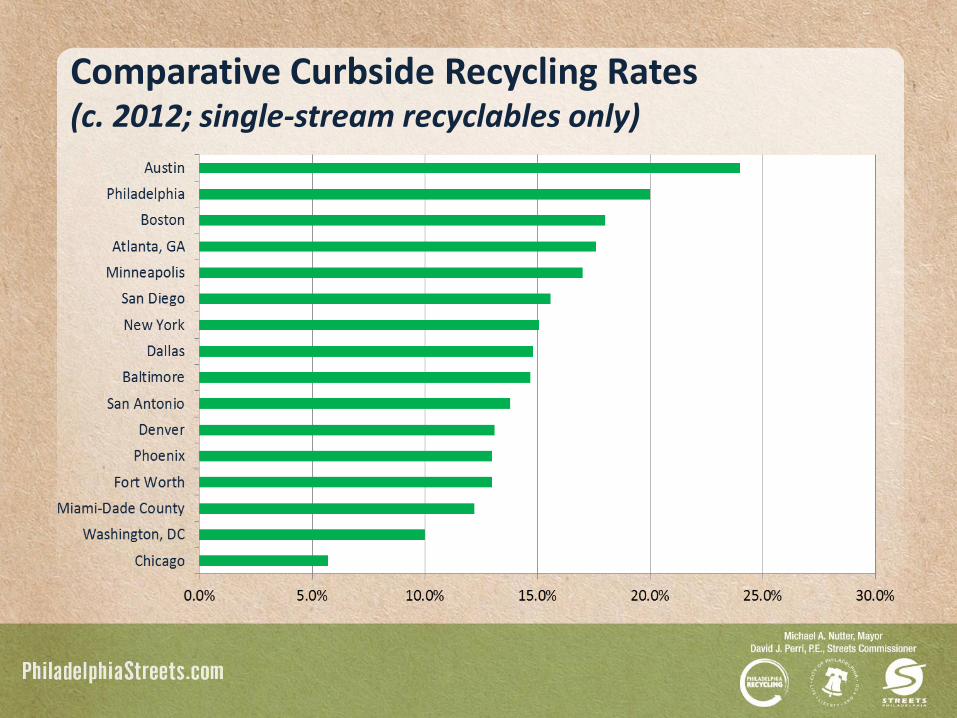
Comparative Curbside Recycling Rates (c. 2012; single-stream recyclables only)

Philadelphia’s Challenges
Changing MSW Stream… Low Hanging Fruit Picked…
Non-Program
Recyclable 416,582
87%
Remaining Single-Stream
Recyclables 63,905
13%
Residential MSW by Major Categories
Material 2000 2010 Difference Paper & cardboard 29.0% 14.7% -14.3%
Plastics 13.2% 10.0% -3.2%
Glass 4.0% 1.9% -2.1%
Metals 6.6% 3.5% -3.1%
Organics 29.1% 27.2% -1.9%
C&D 12.9% 24.1% 11.2%
Other 5.2% 18.6% 13.4%
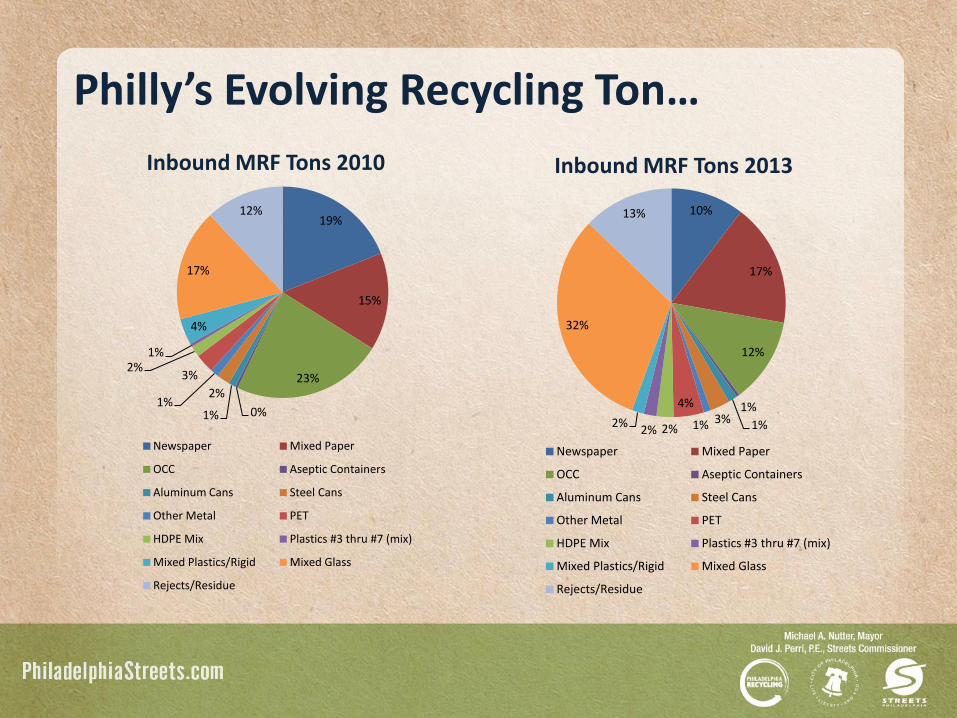
Philly’s Evolving Recycling Ton…
19%
15%
23%
0% 1%
2% 1%
3% 2%
1%
4%
17%
12%
Inbound MRF Tons 2010
Newspaper Mixed Paper
OCC Aseptic Containers
Aluminum Cans Steel Cans
Other Metal PET
HDPE Mix Plastics #3 thru #7 (mix)
Mixed Plastics/Rigid Mixed Glass
Rejects/Residue
10%
17%
12%
1%
1% 3% 1%
4%
2% 2% 2%
32%
13%
Inbound MRF Tons 2013
Newspaper Mixed Paper
OCC Aseptic Containers
Aluminum Cans Steel Cans
Other Metal PET
HDPE Mix Plastics #3 thru #7 (mix)
Mixed Plastics/Rigid Mixed Glass
Rejects/Residue

Changing Outreach Focus • Earlier campaigns &
branding focused on encouraging recycling participation
• Emphasis on recyclables quality now key message across all platforms & partnerships – Recyclebank – Keep Philadelphia
Beautiful – Recyclebycity.com – Civic associations
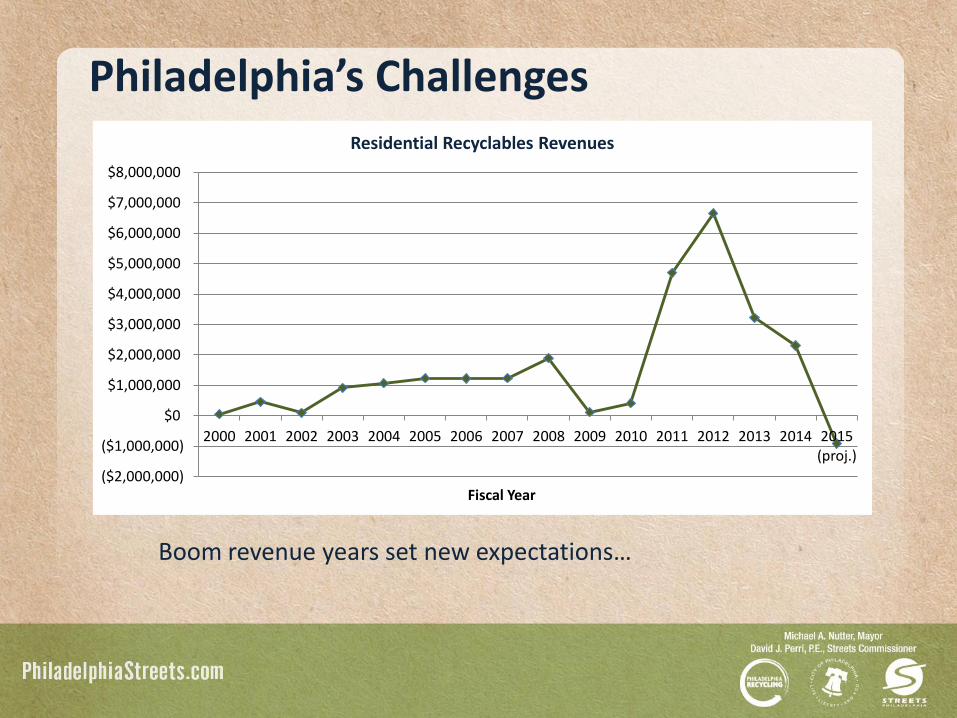
Philadelphia’s Challenges
Boom revenue years set new expectations…
($2,000,000)
($1,000,000)
$0
$1,000,000
$2,000,000
$3,000,000
$4,000,000
$5,000,000
$6,000,000
$7,000,000
$8,000,000
2000 2001 2002 2003 2004 2005 2006 2007 2008 2009 2010 2011 2012 2013 2014 2015 (proj.)
Fiscal Year
Residential Recyclables Revenues

Philadelphia’s Challenges
• Single-stream capture rate = ~65%
• Could ROI be achieved on recycling infrastructure (carts, trucks) investment?
• Logistical and operational challenges
• Politics (new mayor 2015)
Photo courtesy of Peter Tobia
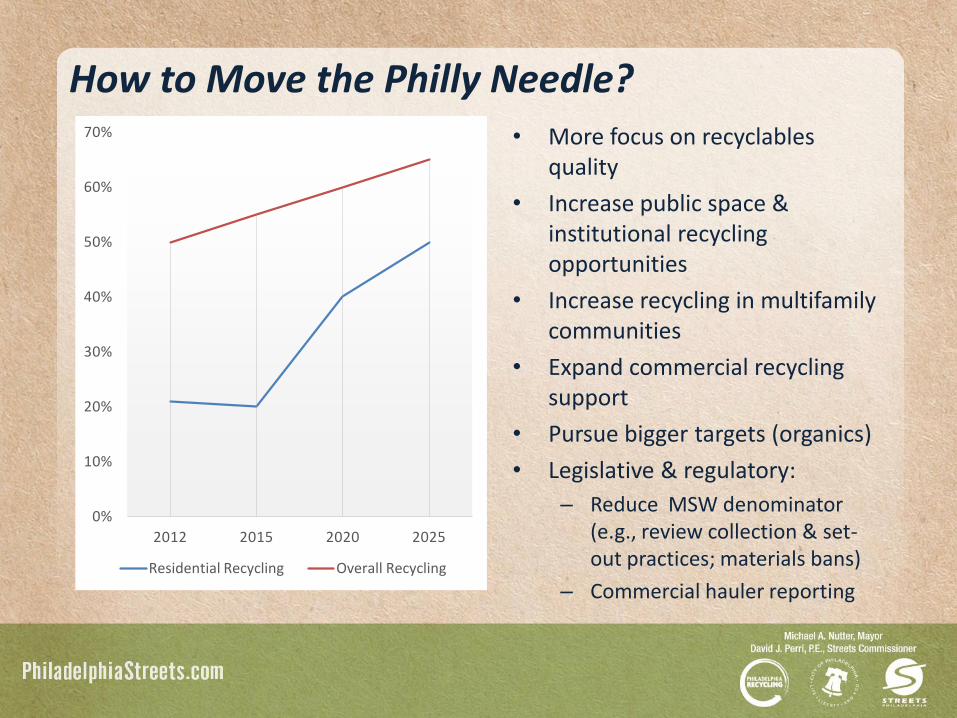
How to Move the Philly Needle?
0%
10%
20%
30%
40%
50%
60%
70%
2012 2015 2020 2025
Residential Recycling Overall Recycling
• More focus on recyclables quality
• Increase public space & institutional recycling opportunities
• Increase recycling in multifamily communities
• Expand commercial recycling support
• Pursue bigger targets (organics)
• Legislative & regulatory:
– Reduce MSW denominator (e.g., review collection & set-out practices; materials bans)
– Commercial hauler reporting


