90
IMPACTS OF THE NATURAL GAS AND OIL INDUSTRY ON THE US ECONOMY IN 2015

IMPACTS OF THE
NATURAL GAS AND OIL INDUSTRYON THE US ECONOMY IN 2015


www.pwc.com/us/nes
Impacts of the Oil and Natural Gas Industry on the US Economy in 2015
Prepared for
American Petroleum Institute
July 2017

Impacts of the Oil and Natural Gas Industry on the US Economy
Impacts of the Oil and Natural Gas Industry on
the US Economy in 2015
Table of Contents
Executive Summary E-1
I. Introduction 1
II. Industry Definition 3
III. Total Economic Impact 6
IV. Detail by Component of Economic Impact: Direct, Indirect, and Induced Impacts 11
V. Wages, Capital Spending, and Dividends from the Oil and Natural Gas Industry 26
Appendix A: Detailed State-by-State Operational Impact Results 27
Appendix B: Data Sources and Methodology 79

Impacts of the Oil and Natural Gas Industry on the US Economy
E-1
Impacts of the Oil and Natural Gas Industry on the US Economy in 2015
Executive Summary
The American Petroleum Institute engaged PwC to quantify the economic impacts of the US oil and natural gas industry in terms of employment, labor income, and value added.1 This report provides PwC’s economic impact estimates for 2015, the most recent year for which a consistent set of national and state-level data by industry are currently available.
The report’s findings show that the oil and natural gas industry has a widespread economic impact throughout all sectors of the economy and across all 50 states and the District of Columbia. These impacts result directly from the employment and production within the oil and natural gas industry, indirectly through the industry’s purchases of intermediate and capital goods from a variety of other US industries, by the personal purchases of employees and business owners both within the oil and natural gas industry and out of the additional income in the supply chain to the oil and natural gas industry, and from spending by shareholders out of the dividends received from oil and natural gas companies.
In describing these economic impacts, this report considers three separate channels -- the direct impact, the indirect impact, and the induced impact -- that in aggregate provide a measure of the total economic impact of the US oil and natural gas industry.
Direct impact is measured as the jobs, labor income, and value added within the oil and natural gas industry.
Indirect impact is measured as the jobs, labor income, and value added occurring throughout the supply chain of the oil and natural gas industry.
Induced impact is measured as the jobs, labor income, and value added resulting from household spending of labor and proprietor’s income earned either directly or indirectly from the oil and natural gas industry’s spending.
This report quantifies the industry’s operational impact (due to purchases of intermediate inputs and payments of labor compensation and dividends) and capital investment impact (due to its investment in new structures and equipment) at the national level. Separate detail is also provided on the industry’s operational impact at the state level.2 These economic impacts represent all of the backward linkages of the US oil and natural gas industry to its suppliers. They do not capture any forward linkages (i.e., the economic impact on production in sectors that use oil and natural gas as an input).
The US oil and natural gas industry’s total employment impact to the national economy in 2015, combining the operational and capital investment impacts, amounted to 10.3 million full-time and part-time jobs and accounted for 5.6 percent of total US employment (see Table E-1,
1 Value added refers to the additional value created at a particular stage of production. It is a measure of the overall importance of an industry and represents the industry’s portion of US gross domestic product (“GDP”). Value added consists of: employee compensation, proprietors' income, income to capital owners from property, and indirect business taxes (including excise taxes, property taxes, fees, licenses, and sales taxes paid by businesses). 2 The industry’s capital investment impact is not quantified at the state level due to the non-availability of capital expenditure data at the state level.

Impacts of the Oil and Natural Gas Industry on the US Economy
E-2
below). At the national level, each direct job in the oil and natural gas industry supported an additional 2.7 jobs elsewhere in the US economy in 2015. Counting direct, indirect, and induced impacts, the industry’s total impact on labor income (including proprietors’ income) was $714 billion, or 6.7 percent of national labor income in 2015. The industry’s total impact on US GDP was $1.3 trillion, accounting for 7.6 percent of the national total in 2015.
Table E-1.− Total Operational and Capital Investment Impacts of the Oil and Natural Gas Industry on the US Economy, 2015
Direct Impacts
Indirect and Induced Impacts
Total Impacts
Percent of US
Total Operational
Impacts
Capital Investment
Impacts
Employment* 2,794,900 5,277,700 2,268,000 10,340,700 5.6%
Labor Income ($billions)**
$289.6 $290.6 $134.1 $714.2 6.7%
Value Added ($billions) $602.6 $495.3 $219.9 $1,317.9 7.6%
Source: PwC calculations using the IMPLAN modeling system (2015 database). Note: Details may not add to totals due to rounding * Employment is defined as the number of payroll and self-employed jobs, including part time jobs. ** Labor income is defined as wages and salaries and benefits as well as proprietors' income.
The economic impact of the oil and natural gas industry reaches all 50 states and the District of Columbia. The total number of jobs directly or indirectly attributable to the oil and natural gas industry’s operations (i.e., not counting any capital investment impacts) ranged from a low of 11,800 (in District of Columbia) to nearly 2.0 million (in Texas) in 2015. The top 15 states, in terms of the total number of jobs directly or indirectly attributable to the oil and natural gas industry’s operations in 2015 were Texas, California, Oklahoma, Pennsylvania, Louisiana, Florida, Ohio, New York, Illinois, Colorado, Michigan, Georgia, New Jersey, North Carolina, and Kansas. Combined these states account for 83 percent of the total jobs attributable to the US oil and natural gas industry’s operations (see Table E-2a, below).

Impacts of the Oil and Natural Gas Industry on the US Economy
E-3
Table E-2a.− Total Impacts of the Oil and Natural Gas Industry’s Operations in 2015
Top 15 States, Ranked by Total Employment Impact
State
Employment* Labor Income** Value Added
Amount Percent of State
Total ($ Million)
Percent of State
Total ($ Million)
Percent of State
Total
Texas 1,985,200 12.2% $180,039 18.1% $326,375 20.2%
California 730,600 3.2% $56,628 3.8% $119,631 4.9%
Oklahoma 379,100 16.6% $34,634 28.1% $51,712 27.3%
Pennsylvania 322,600 4.3% $22,994 5.1% $44,456 6.3%
Louisiana 291,200 11.0% $23,359 16.8% $50,730 20.7%
Florida 266,800 2.4% $11,916 2.2% $22,063 2.5%
Ohio 262,800 3.8% $14,743 4.0% $37,938 6.1%
New York 258,500 2.2% $21,306 2.4% $35,796 2.5%
Illinois 234,600 3.0% $14,860 3.1% $33,347 4.3%
Colorado 232,900 6.5% $23,099 11.3% $31,382 9.7%
Michigan 159,100 2.9% $8,235 2.7% $14,597 3.0%
Georgia 142,700 2.5% $7,467 2.5% $13,653 2.7%
New Jersey 142,200 2.7% $10,130 2.8% $20,972 3.7%
North Carolina 141,500 2.5% $6,959 2.4% $13,406 2.6%
Kansas 128,700 6.8% $8,113 8.5% $12,113 8.0% Source: PwC calculations using the IMPLAN modeling system (2015 database). * Employment is defined as the number of payroll and self-employed jobs, including part time jobs. ** Labor income is defined as wages and salaries and benefits as well as proprietors' income.
The top 15 states in terms of the percentage of jobs directly or indirectly attributable to the oil and natural gas industry’s operations in 2015 were Oklahoma (16.6 percent), Wyoming (14.4 percent), North Dakota (13.3 percent), Texas (12.2 percent), Louisiana (11.0 percent), Alaska (9.7 percent), New Mexico (8.3 percent), West Virginia (7.8 percent), Kansas (6.8 percent), Colorado (6.5 percent), Nebraska (6.3 percent), Montana (6.0 percent), Mississippi (5.3 percent), Arkansas (4.8 percent), and Pennsylvania (4.3 percent) (see Table E-2b, below).

Impacts of the Oil and Natural Gas Industry on the US Economy
E-4
Table E-2b.− Total Impacts of the Oil and Natural Gas Industry’s Operations in 2015
Top 15 States, Ranked by Employment Share of State Total
State
Employment* Labor Income** Value Added
Amount Percent of State
Total ($ Million)
Percent of State
Total ($ Million)
Percent of State
Total
Oklahoma 379,100 16.6% $34,634 28.1% $51,712 27.3%
Wyoming 57,500 14.4% $4,350 20.8% $8,936 22.7%
North Dakota 78,700 13.3% $5,773 17.4% $11,727 21.1%
Texas 1,985,200 12.2% $180,039 18.1% $326,375 20.2%
Louisiana 291,200 11.0% $23,359 16.8% $50,730 20.7%
Alaska 45,300 9.7% $4,389 14.5% $15,783 28.9%
New Mexico 90,100 8.3% $5,244 10.0% $12,827 13.3%
West Virginia 70,900 7.8% $3,492 8.0% $8,054 10.9%
Kansas 128,700 6.8% $8,113 8.5% $12,113 8.0%
Colorado 232,900 6.5% $23,099 11.3% $31,382 9.7%
Nebraska 81,200 6.3% $6,413 9.2% $9,283 8.0%
Montana 39,500 6.0% $2,144 7.5% $4,861 10.5%
Mississippi 81,600 5.3% $4,233 6.4% $7,819 7.2%
Arkansas 76,000 4.8% $3,363 4.6% $8,137 6.5%
Pennsylvania 322,600 4.3% $22,994 5.1% $44,456 6.3% Source: PwC calculations using the IMPLAN modeling system (2015 database). * Employment is defined as the number of payroll and self-employed jobs, including part-time jobs. ** Labor income is defined as wages and salaries and benefits as well as proprietors' income.

Impacts of the Oil and Natural Gas Industry on the US Economy
1
Impacts of the Oil and Natural Gas Industry on the US Economy in 2015
I. Introduction
The American Petroleum Institute engaged PwC to quantify the economic impacts of the US oil and natural gas industry on the national and state economies in terms of employment, labor income, and value added.3 This report presents PwC’s economic impact estimates for 2015, the most recent year for which a consistent set of national and state-level data by industry is available.4
This study quantifies the industry’s operational impact (due to purchases of intermediate inputs and payments of labor compensation and dividends) and capital investment impact (due to its investment in new structures and equipment) at the national level. Separate detail is also provided on the industry’s operational impact at the state level.5 These economic impacts represent all of the backward linkages of the US oil and natural gas industry to its suppliers. They do not capture any forward linkages (i.e., the economic impact on production in sectors that use oil and natural gas as an input).
In describing the economic impact of the US oil and natural gas industry through its employment and purchases of goods and services, this report considers three separate channels -- the direct impact, the indirect impact, and the induced impact -- that in aggregate provide a measure of the total economic impact of the US oil and natural gas industry.
Direct impact is measured as the jobs, labor income, and value added within the oil and natural gas industry.
Indirect impact is measured as the jobs, labor income, and value added occurring throughout the supply chain of the oil and natural gas industry.
Induced impact is measured as the jobs, labor income, and value added resulting from household spending of labor and proprietor’s income earned either directly or indirectly from the oil and natural gas industry’s spending.
Together these effects result in the oil and natural gas industry having a widespread economic impact throughout all sectors of the US economy and in all geographic areas.
The main data source for the industry’s direct jobs, labor income and value added is the State Annual Personal Income and Employment data set published by the US Bureau of Economic Analysis (“BEA”). For the industry’s indirect and induced economic impacts at the national and
3 Value added refers to the additional value created at a particular stage of production. It is a measure of the overall importance of an industry and represents the industry's share of gross domestic product (“GDP”). Value added consists of: employee compensation, proprietors' income, income to capital owners from property, and indirect business taxes (including excise taxes, property taxes, fees, licenses, and sales taxes paid by businesses). 4 PwC prepared two prior studies for the American Petroleum Institute that quantified the economic impacts of the oil and gas industry. See PwC, The Economic Impacts of the Oil and Natural Gas Industry on the US Economy in 2009: Employment, Labor Income, and Value Added (May 2011) and The Economic Impacts of the Oil and Natural Gas Industry on the US Economy in 2011 (July 2013). 5 The industry’s capital investment impact is not quantified at the state level due to the non-availability of capital expenditure data at the state level.

Impacts of the Oil and Natural Gas Industry on the US Economy
2
state level, we have developed the estimates using customized input-output models for each state and the District of Colombia built based on the IMPLAN input-output modeling system.6
The rest of this report is organized as follows. Section II defines the oil and natural gas industry for this study. Section III presents PwC’s estimates of the industry’s total economic impacts at the national and state level in 2015. Section IV provides detail on each of the three separate components -- the direct, indirect, and induced economic impacts -- that in aggregate represent the total economic impacts of the oil and natural gas industry. Section V presents a composite measure of the industry’s total “spend” based on its direct labor income, capital expenditures, and dividend payments. Detailed state-by-state operational impact results are presented in Appendix A. A description of the data sources and methodology used for the study is provided in Appendix B.
6 The IMPLAN input-output economic modeling system is supported by the IMPLAN Group LLC. Its users include academia, federal, state, and local governments, and the private sector.

Impacts of the Oil and Natural Gas Industry on the US Economy
3
II. Industry Definition
The US oil and natural gas industry encompasses a number of activities that span separate industry classifications in government economic data. Oil and natural gas exploration and production is included in the mining sector; oil refining is part of the manufacturing sector; pipeline operations are included in the transportation sector; natural gas distribution is in the utilities sector; and oil marketing is considered part of the wholesale and retail trade sector. For this study, PwC has defined the oil and natural gas industry to include all of these activities.
Table 1, below, shows the composition of the industry as defined by PwC, followed by detailed descriptions based on the North American Industry Classification System (“NAICS”).
Table 1.− Composition of the US Oil and Natural Gas Industry
NAICS IMPLAN Sector
Description
211 20 Oil and gas extraction (including NGL extraction)
213111 37 Drilling oil and gas wells
213112 38 Support activities for oil and gas operations
2212 50 Natural gas distribution (private)
2212 526* Natural gas distribution (public)
23712 58* Oil and gas pipeline and related structures construction
32411 156 Petroleum refineries
324121 157 Asphalt paving mixture and block manufacturing
324122 158 Asphalt shingle and coating materials manufacturing
324191 159 Petroleum lubricating oil and grease manufacturing
4247 395* Petroleum and petroleum products merchant wholesalers
44711, 44719 402 Gasoline stations
45431 407* Fuel dealers
486 413 Pipeline transportation *IMPLAN sectors 520, 58, 395, and 407 include additional NAICS activities outside the US oil and natural gas industry. Modeling of the economic impacts includes only the portion of these sectors that include the oil and natural gas industry NAICS segment.
NAICS 211. Oil and gas extraction. Establishments in this subsector operate and/or develop oil and gas field properties. Such activities may include exploration for crude petroleum and natural gas; drilling, completing, and equipping wells; operating separators, emulsion breakers, desilting equipment, and field gathering lines for crude petroleum and natural gas; and all other activities in the preparation of oil and gas up to the point of shipment from the producing property. This subsector includes the production of crude petroleum, the mining and extraction of oil from oil shale and oil sands, and the production of natural gas, sulfur recovery from natural gas, and recovery of hydrocarbon liquids. Establishments in this subsector include those that operate oil and gas wells on their own account or for others on a contract or fee basis.
NAICS 213111. Drilling oil and gas wells. This subsector comprises establishments primarily engaged in drilling oil and gas wells for others on a contract or fee basis. This industry includes contractors that specialize in spudding in, drilling in, redrilling, and directional drilling. NAICS 213112. Support activities for oil and gas operations. This subsector comprises establishments primarily engaged in performing support activities on a contract or fee basis for

Impacts of the Oil and Natural Gas Industry on the US Economy
4
oil and gas operations (except site preparation and related construction activities). Services included are exploration (except geophysical surveying and mapping); excavating slush pits and cellars, well surveying; running, cutting, and pulling casings, tubes, and rods; cementing wells, shooting wells; perforating well casings; acidizing and chemically treating wells; and cleaning out, bailing, and swabbing wells. NAICS 2212. Natural gas distribution. This subsector comprises: (1) establishments primarily engaged in operating gas distribution systems (e.g., mains, meters); (2) establishments known as gas marketers that buy gas from the well and sell it to a distribution system; (3) establishments known as gas brokers or agents that arrange the sale of gas over gas distribution systems operated by others; and (4) establishments primarily engaged in transmitting and distributing gas to final consumers. Both privately and publicly owned establishments are included in this study. NAICS 23712. Oil and gas pipeline and related structures construction. This subsector comprises establishments primarily engaged in the construction of oil and gas lines, mains, refineries, and storage tanks. The work performed may include new work, reconstruction, rehabilitation, and repairs. Specialty trade contractors are included in this group if they are engaged in activities primarily related to oil and gas pipeline and related structures construction. All structures (including buildings) that are integral parts of oil and gas networks (e.g., storage tanks, pumping stations, and refineries) are included in this subsector. NAICS 32411. Petroleum refineries. This subsector comprises establishments primarily engaged in refining crude petroleum into refined petroleum. Petroleum refining involves one or more of the following activities: (1) fractionation; (2) straight distillation of crude oil; and (3) cracking. NAICS 32412. Asphalt paving, roofing, and saturated materials manufacturing. This subsector comprises establishments primarily engaged in (1) manufacturing asphalt and tar paving mixtures and blocks and roofing cements and coatings from purchased asphaltic materials and/or (2) saturating purchased mats and felts with asphalt or tar from purchased asphaltic materials. These are primarily petroleum-based products.
NAICS 324191. Petroleum lubricating oil and grease manufacturing. This subsector comprises establishments primarily engaged in blending or compounding refined petroleum to make lubricating oils and greases and/or re-refining used petroleum lubricating oils. NAICS 4247. Petroleum and petroleum products merchant wholesalers. This subsector comprises establishments with bulk liquid storage facilities primarily engaged in the merchant wholesale distribution of crude petroleum and petroleum products, including liquefied petroleum gas. NAICS 44711. Gasoline stations with convenience stores. This subsector comprises establishments engaged in retailing automotive fuels (e.g., diesel fuel, gasohol, gasoline) in combination with convenience store or food mart items. These establishments can either be in a convenience store (i.e., food mart) setting or a gasoline station setting. These establishments may also provide automotive repair services. NAICS 44719. Other gasoline stations. This subsector comprises establishments known as gasoline stations (except those with convenience stores) primarily engaged in one of the following: (1) retailing automotive fuels (e.g., diesel fuel, gasohol, gasoline) or (2) retailing these fuels in

Impacts of the Oil and Natural Gas Industry on the US Economy
5
combination with activities, such as providing repair services; selling automotive oils, replacement parts, and accessories; and/or providing food services
NAICS 45431. Fuel dealers. This subsector comprises establishments primarily engaged in retailing heating oil, liquefied petroleum (LP) gas, and other fuels via direct selling.
NAICS 486. Pipeline transportation. Establishments in this subsector use transmission pipelines to transport products, such as crude oil, natural gas, refined petroleum products, and slurry. It also includes the storage of natural gas because the storage is usually done by the pipeline establishment and because a pipeline is inherently a network in which all the nodes are interdependent.

Impacts of the Oil and Natural Gas Industry on the US Economy
6
III. Total Economic Impact
This section presents the estimated total economic impact of the US oil and natural gas industry on the national and state economies. As shown below, the oil and natural gas industry has a widespread economic impact throughout all sectors of the economy and across all 50 states and the District of Columbia. The total economic impact we have measured includes the direct impact (the jobs, labor income, and value added within the oil and natural gas industry), the indirect impact (the jobs, labor income, and value added occurring throughout the supply chain of the oil and natural gas industry), and the induced impact (the jobs, labor income, and value added resulting from household spending of income earned either directly or indirectly from the oil and natural gas industry’s spending and from dividends received from oil and natural gas companies).
A. National Impact
As shown in Table 2, below, the total economic impact of the US oil and natural gas industry in terms of jobs, labor income (including wages and salaries and benefits as well as proprietors’ income), and value added is significant.
Employment
PwC estimates that the US oil and natural gas industry’s operations directly or indirectly supported 8.1 million full-time and part-time jobs in the national economy in 2015. Further, the industry’s capital investment supported an additional 2.3 million jobs in the national economy. Combining the operational and capital investment impacts, the oil and natural gas industry’s total employment impact on the national economy amounted to 10.3 million full-time and part-time jobs in 2015, accounting for 5.6 percent of total US employment.
Labor Income
The associated labor income (including wages and salaries and benefits as well as proprietors’ income) from jobs directly or indirectly supported by the oil and natural gas industry through its operations, capital investment, and spending out of dividend payments is estimated to be $714.2 billion, or 6.7 percent of total US labor income in 2015.
Value Added
Value added refers to the additional value created at a particular stage of production. The sum of value added across all industries in a country or region is, by definition, equivalent to its Gross Domestic Product (GDP). Value added consists of: employee compensation, proprietors’ income, income to capital owners from property, and indirect business taxes (i.e., those borne by consumers rather than producers).
PwC estimates that the US oil and natural gas industry’s operations directly or indirectly generated $1.1 trillion of value added in the national economy in 2015, and its capital investment added an additional $219.9 billion of value added. Combining both operational and capital investment impacts, the industry’s total value added impact at the national level was $1.3 trillion, accounting for 7.6 percent of US GDP in 2015.

Impacts of the Oil and Natural Gas Industry on the US Economy
7
Table 2.− Total Operational and Capital Investment Impact of the Oil and Natural Gas Industry to the US Economy, 2015
Item Amount Percent of US
Total
Operational Impact Employment* 8,072,700 4.3%
Labor Income ($ billions)** $580.1 5.5%
Value Added ($ billions) $1,097.9 6.3%
Capital Investment Impact
Employment* 2,268,000 1.2%
Labor Income ($ billions)** $134.1 1.3%
Value Added ($ billions) $219.9 1.3%
Total Impacts
Employment* 10,340,700 5.6%
Labor Income ($ billions)** $714.2 6.7%
Value Added ($ billions) $1,317.9 7.6%
Source: PwC calculations using the IMPLAN modeling system (2015 database). Note: Details may not add to totals due to rounding * Employment is defined as the number of payroll and self-employed jobs, including part-time jobs. ** Labor income is defined as wages and salaries and benefits as well as proprietors' income.
B. State Impacts
The US oil and natural gas industry’s economic impact reaches all 50 states and the District of Columbia. The impact varies from state to state, depending on factors such as each state’s industry mix, wage structure, spending and saving patterns, and connections to other economies.
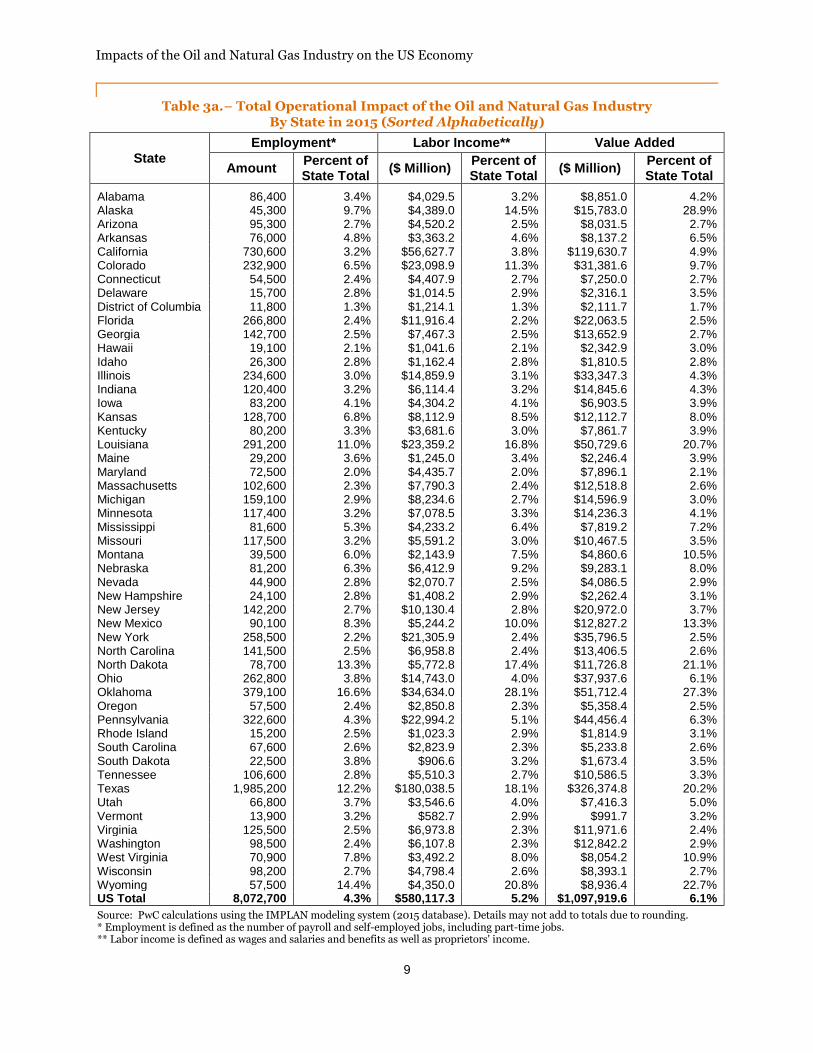
Table 3a, below, shows the oil and natural gas industry’s state-by-state total operational impact in terms of jobs, labor income (including wage and salaries and benefits as well as proprietors’ income), and value added, where the states are shown alphabetically. Table 3b, below, is the same as Table 3a, except that the states are ranked in order of the industry’s total employment impact as a percent of each state’s total employment. State-level results, as explained earlier, do not include the economic impact of the industry’s capital investment due to the non-availability of state capital expenditure data.

Impacts of the Oil and Natural Gas Industry on the US Economy
8
Employment
The total number of jobs directly or indirectly attributable to the oil and natural gas industry’s operations as a percent of each state’s total employment in 2015 ranged from 1.3 percent (District of Columbia) to 16.6 percent (Oklahoma). The oil and natural gas industry directly or indirectly supported 5.0 percent of more of the total employment in 13 states in 2015: Oklahoma (16.6 percent),Wyoming (14.4 percent), North Dakota (13.3 percent), Texas (12.2 percent), Louisiana (11.0 percent), Alaska (9.7 percent), New Mexico (8.3 percent), West Virginia (7.8 percent), Kansas (6.8 percent), Colorado (6.5 percent), Nebraska (6.3 percent), Montana (6.0 percent), and Mississippi (5.3 percent). In these 13 states, the oil and natural gas industry was, on average, directly or indirectly responsible for one out of every nine jobs.
Labor Income
As a percent of each state’s total labor income (including wages and salaries and benefits as well as proprietors’ income), the labor income from total jobs directly or indirectly supported by the oil and natural gas industry’s operations ranged from 1.3 percent (District of Columbia) to 28.1 percent (Oklahoma) in 2015. The oil and natural gas industry’s total labor income impact exceeded 5.0 percent of the state total in 14 states: Oklahoma (28.1 percent), Wyoming (20.8 percent), Texas (18.1 percent), North Dakota (17.4 percent), Louisiana (16.8 percent), Alaska (14.5 percent), Colorado (11.3 percent), New Mexico (10.0 percent), Nebraska (9.2 percent), Kansas (8.5 percent), West Virginia (8.0 percent), Montana (7.5 percent), Mississippi (6.4 percent), and Pennsylvania (5.1 percent).
Value Added
As a percent of each state’s economy, the oil and natural gas industry’s total value-added impact from its operations ranged from 1.7 percent (District of Columbia) to 28.9 percent (Alaska) in 2015. The oil and natural gas industry’s total value-added impact accounted for at least 5.0 percent of the state total in 17 states: Alaska (28.9 percent), Oklahoma (27.3 percent), Wyoming (22.7 percent), North Dakota (21.1 percent), Louisiana (20.7 percent), Texas (20.2 percent), New Mexico (13.3 percent), West Virginia (10.9 percent), Montana (10.5 percent), Colorado (9.7 percent), Nebraska (8.0 percent), Kansas (8.0 percent), Mississippi (7.2 percent), Arkansas (6.5 percent), Pennsylvania (6.3 percent), Ohio (6.1 percent), and Utah (5.0 percent).
Impacts of the Oil and Natural Gas Industry on the US Economy
9
Table 3a.− Total Operational Impact of the Oil and Natural Gas Industry By State in 2015 (Sorted Alphabetically)
State
Employment* Labor Income** Value Added
Amount Percent of State Total
($ Million) Percent of State Total
($ Million) Percent of State Total
Alabama 86,400 3.4% $4,029.5 3.2% $8,851.0 4.2% Alaska 45,300 9.7% $4,389.0 14.5% $15,783.0 28.9% Arizona 95,300 2.7% $4,520.2 2.5% $8,031.5 2.7% Arkansas 76,000 4.8% $3,363.2 4.6% $8,137.2 6.5% California 730,600 3.2% $56,627.7 3.8% $119,630.7 4.9% Colorado 232,900 6.5% $23,098.9 11.3% $31,381.6 9.7% Connecticut 54,500 2.4% $4,407.9 2.7% $7,250.0 2.7% Delaware 15,700 2.8% $1,014.5 2.9% $2,316.1 3.5% District of Columbia 11,800 1.3% $1,214.1 1.3% $2,111.7 1.7% Florida 266,800 2.4% $11,916.4 2.2% $22,063.5 2.5% Georgia 142,700 2.5% $7,467.3 2.5% $13,652.9 2.7% Hawaii 19,100 2.1% $1,041.6 2.1% $2,342.9 3.0% Idaho 26,300 2.8% $1,162.4 2.8% $1,810.5 2.8% Illinois 234,600 3.0% $14,859.9 3.1% $33,347.3 4.3% Indiana 120,400 3.2% $6,114.4 3.2% $14,845.6 4.3% Iowa 83,200 4.1% $4,304.2 4.1% $6,903.5 3.9% Kansas 128,700 6.8% $8,112.9 8.5% $12,112.7 8.0% Kentucky 80,200 3.3% $3,681.6 3.0% $7,861.7 3.9% Louisiana 291,200 11.0% $23,359.2 16.8% $50,729.6 20.7% Maine 29,200 3.6% $1,245.0 3.4% $2,246.4 3.9% Maryland 72,500 2.0% $4,435.7 2.0% $7,896.1 2.1% Massachusetts 102,600 2.3% $7,790.3 2.4% $12,518.8 2.6% Michigan 159,100 2.9% $8,234.6 2.7% $14,596.9 3.0% Minnesota 117,400 3.2% $7,078.5 3.3% $14,236.3 4.1% Mississippi 81,600 5.3% $4,233.2 6.4% $7,819.2 7.2% Missouri 117,500 3.2% $5,591.2 3.0% $10,467.5 3.5% Montana 39,500 6.0% $2,143.9 7.5% $4,860.6 10.5% Nebraska 81,200 6.3% $6,412.9 9.2% $9,283.1 8.0% Nevada 44,900 2.8% $2,070.7 2.5% $4,086.5 2.9% New Hampshire 24,100 2.8% $1,408.2 2.9% $2,262.4 3.1% New Jersey 142,200 2.7% $10,130.4 2.8% $20,972.0 3.7% New Mexico 90,100 8.3% $5,244.2 10.0% $12,827.2 13.3% New York 258,500 2.2% $21,305.9 2.4% $35,796.5 2.5% North Carolina 141,500 2.5% $6,958.8 2.4% $13,406.5 2.6% North Dakota 78,700 13.3% $5,772.8 17.4% $11,726.8 21.1% Ohio 262,800 3.8% $14,743.0 4.0% $37,937.6 6.1% Oklahoma 379,100 16.6% $34,634.0 28.1% $51,712.4 27.3% Oregon 57,500 2.4% $2,850.8 2.3% $5,358.4 2.5% Pennsylvania 322,600 4.3% $22,994.2 5.1% $44,456.4 6.3% Rhode Island 15,200 2.5% $1,023.3 2.9% $1,814.9 3.1% South Carolina 67,600 2.6% $2,823.9 2.3% $5,233.8 2.6% South Dakota 22,500 3.8% $906.6 3.2% $1,673.4 3.5% Tennessee 106,600 2.8% $5,510.3 2.7% $10,586.5 3.3% Texas 1,985,200 12.2% $180,038.5 18.1% $326,374.8 20.2% Utah 66,800 3.7% $3,546.6 4.0% $7,416.3 5.0% Vermont 13,900 3.2% $582.7 2.9% $991.7 3.2% Virginia 125,500 2.5% $6,973.8 2.3% $11,971.6 2.4% Washington 98,500 2.4% $6,107.8 2.3% $12,842.2 2.9% West Virginia 70,900 7.8% $3,492.2 8.0% $8,054.2 10.9% Wisconsin 98,200 2.7% $4,798.4 2.6% $8,393.1 2.7% Wyoming 57,500 14.4% $4,350.0 20.8% $8,936.4 22.7% US Total 8,072,700 4.3% $580,117.3 5.2% $1,097,919.6 6.1%
Source: PwC calculations using the IMPLAN modeling system (2015 database). Details may not add to totals due to rounding. * Employment is defined as the number of payroll and self-employed jobs, including part-time jobs. ** Labor income is defined as wages and salaries and benefits as well as proprietors' income.

Impacts of the Oil and Natural Gas Industry on the US Economy
10
Table 3b.− Total Operational Impact of the Oil and Natural Gas Industry By State in 2015 (Sorted by Employment Share of State Total)
State
Employment* Labor Income** Value Added
Amount Percent of State Total
($ Million) Percent of State Total
($ Million) Percent of State Total
Oklahoma 379,100 16.6% $34,634.0 28.1% $51,712.4 27.3% Wyoming 57,500 14.4% $4,350.0 20.8% $8,936.4 22.7% North Dakota 78,700 13.3% $5,772.8 17.4% $11,726.8 21.1% Texas 1,985,200 12.2% $180,038.5 18.1% $326,374.8 20.2% Louisiana 291,200 11.0% $23,359.2 16.8% $50,729.6 20.7% Alaska 45,300 9.7% $4,389.0 14.5% $15,783.0 28.9% New Mexico 90,100 8.3% $5,244.2 10.0% $12,827.2 13.3% West Virginia 70,900 7.8% $3,492.2 8.0% $8,054.2 10.9% Kansas 128,700 6.8% $8,112.9 8.5% $12,112.7 8.0% Colorado 232,900 6.5% $23,098.9 11.3% $31,381.6 9.7% Nebraska 81,200 6.3% $6,412.9 9.2% $9,283.1 8.0% Montana 39,500 6.0% $2,143.9 7.5% $4,860.6 10.5% Mississippi 81,600 5.3% $4,233.2 6.4% $7,819.2 7.2% Arkansas 76,000 4.8% $3,363.2 4.6% $8,137.2 6.5% Pennsylvania 322,600 4.3% $22,994.2 5.1% $44,456.4 6.3% Iowa 83,200 4.1% $4,304.2 4.1% $6,903.5 3.9% South Dakota 22,500 3.8% $906.6 3.2% $1,673.4 3.5% Ohio 262,800 3.8% $14,743.0 4.0% $37,937.6 6.1% Utah 66,800 3.7% $3,546.6 4.0% $7,416.3 5.0% Maine 29,200 3.6% $1,245.0 3.4% $2,246.4 3.9% Alabama 86,400 3.4% $4,029.5 3.2% $8,851.0 4.2% Kentucky 80,200 3.3% $3,681.6 3.0% $7,861.7 3.9% Missouri 117,500 3.2% $5,591.2 3.0% $10,467.5 3.5% Vermont 13,900 3.2% $582.7 2.9% $991.7 3.2% California 730,600 3.2% $56,627.7 3.8% $119,630.7 4.9% Minnesota 117,400 3.2% $7,078.5 3.3% $14,236.3 4.1% Indiana 120,400 3.2% $6,114.4 3.2% $14,845.6 4.3% Illinois 234,600 3.0% $14,859.9 3.1% $33,347.3 4.3% Michigan 159,100 2.9% $8,234.6 2.7% $14,596.9 3.0% New Hampshire 24,100 2.8% $1,408.2 2.9% $2,262.4 3.1% Delaware 15,700 2.8% $1,014.5 2.9% $2,316.1 3.5% Tennessee 106,600 2.8% $5,510.3 2.7% $10,586.5 3.3% Idaho 26,300 2.8% $1,162.4 2.8% $1,810.5 2.8% Nevada 44,900 2.8% $2,070.7 2.5% $4,086.5 2.9% Wisconsin 98,200 2.7% $4,798.4 2.6% $8,393.1 2.7% New Jersey 142,200 2.7% $10,130.4 2.8% $20,972.0 3.7% Arizona 95,300 2.7% $4,520.2 2.5% $8,031.5 2.7% South Carolina 67,600 2.6% $2,823.9 2.3% $5,233.8 2.6% North Carolina 141,500 2.5% $6,958.8 2.4% $13,406.5 2.6% Georgia 142,700 2.5% $7,467.3 2.5% $13,652.9 2.7% Virginia 125,500 2.5% $6,973.8 2.3% $11,971.6 2.4% Rhode Island 15,200 2.5% $1,023.3 2.9% $1,814.9 3.1% Oregon 57,500 2.4% $2,850.8 2.3% $5,358.4 2.5% Connecticut 54,500 2.4% $4,407.9 2.7% $7,250.0 2.7% Washington 98,500 2.4% $6,107.8 2.3% $12,842.2 2.9% Florida 266,800 2.4% $11,916.4 2.2% $22,063.5 2.5% Massachusetts 102,600 2.3% $7,790.3 2.4% $12,518.8 2.6% New York 258,500 2.2% $21,305.9 2.4% $35,796.5 2.5% Hawaii 19,100 2.1% $1,041.6 2.1% $2,342.9 3.0% Maryland 72,500 2.0% $4,435.7 2.0% $7,896.1 2.1% District of Columbia 11,800 1.3% $1,214.1 1.3% $2,111.7 1.7% US Total 8,072,700 4.3% $580,117.3 5.2% $1,097,919.6 6.1%
Source: PwC calculations using the IMPLAN modeling system (2015 database). Details may not add to totals due to rounding. * Employment is defined as the number of payroll and self-employed jobs, including part-time jobs. ** Labor income is defined as wages and salaries and benefits as well as proprietors' income.

Impacts of the Oil and Natural Gas Industry on the US Economy
11
IV. Detail by Component of Economic Impact: Direct, Indirect, and Induced Impacts
The total economic impact presented in the previous section includes the direct impact (the jobs, labor income, and value added within the oil and natural gas industry), the indirect impact (the jobs, labor income, and value added occurring throughout the supply chain of the oil and natural gas industry), and the induced impact (the jobs, labor income, and value added resulting from household spending earned either directly or indirectly from the oil and natural gas industry’s spending or from dividends received from oil and natural gas companies). In this section, the three different economic impacts are separately quantified.
A. Direct Impact
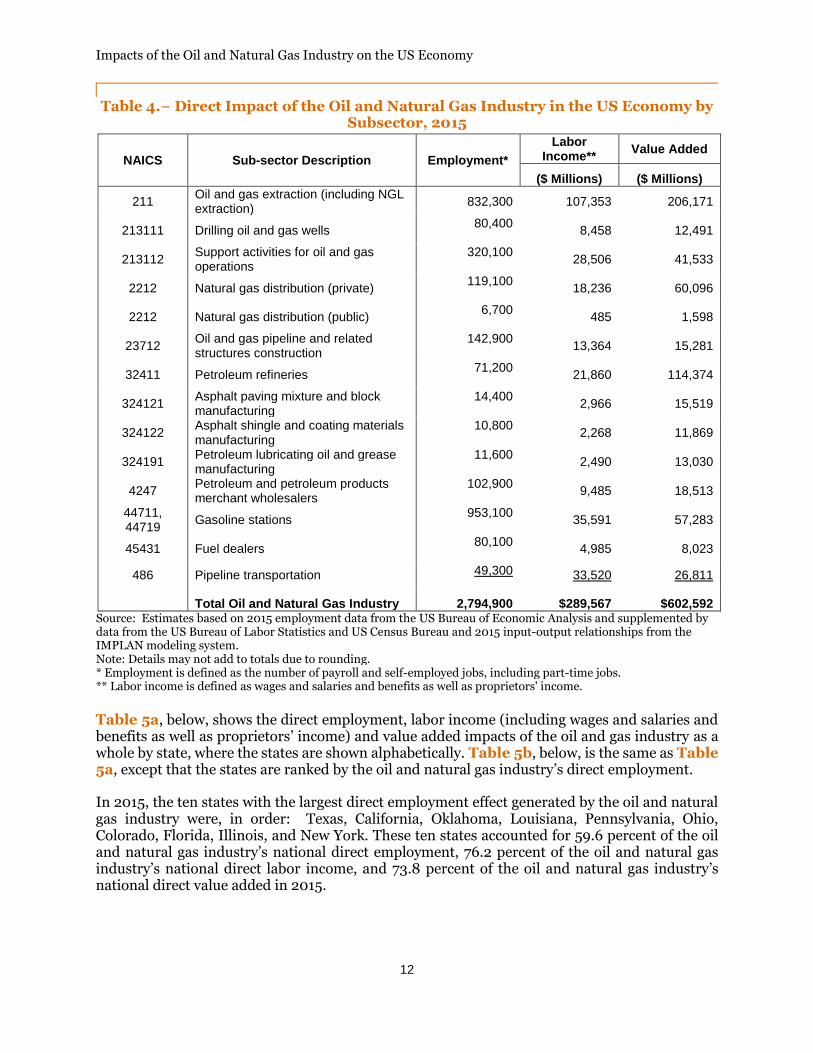
Table 4, below, shows the direct impact of the US oil and natural gas industry by NAICS subsector for the country as a whole in terms of employment, labor income (including wages and salaries and benefits as well as proprietors’ income), and value added. In 2015, the oil and natural gas industry directly provided 2.8 million jobs for American workers, paid $289.6 billion in wages, salaries and fringe benefits and proprietors’ income, and generated $602.6 billion in GDP.
Impacts of the Oil and Natural Gas Industry on the US Economy
12
Table 4.− Direct Impact of the Oil and Natural Gas Industry in the US Economy by Subsector, 2015
NAICS Sub-sector Description Employment*
Labor Income**
Value Added
($ Millions) ($ Millions)
211 Oil and gas extraction (including NGL extraction)
832,300 107,353 206,171
213111 Drilling oil and gas wells 80,400
8,458 12,491
213112 Support activities for oil and gas operations
320,100 28,506 41,533
2212 Natural gas distribution (private) 119,100
18,236 60,096
2212 Natural gas distribution (public) 6,700
485 1,598
23712 Oil and gas pipeline and related structures construction
142,900 13,364 15,281
32411 Petroleum refineries 71,200
21,860 114,374
324121 Asphalt paving mixture and block manufacturing
14,400 2,966 15,519
324122 Asphalt shingle and coating materials manufacturing
10,800 2,268 11,869
324191 Petroleum lubricating oil and grease manufacturing
11,600 2,490 13,030
4247 Petroleum and petroleum products merchant wholesalers
102,900 9,485 18,513
44711, 44719
Gasoline stations 953,100
35,591 57,283
45431 Fuel dealers 80,100
4,985 8,023
486 Pipeline transportation 49,300 33,520 26,811
Total Oil and Natural Gas Industry 2,794,900 $289,567 $602,592 Source: Estimates based on 2015 employment data from the US Bureau of Economic Analysis and supplemented by data from the US Bureau of Labor Statistics and US Census Bureau and 2015 input-output relationships from the IMPLAN modeling system. Note: Details may not add to totals due to rounding. * Employment is defined as the number of payroll and self-employed jobs, including part-time jobs. ** Labor income is defined as wages and salaries and benefits as well as proprietors' income.
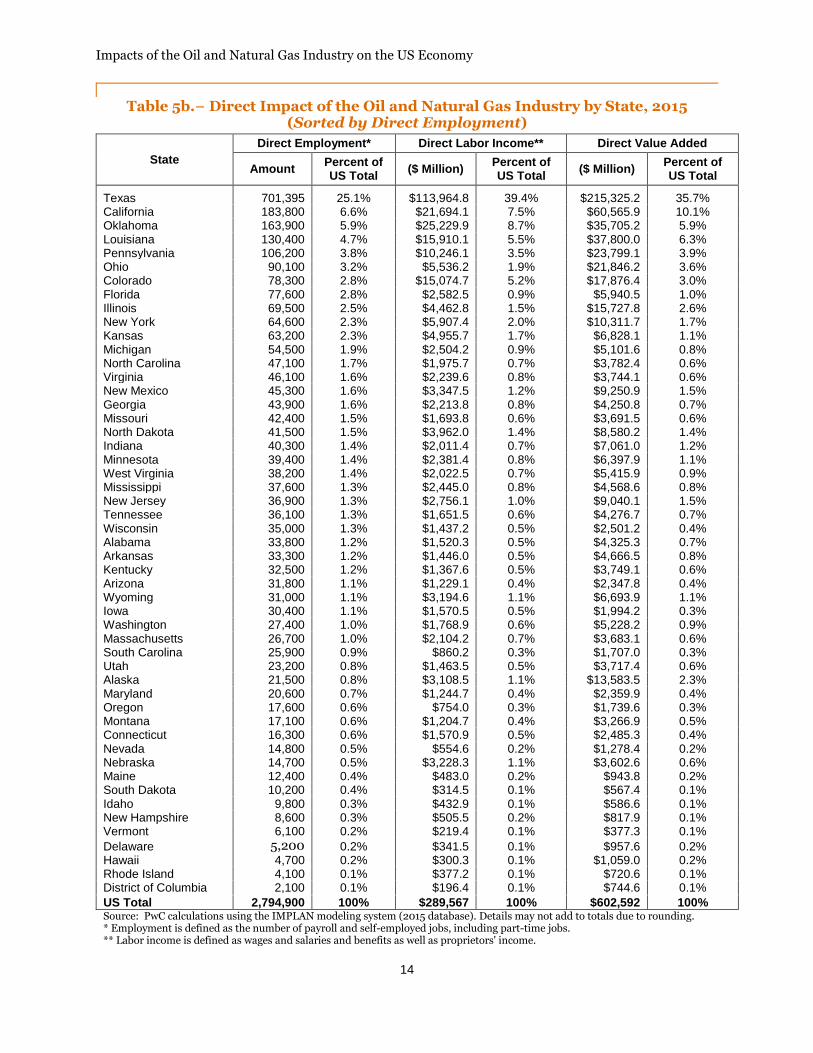
Table 5a, below, shows the direct employment, labor income (including wages and salaries and benefits as well as proprietors’ income) and value added impacts of the oil and gas industry as a whole by state, where the states are shown alphabetically. Table 5b, below, is the same as Table 5a, except that the states are ranked by the oil and natural gas industry’s direct employment.
In 2015, the ten states with the largest direct employment effect generated by the oil and natural gas industry were, in order: Texas, California, Oklahoma, Louisiana, Pennsylvania, Ohio, Colorado, Florida, Illinois, and New York. These ten states accounted for 59.6 percent of the oil and natural gas industry’s national direct employment, 76.2 percent of the oil and natural gas industry’s national direct labor income, and 73.8 percent of the oil and natural gas industry’s national direct value added in 2015.

Impacts of the Oil and Natural Gas Industry on the US Economy
13
Table 5a.− Direct Impact of the Oil and Natural Gas Industry by State, 2015 (Sorted Alphabetically)
State
Direct Employment* Direct Labor Income** Direct Value Added
Amount Percent of US Total
($ Million) Percent of US Total
($ Million) Percent of US Total
Alabama 33,800 1.2% $1,520.3 0.5% $4,325.3 0.7% Alaska 21,500 0.8% $3,108.5 1.1% $13,583.5 2.3% Arizona 31,800 1.1% $1,229.1 0.4% $2,347.8 0.4% Arkansas 33,300 1.2% $1,446.0 0.5% $4,666.5 0.8% California 183,800 6.6% $21,694.1 7.5% $60,565.9 10.1% Colorado 78,300 2.8% $15,074.7 5.2% $17,876.4 3.0% Connecticut 16,300 0.6% $1,570.9 0.5% $2,485.3 0.4% Delaware 5,200 0.2% $341.5 0.1% $957.6 0.2% District of Columbia 2,100 0.1% $196.4 0.1% $744.6 0.1% Florida 77,600 2.8% $2,582.5 0.9% $5,940.5 1.0% Georgia 43,900 1.6% $2,213.8 0.8% $4,250.8 0.7% Hawaii 4,700 0.2% $300.3 0.1% $1,059.0 0.2% Idaho 9,800 0.3% $432.9 0.1% $586.6 0.1% Illinois 69,500 2.5% $4,462.8 1.5% $15,727.8 2.6% Indiana 40,300 1.4% $2,011.4 0.7% $7,061.0 1.2% Iowa 30,400 1.1% $1,570.5 0.5% $1,994.2 0.3% Kansas 63,200 2.3% $4,955.7 1.7% $6,828.1 1.1% Kentucky 32,500 1.2% $1,367.6 0.5% $3,749.1 0.6% Louisiana 130,400 4.7% $15,910.1 5.5% $37,800.0 6.3% Maine 12,400 0.4% $483.0 0.2% $943.8 0.2% Maryland 20,600 0.7% $1,244.7 0.4% $2,359.9 0.4% Massachusetts 26,700 1.0% $2,104.2 0.7% $3,683.1 0.6% Michigan 54,500 1.9% $2,504.2 0.9% $5,101.6 0.8% Minnesota 39,400 1.4% $2,381.4 0.8% $6,397.9 1.1% Mississippi 37,600 1.3% $2,445.0 0.8% $4,568.6 0.8% Missouri 42,400 1.5% $1,693.8 0.6% $3,691.5 0.6% Montana 17,100 0.6% $1,204.7 0.4% $3,266.9 0.5% Nebraska 14,700 0.5% $3,228.3 1.1% $3,602.6 0.6% Nevada 14,800 0.5% $554.6 0.2% $1,278.4 0.2% New Hampshire 8,600 0.3% $505.5 0.2% $817.9 0.1% New Jersey 36,900 1.3% $2,756.1 1.0% $9,040.1 1.5% New Mexico 45,300 1.6% $3,347.5 1.2% $9,250.9 1.5% New York 64,600 2.3% $5,907.4 2.0% $10,311.7 1.7% North Carolina 47,100 1.7% $1,975.7 0.7% $3,782.4 0.6% North Dakota 41,500 1.5% $3,962.0 1.4% $8,580.2 1.4% Ohio 90,100 3.2% $5,536.2 1.9% $21,846.2 3.6% Oklahoma 163,900 5.9% $25,229.9 8.7% $35,705.2 5.9% Oregon 17,600 0.6% $754.0 0.3% $1,739.6 0.3% Pennsylvania 106,200 3.8% $10,246.1 3.5% $23,799.1 3.9% Rhode Island 4,100 0.1% $377.2 0.1% $720.6 0.1% South Carolina 25,900 0.9% $860.2 0.3% $1,707.0 0.3% South Dakota 10,200 0.4% $314.5 0.1% $567.4 0.1% Tennessee 36,100 1.3% $1,651.5 0.6% $4,276.7 0.7% Texas 701,400 25.1% $113,964.8 39.4% $215,325.2 35.7% Utah 23,200 0.8% $1,463.5 0.5% $3,717.4 0.6% Vermont 6,100 0.2% $219.4 0.1% $377.3 0.1% Virginia 46,100 1.6% $2,239.6 0.8% $3,744.1 0.6% Washington 27,400 1.0% $1,768.9 0.6% $5,228.2 0.9% West Virginia 38,200 1.4% $2,022.5 0.7% $5,415.9 0.9% Wisconsin 35,000 1.3% $1,437.2 0.5% $2,501.2 0.4% Wyoming 31,000 1.1% $3,194.6 1.1% $6,693.9 1.1% US Total 2,794,900 100% $289,567 100% $602,592 100% Source: PwC calculations using the IMPLAN modeling system (2015 database). Details may not add to totals due to rounding. * Employment is defined as the number of payroll and self-employed jobs, including part-time jobs. ** Labor income is defined as wages and salaries and benefits as well as proprietors' income.
Impacts of the Oil and Natural Gas Industry on the US Economy
14
Table 5b.− Direct Impact of the Oil and Natural Gas Industry by State, 2015 (Sorted by Direct Employment)
State
Direct Employment* Direct Labor Income** Direct Value Added
Amount Percent of US Total
($ Million) Percent of US Total
($ Million) Percent of US Total
Texas 701,395 25.1% $113,964.8 39.4% $215,325.2 35.7% California 183,800 6.6% $21,694.1 7.5% $60,565.9 10.1% Oklahoma 163,900 5.9% $25,229.9 8.7% $35,705.2 5.9% Louisiana 130,400 4.7% $15,910.1 5.5% $37,800.0 6.3% Pennsylvania 106,200 3.8% $10,246.1 3.5% $23,799.1 3.9% Ohio 90,100 3.2% $5,536.2 1.9% $21,846.2 3.6% Colorado 78,300 2.8% $15,074.7 5.2% $17,876.4 3.0% Florida 77,600 2.8% $2,582.5 0.9% $5,940.5 1.0% Illinois 69,500 2.5% $4,462.8 1.5% $15,727.8 2.6% New York 64,600 2.3% $5,907.4 2.0% $10,311.7 1.7% Kansas 63,200 2.3% $4,955.7 1.7% $6,828.1 1.1% Michigan 54,500 1.9% $2,504.2 0.9% $5,101.6 0.8% North Carolina 47,100 1.7% $1,975.7 0.7% $3,782.4 0.6% Virginia 46,100 1.6% $2,239.6 0.8% $3,744.1 0.6% New Mexico 45,300 1.6% $3,347.5 1.2% $9,250.9 1.5% Georgia 43,900 1.6% $2,213.8 0.8% $4,250.8 0.7% Missouri 42,400 1.5% $1,693.8 0.6% $3,691.5 0.6% North Dakota 41,500 1.5% $3,962.0 1.4% $8,580.2 1.4% Indiana 40,300 1.4% $2,011.4 0.7% $7,061.0 1.2% Minnesota 39,400 1.4% $2,381.4 0.8% $6,397.9 1.1% West Virginia 38,200 1.4% $2,022.5 0.7% $5,415.9 0.9% Mississippi 37,600 1.3% $2,445.0 0.8% $4,568.6 0.8% New Jersey 36,900 1.3% $2,756.1 1.0% $9,040.1 1.5% Tennessee 36,100 1.3% $1,651.5 0.6% $4,276.7 0.7% Wisconsin 35,000 1.3% $1,437.2 0.5% $2,501.2 0.4% Alabama 33,800 1.2% $1,520.3 0.5% $4,325.3 0.7% Arkansas 33,300 1.2% $1,446.0 0.5% $4,666.5 0.8% Kentucky 32,500 1.2% $1,367.6 0.5% $3,749.1 0.6% Arizona 31,800 1.1% $1,229.1 0.4% $2,347.8 0.4% Wyoming 31,000 1.1% $3,194.6 1.1% $6,693.9 1.1% Iowa 30,400 1.1% $1,570.5 0.5% $1,994.2 0.3% Washington 27,400 1.0% $1,768.9 0.6% $5,228.2 0.9% Massachusetts 26,700 1.0% $2,104.2 0.7% $3,683.1 0.6% South Carolina 25,900 0.9% $860.2 0.3% $1,707.0 0.3% Utah 23,200 0.8% $1,463.5 0.5% $3,717.4 0.6% Alaska 21,500 0.8% $3,108.5 1.1% $13,583.5 2.3% Maryland 20,600 0.7% $1,244.7 0.4% $2,359.9 0.4% Oregon 17,600 0.6% $754.0 0.3% $1,739.6 0.3% Montana 17,100 0.6% $1,204.7 0.4% $3,266.9 0.5% Connecticut 16,300 0.6% $1,570.9 0.5% $2,485.3 0.4% Nevada 14,800 0.5% $554.6 0.2% $1,278.4 0.2% Nebraska 14,700 0.5% $3,228.3 1.1% $3,602.6 0.6% Maine 12,400 0.4% $483.0 0.2% $943.8 0.2% South Dakota 10,200 0.4% $314.5 0.1% $567.4 0.1% Idaho 9,800 0.3% $432.9 0.1% $586.6 0.1% New Hampshire 8,600 0.3% $505.5 0.2% $817.9 0.1% Vermont 6,100 0.2% $219.4 0.1% $377.3 0.1%
Delaware 5,200 0.2% $341.5 0.1% $957.6 0.2% Hawaii 4,700 0.2% $300.3 0.1% $1,059.0 0.2% Rhode Island 4,100 0.1% $377.2 0.1% $720.6 0.1% District of Columbia 2,100 0.1% $196.4 0.1% $744.6 0.1% US Total 2,794,900 100% $289,567 100% $602,592 100% Source: PwC calculations using the IMPLAN modeling system (2015 database). Details may not add to totals due to rounding. * Employment is defined as the number of payroll and self-employed jobs, including part-time jobs. ** Labor income is defined as wages and salaries and benefits as well as proprietors' income.
Impacts of the Oil and Natural Gas Industry on the US Economy
15
B. Indirect and Induced Impacts
The oil and natural gas industry purchases intermediate inputs from a variety of other US industries, supporting jobs in these industries and spurring additional rounds of input purchases by these industries. Other economic impacts are generated by the personal spending of employees and business owners in the oil and natural gas industry and out of the additional income in the supply chain to the industry. Additional economic impact is generated by shareholder spending out of dividends received from oil and natural gas companies. The jobs, labor income (including wages and salaries and benefits as well as proprietors’ income), and value added supported by this cycle of spending, or multiplier process, are referred to as the indirect and induced economic impacts.
The oil and natural gas industry also purchases capital goods from a variety of US suppliers, which has a similar multiplier effect on the rest of the US economy. Based on data from the Census Bureau and US Department of Commerce, PwC estimates that the oil and natural gas industry invested $235.3 billion in new equipment and structures in 2015.
PwC quantified the indirect and induced impacts of the oil and natural gas industry’s operational and capital spending using the customized impact models PwC has built based on the IMPLAN modeling system.
Table 6, below, shows the oil and natural gas industry’s indirect and induced impacts by sector, separately identifying its operational and capital investment impacts at the national level. PwC estimates that at the national level, each direct job in the oil and natural gas industry supported an additional 2.7 jobs elsewhere in the US economy in 2015. That is, in addition to the 2.8 million direct jobs in the oil and natural gas industry, 7.5 million additional jobs were supported in the US economy through the indirect and induced impacts of the industry. The industry’s purchase of intermediate inputs from other US suppliers and payment of dividends to shareholders supported more than 5.3 million indirect and induced jobs in other industries across the country in 2015, and its capital investment supported 2.3 million additional indirect and induced jobs across the US economy. Combined, the oil and natural gas industry directly or indirectly supported 10.3 million jobs in the US economy in 2015. The service sector accounts for the largest number of indirect and induced jobs attributable to the oil and natural gas industry’s spending (3.6 million) in 2015, followed by Wholesale and Retail Trade (0.9 million), Finance, Insurance, Real Estate, Rental and Leasing (0.9 million), and Manufacturing (0.5 million).
The industry’s estimated national indirect and induced labor income (including wages and salaries and benefits as well as proprietors’ income) was $424.6 billion and its estimated national indirect and induced value added was $715.3 billion in 2015.

Impacts of the Oil and Natural Gas Industry on the US Economy
16
Table 6.− The Direct, Indirect, and Induced Impact of the Oil and Natural Gas Industry to the US Economy, 2015
Sector Description Employment* Labor Income ($ million)**
Value Added ($ million)
Direct Impact of the Oil and Natural Gas Industry 2,794,900 $289,566.8 $602,592.4
Indirect and Induced Impact on Other Industries 7,545,800 $424,601.3 $715,267.0
Operational Impact 5,277,700 $290,550.5 $495,327.2
Agriculture 81,700 $3,470.7 $4,647.7
Mining 23,400 $2,585.0 $8,578.1
Utilities 10,900 $1,461.9 $5,239.7
Construction 194,800 $10,871.7 $17,731.0
Manufacturing 213,500 $17,474.1 $35,447.6
Wholesale and retail trade 651,600 $34,101.2 $58,201.7
Transportation and warehousing 269,700 $12,846.4 $19,147.7
Information 188,400 $14,288.4 $27,596.8
Finance, insurance, real estate, rental and leasing 666,700 $38,955.2 $129,231.1
Services 2,639,700 $135,105.1 $164,920.4
Other 337,300 $19,390.9 $24,585.4
Capital Investment Impact 2,268,000 $134,050.7 $219,939.8
Agriculture 28,200 $1,165.2 $1,542.6
Mining 11,100 $956.0 $2,268.4
Utilities 5,700 $832.4 $3,079.8
Construction 318,000 $18,443.4 $24,264.5
Manufacturing 272,300 $22,431.0 $40,611.9
Wholesale and retail trade 293,900 $15,961.1 $28,509.6
Transportation and warehousing 78,800 $4,458.0 $6,265.0
Information 33,000 $3,837.2 $8,184.9
Finance, insurance, real estate, rental and leasing 225,800 $13,776.7 $43,034.0
Services 980,100 $50,324.2 $60,057.7
Other 21,100 $1,865.5 $2,121.4
Total Economic Impact 10,340,700 $714,168.1 $1,317,859.4
Source: PwC calculations using the IMPLAN modeling system (2015 database). Note: Details may not add to totals due to rounding. * Employment is defined as the number of payroll and self-employed jobs, including part-time jobs. ** Labor income is defined as wages and salaries and benefits as well as proprietors' income.
The remainder of this section provides details on the operational economic impacts of the oil and natural gas industry at the state level. As previously discussed, the state-level impacts exclude the economic impacts from capital investment in the oil and natural gas industry because capital expenditure data is not available at the state level.
Table 7a, below, shows the sum of the oil and natural gas industry’s indirect and induced effects from its operations (i.e., not including its capital investment impact) in terms of employment, value added, and labor income in the 50 states and the District of Columbia, where the states are shown alphabetically. Table 7b, below, is the same as Table 7a except that the states are ranked in order of the indirect and induced employment effect. In 2015, the five states with the largest combined indirect and induced employment effect generated by the oil and natural gas industry

Impacts of the Oil and Natural Gas Industry on the US Economy
17
operations were, in order: Texas (24.3 percent), California (10.4 percent), Pennsylvania (4.1 percent), Oklahoma (4.1 percent), and New York (3.7 percent). These five states accounted for 46.5 percent of the oil and natural gas industry’s national combined operational indirect and induced employment, 47.7 percent of the oil and natural gas industry’s national combined operational indirect and induced labor income, and 46.9 percent of the oil and natural gas industry’s national combined operational indirect and induced value added in 2015.
Table 8a, below, shows the direct, indirect, induced, and total employment impact of the oil and natural gas industry from its operations in the 50 states and the District of Columbia, where the states are shown alphabetically. Table 8b, below, is the same as Table 8a except that the states are ranked in order of the industry’s total employment impact from its operations as a percent of each state’s total employment. Using this metric, the top five states in 2015 were, in order: Oklahoma (16.6 percent), Wyoming (14.4 percent), North Dakota (13.3 percent), Texas (12.2 percent), and Louisiana (11.0 percent).
Table 9a, below, shows the direct, indirect, induced, and total labor income impact of the oil and natural gas industry from its operations in the 50 states and the District of Columbia, where the states are shown alphabetically. Table 9b, below, is the same as Table 9a except the states are ranked in order of the industry’s total impact from its operations as a percent of each state’s total labor income. The top five states by this metric in 2015 were, in order: Oklahoma (28.1 percent), Wyoming (20.8 percent), Texas (18.1 percent), North Dakota (17.4 percent), and Louisiana (16.8 percent).
Table 10a, below, shows the direct, indirect, induced, and total value-added impact of the oil and natural gas industry from its operations in the 50 states and the District of Columbia, where the states are shown alphabetically. Table 10b, below, is the same as Table 10a except that the states are ranked in order of the industry’s total impact from its operations to each state’s GDP. The top five states by this metric in 2015 were, in order: Alaska (28.9 percent), Oklahoma (27.3 percent), Wyoming (22.7 percent), North Dakota (21.1 percent), and Louisiana (20.7 percent).
More detailed state-by-state operational impact results are included in Appendix A.

Impacts of the Oil and Natural Gas Industry on the US Economy
18
Table 7a.− Indirect and Induced Impacts of the Oil and Natural Gas Industry’s Operations by State, 2015 (Sorted Alphabetically)
State
Employment* Labor Income** Value Added
Amount Percent of US Total
($ Million) Percent of US Total
($ Million) Percent of US Total
Alabama 52,500 1.0% $2,509.3 0.9% $4,525.7 0.9% Alaska 23,700 0.4% $1,280.5 0.4% $2,199.5 0.4% Arizona 63,500 1.2% $3,291.1 1.1% $5,683.6 1.1% Arkansas 42,600 0.8% $1,917.2 0.7% $3,470.7 0.7% California 546,900 10.4% $34,933.6 12.0% $59,064.8 11.9% Colorado 154,600 2.9% $8,024.2 2.8% $13,505.2 2.7% Connecticut 38,200 0.7% $2,837.0 1.0% $4,764.7 1.0% Delaware 10,500 0.2% $673.0 0.2% $1,358.4 0.3% District of Columbia 9,700 0.2% $1,017.7 0.4% $1,367.0 0.3% Florida 189,200 3.6% $9,333.9 3.2% $16,123.0 3.3% Georgia 98,800 1.9% $5,253.6 1.8% $9,402.1 1.9% Hawaii 14,500 0.3% $741.2 0.3% $1,283.9 0.3% Idaho 16,500 0.3% $729.6 0.3% $1,223.9 0.2% Illinois 165,000 3.1% $10,397.0 3.6% $17,619.5 3.6% Indiana 80,100 1.5% $4,103.0 1.4% $7,784.6 1.6% Iowa 52,900 1.0% $2,733.7 0.9% $4,909.3 1.0% Kansas 65,400 1.2% $3,157.2 1.1% $5,284.6 1.1% Kentucky 47,700 0.9% $2,314.0 0.8% $4,112.6 0.8% Louisiana 160,800 3.0% $7,449.0 2.6% $12,929.6 2.6% Maine 16,800 0.3% $762.0 0.3% $1,302.6 0.3% Maryland 51,900 1.0% $3,191.0 1.1% $5,536.1 1.1% Massachusetts 76,000 1.4% $5,686.0 2.0% $8,835.7 1.8% Michigan 104,600 2.0% $5,730.4 2.0% $9,495.4 1.9% Minnesota 78,000 1.5% $4,697.2 1.6% $7,838.4 1.6% Mississippi 44,000 0.8% $1,788.2 0.6% $3,250.6 0.7% Missouri 75,100 1.4% $3,897.3 1.3% $6,776.0 1.4% Montana 22,400 0.4% $939.2 0.3% $1,593.7 0.3% Nebraska 66,500 1.3% $3,184.6 1.1% $5,680.5 1.1% Nevada 30,000 0.6% $1,516.1 0.5% $2,808.2 0.6% New Hampshire 15,500 0.3% $902.7 0.3% $1,444.5 0.3% New Jersey 105,200 2.0% $7,374.3 2.5% $11,931.9 2.4% New Mexico 44,800 0.8% $1,896.7 0.7% $3,576.4 0.7% New York 193,900 3.7% $15,398.6 5.3% $25,484.8 5.1% North Carolina 94,400 1.8% $4,983.2 1.7% $9,624.1 1.9% North Dakota 37,200 0.7% $1,810.8 0.6% $3,146.6 0.6% Ohio 172,800 3.3% $9,206.8 3.2% $16,091.5 3.2% Oklahoma 215,200 4.1% $9,404.1 3.2% $16,007.1 3.2% Oregon 40,000 0.8% $2,096.8 0.7% $3,618.8 0.7% Pennsylvania 216,400 4.1% $12,748.2 4.4% $20,657.3 4.2% Rhode Island 11,000 0.2% $646.1 0.2% $1,094.3 0.2% South Carolina 41,700 0.8% $1,963.7 0.7% $3,526.8 0.7% South Dakota 12,300 0.2% $592.2 0.2% $1,106.0 0.2% Tennessee 70,500 1.3% $3,858.8 1.3% $6,309.8 1.3% Texas 1,283,800 24.3% $66,073.7 22.7% $111,049.7 22.4% Utah 43,600 0.8% $2,083.2 0.7% $3,699.0 0.7% Vermont 7,800 0.1% $363.3 0.1% $614.5 0.1% Virginia 79,400 1.5% $4,734.2 1.6% $8,227.5 1.7% Washington 71,100 1.3% $4,338.8 1.5% $7,614.0 1.5% West Virginia 32,700 0.6% $1,469.7 0.5% $2,638.3 0.5% Wisconsin 63,200 1.2% $3,361.3 1.2% $5,892.0 1.2% Wyoming 26,500 0.5% $1,155.3 0.4% $2,242.5 0.5% US Total 5,277,700 100.0% $290,550.5 100.0% $495,327.2 100.0%
Source: PwC calculations using the IMPLAN modeling system (2015 database). Details may not add to totals due to rounding. * Employment is defined as the number of payroll and self-employed jobs, including part-time jobs. ** Labor income is defined as wages and salaries and benefits as well as proprietors’ income.

Impacts of the Oil and Natural Gas Industry on the US Economy
19
Table 7b.− Indirect and Induced Impacts of the Oil and Natural Gas Industry’s Operations by State, 2015 (Sorted by Employment Impact)
State
Employment* Labor Income** Value Added
Amount Percent of US Total
($ Million) Percent of US
Total ($ Million)
Percent of US Total
Texas 1,283,800 24.3% $66,073.7 22.7% $111,049.7 22.4% California 546,900 10.4% $34,933.6 12.0% $59,064.8 11.9% Pennsylvania 216,400 4.1% $12,748.2 4.4% $20,657.3 4.2% Oklahoma 215,200 4.1% $9,404.1 3.2% $16,007.1 3.2% New York 193,900 3.7% $15,398.6 5.3% $25,484.8 5.1% Florida 189,200 3.6% $9,333.9 3.2% $16,123.0 3.3% Ohio 172,800 3.3% $9,206.8 3.2% $16,091.5 3.2% Illinois 165,000 3.1% $10,397.0 3.6% $17,619.5 3.6% Louisiana 160,800 3.0% $7,449.0 2.6% $12,929.6 2.6% Colorado 154,600 2.9% $8,024.2 2.8% $13,505.2 2.7% New Jersey 105,200 2.0% $7,374.3 2.5% $11,931.9 2.4% Michigan 104,600 2.0% $5,730.4 2.0% $9,495.4 1.9% Georgia 98,800 1.9% $5,253.6 1.8% $9,402.1 1.9% North Carolina 94,400 1.8% $4,983.2 1.7% $9,624.1 1.9% Indiana 80,100 1.5% $4,103.0 1.4% $7,784.6 1.6% Virginia 79,400 1.5% $4,734.2 1.6% $8,227.5 1.7% Minnesota 78,000 1.5% $4,697.2 1.6% $7,838.4 1.6% Massachusetts 76,000 1.4% $5,686.0 2.0% $8,835.7 1.8% Missouri 75,100 1.4% $3,897.3 1.3% $6,776.0 1.4% Washington 71,100 1.3% $4,338.8 1.5% $7,614.0 1.5% Tennessee 70,500 1.3% $3,858.8 1.3% $6,309.8 1.3% Nebraska 66,500 1.3% $3,184.6 1.1% $5,680.5 1.1% Kansas 65,400 1.2% $3,157.2 1.1% $5,284.6 1.1% Arizona 63,500 1.2% $3,291.1 1.1% $5,683.6 1.1% Wisconsin 63,200 1.2% $3,361.3 1.2% $5,892.0 1.2% Iowa 52,900 1.0% $2,733.7 0.9% $4,909.3 1.0% Alabama 52,500 1.0% $2,509.3 0.9% $4,525.7 0.9% Maryland 51,900 1.0% $3,191.0 1.1% $5,536.1 1.1% Kentucky 47,700 0.9% $2,314.0 0.8% $4,112.6 0.8% New Mexico 44,800 0.8% $1,896.7 0.7% $3,576.4 0.7% Mississippi 44,000 0.8% $1,788.2 0.6% $3,250.6 0.7% Utah 43,600 0.8% $2,083.2 0.7% $3,699.0 0.7% Arkansas 42,600 0.8% $1,917.2 0.7% $3,470.7 0.7% South Carolina 41,700 0.8% $1,963.7 0.7% $3,526.8 0.7% Oregon 40,000 0.8% $2,096.8 0.7% $3,618.8 0.7% Connecticut 38,200 0.7% $2,837.0 1.0% $4,764.7 1.0% North Dakota 37,200 0.7% $1,810.8 0.6% $3,146.6 0.6% West Virginia 32,700 0.6% $1,469.7 0.5% $2,638.3 0.5% Nevada 30,000 0.6% $1,516.1 0.5% $2,808.2 0.6% Wyoming 26,500 0.5% $1,155.3 0.4% $2,242.5 0.5% Alaska 23,700 0.4% $1,280.5 0.4% $2,199.5 0.4% Montana 22,400 0.4% $939.2 0.3% $1,593.7 0.3% Maine 16,800 0.3% $762.0 0.3% $1,302.6 0.3% Idaho 16,500 0.3% $729.6 0.3% $1,223.9 0.2% New Hampshire 15,500 0.3% $902.7 0.3% $1,444.5 0.3% Hawaii 14,500 0.3% $741.2 0.3% $1,283.9 0.3% South Dakota 12,300 0.2% $592.2 0.2% $1,106.0 0.2% Rhode Island 11,000 0.2% $646.1 0.2% $1,094.3 0.2% Delaware 10,500 0.2% $673.0 0.2% $1,358.4 0.3% District of Columbia 9,700 0.2% $1,017.7 0.4% $1,367.0 0.3% Vermont 7,800 0.1% $363.3 0.1% $614.5 0.1% US Total 5,277,700 100.0% $290,550.5 100.0% $495,327.2 100.0%
Source: PwC calculations using the IMPLAN modeling system (2015 database). Details may not add to totals due to rounding. * Employment is defined as the number of payroll and self-employed jobs, including part-time jobs. ** Labor income is defined as wages and salaries and benefits as well as proprietors’ income.

Impacts of the Oil and Natural Gas Industry on the US Economy
20
Table 8a.− Employment Impact of the Oil and Natural Gas Industry’s Operations by State, 2015 (Sorted Alphabetically)
State Direct
Employment Indirect
Employment Induced
Employment Total
Contribution
Total Contribution as a % of State
Total Employment
Alabama 33,800 15,200 37,300 86,300 3.4% Alaska 21,500 4,900 18,800 45,200 9.7% Arizona 31,800 16,800 46,700 95,300 2.7% Arkansas 33,300 12,400 30,200 75,900 4.8% California 183,800 141,600 405,200 730,600 3.2% Colorado 78,300 26,000 128,600 232,900 6.5% Connecticut 16,300 8,500 29,700 54,500 2.4% Delaware 5,200 3,100 7,400 15,700 2.8% District of Columbia 2,100 2,500 7,200 11,800 1.3% Florida 77,600 45,300 143,800 266,700 2.4% Georgia 43,900 25,500 73,300 142,700 2.5% Hawaii 4,700 3,400 11,100 19,200 2.1% Idaho 9,800 4,200 12,300 26,300 2.8% Illinois 69,500 45,100 119,900 234,500 3.0% Indiana 40,300 22,800 57,200 120,300 3.2% Iowa 30,400 16,400 36,500 83,300 4.1% Kansas 63,200 18,800 46,600 128,600 6.8% Kentucky 32,500 13,900 33,800 80,200 3.3% Louisiana 130,400 46,400 114,300 291,100 11.0% Maine 12,400 5,100 11,700 29,200 3.6% Maryland 20,600 12,200 39,700 72,500 2.0% Massachusetts 26,700 18,000 58,000 102,700 2.3% Michigan 54,500 27,200 77,400 159,100 2.9% Minnesota 39,400 21,100 57,000 117,500 3.2% Mississippi 37,600 14,000 30,000 81,600 5.3% Missouri 42,400 20,200 54,800 117,400 3.2% Montana 17,100 6,800 15,600 39,500 6.0% Nebraska 14,700 14,000 52,500 81,200 6.3% Nevada 14,800 7,400 22,600 44,800 2.8% New Hampshire 8,600 4,100 11,400 24,100 2.8% New Jersey 36,900 27,600 77,600 142,100 2.7% New Mexico 45,300 11,100 33,700 90,100 8.3% New York 64,600 43,500 150,400 258,500 2.2% North Carolina 47,100 25,300 69,100 141,500 2.5% North Dakota 41,500 9,900 27,200 78,600 13.3% Ohio 90,100 51,400 121,400 262,900 3.8% Oklahoma 163,900 41,000 174,200 379,100 16.6% Oregon 17,600 10,500 29,500 57,600 2.4% Pennsylvania 106,200 50,900 165,400 322,500 4.3% Rhode Island 4,100 2,600 8,500 15,200 2.5% South Carolina 25,900 11,300 30,400 67,600 2.6% South Dakota 10,200 3,100 9,200 22,500 3.8% Tennessee 36,100 18,800 51,800 106,700 2.8% Texas 701,400 233,100 1,050,800 1,985,300 12.2% Utah 23,200 12,200 31,400 66,800 3.7% Vermont 6,100 2,000 5,800 13,900 3.2% Virginia 46,100 20,600 58,800 125,500 2.5% Washington 27,400 19,000 52,100 98,500 2.4% West Virginia 38,200 9,300 23,400 70,900 7.8% Wisconsin 35,000 16,500 46,700 98,200 2.7% Wyoming 31,000 8,200 18,300 57,500 14.4% US Total 2,794,900 1,251,200 4,026,500 8,072,700 4.3%
Source: PwC calculations using the IMPLAN modeling system (2015 database). Details may not add to totals due to rounding. Employment is defined as the number of payroll and self-employed jobs, including part-time jobs.

Impacts of the Oil and Natural Gas Industry on the US Economy
21
Table 8b.− Employment Impact of the Oil and Natural Gas Industry’s Operations by State, 2015 (Sorted by Employment Share)
State Direct
Employment Indirect
Employment Induced
Employment Total
Contribution
Total Contribution as a % of State
Total Employment
Oklahoma 163,900 41,000 174,200 379,100 16.6% Wyoming 31,000 8,200 18,300 57,500 14.4% North Dakota 41,500 9,900 27,200 78,600 13.3% Texas 701,400 233,100 1,050,800 1,985,300 12.2% Louisiana 130,400 46,400 114,300 291,100 11.0% Alaska 21,500 4,900 18,800 45,200 9.7% New Mexico 45,300 11,100 33,700 90,100 8.3% West Virginia 38,200 9,300 23,400 70,900 7.8% Kansas 63,200 18,800 46,600 128,600 6.8% Colorado 78,300 26,000 128,600 232,900 6.5% Nebraska 14,700 14,000 52,500 81,200 6.3% Montana 17,100 6,800 15,600 39,500 6.0% Mississippi 37,600 14,000 30,000 81,600 5.3% Arkansas 33,300 12,400 30,200 75,900 4.8% Pennsylvania 106,200 50,900 165,400 322,500 4.3% Iowa 30,400 16,400 36,500 83,300 4.1% South Dakota 10,200 3,100 9,200 22,500 3.8% Ohio 90,100 51,400 121,400 262,900 3.8% Utah 23,200 12,200 31,400 66,800 3.7% Maine 12,400 5,100 11,700 29,200 3.6% Alabama 33,800 15,200 37,300 86,300 3.4% Kentucky 32,500 13,900 33,800 80,200 3.3% Missouri 42,400 20,200 54,800 117,400 3.2% Vermont 6,100 2,000 5,800 13,900 3.2% California 183,800 141,600 405,200 730,600 3.2% Minnesota 39,400 21,100 57,000 117,500 3.2% Indiana 40,300 22,800 57,200 120,300 3.2% Illinois 69,500 45,100 119,900 234,500 3.0% Michigan 54,500 27,200 77,400 159,100 2.9% New Hampshire 8,600 4,100 11,400 24,100 2.8% Delaware 5,200 3,100 7,400 15,700 2.8% Tennessee 36,100 18,800 51,800 106,700 2.8% Idaho 9,800 4,200 12,300 26,300 2.8% Nevada 14,800 7,400 22,600 44,800 2.8% Wisconsin 35,000 16,500 46,700 98,200 2.7% New Jersey 36,900 27,600 77,600 142,100 2.7% Arizona 31,800 16,800 46,700 95,300 2.7% South Carolina 25,900 11,300 30,400 67,600 2.6% North Carolina 47,100 25,300 69,100 141,500 2.5% Georgia 43,900 25,500 73,300 142,700 2.5% Virginia 46,100 20,600 58,800 125,500 2.5% Rhode Island 4,100 2,600 8,500 15,200 2.5% Oregon 17,600 10,500 29,500 57,600 2.4% Connecticut 16,300 8,500 29,700 54,500 2.4% Washington 27,400 19,000 52,100 98,500 2.4% Florida 77,600 45,300 143,800 266,700 2.4% Massachusetts 26,700 18,000 58,000 102,700 2.3% New York 64,600 43,500 150,400 258,500 2.2% Hawaii 4,700 3,400 11,100 19,200 2.1% Maryland 20,600 12,200 39,700 72,500 2.0% District of Columbia 2,100 2,500 7,200 11,800 1.3% US Total 2,794,900 1,251,200 4,026,500 8,072,700 4.3%
Source: PwC calculations using the IMPLAN modeling system (2015 database). Details may not add to totals due to rounding. Employment is defined as the number of payroll and self-employed jobs, including part-time jobs.

Impacts of the Oil and Natural Gas Industry on the US Economy
22
Table 9a.− Impact of the Oil and Natural Gas Industry’s Operations on Labor Income by State, 2015 (in $ Millions, Sorted Alphabetically)
State Direct Labor
Income Indirect Labor
Income
Induced Labor
Income
Total Contribution
Total Contribution
as a % of State Total Labor
Income
Alabama $1,520.3 $839.4 $1,669.9 $4,029.5 3.2% Alaska $3,108.5 $317.3 $963.2 $4,389.0 14.5% Arizona $1,229.1 $1,005.6 $2,285.5 $4,520.2 2.5% Arkansas $1,446.0 $652.4 $1,264.8 $3,363.2 4.6% California $21,694.1 $10,935.2 $23,998.4 $56,627.7 3.8% Colorado $15,074.7 $1,779.6 $6,244.6 $23,098.9 11.3% Connecticut $1,570.9 $774.2 $2,062.9 $4,407.9 2.7% Delaware $341.5 $235.0 $438.1 $1,014.5 2.9% District of Columbia $196.4 $302.2 $715.5 $1,214.1 1.3% Florida $2,582.5 $2,625.2 $6,708.7 $11,916.4 2.2% Georgia $2,213.8 $1,588.3 $3,665.3 $7,467.3 2.5% Hawaii $300.3 $200.6 $540.6 $1,041.6 2.1% Idaho $432.9 $199.5 $530.0 $1,162.4 2.8% Illinois $4,462.8 $3,495.3 $6,901.7 $14,859.9 3.1% Indiana $2,011.4 $1,356.1 $2,746.9 $6,114.4 3.2% Iowa $1,570.5 $1,014.0 $1,719.7 $4,304.2 4.1% Kansas $4,955.7 $1,109.4 $2,047.7 $8,112.9 8.5% Kentucky $1,367.6 $772.9 $1,541.1 $3,681.6 3.0% Louisiana $15,910.1 $2,628.7 $4,820.3 $23,359.2 16.8% Maine $483.0 $260.8 $501.2 $1,245.0 3.4% Maryland $1,244.7 $919.3 $2,271.7 $4,435.7 2.0% Massachusetts $2,104.2 $1,674.7 $4,011.3 $7,790.3 2.4% Michigan $2,504.2 $1,806.9 $3,923.4 $8,234.6 2.7% Minnesota $2,381.4 $1,541.1 $3,156.1 $7,078.5 3.3% Mississippi $2,445.0 $647.4 $1,140.8 $4,233.2 6.4% Missouri $1,693.8 $1,256.8 $2,640.5 $5,591.2 3.0% Montana $1,204.7 $335.0 $604.2 $2,143.9 7.5% Nebraska $3,228.3 $874.2 $2,310.5 $6,412.9 9.2% Nevada $554.6 $440.9 $1,075.2 $2,070.7 2.5% New Hampshire $505.5 $277.9 $624.9 $1,408.2 2.9% New Jersey $2,756.1 $2,401.4 $4,972.9 $10,130.4 2.8% New Mexico $3,347.5 $563.8 $1,332.9 $5,244.2 10.0% New York $5,907.4 $4,226.9 $11,171.6 $21,305.9 2.4% North Carolina $1,975.7 $1,561.7 $3,421.4 $6,958.8 2.4% North Dakota $3,962.0 $577.9 $1,232.9 $5,772.8 17.4% Ohio $5,536.2 $3,290.7 $5,916.1 $14,743.0 4.0% Oklahoma $25,229.9 $2,176.5 $7,227.6 $34,634.0 28.1% Oregon $754.0 $656.1 $1,440.7 $2,850.8 2.3% Pennsylvania $10,246.1 $3,725.9 $9,022.2 $22,994.2 5.1% Rhode Island $377.2 $179.7 $466.4 $1,023.3 2.9% South Carolina $860.2 $617.8 $1,345.9 $2,823.9 2.3% South Dakota $314.5 $165.6 $426.5 $906.6 3.2% Tennessee $1,651.5 $1,154.9 $2,703.9 $5,510.3 2.7% Texas $113,964.8 $15,543.7 $50,530.0 $180,038.5 18.1% Utah $1,463.5 $686.3 $1,396.8 $3,546.6 4.0% Vermont $219.4 $104.2 $259.1 $582.7 2.9% Virginia $2,239.6 $1,542.4 $3,191.8 $6,973.8 2.3% Washington $1,768.9 $1,387.2 $2,951.6 $6,107.8 2.3% West Virginia $2,022.5 $508.1 $961.7 $3,492.2 8.0% Wisconsin $1,437.2 $1,028.1 $2,333.1 $4,798.4 2.6% Wyoming $3,194.6 $441.6 $713.7 $4,350.0 20.8% US Total $289,566.8 $84,406.7 $206,143.9 $580,117.3 5.2%
Source: PwC calculations using the IMPLAN modeling system (2015 database).

Impacts of the Oil and Natural Gas Industry on the US Economy
23
Table 9b.− Impact of the Oil and Natural Gas Industry’s Operations on Labor Income by State, 2015 (in $ Millions, Sorted by Labor Income Share)
State Direct Labor
Income
Indirect Labor
Income
Induced Labor Income
Total Contribution
Total Contribution as
a % of State Total Labor
Income
Oklahoma $25,229.9 $2,176.5 $7,227.6 $34,634.0 28.1% Wyoming $3,194.6 $441.6 $713.7 $4,350.0 20.8% Texas $113,964.8 $15,543.7 $50,530.0 $180,038.5 18.1% North Dakota $3,962.0 $577.9 $1,232.9 $5,772.8 17.4% Louisiana $15,910.1 $2,628.7 $4,820.3 $23,359.2 16.8% Alaska $3,108.5 $317.3 $963.2 $4,389.0 14.5% Colorado $15,074.7 $1,779.6 $6,244.6 $23,098.9 11.3% New Mexico $3,347.5 $563.8 $1,332.9 $5,244.2 10.0% Nebraska $3,228.3 $874.2 $2,310.5 $6,412.9 9.2% Kansas $4,955.7 $1,109.4 $2,047.7 $8,112.9 8.5% West Virginia $2,022.5 $508.1 $961.7 $3,492.2 8.0% Montana $1,204.7 $335.0 $604.2 $2,143.9 7.5% Mississippi $2,445.0 $647.4 $1,140.8 $4,233.2 6.4% Pennsylvania $10,246.1 $3,725.9 $9,022.2 $22,994.2 5.1% Arkansas $1,446.0 $652.4 $1,264.8 $3,363.2 4.6% Iowa $1,570.5 $1,014.0 $1,719.7 $4,304.2 4.1% Ohio $5,536.2 $3,290.7 $5,916.1 $14,743.0 4.0% Utah $1,463.5 $686.3 $1,396.8 $3,546.6 4.0% California $21,694.1 $10,935.2 $23,998.4 $56,627.7 3.8% Maine $483.0 $260.8 $501.2 $1,245.0 3.4% Minnesota $2,381.4 $1,541.1 $3,156.1 $7,078.5 3.3% South Dakota $314.5 $165.6 $426.5 $906.6 3.2% Alabama $1,520.3 $839.4 $1,669.9 $4,029.5 3.2% Indiana $2,011.4 $1,356.1 $2,746.9 $6,114.4 3.2% Illinois $4,462.8 $3,495.3 $6,901.7 $14,859.9 3.1% Kentucky $1,367.6 $772.9 $1,541.1 $3,681.6 3.0% Missouri $1,693.8 $1,256.8 $2,640.5 $5,591.2 3.0% Delaware $341.5 $235.0 $438.1 $1,014.5 2.9% New Hampshire $505.5 $277.9 $624.9 $1,408.2 2.9% Vermont $219.4 $104.2 $259.1 $582.7 2.9% Rhode Island $377.2 $179.7 $466.4 $1,023.3 2.9% New Jersey $2,756.1 $2,401.4 $4,972.9 $10,130.4 2.8% Idaho $432.9 $199.5 $530.0 $1,162.4 2.8% Michigan $2,504.2 $1,806.9 $3,923.4 $8,234.6 2.7% Tennessee $1,651.5 $1,154.9 $2,703.9 $5,510.3 2.7% Connecticut $1,570.9 $774.2 $2,062.9 $4,407.9 2.7% Wisconsin $1,437.2 $1,028.1 $2,333.1 $4,798.4 2.6% Nevada $554.6 $440.9 $1,075.2 $2,070.7 2.5% Arizona $1,229.1 $1,005.6 $2,285.5 $4,520.2 2.5% Georgia $2,213.8 $1,588.3 $3,665.3 $7,467.3 2.5% Massachusetts $2,104.2 $1,674.7 $4,011.3 $7,790.3 2.4% North Carolina $1,975.7 $1,561.7 $3,421.4 $6,958.8 2.4% New York $5,907.4 $4,226.9 $11,171.6 $21,305.9 2.4% Washington $1,768.9 $1,387.2 $2,951.6 $6,107.8 2.3% South Carolina $860.2 $617.8 $1,345.9 $2,823.9 2.3% Virginia $2,239.6 $1,542.4 $3,191.8 $6,973.8 2.3% Oregon $754.0 $656.1 $1,440.7 $2,850.8 2.3% Florida $2,582.5 $2,625.2 $6,708.7 $11,916.4 2.2% Hawaii $300.3 $200.6 $540.6 $1,041.6 2.1% Maryland $1,244.7 $919.3 $2,271.7 $4,435.7 2.0% District of Columbia $196.4 $302.2 $715.5 $1,214.1 1.3% US Total $289,566.8 $84,406.7 $206,143.9 $580,117.3 5.2%
Source: PwC calculations using the IMPLAN modeling system (2015 database).

Impacts of the Oil and Natural Gas Industry on the US Economy
24
Table 10a.− Impact of the Oil and Natural Gas Industry’s Operations on Value Added by State, 2015 (in $ Millions, Sorted Alphabetically)
State Direct Value
Added Indirect
Value Added Induced
Value Added Total
Contribution
Total Contribution as
a % of State GDP
Alabama $4,325 $1,499 $3,026 $8,851 4.2% Alaska $13,584 $564 $1,635 $15,783 28.9% Arizona $2,348 $1,721 $3,962 $8,031 2.7% Arkansas $4,667 $1,147 $2,323 $8,137 6.5% California $60,566 $17,939 $41,125 $119,631 4.9% Colorado $17,876 $2,741 $10,764 $31,382 9.7% Connecticut $2,485 $1,278 $3,487 $7,250 2.7% Delaware $958 $445 $913 $2,316 3.5% District of Columbia $745 $421 $946 $2,112 1.7% Florida $5,941 $4,458 $11,665 $22,063 2.5% Georgia $4,251 $2,770 $6,632 $13,653 2.7% Hawaii $1,059 $335 $949 $2,343 3.0% Idaho $587 $352 $872 $1,811 2.8% Illinois $15,728 $5,714 $11,905 $33,347 4.3% Indiana $7,061 $2,599 $5,186 $14,846 4.3% Iowa $1,994 $1,792 $3,117 $6,904 3.9% Kansas $6,828 $1,736 $3,548 $12,113 8.0% Kentucky $3,749 $1,356 $2,757 $7,862 3.9% Louisiana $37,800 $4,375 $8,555 $50,730 20.7% Maine $944 $447 $855 $2,246 3.9% Maryland $2,360 $1,522 $4,014 $7,896 2.1% Massachusetts $3,683 $2,569 $6,267 $12,519 2.6% Michigan $5,102 $2,844 $6,651 $14,597 3.0% Minnesota $6,398 $2,488 $5,350 $14,236 4.1% Mississippi $4,569 $1,139 $2,111 $7,819 7.2% Missouri $3,691 $2,152 $4,624 $10,467 3.5% Montana $3,267 $569 $1,024 $4,861 10.5% Nebraska $3,603 $1,468 $4,213 $9,283 8.0% Nevada $1,278 $815 $1,993 $4,087 2.9% New Hampshire $818 $438 $1,007 $2,262 3.1% New Jersey $9,040 $3,679 $8,253 $20,972 3.7% New Mexico $9,251 $1,021 $2,556 $12,827 13.3% New York $10,312 $7,104 $18,380 $35,796 2.5% North Carolina $3,782 $3,026 $6,598 $13,406 2.6% North Dakota $8,580 $988 $2,159 $11,727 21.1% Ohio $21,846 $5,573 $10,518 $37,938 6.1% Oklahoma $35,705 $3,531 $12,476 $51,712 27.3% Oregon $1,740 $1,106 $2,513 $5,358 2.5% Pennsylvania $23,799 $5,887 $14,770 $44,456 6.3% Rhode Island $721 $298 $796 $1,815 3.1% South Carolina $1,707 $1,087 $2,440 $5,234 2.6% South Dakota $567 $324 $782 $1,673 3.5% Tennessee $4,277 $1,894 $4,416 $10,586 3.3% Texas $215,325 $25,489 $85,560 $326,375 20.2% Utah $3,717 $1,204 $2,495 $7,416 5.0% Vermont $377 $184 $431 $992 3.2% Virginia $3,744 $2,506 $5,722 $11,972 2.4% Washington $5,228 $2,334 $5,280 $12,842 2.9% West Virginia $5,416 $934 $1,704 $8,054 10.9% Wisconsin $2,501 $1,769 $4,123 $8,393 2.7% Wyoming $6,694 $846 $1,397 $8,936 22.7% US Total $602,592 $140,481 $354,846 $1,097,920 6.1%
Source: PwC calculations using the IMPLAN modeling system (2015 database). Labor income includes wages and salaries and benefits as well as proprietors' income.

Impacts of the Oil and Natural Gas Industry on the US Economy
25
Table 10b.− Impact of the Oil and Natural Gas Industry’s Operations on Value Added by State, 2015 (in $ Millions, Sorted by Value Added Share)
State Direct Value
Added Indirect
Value Added Induced
Value Added Total
Contribution
Total Contribution as
a % of State GDP
Alaska $13,584 $564 $1,635 $15,783 28.9% Oklahoma $35,705 $3,531 $12,476 $51,712 27.3% Wyoming $6,694 $846 $1,397 $8,936 22.7% North Dakota $8,580 $988 $2,159 $11,727 21.1% Louisiana $37,800 $4,375 $8,555 $50,730 20.7% Texas $215,325 $25,489 $85,560 $326,375 20.2% New Mexico $9,251 $1,021 $2,556 $12,827 13.3% West Virginia $5,416 $934 $1,704 $8,054 10.9% Montana $3,267 $569 $1,024 $4,861 10.5% Colorado $17,876 $2,741 $10,764 $31,382 9.7% Nebraska $3,603 $1,468 $4,213 $9,283 8.0% Kansas $6,828 $1,736 $3,548 $12,113 8.0% Mississippi $4,569 $1,139 $2,111 $7,819 7.2% Arkansas $4,667 $1,147 $2,323 $8,137 6.5% Pennsylvania $23,799 $5,887 $14,770 $44,456 6.3% Ohio $21,846 $5,573 $10,518 $37,938 6.1% Utah $3,717 $1,204 $2,495 $7,416 5.0% California $60,566 $17,939 $41,125 $119,631 4.9% Indiana $7,061 $2,599 $5,186 $14,846 4.3% Illinois $15,728 $5,714 $11,905 $33,347 4.3% Alabama $4,325 $1,499 $3,026 $8,851 4.2% Minnesota $6,398 $2,488 $5,350 $14,236 4.1% Kentucky $3,749 $1,356 $2,757 $7,862 3.9% Maine $944 $447 $855 $2,246 3.9% Iowa $1,994 $1,792 $3,117 $6,904 3.9% New Jersey $9,040 $3,679 $8,253 $20,972 3.7% South Dakota $567 $324 $782 $1,673 3.5% Missouri $3,691 $2,152 $4,624 $10,467 3.5% Delaware $958 $445 $913 $2,316 3.5% Tennessee $4,277 $1,894 $4,416 $10,586 3.3% Vermont $377 $184 $431 $992 3.2% Rhode Island $721 $298 $796 $1,815 3.1% New Hampshire $818 $438 $1,007 $2,262 3.1% Michigan $5,102 $2,844 $6,651 $14,597 3.0% Hawaii $1,059 $335 $949 $2,343 3.0% Washington $5,228 $2,334 $5,280 $12,842 2.9% Nevada $1,278 $815 $1,993 $4,087 2.9% Idaho $587 $352 $872 $1,811 2.8% Connecticut $2,485 $1,278 $3,487 $7,250 2.7% Wisconsin $2,501 $1,769 $4,123 $8,393 2.7% Georgia $4,251 $2,770 $6,632 $13,653 2.7% Arizona $2,348 $1,721 $3,962 $8,031 2.7% North Carolina $3,782 $3,026 $6,598 $13,406 2.6% South Carolina $1,707 $1,087 $2,440 $5,234 2.6% Massachusetts $3,683 $2,569 $6,267 $12,519 2.6% Oregon $1,740 $1,106 $2,513 $5,358 2.5% New York $10,312 $7,104 $18,380 $35,796 2.5% Florida $5,941 $4,458 $11,665 $22,063 2.5% Virginia $3,744 $2,506 $5,722 $11,972 2.4% Maryland $2,360 $1,522 $4,014 $7,896 2.1% District of Columbia $745 $421 $946 $2,112 1.7% US Total $602,592 $140,481 $354,846 $1,097,920 6.1%
Source: PwC calculations using the IMPLAN modeling system (2015 database). Labor income includes wages and salaries and benefits as well as proprietors' income.

Impacts of the Oil and Natural Gas Industry on the US Economy
26
V. Wages, Capital Spending, and Dividends from the Oil and Natural Gas Industry
As shown in the previous section, the US oil and natural gas industry’s direct labor income in 2015 is estimated to be $289.6 billion and capital expenditures are estimated to be $235.3 billion in 2015.7 One measure of the industry’s total “spend” is the sum of the industry labor income, capital expenditures, and dividend payments.
Total dividends paid by the industry were obtained from S&P’s Compustat North America® database for US-headquartered companies in the oil and natural gas industry.8 Excluding distributions from Master Limited Partnerships and other pass-through entities,9 PwC estimates that the industry paid out a total of $44.4 billion in dividends in 2015, including dividends paid to individuals, retirement plans, foreign shareholders, and other businesses.
Using this measure of total “spend” (consisting of the estimated direct labor income, capital expenditures, and dividend payments), the industry’s total “spend” amounted to $569.3 billion in 2015.
Another source for the industry’s annual capital expenditures is a survey published annually by the Oil & Gas Journal, which puts the industry’s 2015 US capital expenditures at $182.4 billion.10 If this estimate of the industry’s capital expenditures is used for the purpose of computing the industry’s total “spend” as defined above, the industry’s total “spend” was $516.4 billion in 2015.
7 The Census Bureau defines capital expenditures to include “all capitalized costs” incurred during the year for structures and equipment “chargeable to asset accounts, and for which depreciation and amortization accounts are ordinarily maintained.” 8 The measure of dividends used includes cash dividends from all classes of common stock, cash paid in lieu of fractional shares, liquidation payments to shareholders and other cash distributions to shareholders. It also includes dividends paid to US shareholders out of income from US operations by foreign corporations. It does not include the dollar value of stock dividends or dividends paid or accrued on preferred stock. 9 Distributions from pass-through entities are included as proprietors’ income in PwC’s estimate of direct labor income. 10 Oil & Gas Journal, March 7, 2016, available at: http://www.ogj.com/articles/print/volume-114/issue-3/special-report-capital-spending-outlook/capital-expenditures-to-be-squeezed-further-in-2016.html.

Impacts of the Oil and Natural Gas Industry on the US Economy
27
Appendix A: Detailed State-by-State Operational Impact Results

Impacts of the Oil and Natural Gas Industry on the US Economy
28
The Economic Impact of the Oil and Natural Gas Industry in Alabama, 2015
Employment*
Sector Description Direct Indirect Induced Total As a % of State
Total
Direct Operational Impact of the Oil and Natural Gas Industry 33,835 33,835 1.3%
Indirect and Induced Operational Impacts on Other Industries Services 6,448 19,061 25,509 Wholesale and retail trade 1,232 5,813 7,045 Finance, insurance, real estate, rental and leasing 1,829 4,101 5,930 Manufacturing 2,026 3,422 5,447 Transportation and warehousing 1,726 1,333 3,059 Construction 747 412 1,159 Agriculture 151 998 1,149 Information 206 440 646 Utilities 146 277 423 Mining 169 80 250 Other 542 1,370 1,912
Total Operational Impact on Employment 33,835 15,221 37,308 86,364 3.4%
Labor Income** ($ Millions)
Sector Description Direct Indirect Induced Total As a % of State
Total
Direct Operational Impact of the Oil and Natural Gas Industry $1,520.3 $1,520.3 1.2%
Indirect and Induced Operational Impacts on Other Industries Services $309.6 $750.8 $1,060.3 Manufacturing $140.0 $214.7 $354.7 Wholesale and retail trade $77.1 $219.2 $296.3 Finance, insurance, real estate, rental and leasing $90.2 $178.4 $268.6 Transportation and warehousing $92.6 $69.4 $161.9 Agriculture $7.8 $49.4 $57.1 Utilities $19.9 $37.0 $56.9 Construction $35.8 $20.0 $55.8 Information $14.7 $30.2 $44.9 Mining $15.0 $6.9 $21.9 Other $36.8 $94.0 $130.8
Total Operational Impact on Labor Income $1,520.3 $839.4 $1,669.9 $4,029.5 3.2%
Value Added ($ Millions)
Sector Description Direct Indirect Induced Total As a % of State
Total
Direct Operational Impact of the Oil and Natural Gas Industry $4,325.3 $4,325.3 2.0%
Indirect and Induced Operational Impacts on Other Industries Services $378.3 $912.2 $1,290.5 Finance, insurance, real estate, rental and leasing $329.1 $808.9 $1,138.0 Manufacturing $271.8 $403.7 $675.5 Wholesale and retail trade $140.1 $379.9 $520.0 Transportation and warehousing $117.8 $85.3 $203.1 Utilities $54.7 $101.9 $156.6 Information $35.8 $87.6 $123.4 Mining $65.4 $29.6 $95.0 Construction $45.2 $25.1 $70.3 Agriculture $8.5 $57.4 $65.9 Other $52.8 $134.7 $187.5
Total Operational Impact on Value Added $4,325.3 $1,499.4 $3,026.3 $8,851.0 4.2% Source: PwC calculations using the IMPLAN modeling system (2015 database). * Employment is defined as the number of payroll and self-employed jobs, including part-time jobs.

Impacts of the Oil and Natural Gas Industry on the US Economy
29
The Economic Impact of the Oil and Natural Gas Industry in Alaska, 2015
Employment*
Sector Description Direct Indirect Induced Total As a % of
State Total
Direct Operational Impact of the Oil and Natural Gas Industry 21,526
21,526 4.6%
Indirect and Induced Operational Impacts on Other Industries
Services
2,182 10,715 12,898
Wholesale and retail trade
436 3,268 3,703
Finance, insurance, real estate, rental and leasing
699 1,907 2,606
Transportation and warehousing
441 697 1,137
Construction
482 190 672
Manufacturing
104 382 486
Information
93 283 377
Mining
210 83 293
Agriculture
17 170 186
Utilities
46 111 157
Other
237 979 1,216
Total Operational Impact on Employment 21,526 4,946 18,785 45,257 9.7%
Labor Income** ($ Millions)
Sector Description Direct Indirect Induced Total As a % of
State Total
Direct Operational Impact of the Oil and Natural Gas Industry $3,108.5
$3,108.5 10.3%
Indirect and Induced Operational Impacts on Other Industries
Services
$136.2 $538.6 $674.8
Wholesale and retail trade
$22.5 $124.5 $147.1
Finance, insurance, real estate, rental and leasing
$35.8 $86.4 $122.2
Transportation and warehousing
$30.1 $44.1 $74.2
Construction
$37.2 $14.6 $51.9
Information
$7.5 $23.0 $30.5
Manufacturing
$5.3 $20.0 $25.3
Utilities
$5.8 $14.1 $19.9
Mining
$14.4 $5.4 $19.9
Agriculture
$0.8 $4.1 $5.0
Other $21.6 $88.1 $109.8 Total Operational Impact on Labor Income $3,108.5 $317.3 $963.2 $4,389.0 14.5%
Value Added ($ Millions)
Sector Description Direct Indirect Induced Total As a % of
State Total
Direct Operational Impact of the Oil and Natural Gas Industry $13,583.5
$13,583.5 24.9%
Indirect and Induced Operational Impacts on Other Industries
Services
$165.2 $628.2 $793.4
Finance, insurance, real estate, rental and leasing
$120.9 $480.0 $600.9
Wholesale and retail trade
$46.8 $193.2 $240.0
Transportation and warehousing
$41.2 $62.3 $103.5
Mining
$75.1 $28.1 $103.2
Information
$18.9 $61.8 $80.8
Construction
$50.1 $19.7 $69.9
Utilities
$13.7 $33.0 $46.6
Manufacturing
$8.1 $26.5 $34.6
Agriculture
$0.9 $7.1 $8.0
Other
$23.5 $95.3 $118.7
Total Operational Impact on Value Added $13,583.5 $564.4 $1,635.1 $15,783.0 28.9%
Source: PwC calculations using the IMPLAN modeling system (2015 database). * Employment is defined as the number of payroll and self-employed jobs, including part-time jobs. ** Labor income is defined as wages and salaries and benefits as well as proprietors' income.

Impacts of the Oil and Natural Gas Industry on the US Economy
30
The Economic Impact of the Oil and Natural Gas Industry in Arizona, 2015
Employment*
Sector Description Direct Indirect Induced Total As a % of
State Total
Direct Operational Impact of the Oil and Natural Gas Industry 31,756
31,756 0.9%
Indirect and Induced Operational Impacts on Other Industries
Services
8,049 25,562 33,611
Finance, insurance, real estate, rental and leasing
2,704 7,014 9,718
Wholesale and retail trade
1,154 6,628 7,782
Manufacturing
1,192 1,993 3,185
Transportation and warehousing
1,401 1,643 3,044
Construction
933 492 1,425
Information
340 747 1,088
Agriculture
75 885 960
Mining
358 174 532
Utilities
129 259 388
Other
491 1,325 1,816
Total Operational Impact on Employment 31,756 16,827 46,722 95,304 2.7%
Labor Income** ($ Millions)
Sector Description Direct Indirect Induced Total As a % of
State Total
Direct Operational Impact of the Oil and Natural Gas Industry $1,229.1
$1,229.1 0.7%
Indirect and Induced Operational Impacts on Other Industries
Services
$446.4 $1,177.4 $1,623.8
Finance, insurance, real estate, rental and leasing
$147.1 $317.6 $464.6
Wholesale and retail trade
$82.7 $296.5 $379.2
Manufacturing
$86.0 $135.4 $221.3
Transportation and warehousing
$78.1 $93.0 $171.1
Information
$27.6 $55.4 $83.0
Construction
$44.4 $23.6 $68.0
Utilities
$17.9 $35.0 $52.9
Mining
$35.5 $16.7 $52.2
Agriculture
$2.9 $34.8 $37.7
Other $36.9 $100.3 $137.2 Total Operational Impact on Labor Income $1,229.1 $1,005.6 $2,285.5 $4,520.2 2.5%
Value Added ($ Millions)
Sector Description Direct Indirect Induced Total As a % of
State Total
Direct Operational Impact of the Oil and Natural Gas Industry $2,347.8
$2,347.8 0.8%
Indirect and Induced Operational Impacts on Other Industries
Services
$546.6 $1,420.4 $1,967.0
Finance, insurance, real estate, rental and leasing
$421.9 $1,155.6 $1,577.6
Wholesale and retail trade
$145.0 $515.1 $660.1
Manufacturing
$133.0 $219.1 $352.1
Transportation and warehousing
$111.1 $140.1 $251.2
Mining
$138.5 $63.9 $202.4
Information
$52.0 $123.9 $175.9
Utilities
$55.3 $108.7 $163.9
Construction
$64.0 $33.9 $97.9
Agriculture
$3.7 $45.4 $49.1
Other
$50.3 $136.2 $186.5
Total Operational Impact on Value Added $2,347.8 $1,721.4 $3,962.2 $8,031.5 2.7%
Source: PwC calculations using the IMPLAN modeling system (2015 database). * Employment is defined as the number of payroll and self-employed jobs, including part-time jobs. ** Labor income is defined as wages and salaries and benefits as well as proprietors' income.
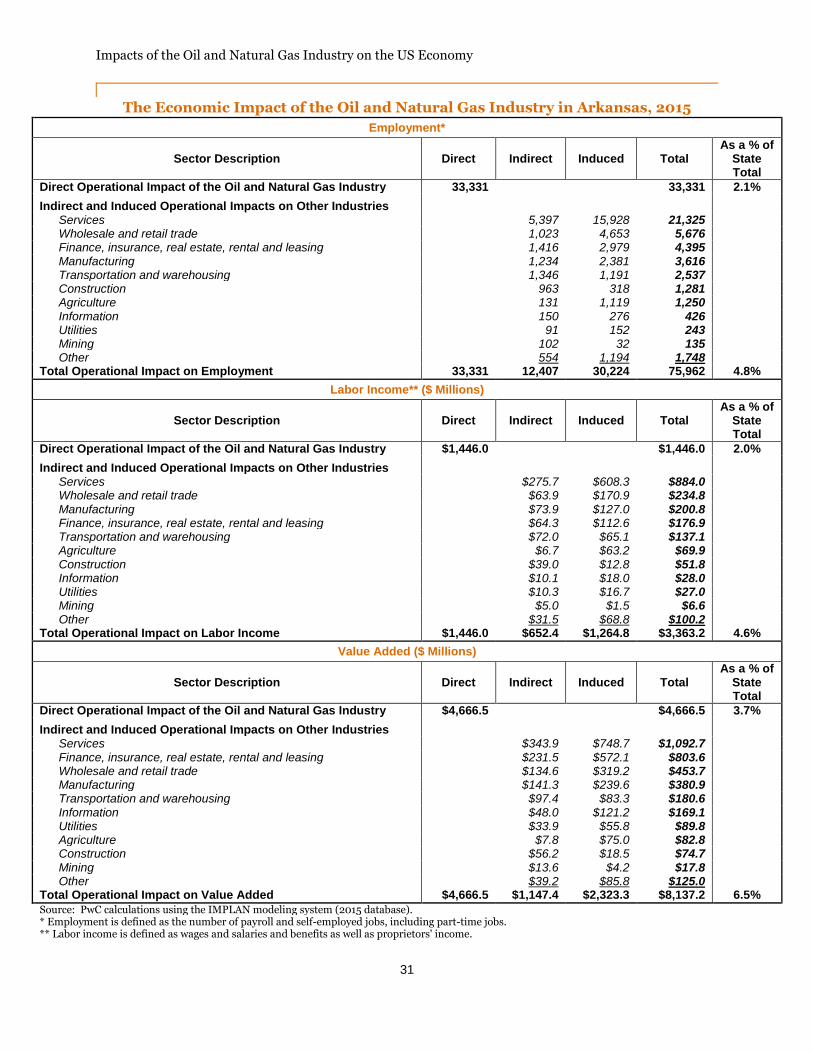
Impacts of the Oil and Natural Gas Industry on the US Economy
31
The Economic Impact of the Oil and Natural Gas Industry in Arkansas, 2015
Employment*
Sector Description Direct Indirect Induced Total As a % of
State Total
Direct Operational Impact of the Oil and Natural Gas Industry 33,331
33,331 2.1%
Indirect and Induced Operational Impacts on Other Industries
Services
5,397 15,928 21,325
Wholesale and retail trade
1,023 4,653 5,676
Finance, insurance, real estate, rental and leasing
1,416 2,979 4,395
Manufacturing
1,234 2,381 3,616
Transportation and warehousing
1,346 1,191 2,537
Construction
963 318 1,281
Agriculture
131 1,119 1,250
Information
150 276 426
Utilities
91 152 243
Mining
102 32 135
Other
554 1,194 1,748
Total Operational Impact on Employment 33,331 12,407 30,224 75,962 4.8%
Labor Income** ($ Millions)
Sector Description Direct Indirect Induced Total As a % of
State Total
Direct Operational Impact of the Oil and Natural Gas Industry $1,446.0
$1,446.0 2.0%
Indirect and Induced Operational Impacts on Other Industries
Services
$275.7 $608.3 $884.0
Wholesale and retail trade
$63.9 $170.9 $234.8
Manufacturing
$73.9 $127.0 $200.8
Finance, insurance, real estate, rental and leasing
$64.3 $112.6 $176.9
Transportation and warehousing
$72.0 $65.1 $137.1
Agriculture
$6.7 $63.2 $69.9
Construction
$39.0 $12.8 $51.8
Information
$10.1 $18.0 $28.0
Utilities
$10.3 $16.7 $27.0
Mining
$5.0 $1.5 $6.6
Other $31.5 $68.8 $100.2 Total Operational Impact on Labor Income $1,446.0 $652.4 $1,264.8 $3,363.2 4.6%
Value Added ($ Millions)
Sector Description Direct Indirect Induced Total As a % of
State Total
Direct Operational Impact of the Oil and Natural Gas Industry $4,666.5
$4,666.5 3.7%
Indirect and Induced Operational Impacts on Other Industries
Services
$343.9 $748.7 $1,092.7
Finance, insurance, real estate, rental and leasing
$231.5 $572.1 $803.6
Wholesale and retail trade
$134.6 $319.2 $453.7
Manufacturing
$141.3 $239.6 $380.9
Transportation and warehousing
$97.4 $83.3 $180.6
Information
$48.0 $121.2 $169.1
Utilities
$33.9 $55.8 $89.8
Agriculture
$7.8 $75.0 $82.8
Construction
$56.2 $18.5 $74.7
Mining
$13.6 $4.2 $17.8
Other
$39.2 $85.8 $125.0
Total Operational Impact on Value Added $4,666.5 $1,147.4 $2,323.3 $8,137.2 6.5%
Source: PwC calculations using the IMPLAN modeling system (2015 database). * Employment is defined as the number of payroll and self-employed jobs, including part-time jobs. ** Labor income is defined as wages and salaries and benefits as well as proprietors' income.

Impacts of the Oil and Natural Gas Industry on the US Economy
32
The Economic Impact of the Oil and Natural Gas Industry in California, 2015
Employment*
Sector Description Direct Indirect Induced Total As a % of
State Total
Direct Operational Impact of the Oil and Natural Gas Industry 183,757
183,757 0.8%
Indirect and Induced Operational Impacts on Other Industries
Services
67,482 227,207 294,689
Wholesale and retail trade
13,967 57,124 71,092
Finance, insurance, real estate, rental and leasing
17,143 50,338 67,480
Manufacturing
11,362 22,290 33,653
Transportation and warehousing
14,728 14,929 29,657
Information
3,295 8,167 11,462
Construction
7,771 3,691 11,462
Agriculture
893 9,850 10,742
Utilities
340 770 1,109
Mining
392 147 539
Other
4,259 10,709 14,968
Total Operational Impact on Employment 183,757 141,629 405,222 730,608 3.2%
Labor Income** ($ Millions)
Sector Description Direct Indirect Induced Total As a % of
State Total
Direct Operational Impact of the Oil and Natural Gas Industry $21,694.1
$21,694.1 1.4%
Indirect and Induced Operational Impacts on Other Industries
Services
$4,963.9 $11,840.8 $16,804.7
Finance, insurance, real estate, rental and leasing
$1,264.4 $3,099.9 $4,364.3
Wholesale and retail trade
$1,112.5 $2,821.9 $3,934.4
Manufacturing
$1,021.5 $1,832.3 $2,853.7
Information
$674.9 $1,444.1 $2,119.0
Transportation and warehousing
$886.1 $891.4 $1,777.5
Agriculture
$52.7 $618.6 $671.2
Construction
$442.5 $210.7 $653.3
Utilities
$58.6 $129.3 $188.0
Mining
$24.3 $8.7 $33.0
Other $433.8 $1,100.7 $1,534.5 Total Operational Impact on Labor Income $21,694.1 $10,935.2 $23,998.4 $56,627.7 3.8%
Value Added ($ Millions)
Sector Description Direct Indirect Induced Total As a % of
State Total
Direct Operational Impact of the Oil and Natural Gas Industry $60,565.9
$60,565.9 2.5%
Indirect and Induced Operational Impacts on Other Industries
Services
$6,085.1 $14,243.5 $20,328.6
Finance, insurance, real estate, rental and leasing
$3,804.6 $11,073.6 $14,878.2
Wholesale and retail trade
$2,072.5 $5,039.3 $7,111.8
Manufacturing
$2,158.4 $3,631.5 $5,789.9
Information
$1,163.5 $3,089.9 $4,253.4
Transportation and warehousing
$1,104.5 $1,091.4 $2,195.9
Construction
$671.8 $319.6 $991.4
Agriculture
$66.3 $790.0 $856.4
Utilities
$187.2 $405.7 $592.9
Mining
$66.8 $24.2 $91.0
Other
$558.7 $1,416.6 $1,975.3
Total Operational Impact on Value Added $60,565.9 $17,939.5 $41,125.3 $119,630.7 4.9%
Source: PwC calculations using the IMPLAN modeling system (2015 database). * Employment is defined as the number of payroll and self-employed jobs, including part-time jobs. ** Labor income is defined as wages and salaries and benefits as well as proprietors' income.

Impacts of the Oil and Natural Gas Industry on the US Economy
33
The Economic Impact of the Oil and Natural Gas Industry in Colorado, 2015
Employment*
Sector Description Direct Indirect Induced Total As a % of
State Total
Direct Operational Impact of the Oil and Natural Gas Industry 78,305
78,305 2.2%
Indirect and Induced Operational Impacts on Other Industries
Services
12,063 71,422 83,485
Finance, insurance, real estate, rental and leasing
4,017 19,536 23,553
Wholesale and retail trade
2,392 20,196 22,588
Transportation and warehousing
1,758 3,826 5,584
Manufacturing
1,671 3,157 4,828
Construction
2,094 1,486 3,580
Information
602 2,311 2,913
Agriculture
96 1,482 1,578
Utilities
121 377 498
Mining
283 109 393
Other
908 4,695 5,603
Total Operational Impact on Employment 78,305 26,005 128,597 232,907 6.5%
Labor Income** ($ Millions)
Sector Description Direct Indirect Induced Total As a % of
State Total
Direct Operational Impact of the Oil and Natural Gas Industry $15,074.7
$15,074.7 7.3%
Indirect and Induced Operational Impacts on Other Industries
Services
$837.3 $3,295.4 $4,132.7
Finance, insurance, real estate, rental and leasing
$228.6 $829.5 $1,058.1
Wholesale and retail trade
$175.7 $866.5 $1,042.2
Information
$91.1 $295.2 $386.3
Manufacturing
$123.2 $218.2 $341.4
Transportation and warehousing
$103.2 $223.7 $326.9
Construction
$108.1 $77.5 $185.7
Utilities
$16.9 $52.1 $69.0
Agriculture
$3.2 $50.9 $54.1
Mining
$27.8 $10.2 $38.1
Other $64.5 $325.3 $389.8 Total Operational Impact on Labor Income $15,074.7 $1,779.6 $6,244.6 $23,098.9 11.3%
Value Added ($ Millions)
Sector Description Direct Indirect Induced Total As a % of
State Total
Direct Operational Impact of the Oil and Natural Gas Industry $17,876.4
$17,876.4 5.5%
Indirect and Induced Operational Impacts on Other Industries
Services
$1,020.6 $3,986.6 $5,007.2
Finance, insurance, real estate, rental and leasing
$557.3 $3,199.1 $3,756.4
Wholesale and retail trade
$288.1 $1,430.8 $1,718.9
Information
$172.0 $653.0 $825.0
Manufacturing
$195.6 $412.1 $607.6
Transportation and warehousing
$136.6 $290.4 $427.0
Construction
$142.5 $101.5 $244.0
Utilities
$58.0 $178.5 $236.4
Mining
$85.2 $32.1 $117.3
Agriculture
$4.6 $76.4 $81.0
Other
$80.6 $403.9 $484.4
Total Operational Impact on Value Added $17,876.4 $2,740.8 $10,764.4 $31,381.6 9.7%
Source: PwC calculations using the IMPLAN modeling system (2015 database). * Employment is defined as the number of payroll and self-employed jobs, including part-time jobs. ** Labor income is defined as wages and salaries and benefits as well as proprietors' income.

Impacts of the Oil and Natural Gas Industry on the US Economy
34
The Economic Impact of the Oil and Natural Gas Industry in Connecticut, 2015
Employment*
Sector Description Direct Indirect Induced Total As a % of
State Total
Direct Operational Impact of the Oil and Natural Gas Industry 16,280
16,280 0.7%
Indirect and Induced Operational Impacts on Other Industries
Services
3,970 16,831 20,801
Finance, insurance, real estate, rental and leasing
1,185 4,153 5,338
Wholesale and retail trade
610 4,220 4,830
Manufacturing
1,185 1,605 2,790
Transportation and warehousing
770 970 1,740
Information
204 508 712
Construction
277 291 567
Agriculture
23 219 242
Utilities
40 87 127
Mining
46 16 62
Other
210 774 984
Total Operational Impact on Employment 16,280 8,518 29,676 54,474 2.4%
Labor Income** ($ Millions)
Sector Description Direct Indirect Induced Total As a % of
State Total
Direct Operational Impact of the Oil and Natural Gas Industry $1,570.9
$1,570.9 1.0%
Indirect and Induced Operational Impacts on Other Industries
Services
$338.8 $989.3 $1,328.1
Finance, insurance, real estate, rental and leasing
$137.7 $467.3 $605.0
Wholesale and retail trade
$57.4 $228.1 $285.4
Manufacturing
$115.9 $143.3 $259.2
Transportation and warehousing
$48.7 $58.5 $107.2
Information
$28.4 $63.6 $92.0
Construction
$16.4 $18.5 $34.9
Utilities
$8.0 $16.8 $24.8
Agriculture
$0.6 $4.9 $5.4
Mining
$2.1 $0.7 $2.8
Other $20.0 $71.9 $91.9 Total Operational Impact on Labor Income $1,570.9 $774.2 $2,062.9 $4,407.9 2.7%
Value Added ($ Millions)
Sector Description Direct Indirect Induced Total As a % of
State Total
Direct Operational Impact of the Oil and Natural Gas Industry $2,485.3
$2,485.3 0.9%
Indirect and Induced Operational Impacts on Other Industries
Services
$414.4 $1,202.5 $1,616.9
Finance, insurance, real estate, rental and leasing
$332.1 $1,172.1 $1,504.2
Wholesale and retail trade
$113.4 $402.7 $516.1
Manufacturing
$183.2 $259.7 $442.8
Information
$73.8 $175.0 $248.8
Transportation and warehousing
$70.9 $76.4 $147.4
Utilities
$32.6 $66.9 $99.5
Construction
$21.2 $22.8 $44.0
Mining
$7.8 $2.6 $10.4
Agriculture
$0.7 $6.3 $7.0
Other
$28.0 $99.5 $127.4
Total Operational Impact on Value Added $2,485.3 $1,278.0 $3,486.7 $7,250.0 2.7%
Source: PwC calculations using the IMPLAN modeling system (2015 database). * Employment is defined as the number of payroll and self-employed jobs, including part-time jobs. ** Labor income is defined as wages and salaries and benefits as well as proprietors' income.

Impacts of the Oil and Natural Gas Industry on the US Economy
35
The Economic Impact of the Oil and Natural Gas Industry in Delaware, 2015
Employment*
Sector Description Direct Indirect Induced Total As a % of
State Total
Direct Operational Impact of the Oil and Natural Gas Industry 5,176
5,176 0.9%
Indirect and Induced Operational Impacts on Other Industries
Services
1,309 3,999 5,308
Wholesale and retail trade
338 1,129 1,466
Finance, insurance, real estate, rental and leasing
379 1,080 1,459
Transportation and warehousing
412 281 694
Manufacturing
171 445 616
Construction
264 75 339
Information
39 82 121
Agriculture
6 80 87
Utilities
19 31 50
Mining
4 1 5
Other
159 226 385
Total Operational Impact on Employment 5,176 3,100 7,430 15,706 2.8%
Labor Income** ($ Millions)
Sector Description Direct Indirect Induced Total As a % of
State Total
Direct Operational Impact of the Oil and Natural Gas Industry $341.5
$341.5 1.0%
Indirect and Induced Operational Impacts on Other Industries
Services
$92.4 $207.0 $299.3
Finance, insurance, real estate, rental and leasing
$33.9 $82.3 $116.2
Wholesale and retail trade
$27.1 $48.0 $75.2
Manufacturing
$16.3 $32.5 $48.8
Transportation and warehousing
$25.9 $16.5 $42.4
Information
$10.1 $14.7 $24.8
Construction
$13.8 $3.9 $17.6
Agriculture
$0.7 $11.1 $11.8
Utilities
$2.9 $4.6 $7.5
Mining
$0.2 $0.1 $0.3
Other $11.7 $17.4 $29.0 Total Operational Impact on Labor Income $341.5 $235.0 $438.1 $1,014.5 2.9%
Value Added ($ Millions)
Sector Description Direct Indirect Induced Total As a % of
State Total
Direct Operational Impact of the Oil and Natural Gas Industry $957.6
$957.6 1.4%
Indirect and Induced Operational Impacts on Other Industries
Finance, insurance, real estate, rental and leasing
$156.8 $418.2 $575.0
Services
$117.7 $251.3 $369.0
Wholesale and retail trade
$45.7 $74.1 $119.8
Manufacturing
$35.5 $70.3 $105.8
Transportation and warehousing
$30.1 $18.5 $48.5
Information
$15.7 $28.0 $43.7
Construction
$20.1 $5.7 $25.8
Utilities
$7.7 $12.4 $20.1
Agriculture
$0.8 $12.5 $13.3
Mining
$0.5 $0.2 $0.6
Other
$14.7 $22.1 $36.8
Total Operational Impact on Value Added $957.6 $445.2 $913.3 $2,316.1 3.5%
Source: PwC calculations using the IMPLAN modeling system (2015 database). * Employment is defined as the number of payroll and self-employed jobs, including part-time jobs. ** Labor income is defined as wages and salaries and benefits as well as proprietors' income.
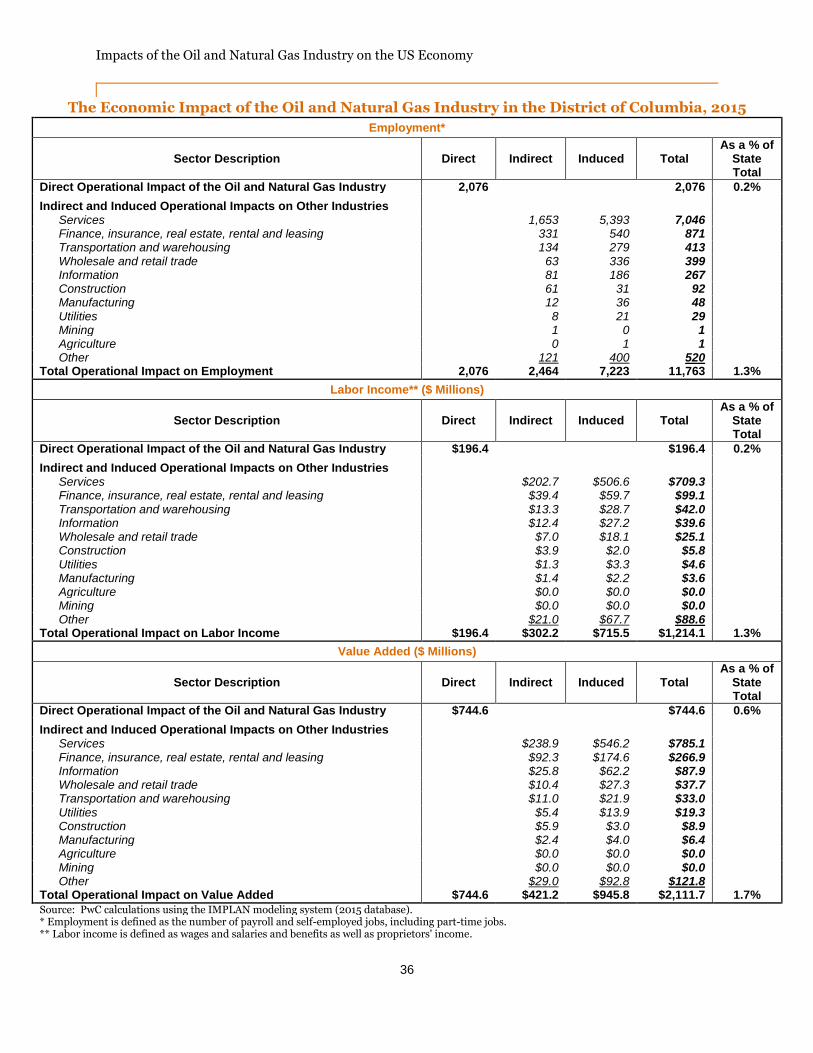
Impacts of the Oil and Natural Gas Industry on the US Economy
36
The Economic Impact of the Oil and Natural Gas Industry in the District of Columbia, 2015
Employment*
Sector Description Direct Indirect Induced Total As a % of
State Total
Direct Operational Impact of the Oil and Natural Gas Industry 2,076
2,076 0.2%
Indirect and Induced Operational Impacts on Other Industries
Services
1,653 5,393 7,046
Finance, insurance, real estate, rental and leasing
331 540 871
Transportation and warehousing
134 279 413
Wholesale and retail trade
63 336 399
Information
81 186 267
Construction
61 31 92
Manufacturing
12 36 48
Utilities
8 21 29
Mining
1 0 1
Agriculture
0 1 1
Other
121 400 520
Total Operational Impact on Employment 2,076 2,464 7,223 11,763 1.3%
Labor Income** ($ Millions)
Sector Description Direct Indirect Induced Total As a % of
State Total
Direct Operational Impact of the Oil and Natural Gas Industry $196.4
$196.4 0.2%
Indirect and Induced Operational Impacts on Other Industries
Services
$202.7 $506.6 $709.3
Finance, insurance, real estate, rental and leasing
$39.4 $59.7 $99.1
Transportation and warehousing
$13.3 $28.7 $42.0
Information
$12.4 $27.2 $39.6
Wholesale and retail trade
$7.0 $18.1 $25.1
Construction
$3.9 $2.0 $5.8
Utilities
$1.3 $3.3 $4.6
Manufacturing
$1.4 $2.2 $3.6
Agriculture
$0.0 $0.0 $0.0
Mining
$0.0 $0.0 $0.0
Other $21.0 $67.7 $88.6 Total Operational Impact on Labor Income $196.4 $302.2 $715.5 $1,214.1 1.3%
Value Added ($ Millions)
Sector Description Direct Indirect Induced Total As a % of
State Total
Direct Operational Impact of the Oil and Natural Gas Industry $744.6
$744.6 0.6%
Indirect and Induced Operational Impacts on Other Industries
Services
$238.9 $546.2 $785.1
Finance, insurance, real estate, rental and leasing
$92.3 $174.6 $266.9
Information
$25.8 $62.2 $87.9
Wholesale and retail trade
$10.4 $27.3 $37.7
Transportation and warehousing
$11.0 $21.9 $33.0
Utilities
$5.4 $13.9 $19.3
Construction
$5.9 $3.0 $8.9
Manufacturing
$2.4 $4.0 $6.4
Agriculture
$0.0 $0.0 $0.0
Mining
$0.0 $0.0 $0.0
Other
$29.0 $92.8 $121.8
Total Operational Impact on Value Added $744.6 $421.2 $945.8 $2,111.7 1.7%
Source: PwC calculations using the IMPLAN modeling system (2015 database). * Employment is defined as the number of payroll and self-employed jobs, including part-time jobs. ** Labor income is defined as wages and salaries and benefits as well as proprietors' income.
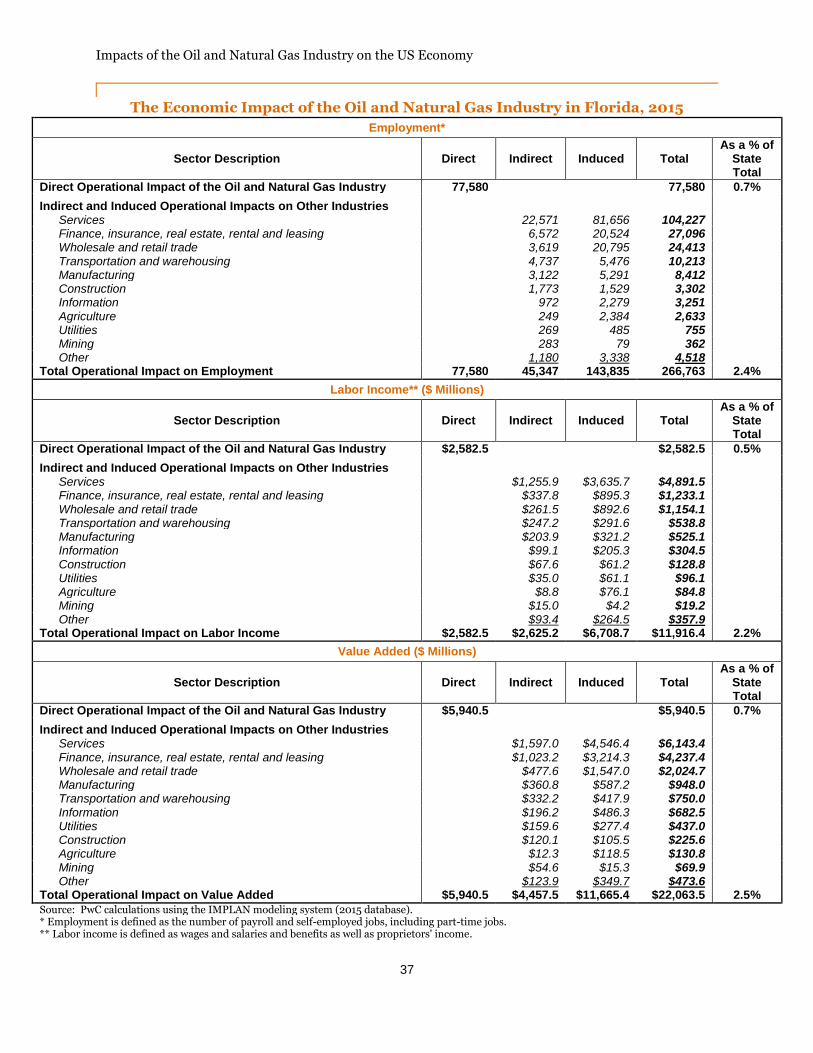
Impacts of the Oil and Natural Gas Industry on the US Economy
37
The Economic Impact of the Oil and Natural Gas Industry in Florida, 2015
Employment*
Sector Description Direct Indirect Induced Total As a % of
State Total
Direct Operational Impact of the Oil and Natural Gas Industry 77,580
77,580 0.7%
Indirect and Induced Operational Impacts on Other Industries
Services
22,571 81,656 104,227
Finance, insurance, real estate, rental and leasing
6,572 20,524 27,096
Wholesale and retail trade
3,619 20,795 24,413
Transportation and warehousing
4,737 5,476 10,213
Manufacturing
3,122 5,291 8,412
Construction
1,773 1,529 3,302
Information
972 2,279 3,251
Agriculture
249 2,384 2,633
Utilities
269 485 755
Mining
283 79 362
Other
1,180 3,338 4,518
Total Operational Impact on Employment 77,580 45,347 143,835 266,763 2.4%
Labor Income** ($ Millions)
Sector Description Direct Indirect Induced Total As a % of
State Total
Direct Operational Impact of the Oil and Natural Gas Industry $2,582.5
$2,582.5 0.5%
Indirect and Induced Operational Impacts on Other Industries
Services
$1,255.9 $3,635.7 $4,891.5
Finance, insurance, real estate, rental and leasing
$337.8 $895.3 $1,233.1
Wholesale and retail trade
$261.5 $892.6 $1,154.1
Transportation and warehousing
$247.2 $291.6 $538.8
Manufacturing
$203.9 $321.2 $525.1
Information
$99.1 $205.3 $304.5
Construction
$67.6 $61.2 $128.8
Utilities
$35.0 $61.1 $96.1
Agriculture
$8.8 $76.1 $84.8
Mining
$15.0 $4.2 $19.2
Other $93.4 $264.5 $357.9 Total Operational Impact on Labor Income $2,582.5 $2,625.2 $6,708.7 $11,916.4 2.2%
Value Added ($ Millions)
Sector Description Direct Indirect Induced Total As a % of
State Total
Direct Operational Impact of the Oil and Natural Gas Industry $5,940.5
$5,940.5 0.7%
Indirect and Induced Operational Impacts on Other Industries
Services
$1,597.0 $4,546.4 $6,143.4
Finance, insurance, real estate, rental and leasing
$1,023.2 $3,214.3 $4,237.4
Wholesale and retail trade
$477.6 $1,547.0 $2,024.7
Manufacturing
$360.8 $587.2 $948.0
Transportation and warehousing
$332.2 $417.9 $750.0
Information
$196.2 $486.3 $682.5
Utilities
$159.6 $277.4 $437.0
Construction
$120.1 $105.5 $225.6
Agriculture
$12.3 $118.5 $130.8
Mining
$54.6 $15.3 $69.9
Other
$123.9 $349.7 $473.6
Total Operational Impact on Value Added $5,940.5 $4,457.5 $11,665.4 $22,063.5 2.5%
Source: PwC calculations using the IMPLAN modeling system (2015 database). * Employment is defined as the number of payroll and self-employed jobs, including part-time jobs. ** Labor income is defined as wages and salaries and benefits as well as proprietors' income.

Impacts of the Oil and Natural Gas Industry on the US Economy
38
The Economic Impact of the Oil and Natural Gas Industry in Georgia, 2015
Employment*
Sector Description Direct Indirect Induced Total As a % of
State Total
Direct Operational Impact of the Oil and Natural Gas Industry 43,926
43,926 0.8%
Indirect and Induced Operational Impacts on Other Industries
Services
12,282 39,116 51,398
Wholesale and retail trade
1,928 10,826 12,754
Finance, insurance, real estate, rental and leasing
3,064 8,261 11,325
Manufacturing
2,875 5,774 8,650
Transportation and warehousing
2,895 3,354 6,249
Information
634 1,535 2,169
Construction
754 729 1,484
Agriculture
180 1,224 1,404
Utilities
135 272 407
Mining
166 70 236
Other
614 2,105 2,720
Total Operational Impact on Employment 43,926 25,528 73,268 142,721 2.5%
Labor Income** ($ Millions)
Sector Description Direct Indirect Induced Total As a % of
State Total
Direct Operational Impact of the Oil and Natural Gas Industry $2,213.8
$2,213.8 0.7%
Indirect and Induced Operational Impacts on Other Industries
Services
$722.7 $1,725.3 $2,448.0
Wholesale and retail trade
$146.7 $482.1 $628.9
Finance, insurance, real estate, rental and leasing
$173.9 $420.7 $594.6
Manufacturing
$195.8 $382.3 $578.1
Transportation and warehousing
$161.3 $197.9 $359.2
Information
$68.8 $157.7 $226.5
Agriculture
$9.2 $66.8 $76.0
Construction
$31.5 $32.4 $63.9
Utilities
$17.2 $33.5 $50.7
Mining
$13.2 $5.4 $18.6
Other $48.0 $161.1 $209.0 Total Operational Impact on Labor Income $2,213.8 $1,588.3 $3,665.3 $7,467.3 2.5%
Value Added ($ Millions)
Sector Description Direct Indirect Induced Total As a % of
State Total
Direct Operational Impact of the Oil and Natural Gas Industry $4,250.8
$4,250.8 0.8%
Indirect and Induced Operational Impacts on Other Industries
Services
$881.4 $2,083.6 $2,965.0
Finance, insurance, real estate, rental and leasing
$684.0 $1,808.6 $2,492.6
Manufacturing
$369.7 $776.9 $1,146.7
Wholesale and retail trade
$262.8 $839.0 $1,101.8
Information
$140.3 $383.2 $523.5
Transportation and warehousing
$212.7 $268.8 $481.5
Utilities
$62.0 $122.1 $184.1
Construction
$47.4 $46.9 $94.2
Agriculture
$10.5 $83.5 $94.0
Mining
$38.3 $15.5 $53.8
Other
$61.1 $203.8 $264.9
Total Operational Impact on Value Added $4,250.8 $2,770.2 $6,631.9 $13,652.9 2.7%
Source: PwC calculations using the IMPLAN modeling system (2015 database). * Employment is defined as the number of payroll and self-employed jobs, including part-time jobs. ** Labor income is defined as wages and salaries and benefits as well as proprietors' income.

Impacts of the Oil and Natural Gas Industry on the US Economy
39
The Economic Impact of the Oil and Natural Gas Industry in Hawaii, 2015
Employment*
Sector Description Direct Indirect Induced Total As a % of
State Total
Direct Operational Impact of the Oil and Natural Gas Industry 4,664
4,664 0.5%
Indirect and Induced Operational Impacts on Other Industries
Services
1,679 6,500 8,179
Wholesale and retail trade
373 1,498 1,871
Finance, insurance, real estate, rental and leasing
389 1,177 1,566
Transportation and warehousing
349 456 806
Manufacturing
81 357 438
Agriculture
26 316 341
Construction
205 104 310
Information
53 141 194
Utilities
29 61 91
Mining
12 5 17
Other
203 450 653
Total Operational Impact on Employment 4,664 3,400 11,066 19,130 2.1%
Labor Income** ($ Millions)
Sector Description Direct Indirect Induced Total As a % of
State Total
Direct Operational Impact of the Oil and Natural Gas Industry $300.3
$300.3 0.6%
Indirect and Induced Operational Impacts on Other Industries
Services
$91.8 $312.8 $404.6
Wholesale and retail trade
$21.5 $57.1 $78.6
Finance, insurance, real estate, rental and leasing
$19.6 $53.0 $72.6
Transportation and warehousing
$21.7 $27.4 $49.0
Construction
$13.6 $6.9 $20.5
Manufacturing
$3.9 $14.4 $18.3
Information
$4.3 $11.3 $15.6
Utilities
$4.5 $9.4 $13.9
Agriculture
$0.6 $6.7 $7.3
Mining
$1.1 $0.4 $1.5
Other $18.1 $41.3 $59.4 Total Operational Impact on Labor Income $300.3 $200.6 $540.6 $1,041.6 2.1%
Value Added ($ Millions)
Sector Description Direct Indirect Induced Total As a % of
State Total
Direct Operational Impact of the Oil and Natural Gas Industry $1,059.0
$1,059.0 1.3%
Indirect and Induced Operational Impacts on Other Industries
Services
$117.0 $401.8 $518.8
Finance, insurance, real estate, rental and leasing
$72.6 $257.1 $329.7
Wholesale and retail trade
$37.9 $100.0 $138.0
Transportation and warehousing
$30.4 $43.7 $74.2
Utilities
$13.0 $26.5 $39.5
Information
$9.6 $29.0 $38.5
Construction
$21.8 $11.1 $32.9
Manufacturing
$6.7 $18.9 $25.6
Agriculture
$0.7 $8.5 $9.1
Mining
$2.7 $1.1 $3.8
Other
$22.5 $51.3 $73.8
Total Operational Impact on Value Added $1,059.0 $334.9 $949.0 $2,342.9 3.0%
Source: PwC calculations using the IMPLAN modeling system (2015 database). * Employment is defined as the number of payroll and self-employed jobs, including part-time jobs. ** Labor income is defined as wages and salaries and benefits as well as proprietors' income.

Impacts of the Oil and Natural Gas Industry on the US Economy
40
The Economic Impact of the Oil and Natural Gas Industry in Idaho, 2015
Employment*
Sector Description Direct Indirect Induced Total As a % of
State Total
Direct Operational Impact of the Oil and Natural Gas Industry 9,777
9,777 1.0%
Indirect and Induced Operational Impacts on Other Industries
Services
1,855 6,126 7,980
Wholesale and retail trade
320 1,797 2,117
Finance, insurance, real estate, rental and leasing
607 1,371 1,978
Manufacturing
395 944 1,340
Agriculture
89 900 989
Transportation and warehousing
367 405 772
Construction
213 144 357
Information
78 160 238
Mining
84 41 125
Utilities
23 44 67
Other
147 397 544
Total Operational Impact on Employment 9,777 4,179 12,329 26,285 2.8%
Labor Income** ($ Millions)
Sector Description Direct Indirect Induced Total As a % of
State Total
Direct Operational Impact of the Oil and Natural Gas Industry $432.9
$432.9 1.0%
Indirect and Induced Operational Impacts on Other Industries
Services
$83.3 $227.8 $311.0
Wholesale and retail trade
$18.6 $71.2 $89.8
Manufacturing
$23.7 $55.4 $79.1
Finance, insurance, real estate, rental and leasing
$22.2 $47.6 $69.8
Agriculture
$5.4 $62.5 $67.9
Transportation and warehousing
$17.4 $19.6 $37.0
Construction
$8.0 $5.5 $13.5
Information
$4.4 $8.4 $12.8
Utilities
$2.7 $4.7 $7.4
Mining
$4.7 $2.2 $6.9
Other $9.3 $25.1 $34.4 Total Operational Impact on Labor Income $432.9 $199.5 $530.0 $1,162.4 2.8%
Value Added ($ Millions)
Sector Description Direct Indirect Induced Total As a % of
State Total
Direct Operational Impact of the Oil and Natural Gas Industry $586.6
$586.6 0.9%
Indirect and Induced Operational Impacts on Other Industries
Services
$100.8 $268.1 $368.9
Finance, insurance, real estate, rental and leasing
$89.6 $215.5 $305.1
Wholesale and retail trade
$31.3 $113.5 $144.8
Manufacturing
$37.8 $88.4 $126.2
Agriculture
$6.6 $77.5 $84.1
Transportation and warehousing
$23.8 $26.7 $50.5
Mining
$22.7 $10.5 $33.2
Information
$8.0 $18.0 $25.9
Construction
$12.4 $8.5 $20.9
Utilities
$7.5 $13.3 $20.8
Other
$11.7 $31.7 $43.5
Total Operational Impact on Value Added $586.6 $352.1 $871.8 $1,810.5 2.8%
Source: PwC calculations using the IMPLAN modeling system (2015 database). * Employment is defined as the number of payroll and self-employed jobs, including part-time jobs. ** Labor income is defined as wages and salaries and benefits as well as proprietors' income.

Impacts of the Oil and Natural Gas Industry on the US Economy
41
The Economic Impact of the Oil and Natural Gas Industry in Illinois, 2015
Employment*
Sector Description Direct Indirect Induced Total As a % of
State Total
Direct Operational Impact of the Oil and Natural Gas Industry 69,548
69,548 0.9%
Indirect and Induced Operational Impacts on Other Industries
Services
19,667 67,120 86,787
Wholesale and retail trade
4,538 17,301 21,838
Finance, insurance, real estate, rental and leasing
4,815 13,856 18,671
Manufacturing
5,537 7,865 13,402
Transportation and warehousing
5,283 5,739 11,022
Construction
2,520 1,024 3,545
Information
771 1,791 2,562
Agriculture
138 1,578 1,717
Utilities
222 395 618
Mining
244 101 345
Other
1,393 3,109 4,502
Total Operational Impact on Employment 69,548 45,128 119,880 234,557 3.0%
Labor Income** ($ Millions)
Sector Description Direct Indirect Induced Total As a % of
State Total
Direct Operational Impact of the Oil and Natural Gas Industry $4,462.8
$4,462.8 0.9%
Indirect and Induced Operational Impacts on Other Industries
Services
$1,482.2 $3,445.9 $4,928.1
Finance, insurance, real estate, rental and leasing
$386.6 $970.4 $1,357.0
Wholesale and retail trade
$378.6 $818.5 $1,197.0
Manufacturing
$500.7 $660.4 $1,161.2
Transportation and warehousing
$328.2 $344.1 $672.2
Information
$84.1 $177.9 $261.9
Construction
$153.1 $62.0 $215.1
Utilities
$37.2 $64.7 $101.9
Agriculture
$7.3 $88.2 $95.5
Mining
$22.8 $9.3 $32.0
Other $114.6 $260.4 $375.0 Total Operational Impact on Labor Income $4,462.8 $3,495.3 $6,901.7 $14,859.9 3.1%
Value Added ($ Millions)
Sector Description Direct Indirect Induced Total As a % of
State Total
Direct Operational Impact of the Oil and Natural Gas Industry $15,727.8
$15,727.8 2.0%
Indirect and Induced Operational Impacts on Other Industries
Services
$1,807.8 $4,178.5 $5,986.3
Finance, insurance, real estate, rental and leasing
$1,197.7 $3,526.0 $4,723.7
Wholesale and retail trade
$679.3 $1,412.6 $2,091.9
Manufacturing
$885.1 $1,156.5 $2,041.6
Transportation and warehousing
$422.3 $434.4 $856.7
Information
$165.6 $421.2 $586.8
Utilities
$129.2 $225.3 $354.5
Construction
$212.1 $86.1 $298.2
Agriculture
$10.5 $126.1 $136.5
Mining
$68.4 $27.6 $96.0
Other
$136.6 $310.7 $447.3
Total Operational Impact on Value Added $15,727.8 $5,714.5 $11,905.0 $33,347.3 4.3%
Source: PwC calculations using the IMPLAN modeling system (2015 database). * Employment is defined as the number of payroll and self-employed jobs, including part-time jobs. ** Labor income is defined as wages and salaries and benefits as well as proprietors' income.
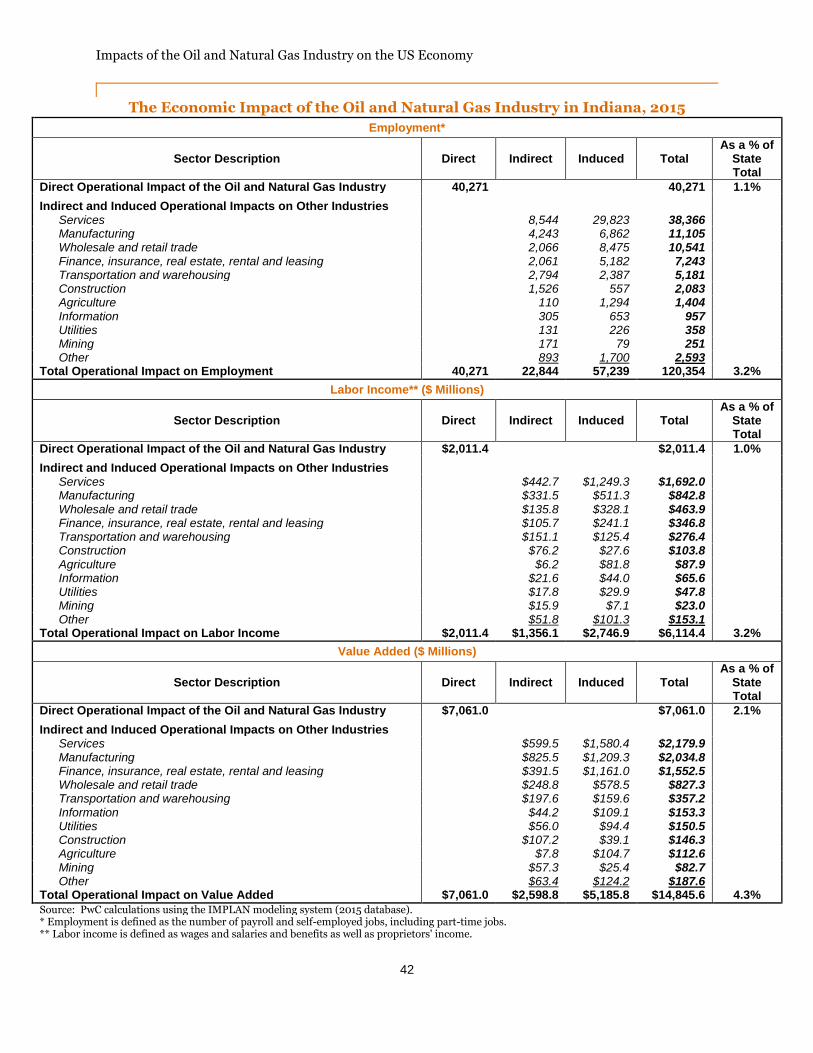
Impacts of the Oil and Natural Gas Industry on the US Economy
42
The Economic Impact of the Oil and Natural Gas Industry in Indiana, 2015
Employment*
Sector Description Direct Indirect Induced Total As a % of
State Total
Direct Operational Impact of the Oil and Natural Gas Industry 40,271
40,271 1.1%
Indirect and Induced Operational Impacts on Other Industries
Services
8,544 29,823 38,366
Manufacturing
4,243 6,862 11,105
Wholesale and retail trade
2,066 8,475 10,541
Finance, insurance, real estate, rental and leasing
2,061 5,182 7,243
Transportation and warehousing
2,794 2,387 5,181
Construction
1,526 557 2,083
Agriculture
110 1,294 1,404
Information
305 653 957
Utilities
131 226 358
Mining
171 79 251
Other
893 1,700 2,593
Total Operational Impact on Employment 40,271 22,844 57,239 120,354 3.2%
Labor Income** ($ Millions)
Sector Description Direct Indirect Induced Total As a % of
State Total
Direct Operational Impact of the Oil and Natural Gas Industry $2,011.4
$2,011.4 1.0%
Indirect and Induced Operational Impacts on Other Industries
Services
$442.7 $1,249.3 $1,692.0
Manufacturing
$331.5 $511.3 $842.8
Wholesale and retail trade
$135.8 $328.1 $463.9
Finance, insurance, real estate, rental and leasing
$105.7 $241.1 $346.8
Transportation and warehousing
$151.1 $125.4 $276.4
Construction
$76.2 $27.6 $103.8
Agriculture
$6.2 $81.8 $87.9
Information
$21.6 $44.0 $65.6
Utilities
$17.8 $29.9 $47.8
Mining
$15.9 $7.1 $23.0
Other $51.8 $101.3 $153.1 Total Operational Impact on Labor Income $2,011.4 $1,356.1 $2,746.9 $6,114.4 3.2%
Value Added ($ Millions)
Sector Description Direct Indirect Induced Total As a % of
State Total
Direct Operational Impact of the Oil and Natural Gas Industry $7,061.0
$7,061.0 2.1%
Indirect and Induced Operational Impacts on Other Industries
Services
$599.5 $1,580.4 $2,179.9
Manufacturing
$825.5 $1,209.3 $2,034.8
Finance, insurance, real estate, rental and leasing
$391.5 $1,161.0 $1,552.5
Wholesale and retail trade
$248.8 $578.5 $827.3
Transportation and warehousing
$197.6 $159.6 $357.2
Information
$44.2 $109.1 $153.3
Utilities
$56.0 $94.4 $150.5
Construction
$107.2 $39.1 $146.3
Agriculture
$7.8 $104.7 $112.6
Mining
$57.3 $25.4 $82.7
Other
$63.4 $124.2 $187.6
Total Operational Impact on Value Added $7,061.0 $2,598.8 $5,185.8 $14,845.6 4.3%
Source: PwC calculations using the IMPLAN modeling system (2015 database). * Employment is defined as the number of payroll and self-employed jobs, including part-time jobs. ** Labor income is defined as wages and salaries and benefits as well as proprietors' income.
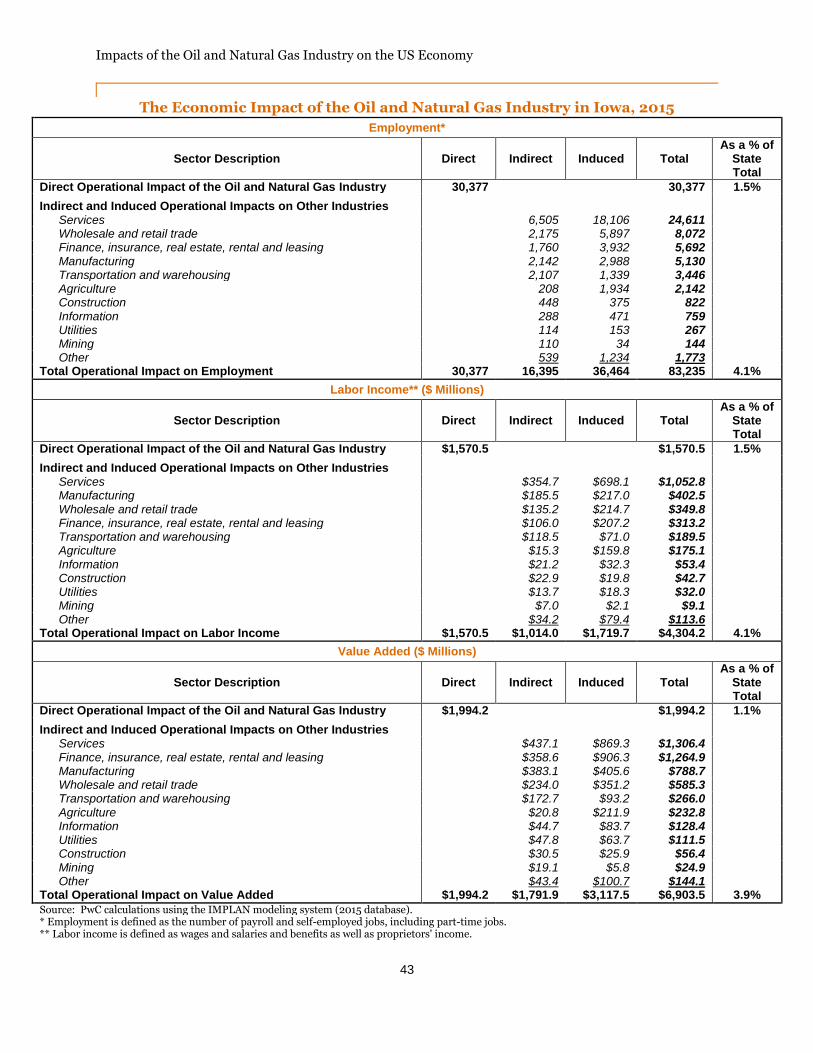
Impacts of the Oil and Natural Gas Industry on the US Economy
43
The Economic Impact of the Oil and Natural Gas Industry in Iowa, 2015
Employment*
Sector Description Direct Indirect Induced Total As a % of
State Total
Direct Operational Impact of the Oil and Natural Gas Industry 30,377
30,377 1.5%
Indirect and Induced Operational Impacts on Other Industries
Services
6,505 18,106 24,611
Wholesale and retail trade
2,175 5,897 8,072
Finance, insurance, real estate, rental and leasing
1,760 3,932 5,692
Manufacturing
2,142 2,988 5,130
Transportation and warehousing
2,107 1,339 3,446
Agriculture
208 1,934 2,142
Construction
448 375 822
Information
288 471 759
Utilities
114 153 267
Mining
110 34 144
Other
539 1,234 1,773
Total Operational Impact on Employment 30,377 16,395 36,464 83,235 4.1%
Labor Income** ($ Millions)
Sector Description Direct Indirect Induced Total As a % of
State Total
Direct Operational Impact of the Oil and Natural Gas Industry $1,570.5
$1,570.5 1.5%
Indirect and Induced Operational Impacts on Other Industries
Services
$354.7 $698.1 $1,052.8
Manufacturing
$185.5 $217.0 $402.5
Wholesale and retail trade
$135.2 $214.7 $349.8
Finance, insurance, real estate, rental and leasing
$106.0 $207.2 $313.2
Transportation and warehousing
$118.5 $71.0 $189.5
Agriculture
$15.3 $159.8 $175.1
Information
$21.2 $32.3 $53.4
Construction
$22.9 $19.8 $42.7
Utilities
$13.7 $18.3 $32.0
Mining
$7.0 $2.1 $9.1
Other $34.2 $79.4 $113.6 Total Operational Impact on Labor Income $1,570.5 $1,014.0 $1,719.7 $4,304.2 4.1%
Value Added ($ Millions)
Sector Description Direct Indirect Induced Total As a % of
State Total
Direct Operational Impact of the Oil and Natural Gas Industry $1,994.2
$1,994.2 1.1%
Indirect and Induced Operational Impacts on Other Industries
Services
$437.1 $869.3 $1,306.4
Finance, insurance, real estate, rental and leasing
$358.6 $906.3 $1,264.9
Manufacturing
$383.1 $405.6 $788.7
Wholesale and retail trade
$234.0 $351.2 $585.3
Transportation and warehousing
$172.7 $93.2 $266.0
Agriculture
$20.8 $211.9 $232.8
Information
$44.7 $83.7 $128.4
Utilities
$47.8 $63.7 $111.5
Construction
$30.5 $25.9 $56.4
Mining
$19.1 $5.8 $24.9
Other
$43.4 $100.7 $144.1
Total Operational Impact on Value Added $1,994.2 $1,791.9 $3,117.5 $6,903.5 3.9%
Source: PwC calculations using the IMPLAN modeling system (2015 database). * Employment is defined as the number of payroll and self-employed jobs, including part-time jobs. ** Labor income is defined as wages and salaries and benefits as well as proprietors' income.

Impacts of the Oil and Natural Gas Industry on the US Economy
44
The Economic Impact of the Oil and Natural Gas Industry in Kansas, 2015
Employment*
Sector Description Direct Indirect Induced Total As a % of
State Total
Direct Operational Impact of the Oil and Natural Gas Industry 63,236
63,236 3.3%
Indirect and Induced Operational Impacts on Other Industries
Services
7,855 24,902 32,757
Wholesale and retail trade
1,881 7,721 9,602
Finance, insurance, real estate, rental and leasing
2,294 5,670 7,964
Manufacturing
1,370 2,061 3,432
Transportation and warehousing
1,835 1,477 3,312
Construction
1,964 470 2,434
Agriculture
104 1,486 1,590
Information
274 601 875
Utilities
108 167 275
Mining
123 36 159
Other
1,035 2,012 3,047
Total Operational Impact on Employment 63,236 18,844 46,604 128,684 6.8%
Labor Income** ($ Millions)
Sector Description Direct Indirect Induced Total As a % of
State Total
Direct Operational Impact of the Oil and Natural Gas Industry $4,955.7
$4,955.7 5.2%
Indirect and Induced Operational Impacts on Other Industries
Services
$466.4 $1,031.9 $1,498.3
Wholesale and retail trade
$119.6 $277.1 $396.7
Finance, insurance, real estate, rental and leasing
$117.7 $237.2 $354.9
Manufacturing
$95.2 $133.9 $229.0
Transportation and warehousing
$105.9 $79.3 $185.2
Construction
$97.5 $23.1 $120.5
Agriculture
$5.2 $77.4 $82.6
Information
$19.7 $42.5 $62.2
Utilities
$14.2 $21.8 $36.0
Mining
$6.3 $1.8 $8.2
Other $61.7 $121.8 $183.5 Total Operational Impact on Labor Income $4,955.7 $1,109.4 $2,047.7 $8,112.9 8.5%
Value Added ($ Millions)
Sector Description Direct Indirect Induced Total As a % of
State Total
Direct Operational Impact of the Oil and Natural Gas Industry $6,828.1
$6,828.1 4.5%
Indirect and Induced Operational Impacts on Other Industries
Services
$561.8 $1,240.7 $1,802.4
Finance, insurance, real estate, rental and leasing
$346.4 $1,004.7 $1,351.1
Wholesale and retail trade
$218.7 $502.1 $720.8
Manufacturing
$149.6 $228.1 $377.7
Transportation and warehousing
$148.8 $111.6 $260.3
Construction
$132.7 $31.6 $164.3
Information
$41.9 $107.8 $149.8
Agriculture
$7.0 $102.4 $109.4
Utilities
$42.9 $65.8 $108.7
Mining
$10.3 $3.1 $13.3
Other
$76.2 $150.6 $226.8
Total Operational Impact on Value Added $6,828.1 $1,736.2 $3,548.5 $12,112.7 8.0%
Source: PwC calculations using the IMPLAN modeling system (2015 database). * Employment is defined as the number of payroll and self-employed jobs, including part-time jobs. ** Labor income is defined as wages and salaries and benefits as well as proprietors' income.

Impacts of the Oil and Natural Gas Industry on the US Economy
45
The Economic Impact of the Oil and Natural Gas Industry in Kentucky, 2015
Employment*
Sector Description Direct Indirect Induced Total As a % of
State Total
Direct Operational Impact of the Oil and Natural Gas Industry 32,522
32,522 1.3%
Indirect and Induced Operational Impacts on Other Industries
Services
5,575 16,892 22,467
Wholesale and retail trade
1,139 5,032 6,171
Manufacturing
1,799 3,132 4,931
Finance, insurance, real estate, rental and leasing
1,421 3,239 4,659
Transportation and warehousing
1,780 1,569 3,349
Agriculture
142 1,644 1,786
Construction
849 336 1,185
Information
222 415 637
Mining
346 166 512
Utilities
86 140 226
Other
565 1,193 1,758
Total Operational Impact on Employment 32,522 13,925 33,757 80,204 3.3%
Labor Income** ($ Millions)
Sector Description Direct Indirect Induced Total As a % of
State Total
Direct Operational Impact of the Oil and Natural Gas Industry $1,367.6
$1,367.6 1.1%
Indirect and Induced Operational Impacts on Other Industries
Services
$265.9 $694.4 $960.3
Manufacturing
$123.0 $220.0 $343.0
Wholesale and retail trade
$70.7 $187.7 $258.4
Finance, insurance, real estate, rental and leasing
$71.2 $154.3 $225.5
Transportation and warehousing
$102.7 $91.3 $194.0
Construction
$38.6 $15.2 $53.8
Information
$18.1 $30.1 $48.2
Mining
$29.2 $13.5 $42.8
Agriculture
$2.7 $30.9 $33.6
Utilities
$10.5 $16.6 $27.1
Other $40.3 $87.1 $127.4 Total Operational Impact on Labor Income $1,367.6 $772.9 $1,541.1 $3,681.6 3.0%
Value Added ($ Millions)
Sector Description Direct Indirect Induced Total As a % of
State Total
Direct Operational Impact of the Oil and Natural Gas Industry $3,749.1
$3,749.1 1.9%
Indirect and Induced Operational Impacts on Other Industries
Services
$322.6 $818.3 $1,140.9
Finance, insurance, real estate, rental and leasing
$246.6 $644.6 $891.2
Manufacturing
$231.5 $500.1 $731.6
Wholesale and retail trade
$139.6 $323.6 $463.2
Transportation and warehousing
$132.4 $115.7 $248.1
Mining
$101.4 $46.2 $147.7
Information
$37.0 $77.9 $115.0
Utilities
$34.8 $55.0 $89.8
Construction
$57.4 $22.6 $80.0
Agriculture
$3.9 $46.8 $50.7
Other
$48.8 $105.7 $154.5
Total Operational Impact on Value Added $3,749.1 $1,355.9 $2,756.6 $7,861.7 3.9%
Source: PwC calculations using the IMPLAN modeling system (2015 database). * Employment is defined as the number of payroll and self-employed jobs, including part-time jobs. ** Labor income is defined as wages and salaries and benefits as well as proprietors' income.

Impacts of the Oil and Natural Gas Industry on the US Economy
46
The Economic Impact of the Oil and Natural Gas Industry in Louisiana, 2015
Employment*
Sector Description Direct Indirect Induced Total As a % of
State Total
Direct Operational Impact of the Oil and Natural Gas Industry 130,397
130,397 4.9%
Indirect and Induced Operational Impacts on Other Industries
Services
17,712 67,698 85,410
Wholesale and retail trade
6,514 18,976 25,490
Finance, insurance, real estate, rental and leasing
4,872 13,095 17,967
Transportation and warehousing
5,181 3,519 8,700
Construction
5,817 1,288 7,105
Manufacturing
2,317 2,348 4,664
Information
512 1,283 1,795
Agriculture
184 1,089 1,273
Utilities
271 430 701
Mining
195 42 237
Other
2,868 4,565 7,433
Total Operational Impact on Employment 130,397 46,442 114,333 291,173 11.0%
Labor Income** ($ Millions)
Sector Description Direct Indirect Induced Total As a % of
State Total
Direct Operational Impact of the Oil and Natural Gas Industry $15,910.1
$15,910.1 11.4%
Indirect and Induced Operational Impacts on Other Industries
Services
$856.8 $2,705.9 $3,562.8
Wholesale and retail trade
$400.6 $684.0 $1,084.6
Finance, insurance, real estate, rental and leasing
$249.5 $495.5 $745.0
Transportation and warehousing
$319.6 $213.9 $533.5
Construction
$341.0 $74.8 $415.9
Manufacturing
$192.4 $180.8 $373.2
Information
$33.0 $81.0 $114.0
Utilities
$33.1 $51.5 $84.6
Agriculture
$8.2 $38.1 $46.3
Mining
$13.0 $2.6 $15.6
Other $181.5 $292.1 $473.6 Total Operational Impact on Labor Income $15,910.1 $2,628.7 $4,820.3 $23,359.2 16.8%
Value Added ($ Millions)
Sector Description Direct Indirect Induced Total As a % of
State Total
Direct Operational Impact of the Oil and Natural Gas Industry $37,800.0
$37,800.0 15.4%
Indirect and Induced Operational Impacts on Other Industries
Services
$1,066.2 $3,265.6 $4,331.8
Finance, insurance, real estate, rental and leasing
$751.7 $2,358.3 $3,110.0
Wholesale and retail trade
$764.0 $1,241.2 $2,005.2
Manufacturing
$494.3 $472.8 $967.2
Transportation and warehousing
$420.9 $279.1 $700.0
Construction
$415.2 $91.7 $506.9
Information
$80.4 $252.5 $332.9
Utilities
$128.8 $197.8 $326.6
Agriculture
$8.9 $49.8 $58.7
Mining
$34.9 $7.4 $42.3
Other
$209.9 $338.2 $548.1
Total Operational Impact on Value Added $37,800.0 $4,375.0 $8,554.6 $50,729.6 20.7%
Source: PwC calculations using the IMPLAN modeling system (2015 database). * Employment is defined as the number of payroll and self-employed jobs, including part-time jobs. ** Labor income is defined as wages and salaries and benefits as well as proprietors' income.

Impacts of the Oil and Natural Gas Industry on the US Economy
47
The Economic Impact of the Oil and Natural Gas Industry in Maine, 2015
Employment*
Sector Description Direct Indirect Induced Total As a % of
State Total
Direct Operational Impact of the Oil and Natural Gas Industry 12,444
12,444 1.5%
Indirect and Induced Operational Impacts on Other Industries
Services
2,371 6,539 8,910
Wholesale and retail trade
377 1,763 2,141
Finance, insurance, real estate, rental and leasing
673 1,142 1,815
Manufacturing
366 738 1,104
Transportation and warehousing
693 379 1,072
Agriculture
82 404 486
Construction
213 138 352
Information
90 142 231
Mining
54 11 65
Utilities
25 30 55
Other
183 373 556
Total Operational Impact on Employment 12,444 5,127 11,659 29,230 3.6%
Labor Income** ($ Millions)
Sector Description Direct Indirect Induced Total As a % of
State Total
Direct Operational Impact of the Oil and Natural Gas Industry $483.0
$483.0 1.3%
Indirect and Induced Operational Impacts on Other Industries
Services
$116.1 $267.9 $384.0
Wholesale and retail trade
$22.9 $65.3 $88.2
Finance, insurance, real estate, rental and leasing
$30.5 $52.3 $82.8
Manufacturing
$23.8 $43.8 $67.7
Transportation and warehousing
$35.0 $18.7 $53.7
Information
$5.7 $8.5 $14.2
Agriculture
$2.8 $10.1 $12.9
Construction
$7.7 $5.1 $12.8
Utilities
$2.9 $3.5 $6.4
Mining
$1.0 $0.2 $1.2
Other $12.3 $25.8 $38.1 Total Operational Impact on Labor Income $483.0 $260.8 $501.2 $1,245.0 3.4%
Value Added ($ Millions)
Sector Description Direct Indirect Induced Total As a % of
State Total
Direct Operational Impact of the Oil and Natural Gas Industry $943.8
$943.8 1.6%
Indirect and Induced Operational Impacts on Other Industries
Services
$142.6 $325.2 $467.8
Finance, insurance, real estate, rental and leasing
$128.0 $232.7 $360.7
Wholesale and retail trade
$43.2 $113.7 $157.0
Manufacturing
$36.3 $71.1 $107.4
Transportation and warehousing
$42.0 $23.0 $65.0
Utilities
$15.4 $18.2 $33.5
Information
$10.6 $18.7 $29.4
Agriculture
$2.8 $14.1 $16.9
Construction
$9.5 $6.2 $15.6
Mining
$1.4 $0.3 $1.7
Other
$15.3 $32.1 $47.5
Total Operational Impact on Value Added $943.8 $447.2 $855.4 $2,246.4 3.9%
Source: PwC calculations using the IMPLAN modeling system (2015 database). * Employment is defined as the number of payroll and self-employed jobs, including part-time jobs. ** Labor income is defined as wages and salaries and benefits as well as proprietors' income.

Impacts of the Oil and Natural Gas Industry on the US Economy
48
The Economic Impact of the Oil and Natural Gas Industry in Maryland, 2015
Employment*
Sector Description Direct Indirect Induced Total As a % of
State Total
Direct Operational Impact of the Oil and Natural Gas Industry 20,586
20,586 0.6%
Indirect and Induced Operational Impacts on Other Industries
Services
6,247 23,711 29,959
Wholesale and retail trade
971 5,432 6,403
Finance, insurance, real estate, rental and leasing
1,481 4,524 6,005
Transportation and warehousing
1,360 1,626 2,986
Manufacturing
836 1,565 2,401
Construction
539 475 1,015
Information
249 624 872
Agriculture
35 373 408
Utilities
77 147 224
Mining
52 21 74
Other
367 1,205 1,573
Total Operational Impact on Employment 20,586 12,215 39,704 72,506 2.0%
Labor Income** ($ Millions)
Sector Description Direct Indirect Induced Total As a % of
State Total
Direct Operational Impact of the Oil and Natural Gas Industry $1,244.7
$1,244.7 0.5%
Indirect and Induced Operational Impacts on Other Industries
Services
$452.3 $1,235.1 $1,687.4
Finance, insurance, real estate, rental and leasing
$103.2 $289.8 $393.0
Wholesale and retail trade
$74.5 $242.4 $317.0
Manufacturing
$73.7 $119.6 $193.3
Transportation and warehousing
$82.9 $94.8 $177.7
Information
$41.6 $83.0 $124.6
Construction
$30.0 $28.1 $58.2
Utilities
$13.3 $24.7 $38.1
Agriculture
$1.3 $14.5 $15.7
Mining
$3.6 $1.4 $5.0
Other $42.9 $138.2 $181.1 Total Operational Impact on Labor Income $1,244.7 $919.3 $2,271.7 $4,435.7 2.0%
Value Added ($ Millions)
Sector Description Direct Indirect Induced Total As a % of
State Total
Direct Operational Impact of the Oil and Natural Gas Industry $2,359.9
$2,359.9 0.6%
Indirect and Induced Operational Impacts on Other Industries
Services
$553.6 $1,500.8 $2,054.4
Finance, insurance, real estate, rental and leasing
$336.7 $1,167.6 $1,504.3
Wholesale and retail trade
$130.8 $409.9 $540.7
Manufacturing
$148.8 $264.7 $413.5
Information
$77.7 $181.7 $259.4
Transportation and warehousing
$100.9 $111.9 $212.8
Utilities
$54.5 $101.3 $155.9
Construction
$41.1 $37.1 $78.2
Agriculture
$1.7 $20.7 $22.4
Mining
$9.3 $3.6 $12.9
Other
$67.1 $214.5 $281.6
Total Operational Impact on Value Added $2,359.9 $1,522.2 $4,013.9 $7,896.1 2.1%
Source: PwC calculations using the IMPLAN modeling system (2015 database). * Employment is defined as the number of payroll and self-employed jobs, including part-time jobs. ** Labor income is defined as wages and salaries and benefits as well as proprietors' income.

Impacts of the Oil and Natural Gas Industry on the US Economy
49
The Economic Impact of the Oil and Natural Gas Industry in Massachusetts, 2015
Employment*
Sector Description Direct Indirect Induced Total As a % of
State Total
Direct Operational Impact of the Oil and Natural Gas Industry 26,667
26,667 0.6%
Indirect and Induced Operational Impacts on Other Industries
Services
9,163 34,866 44,028
Wholesale and retail trade
1,321 7,763 9,083
Finance, insurance, real estate, rental and leasing
2,409 6,647 9,055
Manufacturing
1,852 3,309 5,161
Transportation and warehousing
1,461 1,891 3,353
Information
488 1,219 1,707
Construction
678 551 1,230
Agriculture
39 347 385
Utilities
84 167 251
Mining
67 20 86
Other
393 1,245 1,637
Total Operational Impact on Employment 26,667 17,954 58,024 102,644 2.3%
Labor Income** ($ Millions)
Sector Description Direct Indirect Induced Total As a % of
State Total
Direct Operational Impact of the Oil and Natural Gas Industry $2,104.2
$2,104.2 0.7%
Indirect and Induced Operational Impacts on Other Industries
Services
$847.5 $2,154.6 $3,002.2
Finance, insurance, real estate, rental and leasing
$264.1 $694.1 $958.2
Wholesale and retail trade
$124.3 $402.9 $527.2
Manufacturing
$185.8 $303.3 $489.2
Information
$63.3 $153.3 $216.6
Transportation and warehousing
$93.8 $114.1 $207.8
Construction
$39.6 $33.6 $73.2
Utilities
$13.6 $26.6 $40.2
Agriculture
$0.9 $8.0 $8.8
Mining
$3.5 $1.0 $4.5
Other $38.3 $119.9 $158.1 Total Operational Impact on Labor Income $2,104.2 $1,674.7 $4,011.3 $7,790.3 2.4%
Value Added ($ Millions)
Sector Description Direct Indirect Induced Total As a % of
State Total
Direct Operational Impact of the Oil and Natural Gas Industry $3,683.1
$3,683.1 0.8%
Indirect and Induced Operational Impacts on Other Industries
Services
$1,002.1 $2,480.2 $3,482.3
Finance, insurance, real estate, rental and leasing
$632.1 $1,865.7 $2,497.8
Manufacturing
$344.1 $546.9 $891.0
Wholesale and retail trade
$195.8 $591.7 $787.6
Information
$115.7 $319.9 $435.5
Transportation and warehousing
$109.4 $132.8 $242.2
Utilities
$42.9 $83.1 $126.1
Construction
$54.9 $45.4 $100.3
Mining
$10.9 $3.2 $14.1
Agriculture
$1.1 $12.5 $13.6
Other
$59.6 $185.7 $245.3
Total Operational Impact on Value Added $3,683.1 $2,568.7 $6,267.0 $12,518.8 2.6%
Source: PwC calculations using the IMPLAN modeling system (2015 database). * Employment is defined as the number of payroll and self-employed jobs, including part-time jobs. ** Labor income is defined as wages and salaries and benefits as well as proprietors' income.
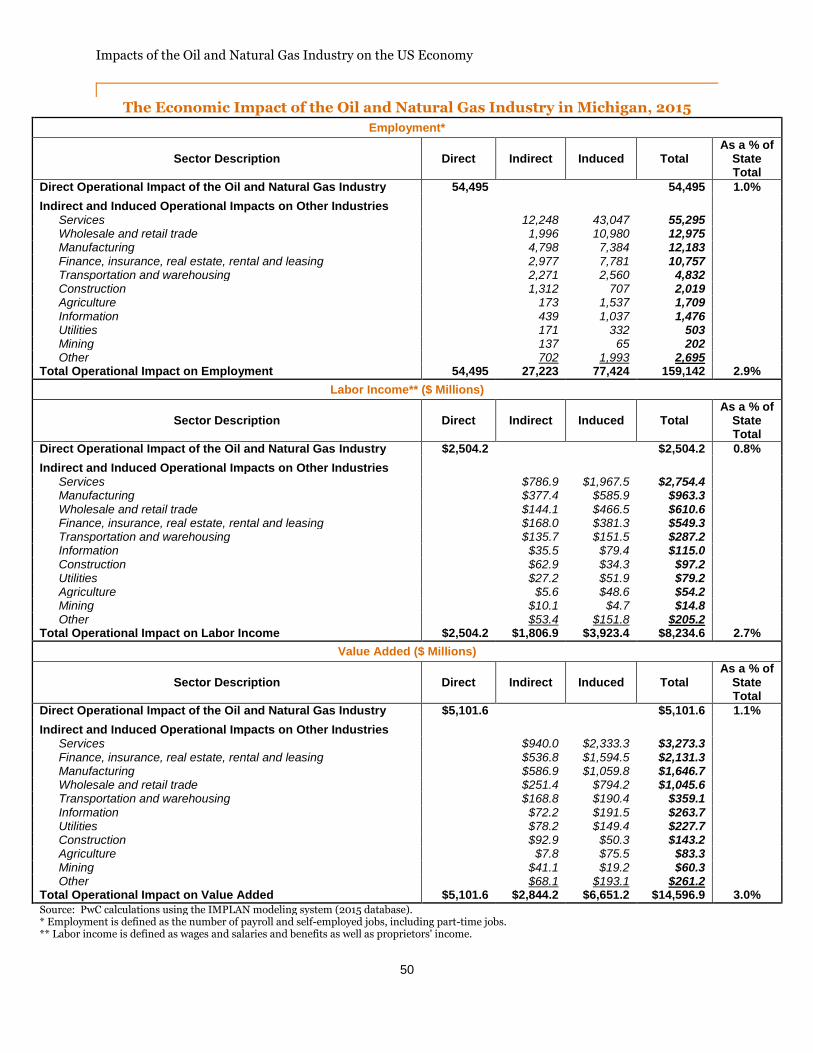
Impacts of the Oil and Natural Gas Industry on the US Economy
50
The Economic Impact of the Oil and Natural Gas Industry in Michigan, 2015
Employment*
Sector Description Direct Indirect Induced Total As a % of
State Total
Direct Operational Impact of the Oil and Natural Gas Industry 54,495
54,495 1.0%
Indirect and Induced Operational Impacts on Other Industries
Services
12,248 43,047 55,295
Wholesale and retail trade
1,996 10,980 12,975
Manufacturing
4,798 7,384 12,183
Finance, insurance, real estate, rental and leasing
2,977 7,781 10,757
Transportation and warehousing
2,271 2,560 4,832
Construction
1,312 707 2,019
Agriculture
173 1,537 1,709
Information
439 1,037 1,476
Utilities
171 332 503
Mining
137 65 202
Other
702 1,993 2,695
Total Operational Impact on Employment 54,495 27,223 77,424 159,142 2.9%
Labor Income** ($ Millions)
Sector Description Direct Indirect Induced Total As a % of
State Total
Direct Operational Impact of the Oil and Natural Gas Industry $2,504.2
$2,504.2 0.8%
Indirect and Induced Operational Impacts on Other Industries
Services
$786.9 $1,967.5 $2,754.4
Manufacturing
$377.4 $585.9 $963.3
Wholesale and retail trade
$144.1 $466.5 $610.6
Finance, insurance, real estate, rental and leasing
$168.0 $381.3 $549.3
Transportation and warehousing
$135.7 $151.5 $287.2
Information
$35.5 $79.4 $115.0
Construction
$62.9 $34.3 $97.2
Utilities
$27.2 $51.9 $79.2
Agriculture
$5.6 $48.6 $54.2
Mining
$10.1 $4.7 $14.8
Other $53.4 $151.8 $205.2 Total Operational Impact on Labor Income $2,504.2 $1,806.9 $3,923.4 $8,234.6 2.7%
Value Added ($ Millions)
Sector Description Direct Indirect Induced Total As a % of
State Total
Direct Operational Impact of the Oil and Natural Gas Industry $5,101.6
$5,101.6 1.1%
Indirect and Induced Operational Impacts on Other Industries
Services
$940.0 $2,333.3 $3,273.3
Finance, insurance, real estate, rental and leasing
$536.8 $1,594.5 $2,131.3
Manufacturing
$586.9 $1,059.8 $1,646.7
Wholesale and retail trade
$251.4 $794.2 $1,045.6
Transportation and warehousing
$168.8 $190.4 $359.1
Information
$72.2 $191.5 $263.7
Utilities
$78.2 $149.4 $227.7
Construction
$92.9 $50.3 $143.2
Agriculture
$7.8 $75.5 $83.3
Mining
$41.1 $19.2 $60.3
Other
$68.1 $193.1 $261.2
Total Operational Impact on Value Added $5,101.6 $2,844.2 $6,651.2 $14,596.9 3.0%
Source: PwC calculations using the IMPLAN modeling system (2015 database). * Employment is defined as the number of payroll and self-employed jobs, including part-time jobs. ** Labor income is defined as wages and salaries and benefits as well as proprietors' income.

Impacts of the Oil and Natural Gas Industry on the US Economy
51
The Economic Impact of the Oil and Natural Gas Industry in Minnesota, 2015
Employment*
Sector Description Direct Indirect Induced Total As a % of
State Total
Direct Operational Impact of the Oil and Natural Gas Industry 39,353
39,353 1.1%
Indirect and Induced Operational Impacts on Other Industries
Services
8,879 30,836 39,715
Wholesale and retail trade
2,211 8,259 10,469
Finance, insurance, real estate, rental and leasing
2,353 6,238 8,592
Manufacturing
2,760 4,403 7,163
Transportation and warehousing
2,153 2,121 4,274
Agriculture
146 1,732 1,878
Construction
1,074 533 1,608
Information
412 880 1,292
Utilities
142 238 380
Mining
184 88 272
Other
749 1,640 2,388
Total Operational Impact on Employment 39,353 21,063 56,968 117,384 3.2%
Labor Income** ($ Millions)
Sector Description Direct Indirect Induced Total As a % of
State Total
Direct Operational Impact of the Oil and Natural Gas Industry $2,381.4
$2,381.4 1.1%
Indirect and Induced Operational Impacts on Other Industries
Services
$634.7 $1,504.7 $2,139.3
Finance, insurance, real estate, rental and leasing
$174.6 $439.1 $613.7
Wholesale and retail trade
$184.0 $384.4 $568.4
Manufacturing
$214.3 $332.2 $546.5
Transportation and warehousing
$126.6 $119.4 $246.0
Information
$49.5 $91.1 $140.6
Agriculture
$7.6 $99.5 $107.1
Construction
$59.2 $29.6 $88.8
Utilities
$20.4 $33.7 $54.0
Mining
$19.4 $9.0 $28.4
Other $50.9 $113.4 $164.2 Total Operational Impact on Labor Income $2,381.4 $1,541.1 $3,156.1 $7,078.5 3.3%
Value Added ($ Millions)
Sector Description Direct Indirect Induced Total As a % of
State Total
Direct Operational Impact of the Oil and Natural Gas Industry $6,397.9
$6,397.9 1.9%
Indirect and Induced Operational Impacts on Other Industries
Services
$765.7 $1,816.8 $2,582.5
Finance, insurance, real estate, rental and leasing
$539.4 $1,518.4 $2,057.8
Wholesale and retail trade
$295.4 $621.7 $917.1
Manufacturing
$340.0 $556.7 $896.7
Transportation and warehousing
$165.2 $157.2 $322.3
Information
$94.7 $214.5 $309.1
Utilities
$63.0 $104.2 $167.2
Agriculture
$10.8 $144.3 $155.1
Construction
$86.3 $43.0 $129.2
Mining
$62.6 $28.7 $91.2
Other
$65.0 $145.1 $210.2
Total Operational Impact on Value Added $6,397.9 $2,487.9 $5,350.5 $14,236.3 4.1%
Source: PwC calculations using the IMPLAN modeling system (2015 database). * Employment is defined as the number of payroll and self-employed jobs, including part-time jobs. ** Labor income is defined as wages and salaries and benefits as well as proprietors' income.

Impacts of the Oil and Natural Gas Industry on the US Economy
52
The Economic Impact of the Oil and Natural Gas Industry in Mississippi, 2015
Employment*
Sector Description Direct Indirect Induced Total As a % of
State Total
Direct Operational Impact of the Oil and Natural Gas Industry 37,610
37,610 2.4%
Indirect and Induced Operational Impacts on Other Industries
Services
5,334 16,009 21,344
Wholesale and retail trade
1,431 4,726 6,157
Finance, insurance, real estate, rental and leasing
1,437 3,000 4,437
Transportation and warehousing
1,904 1,076 2,980
Manufacturing
1,007 1,965 2,972
Construction
1,450 324 1,774
Agriculture
140 1,023 1,163
Information
176 319 495
Utilities
118 175 293
Mining
64 21 85
Other
944 1,397 2,342
Total Operational Impact on Employment 37,610 14,004 30,036 81,650 5.3%
Labor Income** ($ Millions)
Sector Description Direct Indirect Induced Total As a % of
State Total
Direct Operational Impact of the Oil and Natural Gas Industry $2,445.0
$2,445.0 3.7%
Indirect and Induced Operational Impacts on Other Industries
Services
$210.0 $542.8 $752.9
Wholesale and retail trade
$75.5 $156.7 $232.3
Finance, insurance, real estate, rental and leasing
$60.2 $106.2 $166.4
Manufacturing
$59.0 $101.5 $160.6
Transportation and warehousing
$96.3 $52.8 $149.1
Construction
$61.5 $13.5 $75.0
Agriculture
$6.7 $50.9 $57.6
Utilities
$12.6 $17.9 $30.5
Information
$9.6 $17.3 $26.9
Mining
$3.5 $1.1 $4.6
Other $52.4 $79.8 $132.3 Total Operational Impact on Labor Income $2,445.0 $647.4 $1,140.8 $4,233.2 6.4%
Value Added ($ Millions)
Sector Description Direct Indirect Induced Total As a % of
State Total
Direct Operational Impact of the Oil and Natural Gas Industry $4,568.6
$4,568.6 4.2%
Indirect and Induced Operational Impacts on Other Industries
Services
$269.6 $686.9 $956.5
Finance, insurance, real estate, rental and leasing
$241.6 $567.6 $809.2
Wholesale and retail trade
$155.4 $293.6 $449.1
Manufacturing
$117.2 $196.6 $313.8
Transportation and warehousing
$124.7 $68.1 $192.8
Utilities
$46.1 $65.8 $111.9
Construction
$79.2 $17.6 $96.8
Information
$23.5 $53.1 $76.6
Agriculture
$7.5 $58.4 $65.8
Mining
$8.8 $2.8 $11.6
Other
$65.9 $100.7 $166.6
Total Operational Impact on Value Added $4,568.6 $1,139.5 $2,111.1 $7,819.2 7.2%
Source: PwC calculations using the IMPLAN modeling system (2015 database). * Employment is defined as the number of payroll and self-employed jobs, including part-time jobs. ** Labor income is defined as wages and salaries and benefits as well as proprietors' income.

Impacts of the Oil and Natural Gas Industry on the US Economy
53
The Economic Impact of the Oil and Natural Gas Industry in Missouri, 2015
Employment*
Sector Description Direct Indirect Induced Total As a % of
State Total
Direct Operational Impact of the Oil and Natural Gas Industry 42,420
42,420 1.2%
Indirect and Induced Operational Impacts on Other Industries
Services
9,464 29,413 38,877
Wholesale and retail trade
1,526 8,170 9,696
Finance, insurance, real estate, rental and leasing
2,746 6,141 8,887
Manufacturing
2,073 3,574 5,647
Transportation and warehousing
2,191 2,160 4,351
Agriculture
168 1,996 2,164
Construction
781 549 1,329
Information
402 813 1,216
Utilities
126 221 347
Mining
147 60 207
Other
599 1,745 2,344
Total Operational Impact on Employment 42,420 20,223 54,842 117,485 3.2%
Labor Income** ($ Millions)
Sector Description Direct Indirect Induced Total As a % of
State Total
Direct Operational Impact of the Oil and Natural Gas Industry $1,693.8
$1,693.8 0.9%
Indirect and Induced Operational Impacts on Other Industries
Services
$582.6 $1,305.4 $1,888.0
Finance, insurance, real estate, rental and leasing
$146.7 $307.2 $453.9
Wholesale and retail trade
$103.3 $326.5 $429.8
Manufacturing
$136.8 $239.7 $376.6
Transportation and warehousing
$124.3 $119.4 $243.7
Information
$50.8 $83.9 $134.6
Agriculture
$6.3 $81.9 $88.3
Construction
$37.8 $27.3 $65.1
Utilities
$15.5 $26.2 $41.7
Mining
$12.0 $4.8 $16.9
Other $40.6 $118.2 $158.8 Total Operational Impact on Labor Income $1,693.8 $1,256.8 $2,640.5 $5,591.2 3.0%
Value Added ($ Millions)
Sector Description Direct Indirect Induced Total As a % of
State Total
Direct Operational Impact of the Oil and Natural Gas Industry $3,691.5
$3,691.5 1.2%
Indirect and Induced Operational Impacts on Other Industries
Services
$713.4 $1,590.9 $2,304.2
Finance, insurance, real estate, rental and leasing
$537.3 $1,215.0 $1,752.3
Manufacturing
$269.0 $529.9 $798.9
Wholesale and retail trade
$176.5 $549.3 $725.8
Transportation and warehousing
$167.7 $159.5 $327.1
Information
$92.4 $194.5 $286.9
Utilities
$58.0 $97.3 $155.3
Agriculture
$7.4 $95.9 $103.3
Construction
$48.2 $34.2 $82.4
Mining
$32.9 $12.9 $45.8
Other
$49.8 $144.3 $194.0
Total Operational Impact on Value Added $3,691.5 $2,152.4 $4,623.7 $10,467.5 3.5%
Source: PwC calculations using the IMPLAN modeling system (2015 database). * Employment is defined as the number of payroll and self-employed jobs, including part-time jobs. ** Labor income is defined as wages and salaries and benefits as well as proprietors' income.

Impacts of the Oil and Natural Gas Industry on the US Economy
54
The Economic Impact of the Oil and Natural Gas Industry in Montana, 2015
Employment*
Sector Description Direct Indirect Induced Total As a % of
State Total
Direct Operational Impact of the Oil and Natural Gas Industry 17,139
17,139 2.6%
Indirect and Induced Operational Impacts on Other Industries
Services
2,456 8,674 11,130
Wholesale and retail trade
933 2,573 3,506
Finance, insurance, real estate, rental and leasing
765 1,777 2,543
Transportation and warehousing
821 475 1,296
Construction
761 184 945
Agriculture
68 676 744
Manufacturing
205 344 549
Information
96 194 290
Mining
151 71 222
Utilities
44 70 114
Other
456 596 1,051
Total Operational Impact on Employment 17,139 6,755 15,634 39,528 6.0%
Labor Income** ($ Millions)
Sector Description Direct Indirect Induced Total As a % of
State Total
Direct Operational Impact of the Oil and Natural Gas Industry $1,204.7
$1,204.7 4.2%
Indirect and Induced Operational Impacts on Other Industries
Services
$101.7 $321.5 $423.2
Wholesale and retail trade
$54.6 $92.3 $147.0
Finance, insurance, real estate, rental and leasing
$30.4 $56.1 $86.5
Transportation and warehousing
$48.3 $26.2 $74.5
Construction
$33.2 $7.9 $41.2
Manufacturing
$10.9 $15.0 $25.9
Agriculture
$2.2 $21.2 $23.4
Mining
$14.9 $6.8 $21.7
Information
$5.7 $11.1 $16.8
Utilities
$5.9 $9.1 $15.0
Other $27.4 $36.8 $64.1 Total Operational Impact on Labor Income $1,204.7 $335.0 $604.2 $2,143.9 7.5%
Value Added ($ Millions)
Sector Description Direct Indirect Induced Total As a % of
State Total
Direct Operational Impact of the Oil and Natural Gas Industry $3,266.9
$3,266.9 7.1%
Indirect and Induced Operational Impacts on Other Industries
Services
$120.0 $365.6 $485.6
Finance, insurance, real estate, rental and leasing
$110.5 $297.6 $408.2
Wholesale and retail trade
$100.6 $136.3 $236.9
Transportation and warehousing
$65.8 $39.5 $105.2
Mining
$43.9 $19.8 $63.7
Construction
$48.8 $11.7 $60.5
Manufacturing
$17.8 $23.6 $41.4
Agriculture
$3.3 $36.0 $39.3
Information
$11.4 $26.8 $38.2
Utilities
$14.9 $23.2 $38.2
Other
$32.6 $43.9 $76.4
Total Operational Impact on Value Added $3,266.9 $569.5 $1,024.2 $4,860.6 10.5%
Source: PwC calculations using the IMPLAN modeling system (2015 database). * Employment is defined as the number of payroll and self-employed jobs, including part-time jobs. ** Labor income is defined as wages and salaries and benefits as well as proprietors' income.

Impacts of the Oil and Natural Gas Industry on the US Economy
55
The Economic Impact of the Oil and Natural Gas Industry in Nebraska, 2015
Employment*
Sector Description Direct Indirect Induced Total As a % of
State Total
Direct Operational Impact of the Oil and Natural Gas Industry 14,652
14,652 1.1%
Indirect and Induced Operational Impacts on Other Industries
Services
6,227 29,061 35,288
Wholesale and retail trade
1,257 9,411 10,668
Finance, insurance, real estate, rental and leasing
1,518 5,846 7,364
Transportation and warehousing
1,786 1,707 3,493
Manufacturing
1,726 1,725 3,451
Agriculture
81 1,292 1,374
Construction
508 502 1,010
Information
286 635 921
Utilities
84 165 248
Mining
110 20 129
Other
466 2,098 2,564
Total Operational Impact on Employment 14,652 14,049 52,461 81,162 6.3%
Labor Income** ($ Millions)
Sector Description Direct Indirect Induced Total As a % of
State Total
Direct Operational Impact of the Oil and Natural Gas Industry $3,228.3
$3,228.3 4.6%
Indirect and Induced Operational Impacts on Other Industries
Services
$388.2 $1,167.2 $1,555.5
Wholesale and retail trade
$85.4 $316.5 $401.9
Finance, insurance, real estate, rental and leasing
$84.2 $259.2 $343.4
Manufacturing
$103.8 $105.1 $209.0
Transportation and warehousing
$107.0 $96.9 $203.8
Agriculture
$8.4 $143.3 $151.7
Information
$22.9 $44.3 $67.2
Construction
$27.3 $27.6 $54.9
Utilities
$9.7 $18.9 $28.6
Mining
$8.1 $1.4 $9.5
Other $29.2 $129.9 $159.2 Total Operational Impact on Labor Income $3,228.3 $874.2 $2,310.5 $6,412.9 9.2%
Value Added ($ Millions)
Sector Description Direct Indirect Induced Total As a % of
State Total
Direct Operational Impact of the Oil and Natural Gas Industry $3,602.6
$3,602.6 3.1%
Indirect and Induced Operational Impacts on Other Industries
Services
$483.4 $1,437.8 $1,921.1
Finance, insurance, real estate, rental and leasing
$283.7 $1,309.5 $1,593.2
Wholesale and retail trade
$164.2 $556.2 $720.5
Manufacturing
$194.4 $223.7 $418.1
Transportation and warehousing
$174.5 $153.6 $328.1
Agriculture
$10.7 $177.4 $188.2
Information
$44.2 $104.8 $149.0
Utilities
$33.8 $64.3 $98.0
Construction
$31.0 $30.9 $62.0
Mining
$13.8 $2.5 $16.3
Other
$34.3 $151.8 $186.1
Total Operational Impact on Value Added $3,602.6 $1,468.0 $4,212.5 $9,283.1 8.0%
Source: PwC calculations using the IMPLAN modeling system (2015 database). * Employment is defined as the number of payroll and self-employed jobs, including part-time jobs. ** Labor income is defined as wages and salaries and benefits as well as proprietors' income.

Impacts of the Oil and Natural Gas Industry on the US Economy
56
The Economic Impact of the Oil and Natural Gas Industry in Nevada, 2015
Employment*
Sector Description Direct Indirect Induced Total As a % of
State Total
Direct Operational Impact of the Oil and Natural Gas Industry 14,839
14,839 0.9%
Indirect and Induced Operational Impacts on Other Industries
Services
3,845 13,870 17,715
Finance, insurance, real estate, rental and leasing
1,023 2,971 3,994
Wholesale and retail trade
467 2,837 3,304
Transportation and warehousing
764 930 1,694
Manufacturing
341 672 1,013
Mining
374 187 561
Construction
284 216 500
Information
111 260 370
Agriculture
10 128 138
Utilities
26 52 79
Other
171 507 678
Total Operational Impact on Employment 14,839 7,417 22,630 44,886 2.8%
Labor Income** ($ Millions)
Sector Description Direct Indirect Induced Total As a % of
State Total
Direct Operational Impact of the Oil and Natural Gas Industry $554.6
$554.6 0.7%
Indirect and Induced Operational Impacts on Other Industries
Services
$221.5 $663.1 $884.5
Wholesale and retail trade
$32.2 $123.1 $155.4
Finance, insurance, real estate, rental and leasing
$40.4 $89.1 $129.4
Transportation and warehousing
$40.3 $48.8 $89.1
Manufacturing
$21.4 $43.0 $64.5
Mining
$42.3 $20.3 $62.6
Construction
$14.9 $11.8 $26.7
Information
$8.1 $17.6 $25.8
Utilities
$3.9 $7.5 $11.4
Agriculture
$0.4 $5.4 $5.8
Other $15.4 $45.6 $61.0 Total Operational Impact on Labor Income $554.6 $440.9 $1,075.2 $2,070.7 2.5%
Value Added ($ Millions)
Sector Description Direct Indirect Induced Total As a % of
State Total
Direct Operational Impact of the Oil and Natural Gas Industry $1,278.4
$1,278.4 0.9%
Indirect and Induced Operational Impacts on Other Industries
Services
$291.4 $932.8 $1,224.1
Finance, insurance, real estate, rental and leasing
$185.8 $465.1 $650.9
Wholesale and retail trade
$57.3 $221.8 $279.1
Mining
$109.2 $51.5 $160.7
Transportation and warehousing
$58.4 $85.4 $143.8
Manufacturing
$35.5 $79.5 $115.0
Information
$19.3 $48.0 $67.3
Construction
$24.7 $19.1 $43.8
Utilities
$14.8 $28.5 $43.3
Agriculture
$0.5 $7.4 $7.9
Other
$18.4 $54.0 $72.4
Total Operational Impact on Value Added $1,278.4 $815.2 $1,993.0 $4,086.5 2.9%
Source: PwC calculations using the IMPLAN modeling system (2015 database). * Employment is defined as the number of payroll and self-employed jobs, including part-time jobs. ** Labor income is defined as wages and salaries and benefits as well as proprietors' income.
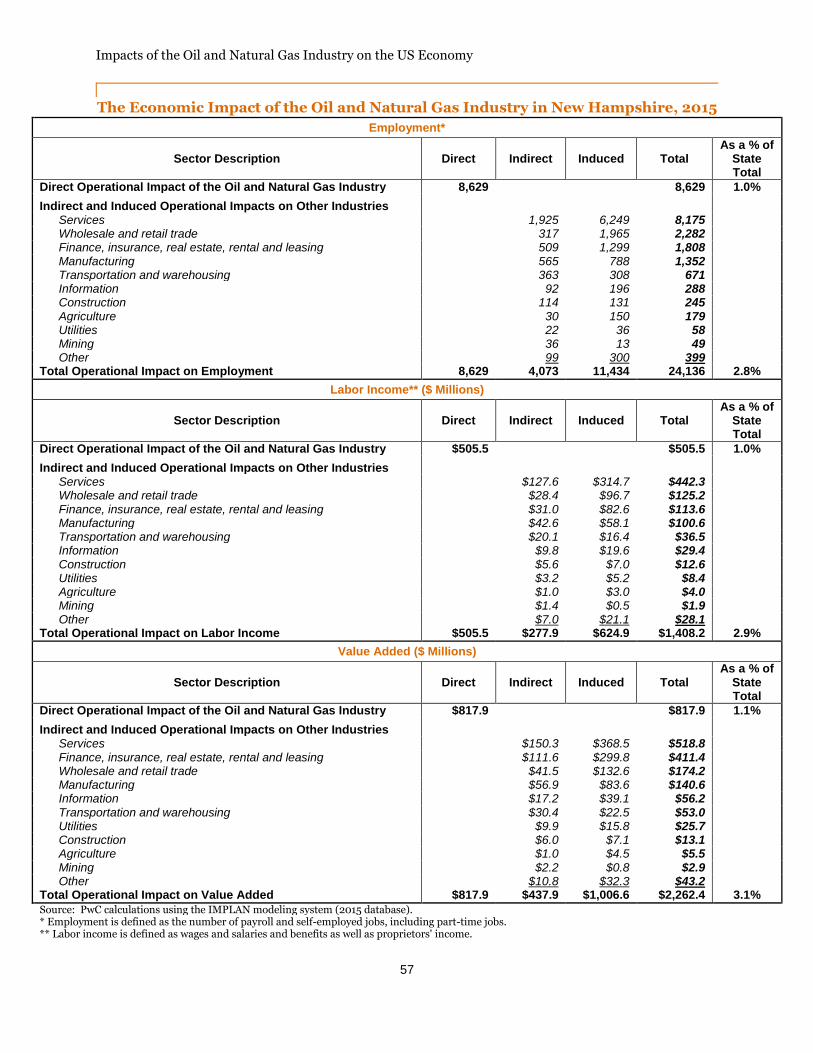
Impacts of the Oil and Natural Gas Industry on the US Economy
57
The Economic Impact of the Oil and Natural Gas Industry in New Hampshire, 2015
Employment*
Sector Description Direct Indirect Induced Total As a % of
State Total
Direct Operational Impact of the Oil and Natural Gas Industry 8,629
8,629 1.0%
Indirect and Induced Operational Impacts on Other Industries
Services
1,925 6,249 8,175
Wholesale and retail trade
317 1,965 2,282
Finance, insurance, real estate, rental and leasing
509 1,299 1,808
Manufacturing
565 788 1,352
Transportation and warehousing
363 308 671
Information
92 196 288
Construction
114 131 245
Agriculture
30 150 179
Utilities
22 36 58
Mining
36 13 49
Other
99 300 399
Total Operational Impact on Employment 8,629 4,073 11,434 24,136 2.8%
Labor Income** ($ Millions)
Sector Description Direct Indirect Induced Total As a % of
State Total
Direct Operational Impact of the Oil and Natural Gas Industry $505.5
$505.5 1.0%
Indirect and Induced Operational Impacts on Other Industries
Services
$127.6 $314.7 $442.3
Wholesale and retail trade
$28.4 $96.7 $125.2
Finance, insurance, real estate, rental and leasing
$31.0 $82.6 $113.6
Manufacturing
$42.6 $58.1 $100.6
Transportation and warehousing
$20.1 $16.4 $36.5
Information
$9.8 $19.6 $29.4
Construction
$5.6 $7.0 $12.6
Utilities
$3.2 $5.2 $8.4
Agriculture
$1.0 $3.0 $4.0
Mining
$1.4 $0.5 $1.9
Other $7.0 $21.1 $28.1 Total Operational Impact on Labor Income $505.5 $277.9 $624.9 $1,408.2 2.9%
Value Added ($ Millions)
Sector Description Direct Indirect Induced Total As a % of
State Total
Direct Operational Impact of the Oil and Natural Gas Industry $817.9
$817.9 1.1%
Indirect and Induced Operational Impacts on Other Industries
Services
$150.3 $368.5 $518.8
Finance, insurance, real estate, rental and leasing
$111.6 $299.8 $411.4
Wholesale and retail trade
$41.5 $132.6 $174.2
Manufacturing
$56.9 $83.6 $140.6
Information
$17.2 $39.1 $56.2
Transportation and warehousing
$30.4 $22.5 $53.0
Utilities
$9.9 $15.8 $25.7
Construction
$6.0 $7.1 $13.1
Agriculture
$1.0 $4.5 $5.5
Mining
$2.2 $0.8 $2.9
Other
$10.8 $32.3 $43.2
Total Operational Impact on Value Added $817.9 $437.9 $1,006.6 $2,262.4 3.1%
Source: PwC calculations using the IMPLAN modeling system (2015 database). * Employment is defined as the number of payroll and self-employed jobs, including part-time jobs. ** Labor income is defined as wages and salaries and benefits as well as proprietors' income.
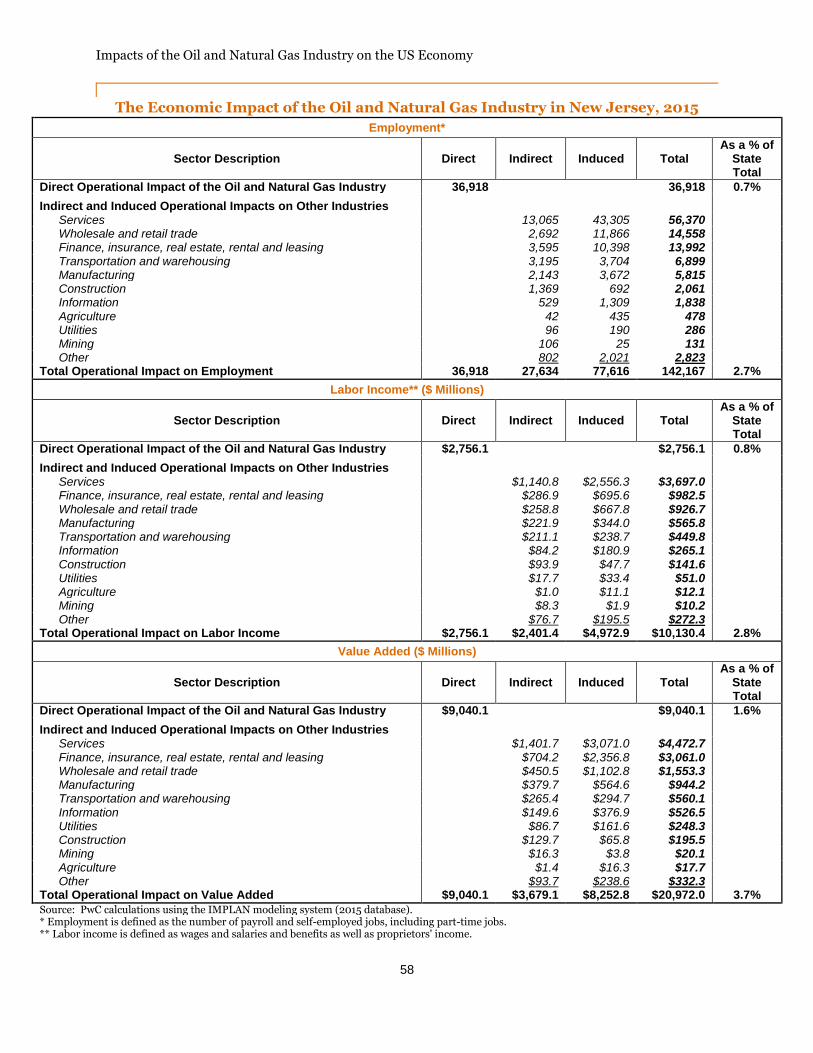
Impacts of the Oil and Natural Gas Industry on the US Economy
58
The Economic Impact of the Oil and Natural Gas Industry in New Jersey, 2015
Employment*
Sector Description Direct Indirect Induced Total As a % of
State Total
Direct Operational Impact of the Oil and Natural Gas Industry 36,918
36,918 0.7%
Indirect and Induced Operational Impacts on Other Industries
Services
13,065 43,305 56,370
Wholesale and retail trade
2,692 11,866 14,558
Finance, insurance, real estate, rental and leasing
3,595 10,398 13,992
Transportation and warehousing
3,195 3,704 6,899
Manufacturing
2,143 3,672 5,815
Construction
1,369 692 2,061
Information
529 1,309 1,838
Agriculture
42 435 478
Utilities
96 190 286
Mining
106 25 131
Other
802 2,021 2,823
Total Operational Impact on Employment 36,918 27,634 77,616 142,167 2.7%
Labor Income** ($ Millions)
Sector Description Direct Indirect Induced Total As a % of
State Total
Direct Operational Impact of the Oil and Natural Gas Industry $2,756.1
$2,756.1 0.8%
Indirect and Induced Operational Impacts on Other Industries
Services
$1,140.8 $2,556.3 $3,697.0
Finance, insurance, real estate, rental and leasing
$286.9 $695.6 $982.5
Wholesale and retail trade
$258.8 $667.8 $926.7
Manufacturing
$221.9 $344.0 $565.8
Transportation and warehousing
$211.1 $238.7 $449.8
Information
$84.2 $180.9 $265.1
Construction
$93.9 $47.7 $141.6
Utilities
$17.7 $33.4 $51.0
Agriculture
$1.0 $11.1 $12.1
Mining
$8.3 $1.9 $10.2
Other $76.7 $195.5 $272.3 Total Operational Impact on Labor Income $2,756.1 $2,401.4 $4,972.9 $10,130.4 2.8%
Value Added ($ Millions)
Sector Description Direct Indirect Induced Total As a % of
State Total
Direct Operational Impact of the Oil and Natural Gas Industry $9,040.1
$9,040.1 1.6%
Indirect and Induced Operational Impacts on Other Industries
Services
$1,401.7 $3,071.0 $4,472.7
Finance, insurance, real estate, rental and leasing
$704.2 $2,356.8 $3,061.0
Wholesale and retail trade
$450.5 $1,102.8 $1,553.3
Manufacturing
$379.7 $564.6 $944.2
Transportation and warehousing
$265.4 $294.7 $560.1
Information
$149.6 $376.9 $526.5
Utilities
$86.7 $161.6 $248.3
Construction
$129.7 $65.8 $195.5
Mining
$16.3 $3.8 $20.1
Agriculture
$1.4 $16.3 $17.7
Other
$93.7 $238.6 $332.3
Total Operational Impact on Value Added $9,040.1 $3,679.1 $8,252.8 $20,972.0 3.7%
Source: PwC calculations using the IMPLAN modeling system (2015 database). * Employment is defined as the number of payroll and self-employed jobs, including part-time jobs. ** Labor income is defined as wages and salaries and benefits as well as proprietors' income.

Impacts of the Oil and Natural Gas Industry on the US Economy
59
The Economic Impact of the Oil and Natural Gas Industry in New Mexico, 2015
Employment*
Sector Description Direct Indirect Induced Total As a % of
State Total
Direct Operational Impact of the Oil and Natural Gas Industry 45,328
45,328 4.2%
Indirect and Induced Operational Impacts on Other Industries
Services
4,969 19,788 24,757
Wholesale and retail trade
1,133 5,830 6,963
Finance, insurance, real estate, rental and leasing
1,638 3,623 5,261
Transportation and warehousing
824 903 1,726
Construction
1,290 367 1,657
Manufacturing
339 561 901
Agriculture
59 747 806
Information
130 346 476
Mining
159 63 221
Utilities
63 122 185
Other
490 1,355 1,845
Total Operational Impact on Employment 45,328 11,093 33,706 90,127 8.3%
Labor Income** ($ Millions)
Sector Description Direct Indirect Induced Total As a % of
State Total
Direct Operational Impact of the Oil and Natural Gas Industry $3,347.5
$3,347.5 6.4%
Indirect and Induced Operational Impacts on Other Industries
Services
$243.7 $744.2 $987.9
Wholesale and retail trade
$52.8 $193.7 $246.6
Finance, insurance, real estate, rental and leasing
$76.2 $130.1 $206.2
Transportation and warehousing
$49.2 $50.0 $99.2
Construction
$57.3 $16.2 $73.4
Manufacturing
$18.5 $28.2 $46.7
Agriculture
$2.4 $35.3 $37.7
Information
$7.4 $19.9 $27.3
Mining
$14.5 $5.6 $20.1
Utilities
$6.9 $13.1 $20.0
Other $34.9 $96.7 $131.6 Total Operational Impact on Labor Income $3,347.5 $563.8 $1,332.9 $5,244.2 10.0%
Value Added ($ Millions)
Sector Description Direct Indirect Induced Total As a % of
State Total
Direct Operational Impact of the Oil and Natural Gas Industry $9,250.9
$9,250.9 9.6%
Indirect and Induced Operational Impacts on Other Industries
Services
$309.9 $925.3 $1,235.2
Finance, insurance, real estate, rental and leasing
$245.0 $798.7 $1,043.7
Wholesale and retail trade
$100.7 $338.4 $439.1
Transportation and warehousing
$69.8 $70.5 $140.4
Mining
$76.8 $29.9 $106.7
Construction
$81.2 $23.1 $104.3
Information
$21.3 $75.9 $97.2
Manufacturing
$31.0 $46.2 $77.3
Utilities
$20.6 $39.4 $60.0
Agriculture
$2.6 $37.5 $40.1
Other
$61.7 $170.7 $232.4
Total Operational Impact on Value Added $9,250.9 $1,020.7 $2,555.6 $12,827.2 13.3%
Source: PwC calculations using the IMPLAN modeling system (2015 database). * Employment is defined as the number of payroll and self-employed jobs, including part-time jobs. ** Labor income is defined as wages and salaries and benefits as well as proprietors' income.

Impacts of the Oil and Natural Gas Industry on the US Economy
60
The Economic Impact of the Oil and Natural Gas Industry in New York, 2015
Employment*
Sector Description Direct Indirect Induced Total As a % of
State Total
Direct Operational Impact of the Oil and Natural Gas Industry 64,575
64,575 0.5%
Indirect and Induced Operational Impacts on Other Industries
Services
21,586 87,876 109,461
Finance, insurance, real estate, rental and leasing
5,647 18,839 24,486
Wholesale and retail trade
3,478 19,957 23,436
Transportation and warehousing
4,211 6,543 10,754
Manufacturing
3,671 6,886 10,558
Information
1,370 3,388 4,758
Construction
1,610 1,262 2,873
Agriculture
144 1,306 1,450
Utilities
280 547 827
Mining
302 96 398
Other
1,197 3,748 4,945
Total Operational Impact on Employment 64,575 43,498 150,449 258,522 2.2%
Labor Income** ($ Millions)
Sector Description Direct Indirect Induced Total As a % of
State Total
Direct Operational Impact of the Oil and Natural Gas Industry $5,907.4
$5,907.4 0.7%
Indirect and Induced Operational Impacts on Other Industries
Services
$1,939.0 $5,246.2 $7,185.2
Finance, insurance, real estate, rental and leasing
$864.1 $2,740.9 $3,605.0
Wholesale and retail trade
$307.6 $1,060.6 $1,368.2
Manufacturing
$303.4 $516.8 $820.2
Information
$257.1 $550.9 $808.0
Transportation and warehousing
$259.5 $406.9 $666.4
Construction
$95.6 $78.1 $173.7
Utilities
$43.9 $84.2 $128.1
Agriculture
$5.4 $59.8 $65.2
Mining
$14.9 $4.6 $19.6
Other $136.3 $422.7 $559.0 Total Operational Impact on Labor Income $5,907.4 $4,226.9 $11,171.6 $21,305.9 2.4%
Value Added ($ Millions)
Sector Description Direct Indirect Induced Total As a % of
State Total
Direct Operational Impact of the Oil and Natural Gas Industry $10,311.7
$10,311.7 0.7%
Indirect and Induced Operational Impacts on Other Industries
Finance, insurance, real estate, rental and leasing
$2,295.2 $6,633.8 $8,928.9
Services
$2,360.8 $6,218.2 $8,579.0
Wholesale and retail trade
$527.4 $1,748.1 $2,275.5
Information
$523.5 $1,308.0 $1,831.5
Manufacturing
$590.8 $1,041.3 $1,632.1
Transportation and warehousing
$311.7 $425.3 $737.0
Utilities
$141.5 $274.5 $416.0
Construction
$142.8 $113.7 $256.5
Agriculture
$6.4 $74.8 $81.3
Mining
$31.6 $9.9 $41.5
Other
$172.7 $532.8 $705.5
Total Operational Impact on Value Added $10,311.7 $7,104.4 $18,380.4 $35,796.5 2.5%
Source: PwC calculations using the IMPLAN modeling system (2015 database). * Employment is defined as the number of payroll and self-employed jobs, including part-time jobs. ** Labor income is defined as wages and salaries and benefits as well as proprietors' income.
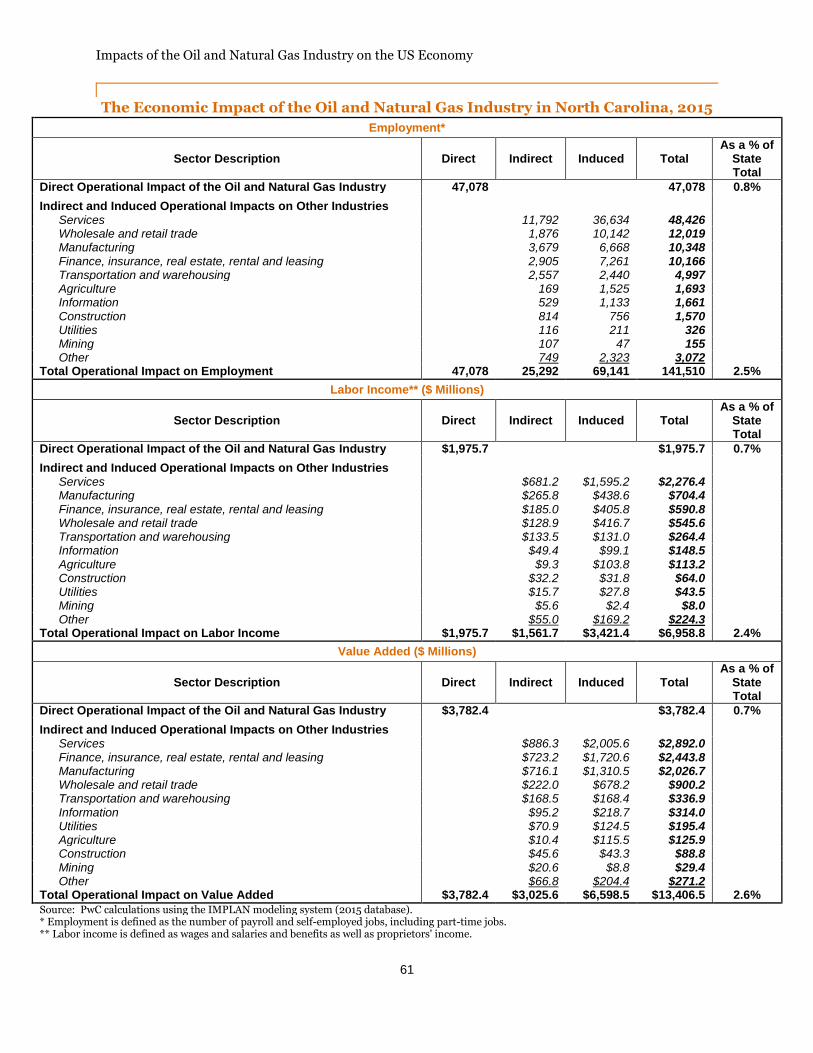
Impacts of the Oil and Natural Gas Industry on the US Economy
61
The Economic Impact of the Oil and Natural Gas Industry in North Carolina, 2015
Employment*
Sector Description Direct Indirect Induced Total As a % of
State Total
Direct Operational Impact of the Oil and Natural Gas Industry 47,078
47,078 0.8%
Indirect and Induced Operational Impacts on Other Industries
Services
11,792 36,634 48,426
Wholesale and retail trade
1,876 10,142 12,019
Manufacturing
3,679 6,668 10,348
Finance, insurance, real estate, rental and leasing
2,905 7,261 10,166
Transportation and warehousing
2,557 2,440 4,997
Agriculture
169 1,525 1,693
Information
529 1,133 1,661
Construction
814 756 1,570
Utilities
116 211 326
Mining
107 47 155
Other
749 2,323 3,072
Total Operational Impact on Employment 47,078 25,292 69,141 141,510 2.5%
Labor Income** ($ Millions)
Sector Description Direct Indirect Induced Total As a % of
State Total
Direct Operational Impact of the Oil and Natural Gas Industry $1,975.7
$1,975.7 0.7%
Indirect and Induced Operational Impacts on Other Industries
Services
$681.2 $1,595.2 $2,276.4
Manufacturing
$265.8 $438.6 $704.4
Finance, insurance, real estate, rental and leasing
$185.0 $405.8 $590.8
Wholesale and retail trade
$128.9 $416.7 $545.6
Transportation and warehousing
$133.5 $131.0 $264.4
Information
$49.4 $99.1 $148.5
Agriculture
$9.3 $103.8 $113.2
Construction
$32.2 $31.8 $64.0
Utilities
$15.7 $27.8 $43.5
Mining
$5.6 $2.4 $8.0
Other $55.0 $169.2 $224.3 Total Operational Impact on Labor Income $1,975.7 $1,561.7 $3,421.4 $6,958.8 2.4%
Value Added ($ Millions)
Sector Description Direct Indirect Induced Total As a % of
State Total
Direct Operational Impact of the Oil and Natural Gas Industry $3,782.4
$3,782.4 0.7%
Indirect and Induced Operational Impacts on Other Industries
Services
$886.3 $2,005.6 $2,892.0
Finance, insurance, real estate, rental and leasing
$723.2 $1,720.6 $2,443.8
Manufacturing
$716.1 $1,310.5 $2,026.7
Wholesale and retail trade
$222.0 $678.2 $900.2
Transportation and warehousing
$168.5 $168.4 $336.9
Information
$95.2 $218.7 $314.0
Utilities
$70.9 $124.5 $195.4
Agriculture
$10.4 $115.5 $125.9
Construction
$45.6 $43.3 $88.8
Mining
$20.6 $8.8 $29.4
Other
$66.8 $204.4 $271.2
Total Operational Impact on Value Added $3,782.4 $3,025.6 $6,598.5 $13,406.5 2.6%
Source: PwC calculations using the IMPLAN modeling system (2015 database). * Employment is defined as the number of payroll and self-employed jobs, including part-time jobs. ** Labor income is defined as wages and salaries and benefits as well as proprietors' income.

Impacts of the Oil and Natural Gas Industry on the US Economy
62
The Economic Impact of the Oil and Natural Gas Industry in North Dakota, 2015
Employment*
Sector Description Direct Indirect Induced Total As a % of
State Total
Direct Operational Impact of the Oil and Natural Gas Industry 41,506
41,506 7.0%
Indirect and Induced Operational Impacts on Other Industries
Services
4,515 14,889 19,405
Wholesale and retail trade
1,124 5,200 6,324
Finance, insurance, real estate, rental and leasing
1,670 3,163 4,833
Transportation and warehousing
750 801 1,551
Construction
777 287 1,065
Agriculture
53 709 762
Manufacturing
342 381 723
Information
176 320 496
Utilities
54 118 172
Mining
109 33 142
Other
374 1,309 1,683
Total Operational Impact on Employment 41,506 9,945 27,210 78,661 13.3%
Labor Income** ($ Millions)
Sector Description Direct Indirect Induced Total As a % of
State Total
Direct Operational Impact of the Oil and Natural Gas Industry $3,962.0
$3,962.0 11.9%
Indirect and Induced Operational Impacts on Other Industries
Services
$228.2 $624.3 $852.4
Wholesale and retail trade
$76.3 $207.5 $283.8
Finance, insurance, real estate, rental and leasing
$95.5 $156.6 $252.1
Transportation and warehousing
$48.4 $51.1 $99.5
Construction
$51.4 $18.9 $70.3
Manufacturing
$21.6 $22.5 $44.1
Information
$12.6 $23.8 $36.4
Agriculture
$2.2 $28.9 $31.0
Utilities
$7.5 $16.8 $24.3
Mining
$11.4 $3.4 $14.8
Other $22.8 $79.3 $102.1 Total Operational Impact on Labor Income $3,962.0 $577.9 $1,232.9 $5,772.8 17.4%
Value Added ($ Millions)
Sector Description Direct Indirect Induced Total As a % of
State Total
Direct Operational Impact of the Oil and Natural Gas Industry $8,580.2
$8,580.2 15.4%
Indirect and Induced Operational Impacts on Other Industries
Services
$272.1 $724.6 $996.7
Finance, insurance, real estate, rental and leasing
$264.0 $668.7 $932.7
Wholesale and retail trade
$141.0 $354.8 $495.9
Transportation and warehousing
$69.6 $73.6 $143.1
Construction
$79.1 $29.2 $108.3
Manufacturing
$43.6 $45.8 $89.4
Information
$26.4 $58.7 $85.1
Utilities
$22.9 $49.4 $72.2
Agriculture
$4.2 $55.7 $59.8
Mining
$40.5 $12.4 $52.9
Other
$24.7 $85.7 $110.4
Total Operational Impact on Value Added $8,580.2 $988.1 $2,158.5 $11,726.8 21.1%
Source: PwC calculations using the IMPLAN modeling system (2015 database). * Employment is defined as the number of payroll and self-employed jobs, including part-time jobs. ** Labor income is defined as wages and salaries and benefits as well as proprietors' income.
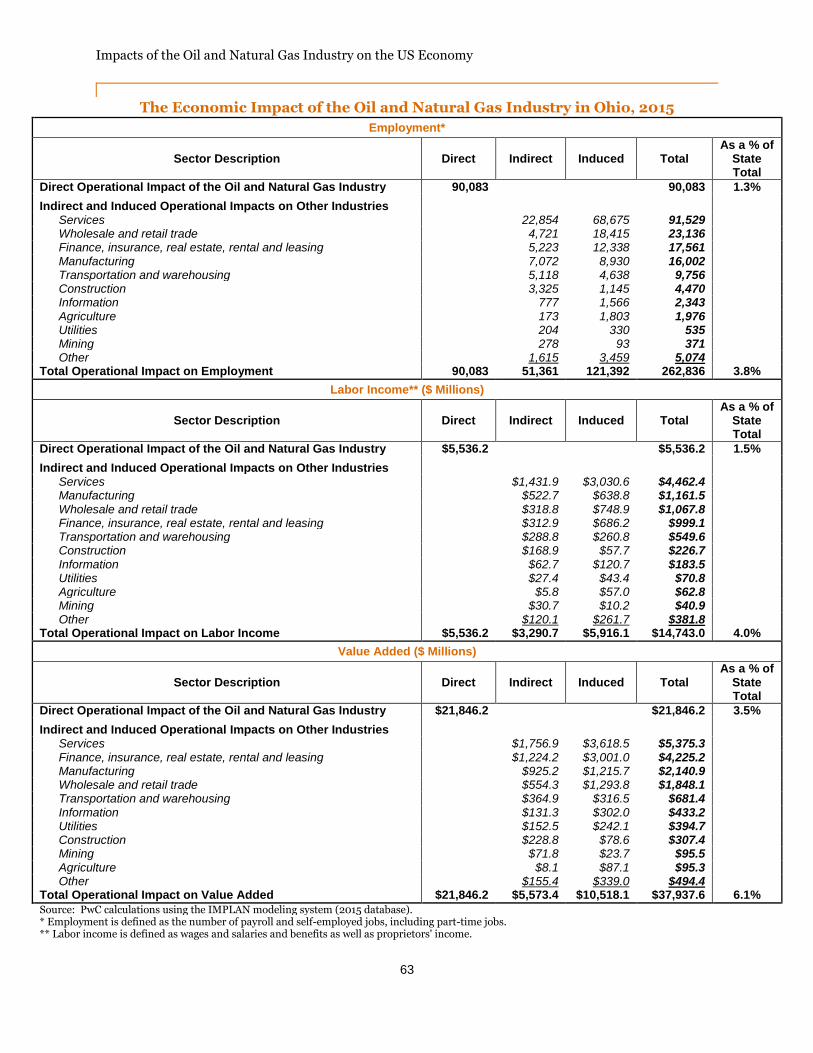
Impacts of the Oil and Natural Gas Industry on the US Economy
63
The Economic Impact of the Oil and Natural Gas Industry in Ohio, 2015
Employment*
Sector Description Direct Indirect Induced Total As a % of
State Total
Direct Operational Impact of the Oil and Natural Gas Industry 90,083
90,083 1.3%
Indirect and Induced Operational Impacts on Other Industries
Services
22,854 68,675 91,529
Wholesale and retail trade
4,721 18,415 23,136
Finance, insurance, real estate, rental and leasing
5,223 12,338 17,561
Manufacturing
7,072 8,930 16,002
Transportation and warehousing
5,118 4,638 9,756
Construction
3,325 1,145 4,470
Information
777 1,566 2,343
Agriculture
173 1,803 1,976
Utilities
204 330 535
Mining
278 93 371
Other
1,615 3,459 5,074
Total Operational Impact on Employment 90,083 51,361 121,392 262,836 3.8%
Labor Income** ($ Millions)
Sector Description Direct Indirect Induced Total As a % of
State Total
Direct Operational Impact of the Oil and Natural Gas Industry $5,536.2
$5,536.2 1.5%
Indirect and Induced Operational Impacts on Other Industries
Services
$1,431.9 $3,030.6 $4,462.4
Manufacturing
$522.7 $638.8 $1,161.5
Wholesale and retail trade
$318.8 $748.9 $1,067.8
Finance, insurance, real estate, rental and leasing
$312.9 $686.2 $999.1
Transportation and warehousing
$288.8 $260.8 $549.6
Construction
$168.9 $57.7 $226.7
Information
$62.7 $120.7 $183.5
Utilities
$27.4 $43.4 $70.8
Agriculture
$5.8 $57.0 $62.8
Mining
$30.7 $10.2 $40.9
Other $120.1 $261.7 $381.8 Total Operational Impact on Labor Income $5,536.2 $3,290.7 $5,916.1 $14,743.0 4.0%
Value Added ($ Millions)
Sector Description Direct Indirect Induced Total As a % of
State Total
Direct Operational Impact of the Oil and Natural Gas Industry $21,846.2
$21,846.2 3.5%
Indirect and Induced Operational Impacts on Other Industries
Services
$1,756.9 $3,618.5 $5,375.3
Finance, insurance, real estate, rental and leasing
$1,224.2 $3,001.0 $4,225.2
Manufacturing
$925.2 $1,215.7 $2,140.9
Wholesale and retail trade
$554.3 $1,293.8 $1,848.1
Transportation and warehousing
$364.9 $316.5 $681.4
Information
$131.3 $302.0 $433.2
Utilities
$152.5 $242.1 $394.7
Construction
$228.8 $78.6 $307.4
Mining
$71.8 $23.7 $95.5
Agriculture
$8.1 $87.1 $95.3
Other
$155.4 $339.0 $494.4
Total Operational Impact on Value Added $21,846.2 $5,573.4 $10,518.1 $37,937.6 6.1%
Source: PwC calculations using the IMPLAN modeling system (2015 database). * Employment is defined as the number of payroll and self-employed jobs, including part-time jobs. ** Labor income is defined as wages and salaries and benefits as well as proprietors' income.

Impacts of the Oil and Natural Gas Industry on the US Economy
64
The Economic Impact of the Oil and Natural Gas Industry in Oklahoma, 2015
Employment*
Sector Description Direct Indirect Induced Total As a % of
State Total
Direct Operational Impact of the Oil and Natural Gas Industry 163,857
163,857 7.2%
Indirect and Induced Operational Impacts on Other Industries
Services
18,320 98,014 116,334
Wholesale and retail trade
3,638 30,673 34,312
Finance, insurance, real estate, rental and leasing
6,142 22,735 28,877
Transportation and warehousing
3,042 4,945 7,987
Construction
4,808 1,898 6,705
Manufacturing
1,960 2,549 4,509
Information
581 2,097 2,678
Agriculture
154 2,449 2,603
Utilities
257 734 991
Mining
277 102 378
Other
1,861 8,002 9,863
Total Operational Impact on Employment 163,857 41,040 174,197 379,095 16.6%
Labor Income** ($ Millions)
Sector Description Direct Indirect Induced Total As a % of
State Total
Direct Operational Impact of the Oil and Natural Gas Industry $25,229.9
$25,229.9 20.5%
Indirect and Induced Operational Impacts on Other Industries
Services
$898.0 $3,928.6 $4,826.6
Wholesale and retail trade
$210.7 $1,131.7 $1,342.3
Finance, insurance, real estate, rental and leasing
$294.9 $839.3 $1,134.2
Transportation and warehousing
$171.3 $280.7 $452.0
Construction
$253.4 $99.9 $353.3
Manufacturing
$138.9 $152.8 $291.7
Information
$45.7 $145.6 $191.4
Utilities
$28.4 $81.0 $109.4
Agriculture
$4.6 $74.8 $79.3
Mining
$16.1 $5.0 $21.0
Other $114.5 $488.4 $602.8 Total Operational Impact on Labor Income $25,229.9 $2,176.5 $7,227.6 $34,634.0 28.1%
Value Added ($ Millions)
Sector Description Direct Indirect Induced Total As a % of
State Total
Direct Operational Impact of the Oil and Natural Gas Industry $35,705.2
$35,705.2 18.8%
Indirect and Induced Operational Impacts on Other Industries
Services
$1,142.0 $4,712.3 $5,854.3
Finance, insurance, real estate, rental and leasing
$793.5 $3,686.9 $4,480.3
Wholesale and retail trade
$413.2 $1,926.6 $2,339.8
Transportation and warehousing
$251.4 $375.3 $626.7
Manufacturing
$227.3 $261.3 $488.6
Information
$90.1 $375.8 $465.9
Construction
$322.6 $127.3 $449.9
Utilities
$95.4 $274.1 $369.5
Agriculture
$5.2 $84.8 $90.1
Mining
$40.8 $14.1 $54.9
Other
$149.8 $637.6 $787.4
Total Operational Impact on Value Added $35,705.2 $3,531.1 $12,476.1 $51,712.4 27.3%
Source: PwC calculations using the IMPLAN modeling system (2015 database). * Employment is defined as the number of payroll and self-employed jobs, including part-time jobs. ** Labor income is defined as wages and salaries and benefits as well as proprietors' income.

Impacts of the Oil and Natural Gas Industry on the US Economy
65
The Economic Impact of the Oil and Natural Gas Industry in Oregon, 2015
Employment*
Sector Description Direct Indirect Induced Total As a % of
State Total
Direct Operational Impact of the Oil and Natural Gas Industry 17,589
17,589 0.7%
Indirect and Induced Operational Impacts on Other Industries
Services
4,978 15,644 20,622
Wholesale and retail trade
760 4,190 4,950
Finance, insurance, real estate, rental and leasing
1,200 2,868 4,068
Manufacturing
1,377 2,540 3,917
Transportation and warehousing
979 1,050 2,030
Agriculture
213 1,546 1,759
Information
212 479 691
Construction
330 283 614
Mining
105 44 149
Utilities
48 92 139
Other
256 763 1,019
Total Operational Impact on Employment 17,589 10,458 29,500 57,547 2.4%
Labor Income** ($ Millions)
Sector Description Direct Indirect Induced Total As a % of
State Total
Direct Operational Impact of the Oil and Natural Gas Industry $754.0
$754.0 0.6%
Indirect and Induced Operational Impacts on Other Industries
Services
$311.1 $720.9 $1,032.0
Manufacturing
$97.4 $167.5 $264.9
Wholesale and retail trade
$52.5 $176.7 $229.2
Finance, insurance, real estate, rental and leasing
$60.1 $127.0 $187.1
Transportation and warehousing
$55.2 $58.3 $113.5
Agriculture
$11.1 $57.0 $68.1
Information
$19.8 $41.0 $60.8
Construction
$15.9 $14.4 $30.3
Utilities
$6.8 $12.9 $19.7
Mining
$4.9 $2.0 $6.9
Other $21.2 $63.0 $84.3 Total Operational Impact on Labor Income $754.0 $656.1 $1,440.7 $2,850.8 2.3%
Value Added ($ Millions)
Sector Description Direct Indirect Induced Total As a % of
State Total
Direct Operational Impact of the Oil and Natural Gas Industry $1,739.6
$1,739.6 0.8%
Indirect and Induced Operational Impacts on Other Industries
Services
$392.1 $861.4 $1,253.5
Finance, insurance, real estate, rental and leasing
$218.9 $609.4 $828.4
Manufacturing
$203.0 $387.5 $590.6
Wholesale and retail trade
$84.0 $254.7 $338.8
Transportation and warehousing
$72.3 $77.4 $149.7
Information
$34.5 $83.5 $118.0
Agriculture
$12.6 $78.4 $91.0
Utilities
$30.8 $57.0 $87.8
Construction
$22.3 $19.5 $41.9
Mining
$8.6 $3.5 $12.0
Other
$27.1 $80.1 $107.2
Total Operational Impact on Value Added $1,739.6 $1,106.3 $2,512.5 $5,358.4 2.5%
Source: PwC calculations using the IMPLAN modeling system (2015 database). * Employment is defined as the number of payroll and self-employed jobs, including part-time jobs. ** Labor income is defined as wages and salaries and benefits as well as proprietors' income.

Impacts of the Oil and Natural Gas Industry on the US Economy
66
The Economic Impact of the Oil and Natural Gas Industry in Pennsylvania, 2015
Employment*
Sector Description Direct Indirect Induced Total As a % of
State Total
Direct Operational Impact of the Oil and Natural Gas Industry 106,194
106,194 1.4%
Indirect and Induced Operational Impacts on Other Industries
Services
22,569 95,427 117,996
Wholesale and retail trade
4,692 26,224 30,916
Finance, insurance, real estate, rental and leasing
5,836 17,884 23,720
Manufacturing
5,778 8,399 14,178
Transportation and warehousing
5,472 6,671 12,143
Construction
3,313 1,582 4,895
Information
810 2,071 2,881
Agriculture
205 1,876 2,081
Utilities
252 531 783
Mining
544 233 777
Other
1,479 4,547 6,026
Total Operational Impact on Employment 106,194 50,950 165,446 322,589 4.3%
Labor Income** ($ Millions)
Sector Description Direct Indirect Induced Total As a % of
State Total
Direct Operational Impact of the Oil and Natural Gas Industry $10,246.1
$10,246.1 2.3%
Indirect and Induced Operational Impacts on Other Industries
Services
$1,649.1 $4,904.4 $6,553.5
Finance, insurance, real estate, rental and leasing
$407.5 $1,112.3 $1,519.8
Wholesale and retail trade
$350.9 $1,100.1 $1,451.0
Manufacturing
$435.2 $591.5 $1,026.7
Transportation and warehousing
$325.3 $380.1 $705.4
Information
$162.8 $296.7 $459.5
Construction
$190.0 $90.9 $280.9
Utilities
$38.5 $79.1 $117.6
Agriculture
$7.7 $77.7 $85.4
Mining
$36.9 $15.1 $51.9
Other $122.2 $374.3 $496.5 Total Operational Impact on Labor Income $10,246.1 $3,725.9 $9,022.2 $22,994.2 5.1%
Value Added ($ Millions)
Sector Description Direct Indirect Induced Total As a % of
State Total
Direct Operational Impact of the Oil and Natural Gas Industry $23,799.1
$23,799.1 3.4%
Indirect and Induced Operational Impacts on Other Industries
Services
$1,999.4 $5,729.2 $7,728.5
Finance, insurance, real estate, rental and leasing
$1,130.6 $4,026.7 $5,157.3
Wholesale and retail trade
$604.2 $1,735.3 $2,339.4
Manufacturing
$804.4 $1,123.9 $1,928.3
Information
$280.1 $695.5 $975.5
Transportation and warehousing
$385.4 $438.8 $824.2
Utilities
$133.3 $272.7 $406.0
Construction
$253.4 $121.2 $374.6
Mining
$133.9 $54.8 $188.7
Agriculture
$9.5 $104.3 $113.8
Other
$153.1 $467.9 $621.0
Total Operational Impact on Value Added $23,799.1 $5,887.2 $14,770.1 $44,456.4 6.3%
Source: PwC calculations using the IMPLAN modeling system (2015 database). * Employment is defined as the number of payroll and self-employed jobs, including part-time jobs. ** Labor income is defined as wages and salaries and benefits as well as proprietors' income.

Impacts of the Oil and Natural Gas Industry on the US Economy
67
The Economic Impact of the Oil and Natural Gas Industry in Rhode Island, 2015
Employment*
Sector Description Direct Indirect Induced Total As a % of
State Total
Direct Operational Impact of the Oil and Natural Gas Industry 4,148
4,148 0.7%
Indirect and Induced Operational Impacts on Other Industries
Services
1,291 5,092 6,382
Finance, insurance, real estate, rental and leasing
378 978 1,356
Wholesale and retail trade
177 1,128 1,305
Manufacturing
289 540 829
Transportation and warehousing
214 247 461
Information
57 129 186
Construction
70 77 147
Agriculture
4 48 52
Utilities
8 16 24
Mining
8 4 11
Other
55 202 257
Total Operational Impact on Employment 4,148 2,551 8,460 15,159 2.5%
Labor Income** ($ Millions)
Sector Description Direct Indirect Induced Total As a % of
State Total
Direct Operational Impact of the Oil and Natural Gas Industry $377.2
$377.2 1.1%
Indirect and Induced Operational Impacts on Other Industries
Services
$86.4 $255.5 $342.0
Finance, insurance, real estate, rental and leasing
$27.2 $68.1 $95.2
Wholesale and retail trade
$12.7 $49.7 $62.4
Manufacturing
$21.0 $36.6 $57.6
Information
$9.8 $17.0 $26.8
Transportation and warehousing
$12.2 $13.5 $25.6
Construction
$3.4 $4.1 $7.5
Utilities
$1.1 $2.3 $3.4
Agriculture
$0.1 $0.9 $1.0
Mining
$0.5 $0.2 $0.7
Other $5.3 $18.6 $23.9 Total Operational Impact on Labor Income $377.2 $179.7 $466.4 $1,023.3 2.9%
Value Added ($ Millions)
Sector Description Direct Indirect Induced Total As a % of
State Total
Direct Operational Impact of the Oil and Natural Gas Industry $720.6
$720.6 1.2%
Indirect and Induced Operational Impacts on Other Industries
Services
$105.8 $312.3 $418.0
Finance, insurance, real estate, rental and leasing
$85.4 $244.9 $330.3
Wholesale and retail trade
$23.3 $83.1 $106.4
Manufacturing
$31.6 $54.5 $86.1
Information
$18.4 $40.7 $59.0
Transportation and warehousing
$14.3 $16.0 $30.3
Utilities
$4.9 $9.7 $14.6
Construction
$5.5 $6.2 $11.7
Mining
$1.1 $0.5 $1.6
Agriculture
$0.1 $1.3 $1.4
Other
$7.7 $27.2 $34.9
Total Operational Impact on Value Added $720.6 $297.9 $796.4 $1,814.9 3.1%
Source: PwC calculations using the IMPLAN modeling system (2015 database). * Employment is defined as the number of payroll and self-employed jobs, including part-time jobs. ** Labor income is defined as wages and salaries and benefits as well as proprietors' income.

Impacts of the Oil and Natural Gas Industry on the US Economy
68
The Economic Impact of the Oil and Natural Gas Industry in South Carolina, 2015
Employment*
Sector Description Direct Indirect Induced Total As a % of
State Total
Direct Operational Impact of the Oil and Natural Gas Industry 25,860
25,860 1.0%
Indirect and Induced Operational Impacts on Other Industries
Services
4,789 15,707 20,496
Wholesale and retail trade
719 4,511 5,230
Manufacturing
2,003 3,106 5,109
Finance, insurance, real estate, rental and leasing
1,372 3,316 4,688
Transportation and warehousing
1,303 1,108 2,411
Agriculture
93 611 704
Construction
327 325 652
Information
183 416 599
Utilities
107 214 320
Mining
48 21 69
Other
351 1,086 1,438
Total Operational Impact on Employment 25,860 11,296 30,420 67,576 2.6%
Labor Income** ($ Millions)
Sector Description Direct Indirect Induced Total As a % of
State Total
Direct Operational Impact of the Oil and Natural Gas Industry $860.2
$860.2 0.7%
Indirect and Induced Operational Impacts on Other Industries
Services
$227.3 $607.5 $834.8
Manufacturing
$145.3 $209.9 $355.1
Wholesale and retail trade
$45.4 $171.3 $216.7
Finance, insurance, real estate, rental and leasing
$64.3 $141.9 $206.2
Transportation and warehousing
$63.9 $55.0 $118.9
Information
$14.2 $29.7 $43.8
Utilities
$13.7 $26.9 $40.6
Construction
$13.0 $13.8 $26.8
Agriculture
$3.3 $13.4 $16.7
Mining
$2.9 $1.2 $4.2
Other $24.6 $75.4 $99.9 Total Operational Impact on Labor Income $860.2 $617.8 $1,345.9 $2,823.9 2.3%
Value Added ($ Millions)
Sector Description Direct Indirect Induced Total As a % of
State Total
Direct Operational Impact of the Oil and Natural Gas Industry $1,707.0
$1,707.0 0.8%
Indirect and Induced Operational Impacts on Other Industries
Services
$283.5 $771.6 $1,055.1
Finance, insurance, real estate, rental and leasing
$233.8 $597.3 $831.2
Manufacturing
$268.8 $406.6 $675.5
Wholesale and retail trade
$84.9 $303.9 $388.8
Transportation and warehousing
$80.0 $68.2 $148.2
Utilities
$41.9 $81.6 $123.5
Information
$29.0 $72.1 $101.1
Construction
$21.0 $21.4 $42.3
Agriculture
$3.9 $20.3 $24.2
Mining
$9.3 $3.8 $13.2
Other
$30.5 $93.2 $123.7
Total Operational Impact on Value Added $1,707.0 $1,086.6 $2,440.1 $5,233.8 2.6%
Source: PwC calculations using the IMPLAN modeling system (2015 database). * Employment is defined as the number of payroll and self-employed jobs, including part-time jobs. ** Labor income is defined as wages and salaries and benefits as well as proprietors' income.

Impacts of the Oil and Natural Gas Industry on the US Economy
69
The Economic Impact of the Oil and Natural Gas Industry in South Dakota, 2015
Employment*
Sector Description Direct Indirect Induced Total As a % of
State Total
Direct Operational Impact of the Oil and Natural Gas Industry 10,221
10,221 1.7%
Indirect and Induced Operational Impacts on Other Industries
Services
1,267 4,587 5,854
Wholesale and retail trade
267 1,452 1,719
Finance, insurance, real estate, rental and leasing
448 1,052 1,500
Manufacturing
306 578 884
Agriculture
52 689 741
Transportation and warehousing
348 283 631
Construction
131 101 232
Information
54 109 163
Mining
56 14 70
Utilities
22 36 58
Other
129 340 469
Total Operational Impact on Employment 10,221 3,080 9,241 22,541 3.8%
Labor Income** ($ Millions)
Sector Description Direct Indirect Induced Total As a % of
State Total
Direct Operational Impact of the Oil and Natural Gas Industry $314.5
$314.5 1.1%
Indirect and Induced Operational Impacts on Other Industries
Services
$60.3 $184.2 $244.5
Wholesale and retail trade
$17.6 $55.8 $73.4
Finance, insurance, real estate, rental and leasing
$21.7 $45.2 $67.0
Manufacturing
$21.1 $36.5 $57.6
Agriculture
$3.7 $53.2 $56.9
Transportation and warehousing
$18.0 $14.6 $32.6
Information
$4.5 $7.8 $12.3
Construction
$5.7 $4.5 $10.2
Utilities
$2.5 $3.9 $6.4
Mining
$3.0 $0.8 $3.8
Other $7.5 $20.0 $27.5 Total Operational Impact on Labor Income $314.5 $165.6 $426.5 $906.6 3.2%
Value Added ($ Millions)
Sector Description Direct Indirect Induced Total As a % of
State Total
Direct Operational Impact of the Oil and Natural Gas Industry $567.4
$567.4 1.2%
Indirect and Induced Operational Impacts on Other Industries
Finance, insurance, real estate, rental and leasing
$112.8 $247.9 $360.7
Services
$75.0 $222.7 $297.7
Wholesale and retail trade
$33.0 $98.6 $131.6
Manufacturing
$31.6 $55.0 $86.6
Agriculture
$5.1 $72.6 $77.7
Transportation and warehousing
$22.9 $18.9 $41.8
Information
$9.9 $20.5 $30.4
Utilities
$9.2 $14.3 $23.5
Construction
$7.7 $6.0 $13.7
Mining
$8.6 $2.1 $10.8
Other
$8.6 $22.9 $31.5
Total Operational Impact on Value Added $567.4 $324.4 $781.6 $1,673.4 3.5%
Source: PwC calculations using the IMPLAN modeling system (2015 database). * Employment is defined as the number of payroll and self-employed jobs, including part-time jobs. ** Labor income is defined as wages and salaries and benefits as well as proprietors' income.

Impacts of the Oil and Natural Gas Industry on the US Economy
70
The Economic Impact of the Oil and Natural Gas Industry in Tennessee, 2015
Employment*
Sector Description Direct Indirect Induced Total As a % of
State Total
Direct Operational Impact of the Oil and Natural Gas Industry 36,055
36,055 0.9%
Indirect and Induced Operational Impacts on Other Industries
Services
8,076 27,452 35,528
Wholesale and retail trade
1,451 7,538 8,990
Finance, insurance, real estate, rental and leasing
2,142 5,348 7,490
Manufacturing
2,732 4,530 7,262
Transportation and warehousing
2,394 2,444 4,838
Agriculture
140 1,386 1,526
Construction
723 533 1,256
Information
317 721 1,038
Utilities
150 290 440
Mining
134 59 193
Other
527 1,452 1,980
Total Operational Impact on Employment 36,055 18,786 51,754 106,594 2.8%
Labor Income** ($ Millions)
Sector Description Direct Indirect Induced Total As a % of
State Total
Direct Operational Impact of the Oil and Natural Gas Industry $1,651.5
$1,651.5 0.8%
Indirect and Induced Operational Impacts on Other Industries
Services
$469.2 $1,383.8 $1,853.1
Manufacturing
$197.0 $323.8 $520.8
Wholesale and retail trade
$100.7 $324.3 $425.0
Finance, insurance, real estate, rental and leasing
$123.0 $292.9 $415.9
Transportation and warehousing
$138.0 $143.9 $281.9
Information
$24.0 $51.4 $75.5
Construction
$37.8 $28.8 $66.6
Utilities
$18.9 $36.5 $55.4
Agriculture
$3.1 $19.1 $22.2
Mining
$8.4 $3.6 $12.0
Other $34.7 $95.8 $130.5 Total Operational Impact on Labor Income $1,651.5 $1,154.9 $2,703.9 $5,510.3 2.7%
Value Added ($ Millions)
Sector Description Direct Indirect Induced Total As a % of
State Total
Direct Operational Impact of the Oil and Natural Gas Industry $4,276.7
$4,276.7 1.3%
Indirect and Induced Operational Impacts on Other Industries
Services
$579.3 $1,583.9 $2,163.2
Finance, insurance, real estate, rental and leasing
$378.1 $1,025.0 $1,403.1
Manufacturing
$355.3 $653.4 $1,008.7
Wholesale and retail trade
$187.1 $553.6 $740.8
Transportation and warehousing
$179.2 $187.2 $366.4
Information
$52.0 $130.4 $182.4
Utilities
$47.5 $87.6 $135.2
Construction
$44.2 $33.0 $77.3
Agriculture
$4.2 $33.5 $37.7
Mining
$23.4 $9.9 $33.3
Other
$43.1 $118.8 $161.8
Total Operational Impact on Value Added $4,276.7 $1,893.5 $4,416.3 $10,586.5 3.3%
Source: PwC calculations using the IMPLAN modeling system (2015 database). * Employment is defined as the number of payroll and self-employed jobs, including part-time jobs. ** Labor income is defined as wages and salaries and benefits as well as proprietors' income.

Impacts of the Oil and Natural Gas Industry on the US Economy
71
The Economic Impact of the Oil and Natural Gas Industry in Texas, 2015
Employment*
Sector Description Direct Indirect Induced Total As a % of
State Total
Direct Operational Impact of the Oil and Natural Gas Industry 701,395
701,395 4.3%
Indirect and Induced Operational Impacts on Other Industries
Services
96,213 583,442 679,656
Wholesale and retail trade
24,665 169,307 193,973
Finance, insurance, real estate, rental and leasing
33,778 155,362 189,140
Transportation and warehousing
22,066 34,610 56,676
Manufacturing
16,231 25,167 41,397
Construction
22,554 10,870 33,424
Information
3,673 14,385 18,058
Agriculture
841 14,431 15,271
Utilities
1,348 3,726 5,074
Mining
1,376 453 1,830
Other
10,315 39,034 49,349
Total Operational Impact on Employment 701,395 233,061 1,050,788 1,985,244 12.2%
Labor Income** ($ Millions)
Sector Description Direct Indirect Induced Total As a % of
State Total
Direct Operational Impact of the Oil and Natural Gas Industry $113,964.8
$113,964.8 11.4%
Indirect and Induced Operational Impacts on Other Industries
Services
$6,026.9 $26,309.6 $32,336.5
Finance, insurance, real estate, rental and leasing
$2,043.1 $7,382.0 $9,425.1
Wholesale and retail trade
$1,898.2 $7,300.7 $9,198.9
Transportation and warehousing
$1,354.2 $2,135.1 $3,489.3
Manufacturing
$1,376.7 $1,820.7 $3,197.4
Construction
$1,431.9 $690.8 $2,122.7
Information
$359.7 $1,293.0 $1,652.7
Utilities
$212.8 $584.7 $797.5
Agriculture
$22.9 $320.7 $343.6
Mining
$110.5 $31.7 $142.1
Other $706.9 $2,660.9 $3,367.8 Total Operational Impact on Labor Income $113,964.8 $15,543.7 $50,530.0 $180,038.5 18.1%
Value Added ($ Millions)
Sector Description Direct Indirect Induced Total As a % of
State Total
Direct Operational Impact of the Oil and Natural Gas Industry $215,325.2
$215,325.2 13.3%
Indirect and Induced Operational Impacts on Other Industries
Services
$7,358.8 $30,705.4 $38,064.2
Finance, insurance, real estate, rental and leasing
$4,864.4 $24,331.3 $29,195.7
Wholesale and retail trade
$3,727.4 $13,008.1 $16,735.5
Manufacturing
$3,164.8 $4,340.4 $7,505.2
Transportation and warehousing
$1,759.2 $2,775.5 $4,534.6
Information
$807.6 $3,519.2 $4,326.8
Utilities
$747.5 $2,054.9 $2,802.3
Construction
$1,856.2 $895.2 $2,751.3
Agriculture
$31.3 $497.6 $528.9
Mining
$282.3 $87.9 $370.2
Other
$890.0 $3,344.8 $4,234.8
Total Operational Impact on Value Added $215,325.2 $25,489.4 $85,560.3 $326,374.8 20.2%
Source: PwC calculations using the IMPLAN modeling system (2015 database). * Employment is defined as the number of payroll and self-employed jobs, including part-time jobs. ** Labor income is defined as wages and salaries and benefits as well as proprietors' income.

Impacts of the Oil and Natural Gas Industry on the US Economy
72
The Economic Impact of the Oil and Natural Gas Industry in Utah, 2015
Employment*
Sector Description Direct Indirect Induced Total As a % of
State Total
Direct Operational Impact of the Oil and Natural Gas Industry 23,174
23,174 1.3%
Indirect and Induced Operational Impacts on Other Industries
Services
5,198 16,229 21,427
Finance, insurance, real estate, rental and leasing
1,646 4,552 6,198
Wholesale and retail trade
1,205 4,835 6,040
Manufacturing
1,050 1,847 2,896
Transportation and warehousing
1,270 1,207 2,478
Construction
794 348 1,141
Information
283 652 935
Agriculture
38 464 501
Mining
211 91 302
Utilities
54 96 151
Other
500 1,061 1,562
Total Operational Impact on Employment 23,174 12,249 31,382 66,805 3.7%
Labor Income** ($ Millions)
Sector Description Direct Indirect Induced Total As a % of
State Total
Direct Operational Impact of the Oil and Natural Gas Industry $1,463.5
$1,463.5 1.7%
Indirect and Induced Operational Impacts on Other Industries
Services
$266.6 $653.3 $919.9
Wholesale and retail trade
$79.1 $205.9 $285.0
Finance, insurance, real estate, rental and leasing
$79.5 $181.6 $261.1
Manufacturing
$68.6 $114.7 $183.3
Transportation and warehousing
$71.4 $69.4 $140.8
Information
$22.6 $49.7 $72.3
Construction
$41.2 $18.0 $59.2
Mining
$17.0 $7.1 $24.1
Utilities
$7.1 $12.3 $19.4
Agriculture
$1.1 $15.2 $16.3
Other $32.2 $69.6 $101.8 Total Operational Impact on Labor Income $1,463.5 $686.3 $1,396.8 $3,546.6 4.0%
Value Added ($ Millions)
Sector Description Direct Indirect Induced Total As a % of
State Total
Direct Operational Impact of the Oil and Natural Gas Industry $3,717.4
$3,717.4 2.5%
Indirect and Induced Operational Impacts on Other Industries
Services
$327.1 $799.8 $1,127.0
Finance, insurance, real estate, rental and leasing
$285.0 $772.9 $1,057.9
Wholesale and retail trade
$130.6 $317.7 $448.4
Manufacturing
$121.0 $200.4 $321.4
Transportation and warehousing
$90.9 $88.2 $179.1
Information
$41.9 $103.6 $145.5
Mining
$78.1 $32.5 $110.6
Construction
$62.0 $27.2 $89.2
Utilities
$22.8 $39.0 $61.9
Agriculture
$1.4 $20.5 $21.9
Other
$43.0 $93.0 $136.1
Total Operational Impact on Value Added $3,717.4 $1,204.0 $2,495.0 $7,416.3 5.0%
Source: PwC calculations using the IMPLAN modeling system (2015 database). * Employment is defined as the number of payroll and self-employed jobs, including part-time jobs. ** Labor income is defined as wages and salaries and benefits as well as proprietors' income.

Impacts of the Oil and Natural Gas Industry on the US Economy
73
The Economic Impact of the Oil and Natural Gas Industry in Vermont, 2015
Employment*
Sector Description Direct Indirect Induced Total As a % of
State Total
Direct Operational Impact of the Oil and Natural Gas Industry 6,056
6,056 1.4%
Indirect and Induced Operational Impacts on Other Industries
Services
946 3,326 4,272
Wholesale and retail trade
123 767 890
Finance, insurance, real estate, rental and leasing
244 495 740
Manufacturing
213 449 661
Transportation and warehousing
227 167 394
Agriculture
36 235 270
Construction
70 69 139
Information
44 81 125
Utilities
18 29 47
Mining
30 13 43
Other
62 177 239
Total Operational Impact on Employment 6,056 2,013 5,807 13,875 3.2%
Labor Income** ($ Millions)
Sector Description Direct Indirect Induced Total As a % of
State Total
Direct Operational Impact of the Oil and Natural Gas Industry $219.4
$219.4 1.1%
Indirect and Induced Operational Impacts on Other Industries
Services
$46.0 $136.3 $182.2
Manufacturing
$13.7 $25.6 $39.4
Wholesale and retail trade
$7.1 $30.4 $37.6
Finance, insurance, real estate, rental and leasing
$10.9 $23.0 $34.0
Transportation and warehousing
$10.7 $8.8 $19.5
Agriculture
$0.9 $8.3 $9.2
Information
$3.0 $5.4 $8.4
Utilities
$3.3 $5.1 $8.3
Construction
$2.7 $2.9 $5.6
Mining
$1.2 $0.5 $1.8
Other $4.5 $12.9 $17.4 Total Operational Impact on Labor Income $219.4 $104.2 $259.1 $582.7 2.9%
Value Added ($ Millions)
Sector Description Direct Indirect Induced Total As a % of
State Total
Direct Operational Impact of the Oil and Natural Gas Industry $377.3
$377.3 1.2%
Indirect and Induced Operational Impacts on Other Industries
Services
$56.4 $167.0 $223.4
Finance, insurance, real estate, rental and leasing
$52.2 $113.1 $165.3
Wholesale and retail trade
$13.2 $50.2 $63.5
Manufacturing
$17.5 $33.0 $50.5
Utilities
$8.7 $13.3 $22.0
Transportation and warehousing
$12.5 $9.0 $21.5
Information
$5.7 $11.9 $17.6
Agriculture
$1.1 $10.9 $12.0
Mining
$7.6 $3.2 $10.8
Construction
$3.2 $3.2 $6.4
Other
$5.6 $15.9 $21.5
Total Operational Impact on Value Added $377.3 $183.8 $430.7 $991.7 3.2%
Source: PwC calculations using the IMPLAN modeling system (2015 database). * Employment is defined as the number of payroll and self-employed jobs, including part-time jobs. ** Labor income is defined as wages and salaries and benefits as well as proprietors' income.
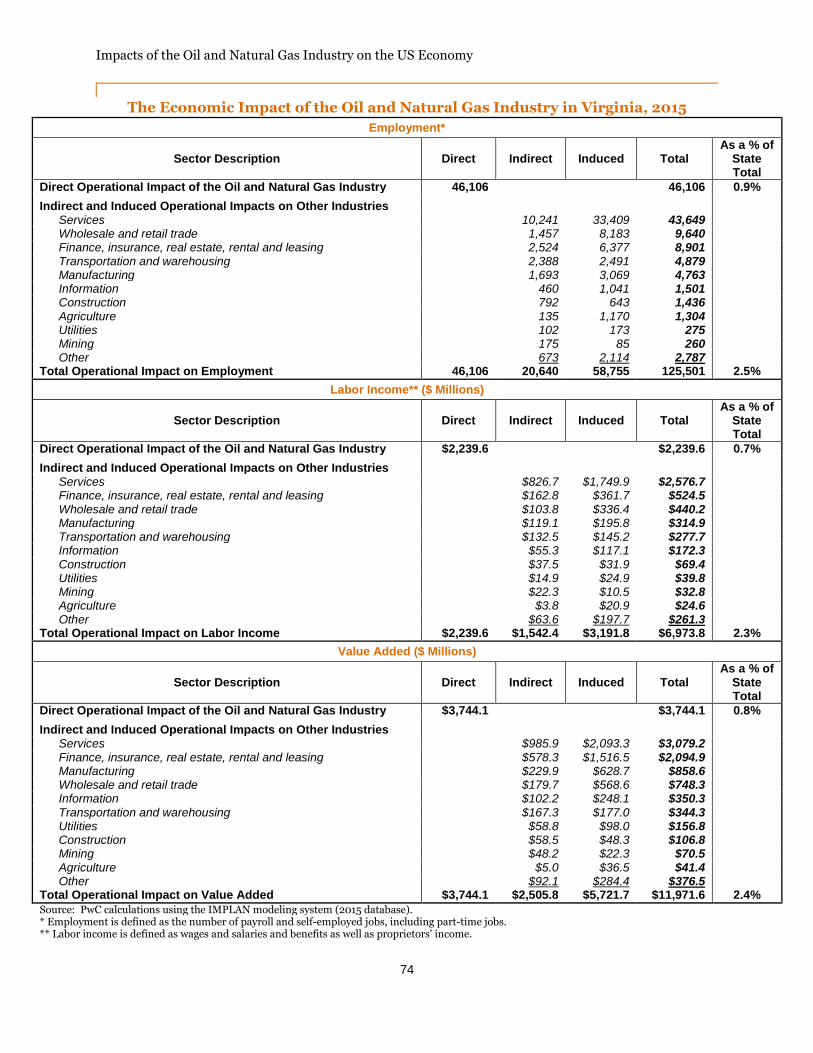
Impacts of the Oil and Natural Gas Industry on the US Economy
74
The Economic Impact of the Oil and Natural Gas Industry in Virginia, 2015
Employment*
Sector Description Direct Indirect Induced Total As a % of
State Total
Direct Operational Impact of the Oil and Natural Gas Industry 46,106
46,106 0.9%
Indirect and Induced Operational Impacts on Other Industries
Services
10,241 33,409 43,649
Wholesale and retail trade
1,457 8,183 9,640
Finance, insurance, real estate, rental and leasing
2,524 6,377 8,901
Transportation and warehousing
2,388 2,491 4,879
Manufacturing
1,693 3,069 4,763
Information
460 1,041 1,501
Construction
792 643 1,436
Agriculture
135 1,170 1,304
Utilities
102 173 275
Mining
175 85 260
Other
673 2,114 2,787
Total Operational Impact on Employment 46,106 20,640 58,755 125,501 2.5%
Labor Income** ($ Millions)
Sector Description Direct Indirect Induced Total As a % of
State Total
Direct Operational Impact of the Oil and Natural Gas Industry $2,239.6
$2,239.6 0.7%
Indirect and Induced Operational Impacts on Other Industries
Services
$826.7 $1,749.9 $2,576.7
Finance, insurance, real estate, rental and leasing
$162.8 $361.7 $524.5
Wholesale and retail trade
$103.8 $336.4 $440.2
Manufacturing
$119.1 $195.8 $314.9
Transportation and warehousing
$132.5 $145.2 $277.7
Information
$55.3 $117.1 $172.3
Construction
$37.5 $31.9 $69.4
Utilities
$14.9 $24.9 $39.8
Mining
$22.3 $10.5 $32.8
Agriculture
$3.8 $20.9 $24.6
Other $63.6 $197.7 $261.3 Total Operational Impact on Labor Income $2,239.6 $1,542.4 $3,191.8 $6,973.8 2.3%
Value Added ($ Millions)
Sector Description Direct Indirect Induced Total As a % of
State Total
Direct Operational Impact of the Oil and Natural Gas Industry $3,744.1
$3,744.1 0.8%
Indirect and Induced Operational Impacts on Other Industries
Services
$985.9 $2,093.3 $3,079.2
Finance, insurance, real estate, rental and leasing
$578.3 $1,516.5 $2,094.9
Manufacturing
$229.9 $628.7 $858.6
Wholesale and retail trade
$179.7 $568.6 $748.3
Information
$102.2 $248.1 $350.3
Transportation and warehousing
$167.3 $177.0 $344.3
Utilities
$58.8 $98.0 $156.8
Construction
$58.5 $48.3 $106.8
Mining
$48.2 $22.3 $70.5
Agriculture
$5.0 $36.5 $41.4
Other
$92.1 $284.4 $376.5
Total Operational Impact on Value Added $3,744.1 $2,505.8 $5,721.7 $11,971.6 2.4%
Source: PwC calculations using the IMPLAN modeling system (2015 database). * Employment is defined as the number of payroll and self-employed jobs, including part-time jobs. ** Labor income is defined as wages and salaries and benefits as well as proprietors' income.

Impacts of the Oil and Natural Gas Industry on the US Economy
75
The Economic Impact of the Oil and Natural Gas Industry in Washington, 2015
Employment*
Sector Description Direct Indirect Induced Total As a % of
State Total
Direct Operational Impact of the Oil and Natural Gas Industry 27,387
27,387 0.7%
Indirect and Induced Operational Impacts on Other Industries
Services
7,773 27,533 35,307
Wholesale and retail trade
2,122 7,727 9,849
Finance, insurance, real estate, rental and leasing
1,920 5,469 7,389
Manufacturing
1,730 3,187 4,917
Transportation and warehousing
1,972 2,027 3,999
Agriculture
251 2,264 2,515
Construction
1,543 552 2,095
Information
533 1,361 1,894
Utilities
110 193 303
Mining
141 52 192
Other
896 1,760 2,656
Total Operational Impact on Employment 27,387 18,991 52,126 98,503 2.4%
Labor Income** ($ Millions)
Sector Description Direct Indirect Induced Total As a % of
State Total
Direct Operational Impact of the Oil and Natural Gas Industry $1,768.9
$1,768.9 0.7%
Indirect and Induced Operational Impacts on Other Industries
Services
$556.7 $1,362.7 $1,919.4
Wholesale and retail trade
$166.4 $406.9 $573.3
Finance, insurance, real estate, rental and leasing
$116.5 $291.2 $407.8
Manufacturing
$123.3 $205.3 $328.6
Information
$90.6 $236.0 $326.6
Transportation and warehousing
$129.7 $134.0 $263.6
Construction
$92.7 $32.8 $125.5
Agriculture
$14.5 $102.7 $117.1
Utilities
$15.3 $26.3 $41.6
Mining
$7.3 $2.6 $9.9
Other $74.3 $151.0 $225.3 Total Operational Impact on Labor Income $1,768.9 $1,387.2 $2,951.6 $6,107.8 2.3%
Value Added ($ Millions)
Sector Description Direct Indirect Induced Total As a % of
State Total
Direct Operational Impact of the Oil and Natural Gas Industry $5,228.2
$5,228.2 1.2%
Indirect and Induced Operational Impacts on Other Industries
Services
$715.4 $1,712.2 $2,427.6
Finance, insurance, real estate, rental and leasing
$411.3 $1,291.2 $1,702.5
Wholesale and retail trade
$316.1 $756.3 $1,072.4
Information
$176.8 $509.6 $686.4
Manufacturing
$215.5 $357.0 $572.5
Transportation and warehousing
$172.3 $172.5 $344.8
Construction
$129.5 $46.2 $175.8
Agriculture
$16.1 $135.3 $151.4
Utilities
$56.4 $92.8 $149.2
Mining
$28.3 $10.2 $38.5
Other
$96.5 $196.4 $292.9
Total Operational Impact on Value Added $5,228.2 $2,334.2 $5,279.8 $12,842.2 2.9%
Source: PwC calculations using the IMPLAN modeling system (2015 database). * Employment is defined as the number of payroll and self-employed jobs, including part-time jobs. ** Labor income is defined as wages and salaries and benefits as well as proprietors' income.

Impacts of the Oil and Natural Gas Industry on the US Economy
76
The Economic Impact of the Oil and Natural Gas Industry in West Virginia, 2015
Employment*
Sector Description Direct Indirect Induced Total As a % of
State Total
Direct Operational Impact of the Oil and Natural Gas Industry 38,211
38,211 4.2%
Indirect and Induced Operational Impacts on Other Industries
Services
3,780 13,617 17,397
Wholesale and retail trade
937 3,994 4,930
Finance, insurance, real estate, rental and leasing
960 2,032 2,992
Transportation and warehousing
888 730 1,618
Construction
1,032 225 1,257
Manufacturing
569 657 1,227
Mining
423 208 631
Agriculture
61 497 558
Information
135 258 392
Utilities
56 98 154
Other
468 1,037 1,506
Total Operational Impact on Employment 38,211 9,309 23,353 70,874 7.8%
Labor Income** ($ Millions)
Sector Description Direct Indirect Induced Total As a % of
State Total
Direct Operational Impact of the Oil and Natural Gas Industry $2,022.5
$2,022.5 4.7%
Indirect and Induced Operational Impacts on Other Industries
Services
$183.1 $540.3 $723.3
Wholesale and retail trade
$45.8 $131.9 $177.7
Finance, insurance, real estate, rental and leasing
$42.8 $77.2 $120.0
Transportation and warehousing
$48.4 $39.0 $87.4
Manufacturing
$40.5 $43.8 $84.3
Construction
$55.2 $11.9 $67.1
Mining
$44.9 $21.4 $66.2
Information
$11.0 $18.9 $30.0
Utilities
$6.8 $12.1 $18.9
Agriculture
$1.2 $1.9 $3.0
Other $28.3 $63.4 $91.7 Total Operational Impact on Labor Income $2,022.5 $508.1 $961.7 $3,492.2 8.0%
Value Added ($ Millions)
Sector Description Direct Indirect Induced Total As a % of
State Total
Direct Operational Impact of the Oil and Natural Gas Industry $5,415.9
$5,415.9 7.3%
Indirect and Induced Operational Impacts on Other Industries
Services
$221.0 $623.9 $844.9
Finance, insurance, real estate, rental and leasing
$161.0 $453.5 $614.4
Wholesale and retail trade
$85.4 $228.7 $314.1
Mining
$157.0 $73.7 $230.6
Manufacturing
$78.3 $86.5 $164.7
Construction
$91.7 $19.9 $111.6
Transportation and warehousing
$60.5 $47.9 $108.4
Information
$19.4 $41.4 $60.8
Utilities
$20.5 $36.9 $57.5
Agriculture
$1.5 $6.1 $7.5
Other
$38.2 $85.6 $123.8
Total Operational Impact on Value Added $5,415.9 $934.3 $1,704.0 $8,054.2 10.9%
Source: PwC calculations using the IMPLAN modeling system (2015 database). * Employment is defined as the number of payroll and self-employed jobs, including part-time jobs. ** Labor income is defined as wages and salaries and benefits as well as proprietors' income.

Impacts of the Oil and Natural Gas Industry on the US Economy
77
The Economic Impact of the Oil and Natural Gas Industry in Wisconsin, 2015
Employment*
Sector Description Direct Indirect Induced Total As a % of
State Total
Direct Operational Impact of the Oil and Natural Gas Industry 35,039
35,039 1.0%
Indirect and Induced Operational Impacts on Other Industries
Services
6,457 23,204 29,661
Manufacturing
4,001 5,949 9,951
Wholesale and retail trade
1,181 6,752 7,933
Finance, insurance, real estate, rental and leasing
1,709 4,428 6,137
Transportation and warehousing
1,578 1,735 3,314
Agriculture
182 1,955 2,137
Information
308 696 1,004
Construction
463 425 888
Utilities
92 175 267
Mining
109 54 163
Other
406 1,336 1,742
Total Operational Impact on Employment 35,039 16,485 46,711 98,236 2.7%
Labor Income** ($ Millions)
Sector Description Direct Indirect Induced Total As a % of
State Total
Direct Operational Impact of the Oil and Natural Gas Industry $1,437.2
$1,437.2 0.8%
Indirect and Induced Operational Impacts on Other Industries
Services
$376.4 $1,021.3 $1,397.6
Manufacturing
$287.7 $413.8 $701.5
Wholesale and retail trade
$77.3 $271.2 $348.6
Finance, insurance, real estate, rental and leasing
$94.2 $240.2 $334.3
Transportation and warehousing
$86.3 $93.4 $179.6
Agriculture
$7.1 $89.2 $96.3
Information
$27.3 $58.3 $85.6
Construction
$22.0 $21.3 $43.3
Utilities
$13.2 $25.0 $38.2
Mining
$7.1 $3.4 $10.6
Other $29.6 $96.1 $125.7 Total Operational Impact on Labor Income $1,437.2 $1,028.1 $2,333.1 $4,798.4 2.6%
Value Added ($ Millions)
Sector Description Direct Indirect Induced Total As a % of
State Total
Direct Operational Impact of the Oil and Natural Gas Industry $2,501.2
$2,501.2 0.8%
Indirect and Induced Operational Impacts on Other Industries
Services
$469.4 $1,265.8 $1,735.2
Finance, insurance, real estate, rental and leasing
$392.0 $1,071.3 $1,463.3
Manufacturing
$463.9 $713.1 $1,177.0
Wholesale and retail trade
$128.9 $452.4 $581.3
Transportation and warehousing
$111.7 $123.9 $235.6
Information
$55.7 $138.7 $194.4
Agriculture
$9.1 $119.5 $128.6
Utilities
$43.1 $80.9 $124.0
Construction
$32.5 $30.5 $63.0
Mining
$27.4 $13.1 $40.5
Other
$35.3 $114.0 $149.3
Total Operational Impact on Value Added $2,501.2 $1,768.9 $4,123.0 $8,393.1 2.7%
Source: PwC calculations using the IMPLAN modeling system (2015 database). * Employment is defined as the number of payroll and self-employed jobs, including part-time jobs. ** Labor income is defined as wages and salaries and benefits as well as proprietors' income.

Impacts of the Oil and Natural Gas Industry on the US Economy
78
The Economic Impact of the Oil and Natural Gas Industry in Wyoming, 2015
Employment*
Sector Description Direct Indirect Induced Total As a % of
State Total
Direct Operational Impact of the Oil and Natural Gas Industry 30,983
30,983 7.8%
Indirect and Induced Operational Impacts on Other Industries
Services
2,859 9,800 12,659
Wholesale and retail trade
1,026 3,237 4,263
Finance, insurance, real estate, rental and leasing
1,121 2,575 3,696
Transportation and warehousing
905 591 1,496
Construction
1,130 218 1,348
Mining
282 126 407
Agriculture
29 358 387
Manufacturing
153 164 316
Information
100 211 312
Utilities
54 89 143
Other
541 949 1,491
Total Operational Impact on Employment 30,983 8,201 18,318 57,502 14.4%
Labor Income** ($ Millions)
Sector Description Direct Indirect Induced Total As a % of
State Total
Direct Operational Impact of the Oil and Natural Gas Industry $3,194.6
$3,194.6 15.2%
Indirect and Induced Operational Impacts on Other Industries
Services
$119.7 $348.9 $468.6
Wholesale and retail trade
$60.5 $113.9 $174.4
Finance, insurance, real estate, rental and leasing
$45.2 $79.2 $124.3
Transportation and warehousing
$56.5 $35.1 $91.6
Construction
$62.6 $11.9 $74.6
Mining
$34.6 $15.0 $49.6
Manufacturing
$11.2 $10.0 $21.2
Information
$6.1 $12.6 $18.7
Utilities
$6.6 $10.7 $17.2
Agriculture
$0.8 $9.4 $10.2
Other $37.9 $67.1 $105.0 Total Operational Impact on Labor Income $3,194.6 $441.6 $713.7 $4,350.0 20.8%
Value Added ($ Millions)
Sector Description Direct Indirect Induced Total As a % of
State Total
Direct Operational Impact of the Oil and Natural Gas Industry $6,693.9
$6,693.9 17.0%
Indirect and Induced Operational Impacts on Other Industries
Finance, insurance, real estate, rental and leasing
$151.5 $442.0 $593.5
Services
$149.4 $427.9 $577.3
Wholesale and retail trade
$113.5 $210.8 $324.3
Mining
$143.5 $61.7 $205.2
Transportation and warehousing
$83.4 $55.4 $138.8
Construction
$103.4 $19.8 $123.2
Information
$13.9 $34.3 $48.2
Utilities
$16.3 $26.4 $42.7
Manufacturing
$22.2 $19.4 $41.6
Agriculture
$1.1 $15.1 $16.2
Other
$47.4 $84.0 $131.4
Total Operational Impact on Value Added $6,693.9 $845.6 $1,396.8 $8,936.4 22.7%
Source: PwC calculations using the IMPLAN modeling system (2015 database). * Employment is defined as the number of payroll and self-employed jobs, including part-time jobs. ** Labor income is defined as wages and salaries and benefits as well as proprietors' income.

Impacts of the Oil and Natural Gas Industry on the US Economy
79
Appendix B: Data Sources and Methodology
This Appendix describes the methodology used to derive the results for the study. It first discusses the data sources PwC utilized to develop estimates of the US oil and natural gas industry’s direct employment, labor income, and value added impacts and its dividend and capital investment impacts. It then describes the development of the indirect and induced impact estimates.
Estimating the Direct Jobs, Labor Income and Value Added
PwC’s employment estimates for the oil and natural gas industry include both full-time and part-time workers as well as self-employed business owners. The State Annual Personal Income and Employment data set published by the US Bureau of Economic Analysis (“BEA”) is the only source on total employment including self-employed individuals by industry. In cases where there is a one-to-one correspondence between the subsectors of the oil and natural gas industry as defined by PwC and the BEA sectors, we use the BEA data on employment, labor income and GDP without any further adjustment. This is the case for three NAICS codes: NAICS 211 (Oil and gas extraction), NAICS 447 (Gasoline stations), and NAICS 486 (Pipeline transportation).
For the remaining subsectors for the oil and natural gas industry, which are more disaggregated compared to the BEA data, PwC obtained each subsector’s paid employment from the US Bureau of Labor Statistics (“BLS”). PwC then estimated total self-employment for the more aggregated industry using the BEA data and allocated across the subsectors according to each industry’s share of paid employment. For example, self-employment was estimated for NAICS sector 213 (Support Activities for Mining) and then allocated across five sub-industries including 213111 (Drilling Oil and Gas Wells) and 213112 (Support Activities for Oil and Gas Operations). In a limited number of cases, data from the Census Bureau’s Nonemployer Statistics was used to allocate self-employment across subsectors.11 Direct employment was separately estimated for the US as a whole and for each of the 50 states and the District of Columbia. The state-level estimates were then scaled to match the national level estimates.
A similar methodology was used to estimate labor income and GDP for industries where there was not a one-to-one correspondence between the subsectors of the oil and natural gas industry as defined by PwC and the BEA sectors.
Estimating Capital Investment Impact
To quantify the industry’s capital investment impact, PwC estimated their capital expenditures for 2015 based on data from the Census Bureau and the BEA. For the impact analysis, capital spending was then translated into purchases of capital assets by type through the use of the so-called “capital flow matrix” from the BEA.
Estimating Dividend Impact
PwC obtained data on common stock dividend payments by companies in the US oil and natural gas industry. Dividend payments were allocated between households, foreign shareholders, retirement plans, governments, and other businesses using data from the Federal Reserve Board’s
11 A nonemployer is a business without paid employees. Most nonemployers are self-employed individuals operating small unincorporated businesses, which may or may not be the owner's principal source of income.

Impacts of the Oil and Natural Gas Industry on the US Economy
80
Flow of Funds Accounts. Dividends paid to households by the oil and natural gas industry were allocated by income group and across the 50 states and the District of Columbia using tax return data published by the IRS’s Statistics of Income Division.
Dividends paid to pension plans and other retirement accounts were allocated across income group based on data on retirement assets by income quintile obtained from the 2007 Survey of Consumer Finances, conducted by the Federal Reserve. The data were then allocated across the 50 states and the District of Columbia using data on the distribution of assets in 401(k) and thrift savings accounts from the Survey of Income and Program Participation conducted by the US Census Bureau. These data were combined with the data on dividends paid directly to households by the oil and natural gas industry to derive our estimates of total dividends paid by the industry to residents in each state.
To quantify the economic impact resulting from the dividend payments of the US oil and natural gas industry, PwC first converted dividend payments into additional household consumption expenditures. For dividends paid directly to households, after-tax dividend income was estimated by income class based on average tax rates on dividend income. The additional consumption from dividends received from the oil and natural gas industry was estimated using published estimates of the marginal propensity to consume by income quintile.12 Similarly, the additional consumption resulting from dividend payments by the oil and natural gas industry to retirement accounts was estimated based on published estimates of the marginal propensity to consume out of wealth.13
Estimating the Indirect and Induced Economic Impacts
Estimates of the indirect and induced economic impacts of the oil and natural gas industry were derived based on the IMPLAN models for the United States as a whole and for each of the 50 states and the District of Columbia.
The IMPLAN model is built around an “input-output” table that relates the purchases that each industry has made from other industries to the value of the output of each industry. To meet the demand for goods and services from an industry, purchases are made in other industries according to the patterns recorded in the input-output table. These purchases in turn spark still more purchases by the industry’s suppliers, and so on. Additionally, employees and business owners make personal purchases out of the additional income that is generated by this process, sending more new demands rippling through the economy. Multipliers describe these iterations. The Type I multiplier measures the direct and indirect effects of a change in economic activity. It captures the inter-industry effects only, i.e., industries buying from local industries. The Type II (Social Accounting Matrix or SAM) multiplier captures the direct and indirect effects and, in addition, it also reflects induced effects (i.e., changes in spending from households as income increases or decreases due to the changes in production). The indirect and induced impacts by the oil and natural gas industry on other sectors of the economy in terms of employment, labor
12 The marginal propensity to consume (“MPC”) is a measure of the additional consumption resulting from the last dollar of income earned. The MPCs used for this study were estimated as one minus the marginal propensity to save reported in Table 9 of Karen E. Dynan, Jonathan Skinner, and Stephen P. Zeldes, “Do the Rich Save More?” Journal of Political Economy, 2004, Vol. 112, No. 2, pgs. 397-443. The estimated MPCs ranged from a high of 0.93 in the lower income levels to 0.75 in the top income quintile. 13 A review of the literature suggests that each additional dollar of financial wealth increases consumption between two and five cents (see, for example, the literature review in Sherif Khalifa, Ousmane Seck, and Elwin Tobing, “Financial Wealth Effect: Evidence from Threshold Estimation,” September 26, 2010). To be conservative we have assumed an MPC out of wealth of 0.02 for all income groups.

Impacts of the Oil and Natural Gas Industry on the US Economy
81
income (including wages and salaries and benefits as well as proprietors’ income), and value added were calculated through the multiplier process built into the model.14
For a given direct impact in a state, IMPLAN state models capture only the indirect and induced effects within that state, excluding the indirect and induced effects crossing state borders (“cross-state spillover effects”). PwC estimated and allocated the cross-state indirect and induced employment, labor income, and value added effects by industry across the 50 states and the District of Columbia in proportion to each state’s share of the total national employment, labor income, and value added in each industry. The state indirect and induced effects reported throughout this study include such allocation of the cross-state spillover effects.
14 Because the IMPLAN models are used for total impact analysis (as opposed to marginal impact analysis) in this study, necessary adjustments are made to the initial indirect and induced impact estimates to prevent double-counting. For instance, any indirect or induced effects from the estimates that are mapped to the oil and natural gas industry are removed.

This document has been prepared pursuant to an engagement between PricewaterhouseCoopers LLP and its Client. As to all other parties, it is for general information purposes only, and should not be used as a substitute for consultation with professional advisors. © 2017 PricewaterhouseCoopers LLP. All rights reserved. PwC refers to the United States member firm, and may sometimes refer to the PwC network. Each member firm is a separate legal entity. Please see www.pwc.com/structure for further details.


![Changing Oil Realities - Possible Medium Term Impacts on ... · Average Gas Prices [EUR/GJ] REF 60$/b Oil 40 Oil 50 Oil 50to85 Oil 80 REF 2014 Cheap Gas Expensive Gas Gas prices are](https://static.documents.pub/doc/80x56/5f601ffad9c6f030fd7de39d/changing-oil-realities-possible-medium-term-impacts-on-average-gas-prices.jpg)


