35
Impacts of the Safe Routes to School Program on Walking and Bicycling Noreen McDonald University of North Carolina at Chapel Hill 1
| Date post: | 23-Jan-2017 |
| Category: |
Environment |
| Upload: | institute-for-transport-studies-its |
| View: | 550 times |
| Download: | 0 times |
Impacts of the Safe Routes to School Program on Walking and Bicycling
Noreen McDonald
University of North Carolina at Chapel Hill1
Outline
• Children’s Travel
• Impacts of the Safe Routes to School Program
• Work @ ITS
2
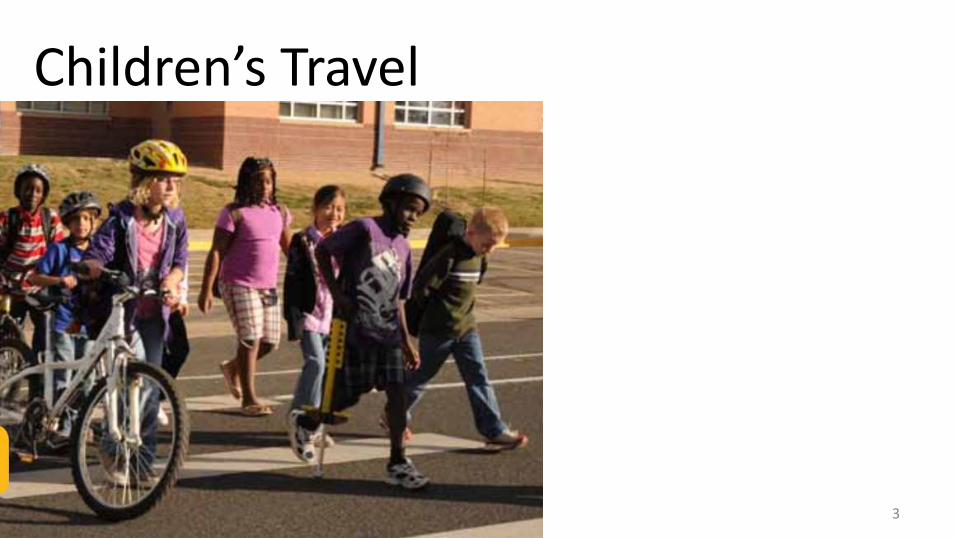
Children’s Travel
3

25%of the population
4Source: American Factfinder
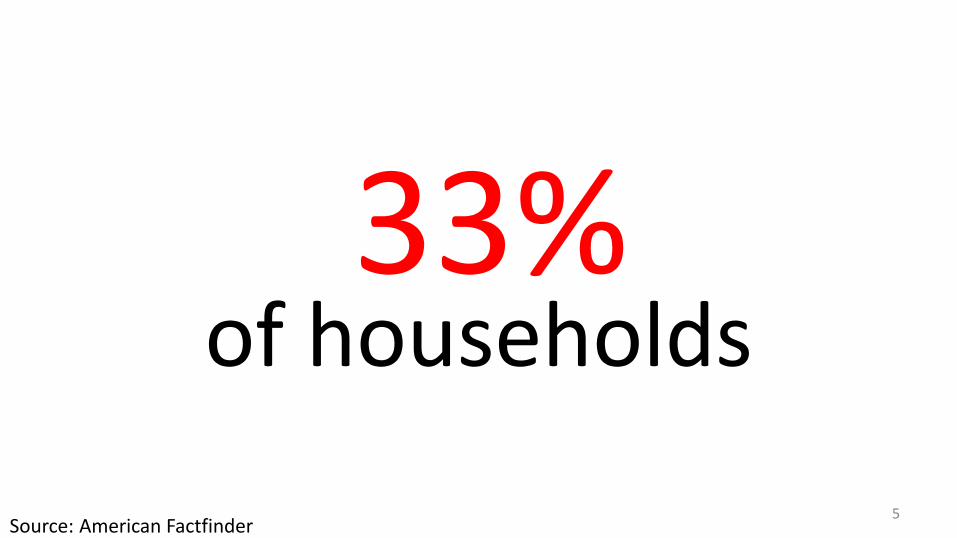
33%of households
5Source: American Factfinder
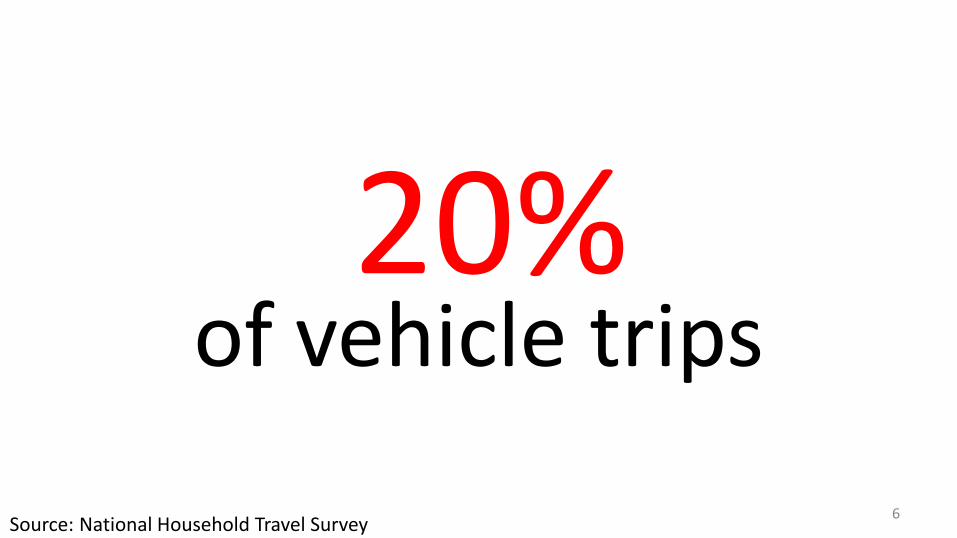
20%of vehicle trips
6Source: National Household Travel Survey
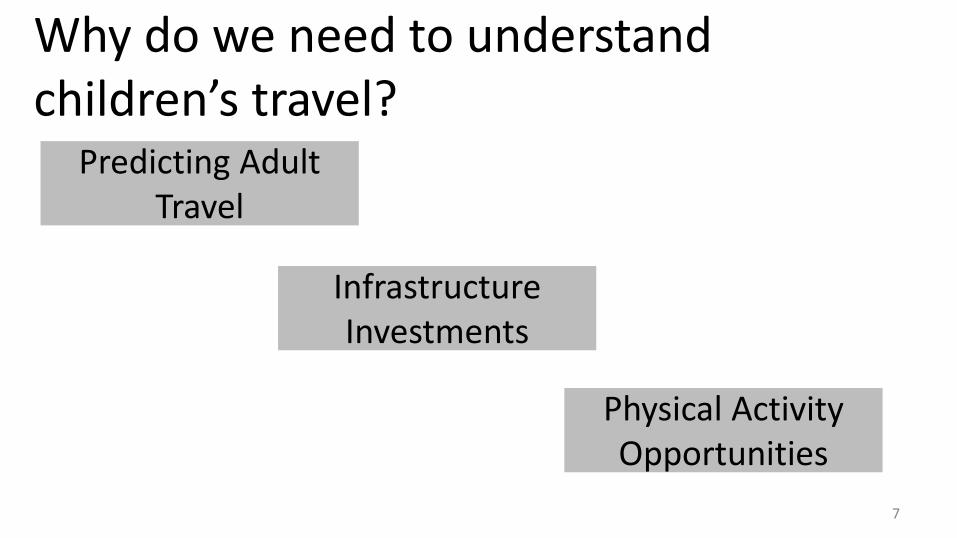
Why do we need to understand children’s travel?
7
Predicting Adult Travel
Infrastructure Investments
Physical Activity Opportunities

Safe Routes to School Program Impacts
8
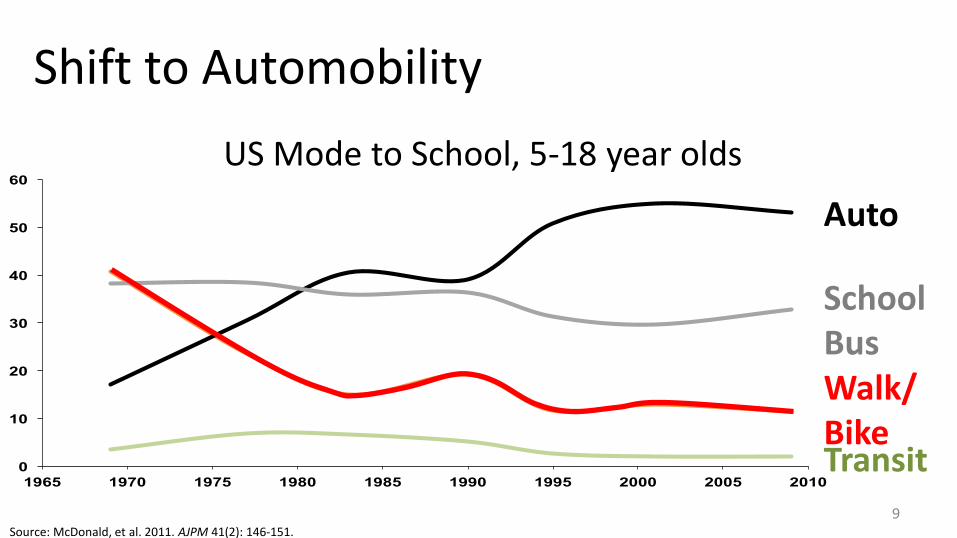
Shift to Automobility
9
0
10
20
30
40
50
60
1965 1970 1975 1980 1985 1990 1995 2000 2005 2010
Auto
Walk/Bike
School Bus
Transit
US Mode to School, 5-18 year olds
Source: McDonald, et al. 2011. AJPM 41(2): 146-151.
SRTS Goals
• “enable and encourage children to walk and bicycle to school”
• “make bicycling and walking to school a safer and more appealing transportation alternatives”
10
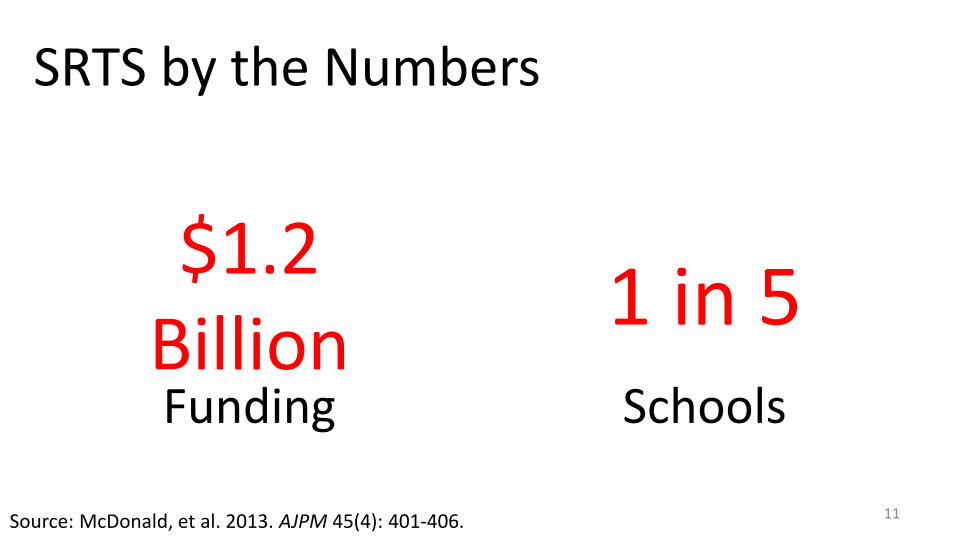
SRTS by the Numbers
11
Funding
$1.2 Billion
Schools
Source: McDonald, et al. 2013. AJPM 45(4): 401-406.
1 in 5

Research Question
• Do SRTS programs affect the proportion of children walking and bicycling to school?
12

Research Design
13
Randomized Controlled Trial
Quasi-experimental
• 4 states• 801 schools• 2007-2012
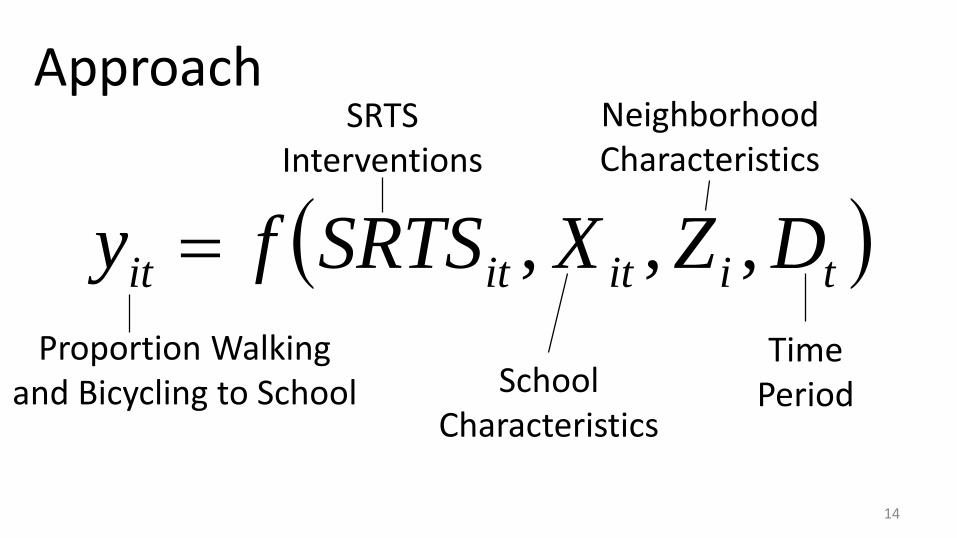
Approach
Proportion Walking and Bicycling to School
SRTS Interventions
School Characteristics
Neighborhood Characteristics
Time Period
14
tiititit DZXSRTSfy ,,,
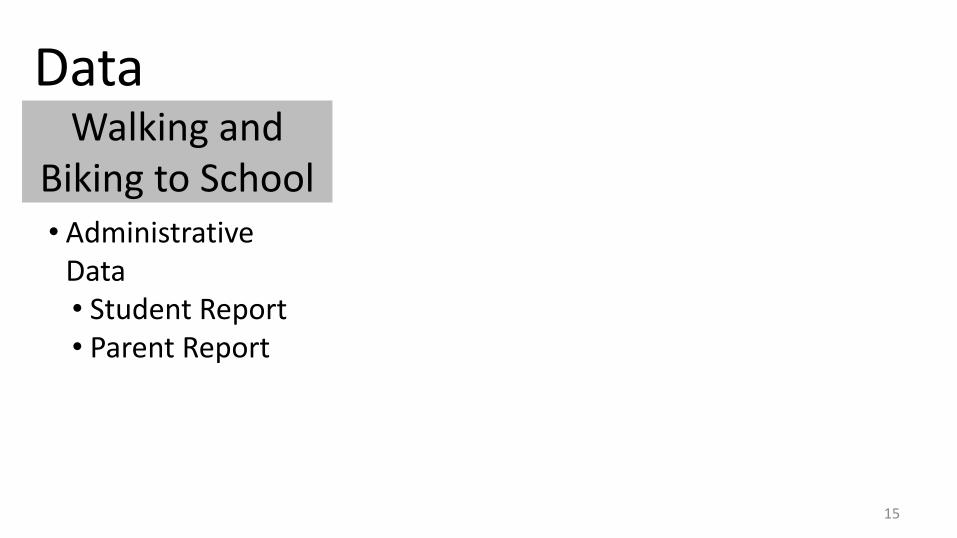
Data
15
Walking and Biking to School• Administrative
Data• Student Report• Parent Report
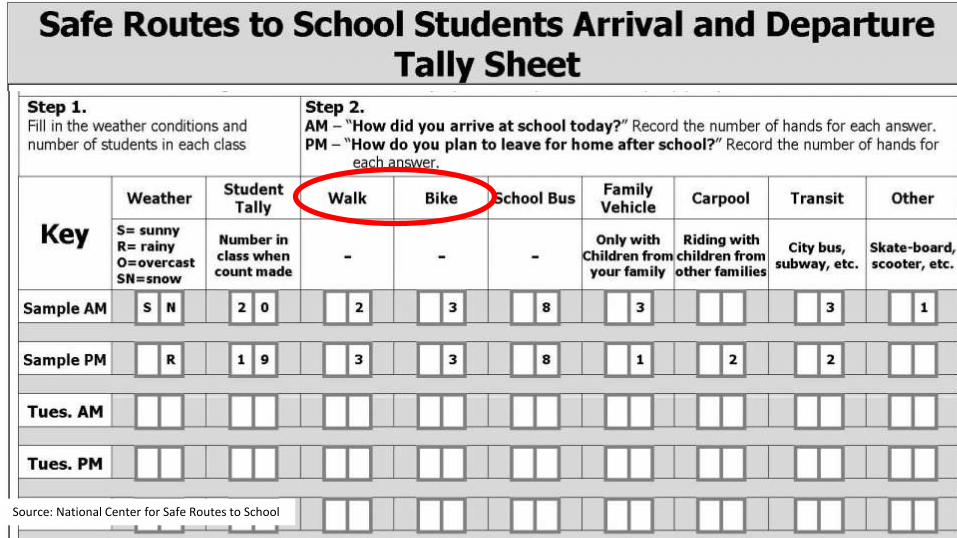
16Source: National Center for Safe Routes to School
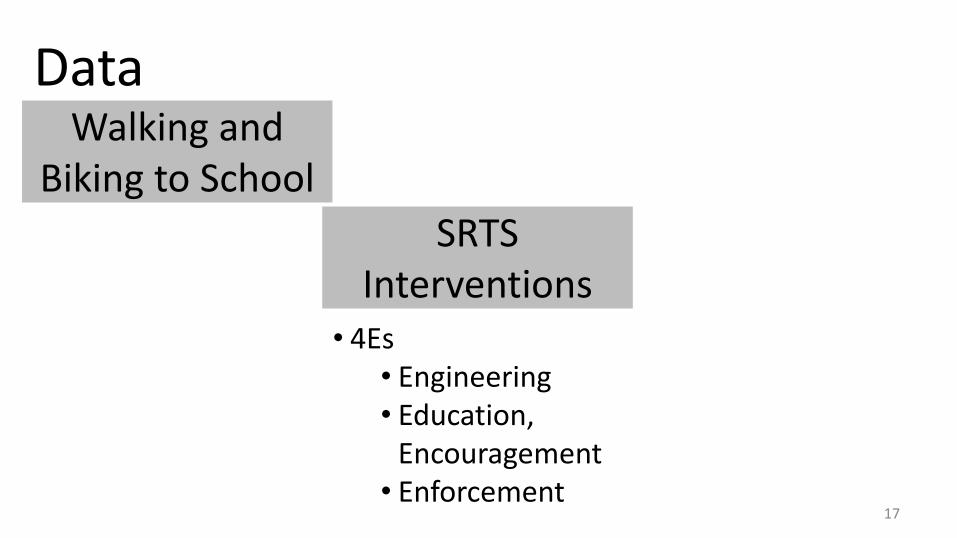
Data
17
Walking and Biking to School
SRTS Interventions
• 4Es• Engineering• Education,
Encouragement• Enforcement

Data: Measuring SRTS
18
% Walk Bike
SRTS
Step Function%
Walk Bike
SRTS
Linear Function
Time Time
% Walk Bike
SRTS
Combined
Time
Presence (1/0)
Number of Years +
Presence
Number of Years

Data
19
Walking and Biking to School
SRTS Interventions
School and Neighborhood
• US Dept of Education• Census• WalkScore
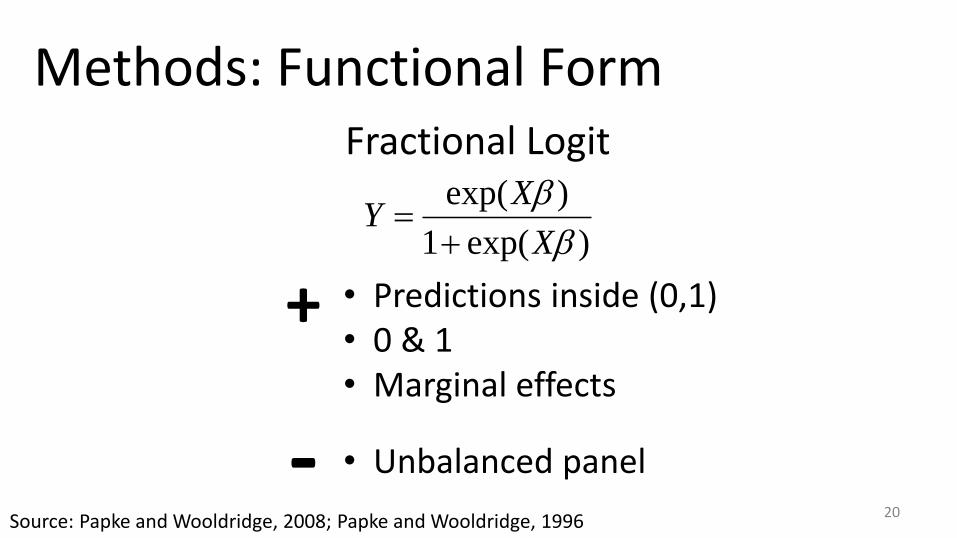
Methods: Functional Form
20
Fractional Logit
+
-
• Predictions inside (0,1)• 0 & 1• Marginal effects
• Unbalanced panel
)exp(1
)exp(
X
XY
Source: Papke and Wooldridge, 2008; Papke and Wooldridge, 1996

Results
21
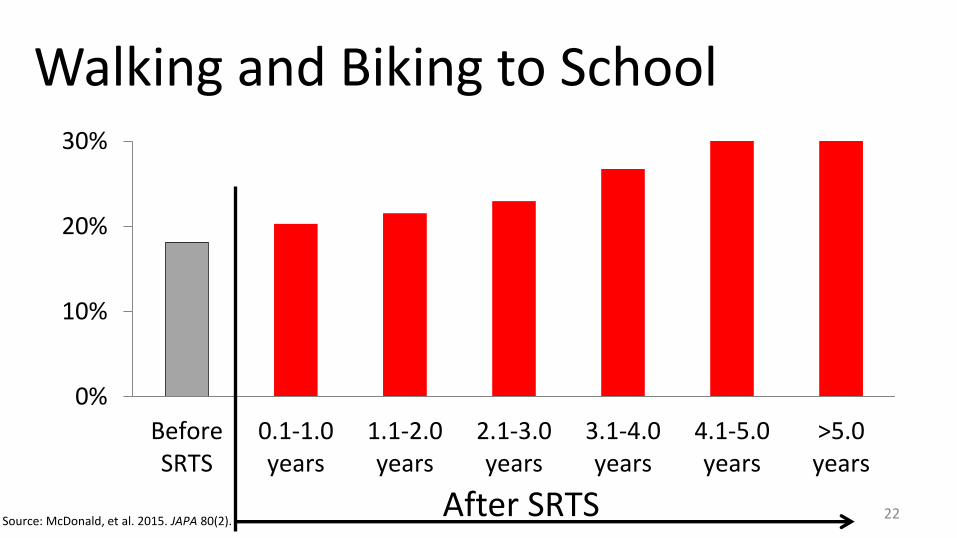
Walking and Biking to School
0%
10%
20%
30%
BeforeSRTS
0.1-1.0years
1.1-2.0years
2.1-3.0years
3.1-4.0years
4.1-5.0years
>5.0years
After SRTS 22Source: McDonald, et al. 2015. JAPA 80(2).
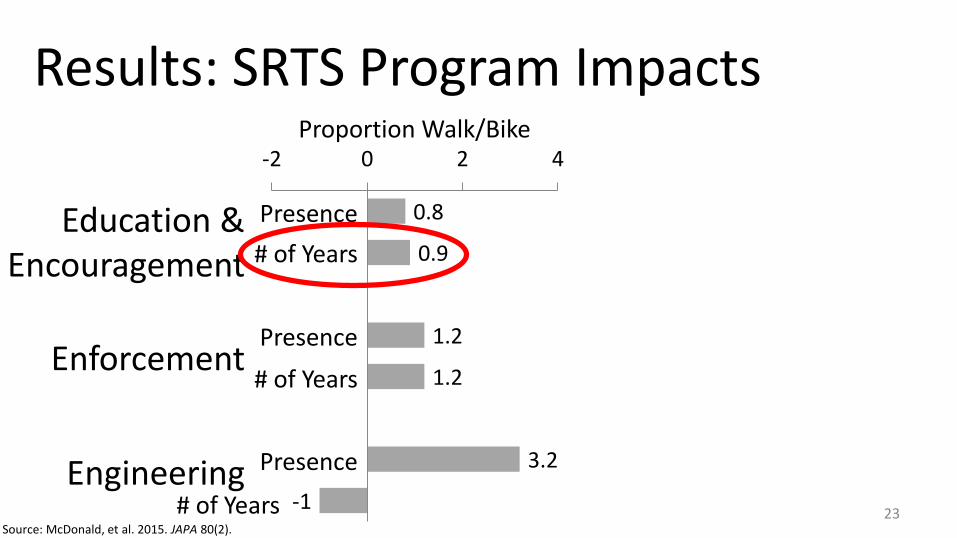
Results: SRTS Program Impacts
23
0.8
0.9
1.2
1.2
3.2
-1
-2 0 2 4
Presence
# of YearsEducation &
Encouragement
Enforcement
Engineering
Presence
# of Years
Presence
# of Years
Proportion Walk/Bike
Source: McDonald, et al. 2015. JAPA 80(2).

Results: SRTS Program Impacts
24
0.8
0.9
1.2
1.2
3.2
-1
-2 0 2 4
Presence
# of YearsEducation &
Encouragement
Enforcement
Engineering
Presence
# of Years
Presence
# of Years
Proportion Walk/Bike
Education and Encouragement• 0.9 point increase
per year• Over 5 years, a
relative increase of 25%
Source: McDonald, et al. 2015. JAPA 80(2).
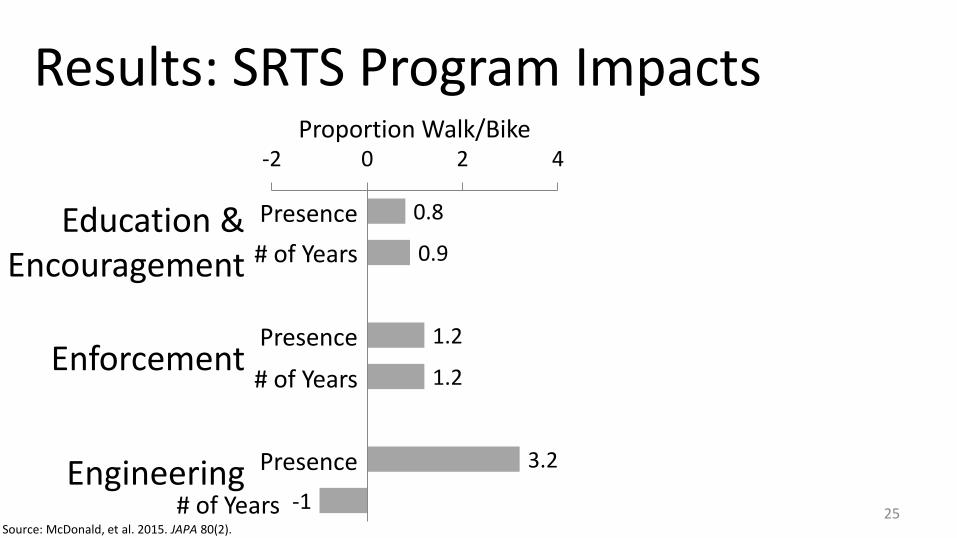
Results: SRTS Program Impacts
25
0.8
0.9
1.2
1.2
3.2
-1
-2 0 2 4
Presence
# of YearsEducation &
Encouragement
Enforcement
Engineering
Presence
# of Years
Presence
# of Years
Proportion Walk/Bike
Source: McDonald, et al. 2015. JAPA 80(2).
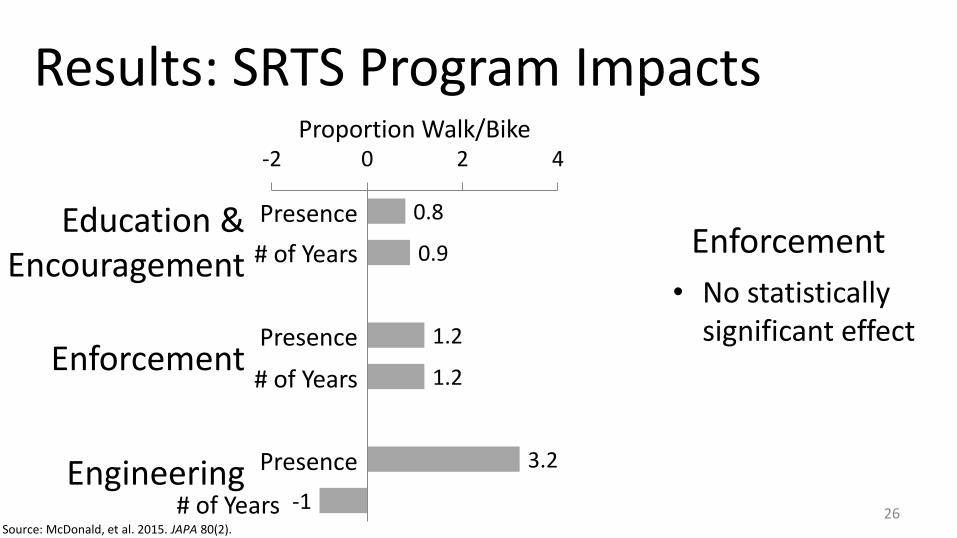
Results: SRTS Program Impacts
26
Enforcement
• No statistically significant effect
0.8
0.9
1.2
1.2
3.2
-1
-2 0 2 4
Presence
# of YearsEducation &
Encouragement
Enforcement
Engineering
Presence
# of Years
Presence
# of Years
Proportion Walk/Bike
Source: McDonald, et al. 2015. JAPA 80(2).

Results: SRTS Program Impacts
27
0.8
0.9
1.2
1.2
3.2
-1
-2 0 2 4
Presence
# of YearsEducation &
Encouragement
Enforcement
Engineering
Presence
# of Years
Presence
# of Years
Proportion Walk/Bike
Source: McDonald, et al. 2015. JAPA 80(2).
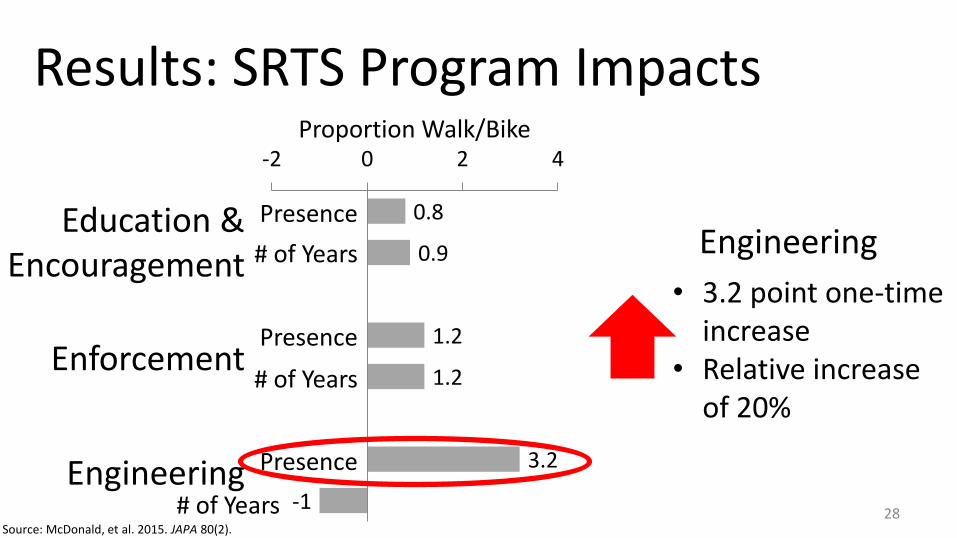
Results: SRTS Program Impacts
28
0.8
0.9
1.2
1.2
3.2
-1
-2 0 2 4
Presence
# of YearsEducation &
Encouragement
Enforcement
Engineering
Presence
# of Years
Presence
# of Years
Proportion Walk/Bike
Engineering
• 3.2 point one-time increase
• Relative increase of 20%
Source: McDonald, et al. 2015. JAPA 80(2).
Policy Implications
• SRTS program associated with more walking and bicycling
• Mainstream SRTS programs
29

Work @ ITS
30Image Source: http://www.basf-new-business.com/

Source: The Atlantic
31
Declining licensure & mobilityImpacts and explanations
Millennial Travel
Image Source: New York Times
Image Source: The Atlantic
The Millennial Economy: Links between Transport and Work for a New Generation
Image Source: https://www.sccsc.edu/client/NewsDetail.aspx?id=9381
Changing Nature of Workforce Transition & Role of Transport as Barrier/Facilitator
32
Tradeoffs between Environmental Benefits and Social Exclusion: Are There Risks to the Downturn in Driving?
33
Which groups have seen largest declines?Are needs being met?
http://media.salon.com/2013/08/boomerang_babies_money_jobs.jpg
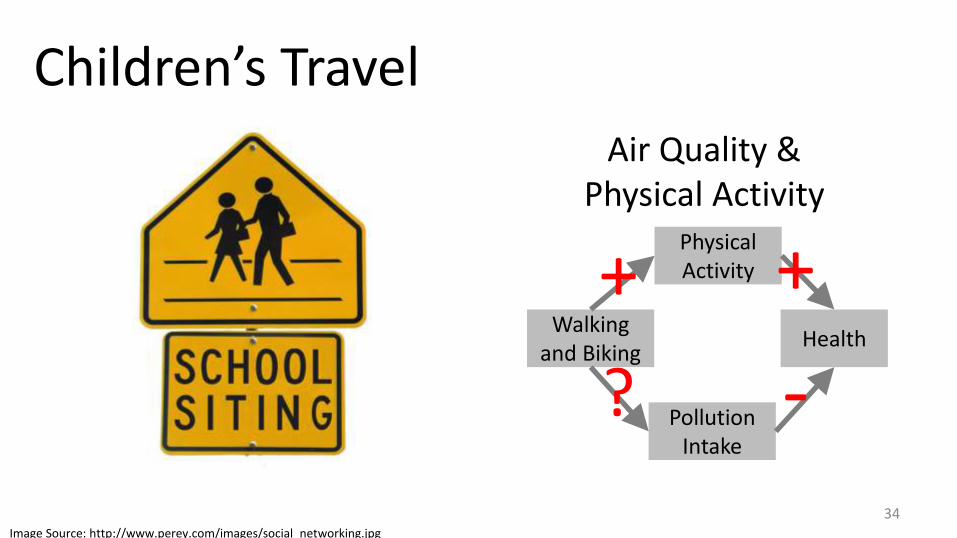
Children’s Travel
34Image Source: http://www.perey.com/images/social_networking.jpg
Walking and Biking
Health
Physical Activity+ +
Pollution Intake
? -
Air Quality &Physical Activity


