28
Impacts of Trade Agreements on U.S. Dairy Trade C.W. “Bill” Herndon WTO Impacts on U.S. Farm Policy: S-1016 Conference 2 June, 2005
| Date post: | 20-Apr-2018 |
| Category: |
Documents |
| Upload: | truongkhanh |
| View: | 222 times |
| Download: | 1 times |

Impacts of Trade
Agreements on U.S.
Dairy Trade C.W. “Bill” Herndon
WTO Impacts on U.S. Farm Policy: S-1016 Conference
2 June, 2005

Sources of Information and
Trade Data Several publications provided insights of
world and U.S. dairy industries and trade
USDA/FAS publication titled: “Dairy: World Markets and Trade”
“World Trade in Dairy Products and the U.S. Role: An Illustrated Primer” by Ed Jesse
Charles Nicholson’s “Trade Liberalization and the U.S. Dairy Industry”
Trade data collected from: FAO’s FAOSTAT database & the USDA/FAS FATUS database

Brief Overview of Dairy Industry
and Trade
U.S. is world largest producer of cow’s milk & one of the largest consumers
India is largest … if including buffalo milk
Dairy/milk have been “very sensitive”
Especially in developed countries
Dairy trade has been prohibited or restricted
U.S. led efforts to liberalize dairy trade
First attempts were during the URA

Limited World Dairy Trade
In 2003, FAO reports that world dairy trade amounted to only 12% of output
World dairy production and trade is dominated by the EU-25
Leading exporters are not the largest dairy producers (except for EU-25)
But, world dairy trade is increasing
Only 8% of output was traded in 1990

Limited World Dairy Trade World Dairy Production and Trade in 2003
613.4
77.8
0
100
200
300
400
500
600
700
World Production World Dairy Trade
Millio
n M
etr
ic T
on
s
Source: FAOSTAT Database
World Dairy Trade is
only 12% of Production
Global Dairy Markets
Review world dairy production
Who are the major producers?
Review world dairy trade
Who are the major exporters and importers?
Review various trade agreements
How has dairy trade evolved?

Milk Production in Selected Major
Countries, 2004 in MMT
0
20
40
60
80
100
120
140
E
U-2
5 US
In
dia
NZ
A
ustra
lia
C
hina
R
ussia
C
anad
a
M
exico
B
razil
A
rgen
tina
Mil
lio
n M
etr
ic T
on
s
Source: USDA/FAS & FAO Database: FAOSTAT
Total World Milk Production = 613.4 MMT

Who are the Major Exporters?
The EU-25 dominates & is the world’s
largest dairy exporter
However, the smaller milk producing
nations of New Zealand and Australia
are major exporters
Other nations play only “minor” roles

Who are the Major Exporters? World's Largest Dairy Exporting Countries,
2003 in MMT
49.9
11.44.5 2.8 0.8 1.0
0
10
20
30
40
50
60
E
U-2
5 NZ
A
ustra
lia US
C
anada
A
rgen
tina
Mil
lio
n M
etri
c T
on
s
Total World Dairy Trade = 77.8 MMT
Source: USDA/FAS & FAO Database: FAOSTAT

Who are the Major Importers?
Once again, the EU-25 dominates & is the world’s largest dairy importer
However, most of these imports are “intra-EU-25” trade
10-12 nations import about the same amounts of dairy products
Ranging from ~ 1 to 3 MMT, annually
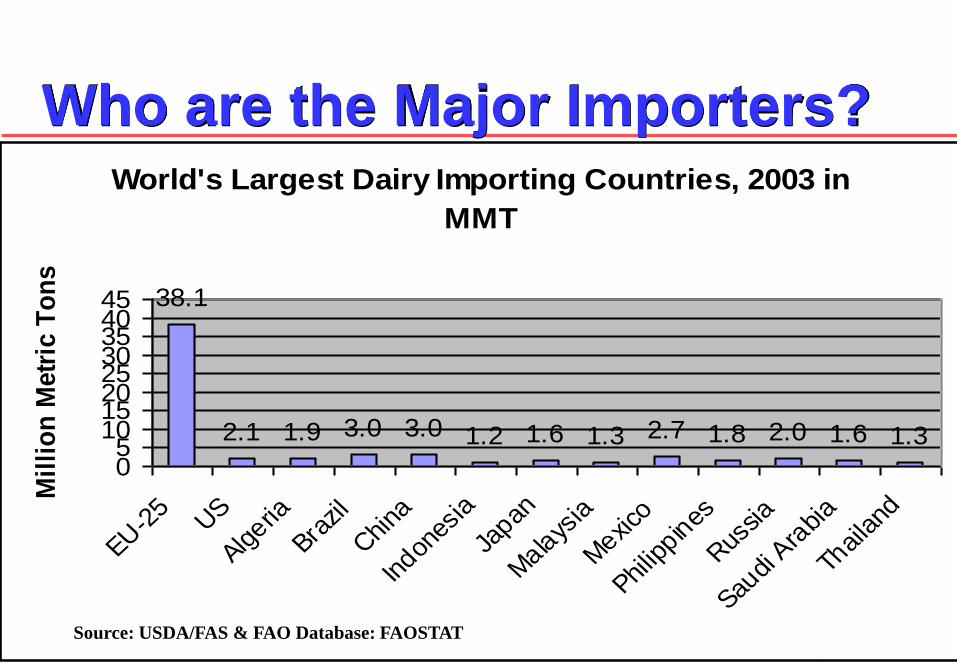
Who are the Major Importers? World's Largest Dairy Importing Countries, 2003 in
MMT
38.1
2.1 1.9 3.0 3.0 1.2 1.6 1.3 2.7 1.8 2.0 1.6 1.3
05
1015202530354045
E
U-2
5US
A
lgeria
B
razil
C
hina
In
dones
ia
J
apan
M
alays
ia
M
exico
P
hilip
pines
R
ussia
S
audi
Ara
bia
T
haila
nd
Mil
lio
n M
etr
ic T
on
s
Source: USDA/FAS & FAO Database: FAOSTAT

Who Buys U.S. Dairy Products?
Mexico and Canada are the leading
importers of U.S. dairy products
NAFTA has increased trade flows 6-fold
From about $100M in 1990 to $661 in 2004
Total Value of U.S. dairy exports was
$1.5B in 2004 vs. $353M in 1990
But, exports were only 5.5% of U.S. output

Who Buys U.S. Dairy Products? U.S. Dairy Exports to Selected
Countries, 2004
386.7
274.1
100.9 68.8 68.5 56.0
548.2
0100200300400500600
Mex
ico
Canad
a
Jap
an
Phi
lippin
es
C. A
meric
a
EU-2
5
Oth
ers
Mill
ion
s o
f $
US
D
Source: USDA/FAS FATUS Database
Total U.S. Export Value = $1,503 M

What Types of Dairy Products does
the U.S. Export?
Types of Dairy Products Exported by U.S., 2004 in Million of $USD
484.7
197.8161.7
32.8 13.5
612.6
0
100
200
300
400
500
600
700
Nonfat Dry
Milk
Cheese Whey Evap Milk Butter Other
Valu
e o
f E
xp
ort
s
Source: USDA/FAS FATUS Database
Total U.S. Export Value = $1,503 M
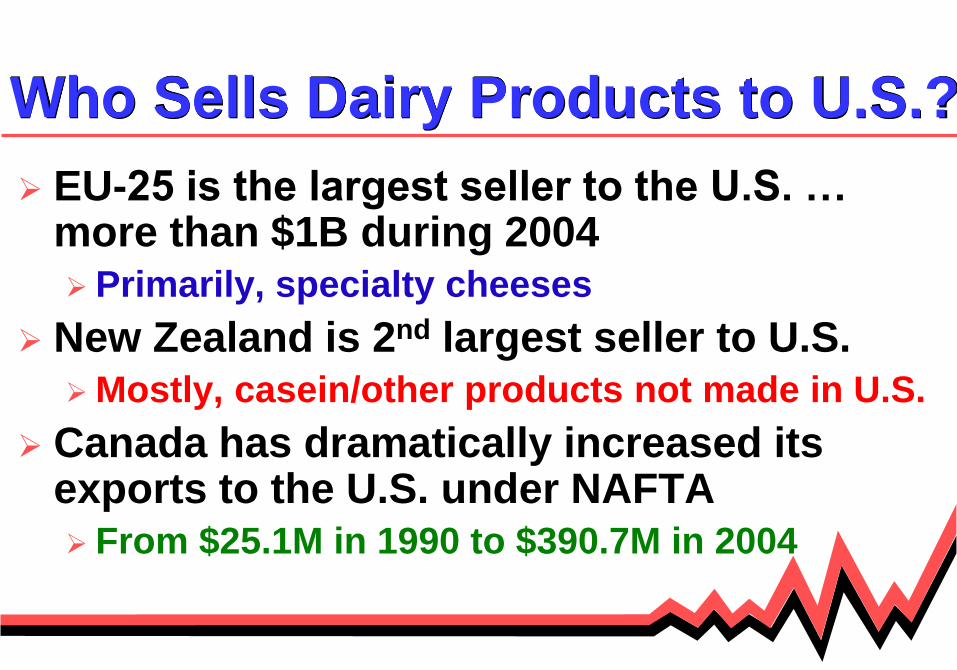
Who Sells Dairy Products to U.S.?
EU-25 is the largest seller to the U.S. … more than $1B during 2004
Primarily, specialty cheeses
New Zealand is 2nd largest seller to U.S.
Mostly, casein/other products not made in U.S.
Canada has dramatically increased its exports to the U.S. under NAFTA
From $25.1M in 1990 to $390.7M in 2004

Who Sells Dairy Products to U.S.?
Major Sources of U.S. Dairy Imports, 2004 in Millions
of $USD
1,076.10
453.7390.7
96.3
406.9
0
200
400
600
800
1,000
1,200
EU-25 NZ Canada Australia Others
Vla
ue o
f Im
po
rts
Total U.S. Import Value = $2,423.7 M
Source: USDA/FAS FATUS Database

What Types of Dairy Products does
the U.S. Import?
Types of Dairy Products Imported by U.S., 2004 in
Millions of $USD
982.3
541.4
90.9 49.7
759.4
0
200
400
600
800
1000
1200
Cheese Casien Butter Dried Cream Other
Valu
e o
f Im
po
rts
Source: USDA/FAS FATUS Database
Total U.S. Import Value = $2,423.7 M

Impacts on U.S. Dairy Industry of
Selected Trade Agreements
Briefly review 4 trade accords & impacts
on the U.S. dairy industry and trade flows
North American Free Trade Agreement, or
NAFTA
Uruguay Round Agreement, or URA
Australia-U.S. Trade Agreement, or AUSTA
Central America Free Trade Agreement, or
CAFTA-DR or DR-CAFTA
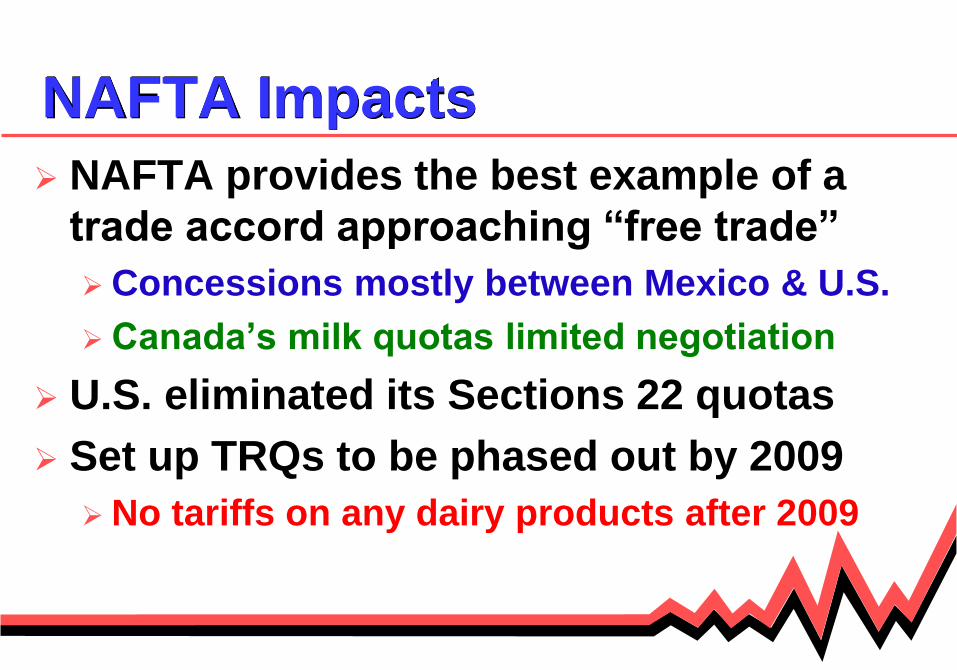
NAFTA Impacts
NAFTA provides the best example of a
trade accord approaching “free trade”
Concessions mostly between Mexico & U.S.
Canada’s milk quotas limited negotiation
U.S. eliminated its Sections 22 quotas
Set up TRQs to be phased out by 2009
No tariffs on any dairy products after 2009
NAFTA Impacts Most of U.S. dairy industry concerns were
directed to how NAFTA would disrupt to Federal Milk Order system
Study by Bishop, et al. found that 18% less milk would be shipped to U.S. plants to avoid paying U.S. FO prices
Trade data shows that volume increased dramatically between NAFTA nations Almost 45% of U.S. dairy exports
About 16% of U.S. dairy imports

URA Impacts
Recall URA attempted to liberalized trade via 3 mechanisms:
1. Minimum access
2. Reductions in domestic support
3. Reductions in export subsidies
All 3 of these tools were & continue to be used to “influence” dairy trade
Most often by the EU and US

URA Impacts
Several studies have reviewed URA impacts on U.S. dairy industry & trade
USDA study in 2002 found that limitations on export subsidies would increase milk powder trade & could increase U.S. prices
Several other studies generally agreed that URA trade policies have had “little or no impact” on U.S. dairy prices and farm incomes

AUSTA Impacts AUSTA was implemented on Jan. 1, 2005
One of the most controversial issues was dairy product trade/tariffs (also sugar)
U.S. dairy farmer organizations claimed AUSTA would lead to the demise of U.S. industry
AUSTA dairy trade provisions are: 18-year phase-in period where U.S. TRQs
would increase by 0.17% annually
Australian tariffs eliminated immediately

AUSTA Impacts Several empirical studies agree that
AUSTA would NOT be positive for the U.S. dairy industry
Australian study found that U.S. farm milk price would fall $0.02/cwt & U.S. milk production would fall 0.2% (300M lbs)
Cornell University study indicates that U.S. milk prices will decline $0.19/cwt and U.S. output falling by 0.5% (800M lbs) Cornell study admits to an overestimation

CAFTA-DR Impacts
CAFTA-DR currently being considered by Congress Democrats calling for vote this week
20-year phase-in period for increasing TRQs for U.S. dairy product exports to CA & DR
CAFTA-DR nations already have tariff-free access to U.S. dairy markets
Current dairy product tariffs range from 15% to 80% in these CAFTA-DR nations

CAFTA-DR Impacts
AFBF claims that CAFTA-DR will
increase U.S. dairy exports from $80M
to $300M at end of 20-year phase-in
Positive influence on U.S. dairy prices
and dairy farm incomes
Bottom line, CAFTA-DR is expected to
be beneficial to the U.S. dairy industry

Summary & Conclusions
Dairy/Milk has & will likely continue to be a major impediment to liberalizing agricultural trade
Empirical analyses of various trade liberalization tend to agree that:
U.S. dairy will not suffer major disruptions & realize only small decreases in milk prices
But, the U.S. dairy industry will not likely benefit either

Summary & Conclusions
This single finding may lead the U.S. dairy industry to lack enthusiasm in pursuing any future, additional trade concessions (via WTO, FTAA, or ???)
Consensus among trade analysts is that future trade agreements will include dairy
So, U.S. dairy farmers and processors should prepare its views, wishes to the USTR and Congress


