Impacts on water quality by sediments and nutrients released during extreme bushfires: Report 3: Post-fire sediment and nutrient redistribution to downstream waterbodies, Nattai National Park, NSW Scott Wilkinson, Peter Wallbrink, William Blake, Stefan Doerr and Rick Shakesby Report for the Sydney Catchment Authority CSIRO Land and Water Science Report 64/06 September 2006
Transcript
Impacts on water quality by sediments and nutrients released during extreme bushfires: Report 3: Post-fire sediment and nutrient redistribution to downstream waterbodies, Nattai National Park, NSW Scott Wilkinson, Peter Wallbrink, William Blake, Stefan Doerr and Rick Shakesby Report for the Sydney Catchment Authority
CSIRO Land and Water Science Report 64/06 September 2006
Important Disclaimer: CSIRO advises that the information contained in this publication comprises general statements based on scientific research. The reader is advised and needs to be aware that such information may be incomplete or unable to be used in any specific situation. No reliance or actions must therefore be made on that information without seeking prior expert professional, scientific and technical advice. To the extent permitted by law, CSIRO (including its employees and consultants) excludes all liability to any person for any consequences, including but not limited to all losses, damages, costs, expenses and any other compensation, arising directly or indirectly from using this publication (in part or in whole) and any information or material contained in it.
Cover Photograph: Description: Nattai River with post-fire sediment deposit, upstream from the bridge, May 2002.
Impacts on water quality by sediments and nutrients released during extreme bushfires: Report 3: Post-fire sediment and nutrient redistribution to downstream waterbodies, Nattai National Park, NSW
Scott Wilkinson1, Peter Wallbrink1, William Blake2, Stefan Doerr3, and Rick Shakesby2
1 CSIRO Land & Water 2 University of Plymouth, UK 3 University of Wales, Swansea, UK
CSIRO Land and Water Science Report 64/06 September 2006
Page i
Acknowledgements This research was part-funded by the Sydney Catchment Authority (SCA) and the UK Natural Environment Research Council (Grant Code: NER/A/S/2002/0043). Danny Hunt (CSIRO) and Martin Gilmour (SCA) helped collect and prepare the field samples. Chris Leslie (CSIRO) undertook the radionuclide analysis at CSIRO Land and Water in Canberra, and Florian Winter (CSIRO) assisted with laboratory and data analysis. Pauline English (CSIRO) assisted with preparation of Figures 3 and 7. Gary Caitcheon and Bala Vigneswaran (SCA) provided constructive comments on this report. Peter Hairsine (CSIRO) reviewed this report. We thank Kerry Tomkins (Macquarie University) for useful discussions regarding rainfall data.
Page ii
Executive Summary In December 2001 bushfires swept through the Nattai National Park bordering Sydney’s principal water supply reservoir, Lake Burragorang, burning over half of the Nattai River catchment and all of the Little River catchment. Subsequent rainfall resulted in accelerated delivery of sediment and nutrients. This report describes the sediment and nutrient movement through the river network draining the burnt area after the fire. The aim of the report is to provide information that assists future management of fire impacts on the reservoir.
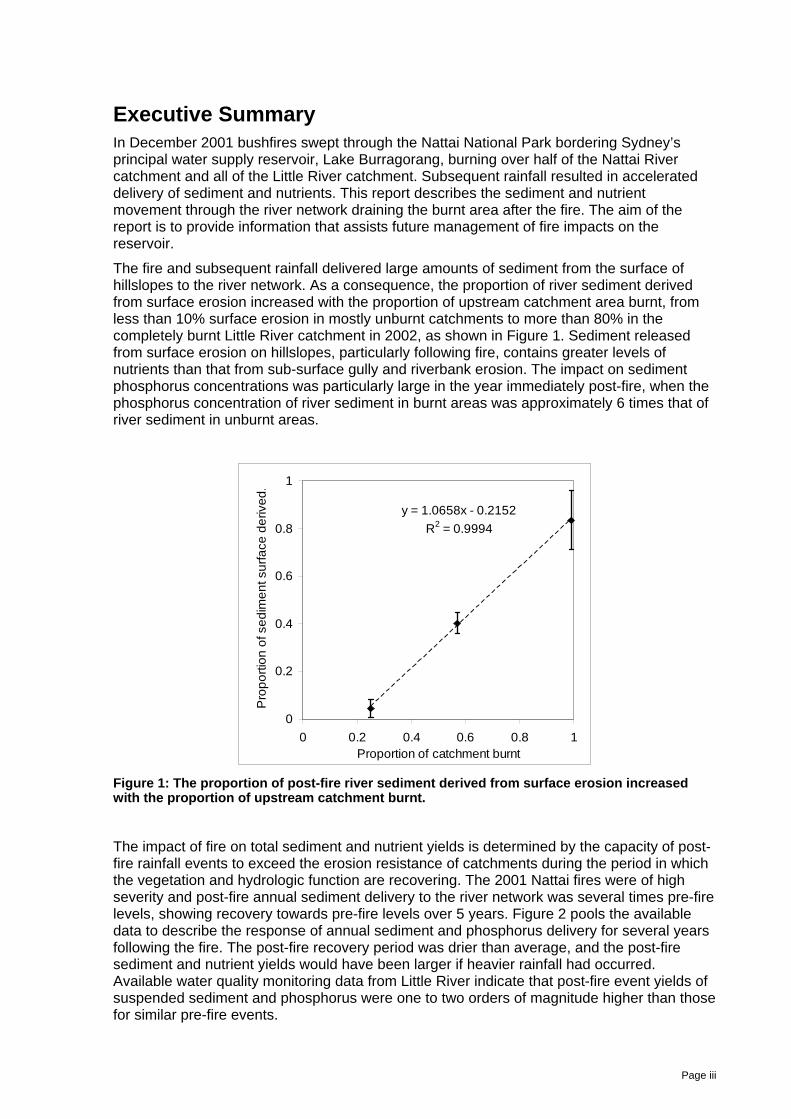
The fire and subsequent rainfall delivered large amounts of sediment from the surface of hillslopes to the river network. As a consequence, the proportion of river sediment derived from surface erosion increased with the proportion of upstream catchment area burnt, from less than 10% surface erosion in mostly unburnt catchments to more than 80% in the completely burnt Little River catchment in 2002, as shown in Figure 1. Sediment released from surface erosion on hillslopes, particularly following fire, contains greater levels of nutrients than that from sub-surface gully and riverbank erosion. The impact on sediment phosphorus concentrations was particularly large in the year immediately post-fire, when the phosphorus concentration of river sediment in burnt areas was approximately 6 times that of river sediment in unburnt areas.
y = 1.0658x - 0.2152R2 = 0.9994
0
0.2
0.4
0.6
0.8
1
0 0.2 0.4 0.6 0.8 1Proportion of catchment burnt
Pro
porti
on o
f sed
imen
t sur
face
der
ived
.
Figure 1: The proportion of post-fire river sediment derived from surface erosion increased with the proportion of upstream catchment burnt.
The impact of fire on total sediment and nutrient yields is determined by the capacity of post-fire rainfall events to exceed the erosion resistance of catchments during the period in which the vegetation and hydrologic function are recovering. The 2001 Nattai fires were of high severity and post-fire annual sediment delivery to the river network was several times pre-fire levels, showing recovery towards pre-fire levels over 5 years. Figure 2 pools the available data to describe the response of annual sediment and phosphorus delivery for several years following the fire. The post-fire recovery period was drier than average, and the post-fire sediment and nutrient yields would have been larger if heavier rainfall had occurred. Available water quality monitoring data from Little River indicate that post-fire event yields of suspended sediment and phosphorus were one to two orders of magnitude higher than those for similar pre-fire events.
Page iii
0
2
4
6
8
-1 0 1 2 3 4 5 6Years since fire
Mul
tiple
of u
nbur
nt y
ield
Total suspended sediment yieldTotal PhosphorusDissolved Phosphorus
Figure 2: The response and recovery of annual river sediment and phosphorus yields following the 2001 fire, relative to the yields if the fire had not occurred. This plot pools radionuclide activity of river sediment 2002–2006 (Total suspended sediment yield); sediment P concentrations 2002–2006 (Total Phosphorus) and water quality concentrations 2002–2003 (Dissolved Phosphorus).
A following report will investigate the long-term impacts of fire on sediment yield to Lake Burragorang.
Page iv
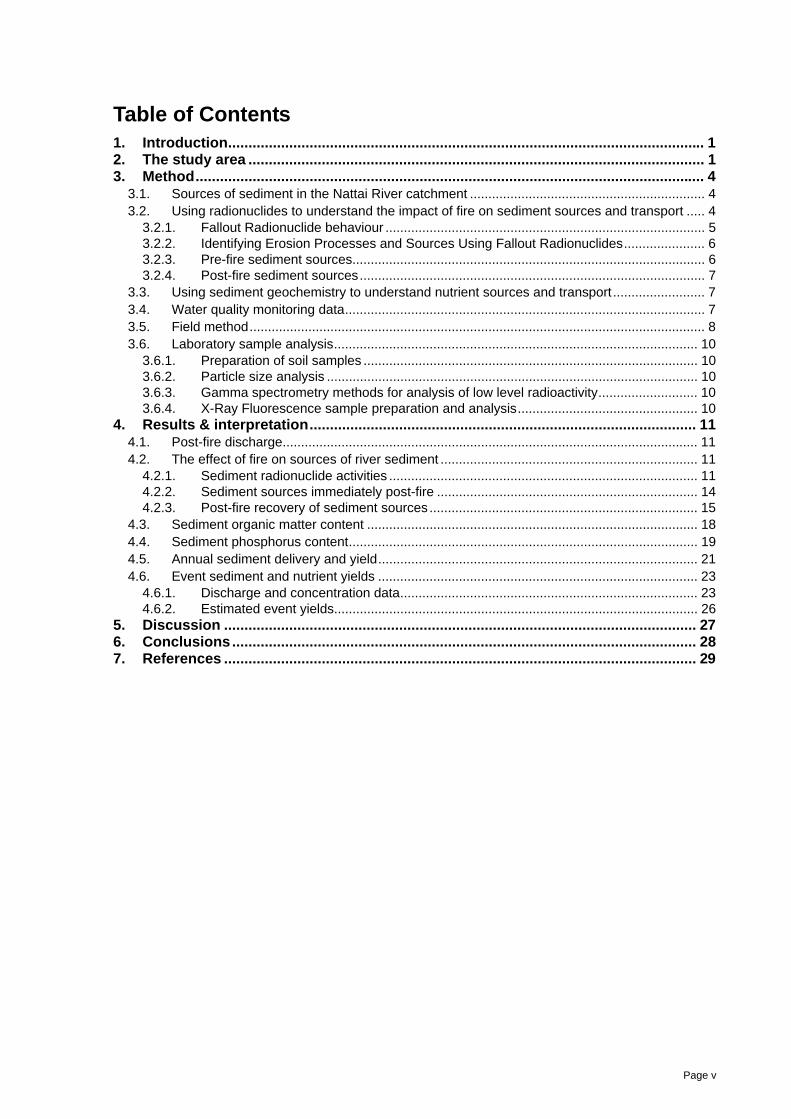
Table of Contents 1. Introduction..................................................................................................................... 1 2. The study area ................................................................................................................ 1 3. Method............................................................................................................................. 4
3.1. Sources of sediment in the Nattai River catchment ................................................................ 4 3.2. Using radionuclides to understand the impact of fire on sediment sources and transport ..... 4
3.3. Using sediment geochemistry to understand nutrient sources and transport ......................... 7 3.4. Water quality monitoring data.................................................................................................. 7 3.5. Field method............................................................................................................................ 8 3.6. Laboratory sample analysis................................................................................................... 10
3.6.1. Preparation of soil samples ........................................................................................... 10 3.6.2. Particle size analysis ..................................................................................................... 10 3.6.3. Gamma spectrometry methods for analysis of low level radioactivity........................... 10 3.6.4. X-Ray Fluorescence sample preparation and analysis................................................. 10
4. Results & interpretation............................................................................................... 11 4.1. Post-fire discharge................................................................................................................. 11 4.2. The effect of fire on sources of river sediment ...................................................................... 11
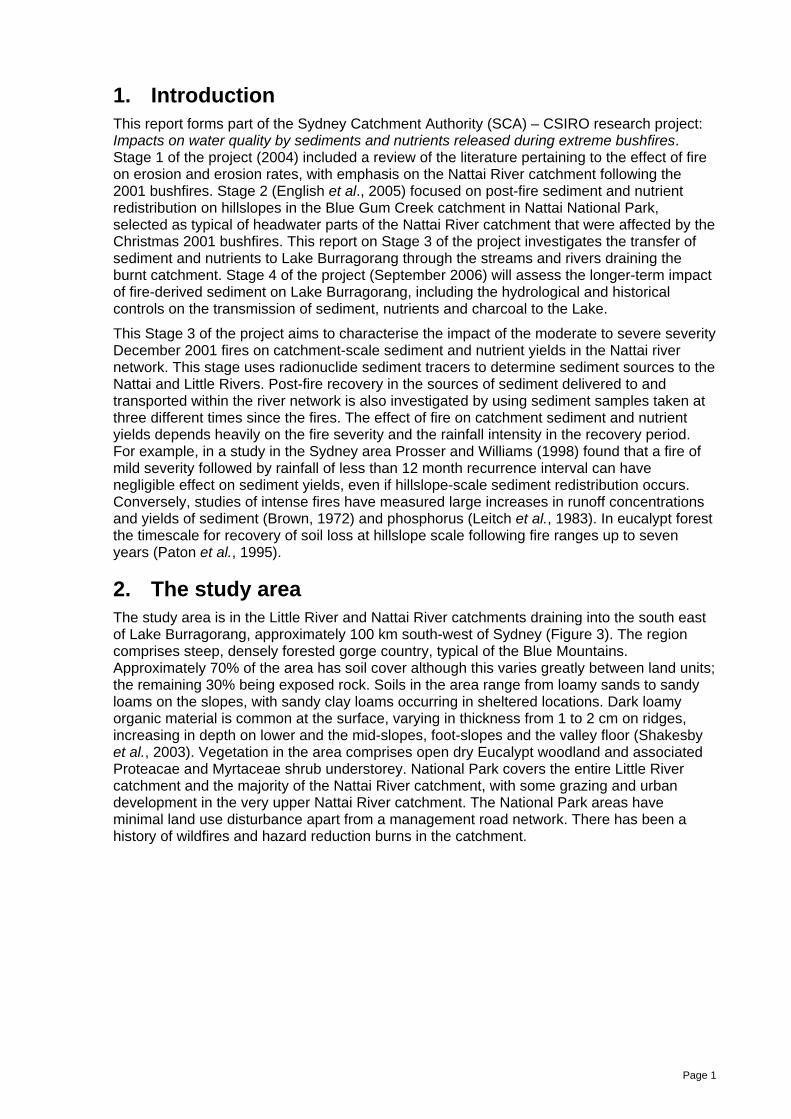
1. Introduction This report forms part of the Sydney Catchment Authority (SCA) – CSIRO research project: Impacts on water quality by sediments and nutrients released during extreme bushfires. Stage 1 of the project (2004) included a review of the literature pertaining to the effect of fire on erosion and erosion rates, with emphasis on the Nattai River catchment following the 2001 bushfires. Stage 2 (English et al., 2005) focused on post-fire sediment and nutrient redistribution on hillslopes in the Blue Gum Creek catchment in Nattai National Park, selected as typical of headwater parts of the Nattai River catchment that were affected by the Christmas 2001 bushfires. This report on Stage 3 of the project investigates the transfer of sediment and nutrients to Lake Burragorang through the streams and rivers draining the burnt catchment. Stage 4 of the project (September 2006) will assess the longer-term impact of fire-derived sediment on Lake Burragorang, including the hydrological and historical controls on the transmission of sediment, nutrients and charcoal to the Lake.
This Stage 3 of the project aims to characterise the impact of the moderate to severe severity December 2001 fires on catchment-scale sediment and nutrient yields in the Nattai river network. This stage uses radionuclide sediment tracers to determine sediment sources to the Nattai and Little Rivers. Post-fire recovery in the sources of sediment delivered to and transported within the river network is also investigated by using sediment samples taken at three different times since the fires. The effect of fire on catchment sediment and nutrient yields depends heavily on the fire severity and the rainfall intensity in the recovery period. For example, in a study in the Sydney area Prosser and Williams (1998) found that a fire of mild severity followed by rainfall of less than 12 month recurrence interval can have negligible effect on sediment yields, even if hillslope-scale sediment redistribution occurs. Conversely, studies of intense fires have measured large increases in runoff concentrations and yields of sediment (Brown, 1972) and phosphorus (Leitch et al., 1983). In eucalypt forest the timescale for recovery of soil loss at hillslope scale following fire ranges up to seven years (Paton et al., 1995).
2. The study area The study area is in the Little River and Nattai River catchments draining into the south east of Lake Burragorang, approximately 100 km south-west of Sydney (Figure 3). The region comprises steep, densely forested gorge country, typical of the Blue Mountains. Approximately 70% of the area has soil cover although this varies greatly between land units; the remaining 30% being exposed rock. Soils in the area range from loamy sands to sandy loams on the slopes, with sandy clay loams occurring in sheltered locations. Dark loamy organic material is common at the surface, varying in thickness from 1 to 2 cm on ridges, increasing in depth on lower and the mid-slopes, foot-slopes and the valley floor (Shakesby et al., 2003). Vegetation in the area comprises open dry Eucalypt woodland and associated Proteacae and Myrtaceae shrub understorey. National Park covers the entire Little River catchment and the majority of the Nattai River catchment, with some grazing and urban development in the very upper Nattai River catchment. The National Park areas have minimal land use disturbance apart from a management road network. There has been a history of wildfires and hazard reduction burns in the catchment.
Page 1
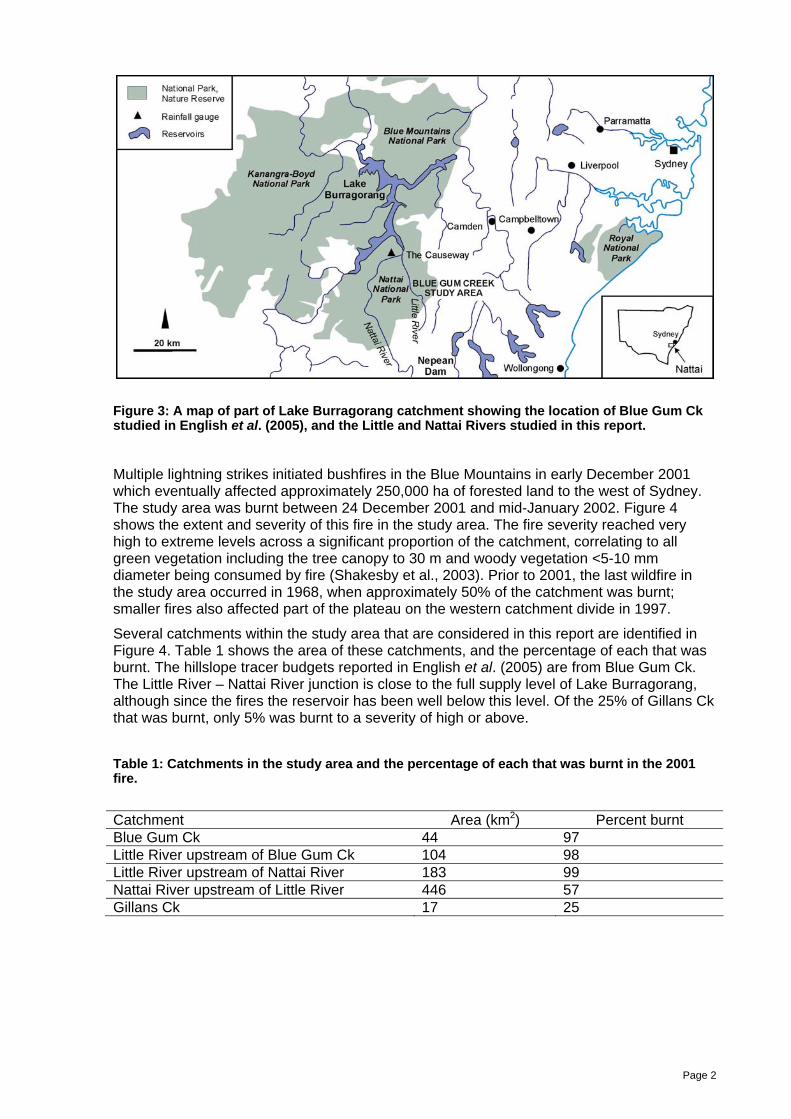
Figure 3: A map of part of Lake Burragorang catchment showing the location of Blue Gum Ck studied in English et al. (2005), and the Little and Nattai Rivers studied in this report.
Multiple lightning strikes initiated bushfires in the Blue Mountains in early December 2001 which eventually affected approximately 250,000 ha of forested land to the west of Sydney. The study area was burnt between 24 December 2001 and mid-January 2002. Figure 4 shows the extent and severity of this fire in the study area. The fire severity reached very high to extreme levels across a significant proportion of the catchment, correlating to all green vegetation including the tree canopy to 30 m and woody vegetation <5-10 mm diameter being consumed by fire (Shakesby et al., 2003). Prior to 2001, the last wildfire in the study area occurred in 1968, when approximately 50% of the catchment was burnt; smaller fires also affected part of the plateau on the western catchment divide in 1997.
Several catchments within the study area that are considered in this report are identified in Figure 4. Table 1 shows the area of these catchments, and the percentage of each that was burnt. The hillslope tracer budgets reported in English et al. (2005) are from Blue Gum Ck. The Little River – Nattai River junction is close to the full supply level of Lake Burragorang, although since the fires the reservoir has been well below this level. Of the 25% of Gillans Ck that was burnt, only 5% was burnt to a severity of high or above. Table 1: Catchments in the study area and the percentage of each that was burnt in the 2001 fire.
Catchment Area (km2) Percent burnt Blue Gum Ck 44 97 Little River upstream of Blue Gum Ck 104 98 Little River upstream of Nattai River 183 99 Nattai River upstream of Little River 446 57 Gillans Ck 17 25
Page 2
Fire severity and intensity ratingExtreme
Very high
High
Moderate
Low
Negligible
Rivers & Creeks
Reservoir
0 6 123Kilometers
Gillan
s Ck
Nattai R.
Little R.
BlueGum Ck
Figure 4: Fire extent in the Nattai catchment, with fire severity illustrated using the data of (Shakesby et al., 2003; Chafer et al., 2004). Catchment outlines are shown as dashed lines for the Nattai River upstream of Little River, the Little River upstream of Blue Gum Creek and Blue Gum Ck. Gillans Ck is also labelled as a catchment which had only low to moderate fire severity.
Page 3
3. Method
3.1. Sources of sediment in the Nattai River catchment This study investigates the impact of the fire on the sources of sediment originating in the Nattai River catchment, in particular the fine <10 µm fraction of sediment to which the majority of nutrients are attached. Sediment tracers are used to characterise a series of samples from catchment hillslope and gully sources and to investigate the relative proportions of those sources making up river sediments.
The primary sources of sediment in the Nattai River system are shown in Figure 5. Given that the catchment has complete forest cover and is largely national park, other sediment sources including roads are assumed to be minor although the significance of this assumption is discussed later. The timing of delivery of sediment to the river network is determined by rainfall and runoff. Consequently, discharge data are analysed to identify any large events that may dominate sediment delivery post-fire.
River sediments
Hillslope erosion (surface material)
Gully erosion (sub-surface material)
Riverbank erosion (sub-surface material)
Re-entrainment of riverbed deposits
Reservoir and delta deposition
Overbank deposition
Figure 5: Conceptual model of the primary sources and sinks of river sediments in the Nattai River system.
3.2. Using radionuclides to understand the impact of fire on sediment sources and transport
Knowing the relative importance of erosion processes that generate sediments is essential to effective treatment of problems associated with sediment delivery. Erosion processes may include sheet erosion from hillslopes, rill erosion from cultivated fields, sidewall and bottom erosion from gullies, and stream bank erosion from creek and river channels. Generally a combination of these processes is involved in generating sediment delivered from catchments. Knowing the soil depth from which suspended sediments originate can reveal whether sediment is derived from erosion of surface material from hillslopes or sub-surface material from channel banks or other sources. It is also generally accepted that heavy metals, pesticides, and nutrients are primarily transported adsorbed to sediments, and the concentration of these substances is usually greatest in surface soil.
Page 4
The objective is to determine the relative contributions from the different erosion processes, and thus make an assessment of their impact or importance relative to one another. Unfortunately, most catchments are too large to use direct observation or monitoring networks to determine erosion sources. Fallout radionuclide tracers can be employed to solve this problem.
3.2.1. Fallout Radionuclide behaviour Fallout radionuclides are used in sediment tracing by analysing differences in radionuclide activity and ratios between Caesium-137 (137Cs), which is anthropogenic, and naturally-occurring excess fallout Lead-210 (210Pbex) and Berryllium-7 (7Be). Radionuclide activity concentrations are measured by gamma spectrometry.
Caesium-137 (half life, 30 years) is a product of atmospheric nuclear weapons testing that occurred during the 1950-70s. Initially the distribution of this nuclide in the soil decreased exponentially with depth, with the maximum concentration at the surface. However, due to processes of diffusion the maximum concentration is now generally found below the surface in undisturbed soils (Peart and Walling, 1986; Wallbrink and Murray, 1993). The bulk of the activity of this nuclide is retained within the top 100 mm of the soil profile in Australian soils (Figure 6).
Fallout 210Pb (half life ~20 years) is formed through the decay of 222Rn gas via a series of short lived daughters. The parent of 222Rn is the lithogenic nuclide 226Ra, part of the 238U decay series. In most soils it is expected that 210Pb will be in approximately secular equilibrium with 226Ra. However, some 222Rn diffuses into the atmosphere where it decays to 210Pb, which then reaches the earth’s surface by wet and dry precipitation (Wise, 1980). In this way maximum concentrations of fallout 210Pb (also known as ‘unsupported’ or ‘excess’, i.e. 210Pbex) are generally found at the soil surface. Concentrations then decrease to detection limits at about 100 mm depth (Figure 6).
Beryllium-7 is a cosmogenic radionuclide (half-life, 53 days) produced by spallation of oxygen and nitrogen atoms within the troposphere and stratosphere. Its continuous fallout makes it a useful tracer of sediment movement from the uppermost layers of soils (Wallbrink and Murray, 1993; Wallbrink and Murray, 1996). Following production it is transported to the soil surface by wet and dry deposition. Penetration can also be approximated by an exponential in bare soil and forest soils. Average penetration half-depths (Ph) in these soils are calculated to be 0.7 and 3.4 mm respectively. The nuclide is not found below 20 mm depth in any soil (Wallbrink and Murray, 1996; Wallbrink et al., 1999).
50
Dep
th (m
m)
150
0 0 0
250
7Be
210Pbex
137Cs
101001000 0 0
Concentration (Bq kg )-1
Figure 6: Depth profiles of radionuclide activity (from Wallbrink et al., 1999). The solid line represents absolute concentrations, and the dotted line is the integral of absolute concentrations with depth. Note the different depth scales, showing that 137Cs penetrates much deeper into the soil profile.
With all these nuclides, concentration increases as particle size decreases, due to the higher surface area to volume ratio of smaller particles. For this reason, sediment is sieved before analysis and activities are only compared between samples of the same particle size fraction.
Page 5
In this study, only activities of the <10 µm fraction of sediment samples are reported and this size fraction is sufficiently narrow that effects of variations in particle size between samples are negligible (see Section 3.6.2).
3.2.2. Identifying Erosion Processes and Sources Using Fallout Radionuclides The different penetration depths of the fallout radionuclides discussed above can be used to determine the original depth location of sediment particles, and thus infer the erosion process responsible for producing it. For example, high values of 137Cs and 210Pbex in transported sediments should indicate material derived from sheet or minor rill erosion, whereas high levels of 137Cs and lower values of 210Pbex should indicate that the material is from a more actively rilled environment, i.e. that soil particles are being derived from slightly below (5-50 mm) the original soil surface. Very low or undetectable levels of 137Cs and 210Pbex suggest a subsoil source that has not been exposed to fallout of either nuclide, such as an eroding gully wall. Finally, high values of 210Pbex and low values of 137Cs suggest that the sediment is derived from a surface where the previous inventory of 137Cs was either undetectably small or has been completely lost, yet there has been sufficient recent exposure to obtain a 210Pbex label (Wallbrink and Murray, 1993).
3.2.3. Pre-fire sediment sources The pre-fire radionuclide concentrations of river sediment are required to quantify the impact of the fires relative to the pre-fire state. Pre-fire sediment samples from the river network were not available, so two methods were used; (i) by investigating the variation in radionuclide activity with fire severity upstream of sampling locations (see Results), and (ii) by reference to other studies of radionuclide activities in river sediments from unburnt catchments:
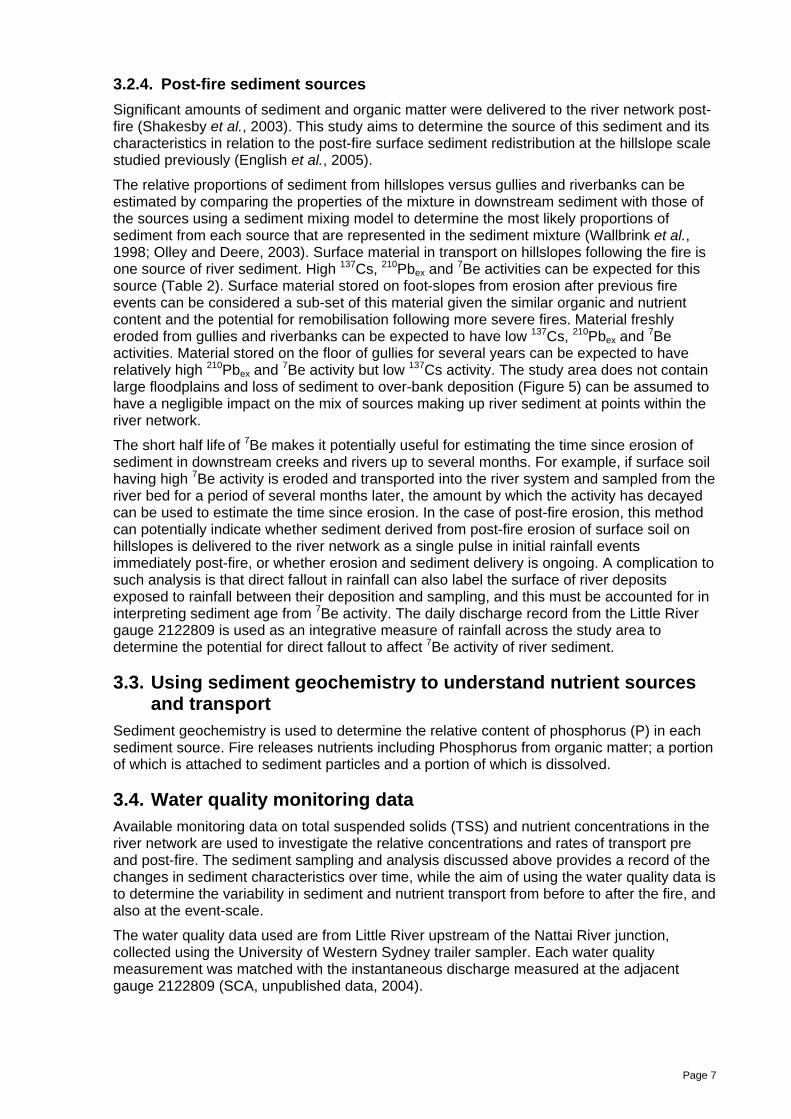
Several studies have shown that sediment in rivers draining unburnt catchments in southeast Australia have low 137Cs activity and hence are dominated by subsurface sources. By applying a simple two-part mixing model to the 137Cs activities of upstream surface and subsurface erosion sources, the proportions of each source in downstream river sediment can be determined. For example, comparing source activities in the Murrumbidgee River catchment with the activities of downstream river sediments (Table 2) indicates that 15% of sediment comes from surface erosion; with 210Pbex indicating a similar proportion. Other data from south-east Australia support sub-surface erosion as a dominant sediment source in forested areas. For example, a similar study in an unburnt forest environment in south-east Australia found the <63 µm fraction of stream sediment had 137Cs activity generally less than 1 Bq/kg (Wallbrink and Croke, 2002), confirming subsurface sources of river sediment in forest environments. Olley et al. (1996) also found that river sediments in an unburnt NSW forest were dominated by subsurface sources. In the Nattai River catchment, slope mass failures are not considered to be a common cause of direct sediment delivery to the river network and so the predominant sources of sub-surface material to river sediments can be identified as riverbank erosion of alluvial deposits along larger streams, riverbank erosion of colluvial deposits resulting from past hillslope mass movement (Tomkins et al., 2004) along smaller streams, and gully erosion on hillslopes (Shakesby et al., 2003).
Table 2: Mean activities of the <2 µm fraction of sediment sources in the Murrumbidgee River catchment (after Wallbrink et al., 1998). Subscripts denote standard errors on the means.
3.2.4. Post-fire sediment sources Significant amounts of sediment and organic matter were delivered to the river network post-fire (Shakesby et al., 2003). This study aims to determine the source of this sediment and its characteristics in relation to the post-fire surface sediment redistribution at the hillslope scale studied previously (English et al., 2005).
The relative proportions of sediment from hillslopes versus gullies and riverbanks can be estimated by comparing the properties of the mixture in downstream sediment with those of the sources using a sediment mixing model to determine the most likely proportions of sediment from each source that are represented in the sediment mixture (Wallbrink et al., 1998; Olley and Deere, 2003). Surface material in transport on hillslopes following the fire is one source of river sediment. High 137Cs, 210Pbex and 7Be activities can be expected for this source (Table 2). Surface material stored on foot-slopes from erosion after previous fire events can be considered a sub-set of this material given the similar organic and nutrient content and the potential for remobilisation following more severe fires. Material freshly eroded from gullies and riverbanks can be expected to have low 137Cs, 210Pbex and 7Be activities. Material stored on the floor of gullies for several years can be expected to have relatively high 210Pbex and 7Be activity but low 137Cs activity. The study area does not contain large floodplains and loss of sediment to over-bank deposition (Figure 5) can be assumed to have a negligible impact on the mix of sources making up river sediment at points within the river network.
The short half life of 7Be makes it potentially useful for estimating the time since erosion of sediment in downstream creeks and rivers up to several months. For example, if surface soil having high 7Be activity is eroded and transported into the river system and sampled from the river bed for a period of several months later, the amount by which the activity has decayed can be used to estimate the time since erosion. In the case of post-fire erosion, this method can potentially indicate whether sediment derived from post-fire erosion of surface soil on hillslopes is delivered to the river network as a single pulse in initial rainfall events immediately post-fire, or whether erosion and sediment delivery is ongoing. A complication to such analysis is that direct fallout in rainfall can also label the surface of river deposits exposed to rainfall between their deposition and sampling, and this must be accounted for in interpreting sediment age from 7Be activity. The daily discharge record from the Little River gauge 2122809 is used as an integrative measure of rainfall across the study area to determine the potential for direct fallout to affect 7Be activity of river sediment.
3.3. Using sediment geochemistry to understand nutrient sources and transport
Sediment geochemistry is used to determine the relative content of phosphorus (P) in each sediment source. Fire releases nutrients including Phosphorus from organic matter; a portion of which is attached to sediment particles and a portion of which is dissolved.
3.4. Water quality monitoring data Available monitoring data on total suspended solids (TSS) and nutrient concentrations in the river network are used to investigate the relative concentrations and rates of transport pre and post-fire. The sediment sampling and analysis discussed above provides a record of the changes in sediment characteristics over time, while the aim of using the water quality data is to determine the variability in sediment and nutrient transport from before to after the fire, and also at the event-scale.
The water quality data used are from Little River upstream of the Nattai River junction, collected using the University of Western Sydney trailer sampler. Each water quality measurement was matched with the instantaneous discharge measured at the adjacent gauge 2122809 (SCA, unpublished data, 2004).
Page 7
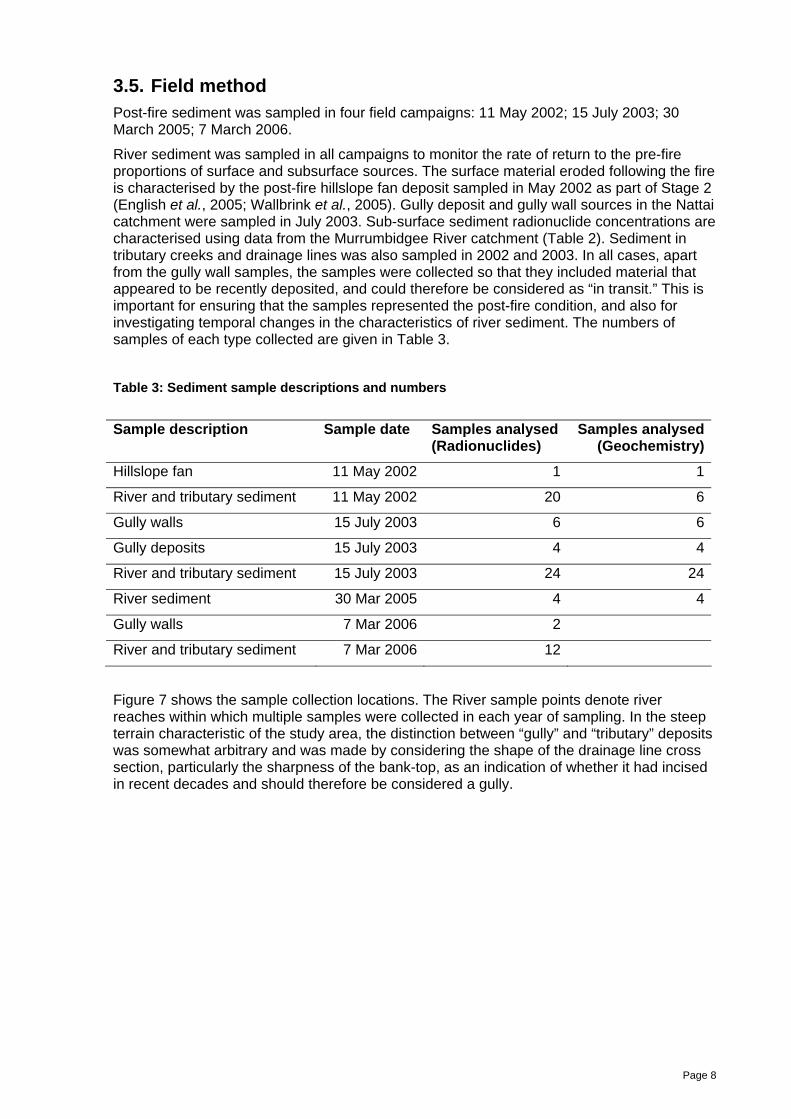
3.5. Field method Post-fire sediment was sampled in four field campaigns: 11 May 2002; 15 July 2003; 30 March 2005; 7 March 2006.
River sediment was sampled in all campaigns to monitor the rate of return to the pre-fire proportions of surface and subsurface sources. The surface material eroded following the fire is characterised by the post-fire hillslope fan deposit sampled in May 2002 as part of Stage 2 (English et al., 2005; Wallbrink et al., 2005). Gully deposit and gully wall sources in the Nattai catchment were sampled in July 2003. Sub-surface sediment radionuclide concentrations are characterised using data from the Murrumbidgee River catchment (Table 2). Sediment in tributary creeks and drainage lines was also sampled in 2002 and 2003. In all cases, apart from the gully wall samples, the samples were collected so that they included material that appeared to be recently deposited, and could therefore be considered as “in transit.” This is important for ensuring that the samples represented the post-fire condition, and also for investigating temporal changes in the characteristics of river sediment. The numbers of samples of each type collected are given in Table 3.
Table 3: Sediment sample descriptions and numbers
Sample description Sample date Samples analysed
(Radionuclides) Samples analysed
(Geochemistry)
Hillslope fan 11 May 2002 1 1
River and tributary sediment 11 May 2002 20 6
Gully walls 15 July 2003 6 6
Gully deposits 15 July 2003 4 4
River and tributary sediment 15 July 2003 24 24
River sediment 30 Mar 2005 4 4
Gully walls 7 Mar 2006 2
River and tributary sediment 7 Mar 2006 12
Figure 7 shows the sample collection locations. The River sample points denote river reaches within which multiple samples were collected in each year of sampling. In the steep terrain characteristic of the study area, the distinction between “gully” and “tributary” deposits was somewhat arbitrary and was made by considering the shape of the drainage line cross section, particularly the sharpness of the bank-top, as an indication of whether it had incised in recent decades and should therefore be considered a gully.
Page 8
150 30’o
34 10’o
34 07’30”o
34 10’o
34 15’o
SCALE0 1 2km
Nattai
ThirlmereLakes
Little
River
Blue
Buxton
Nattai
Gillians
Riv
er
Riv
er
River
Cre
ek
Little
Gum Creek
Plateau
Tributary samples with year sampled
LEGEND
Gully samples 2003
Road / track
Plateau
River samples with year sampled
02,06
02,03
02,06
02,03,05,06
03
02,03,06
06
02,03,05,06
02,03,05,06
02
02,03,06
02
02
02,03,06
02,03,06
02,03,05,06
02
02,03
02,03
02
02
03
03
Figure 7: Locations of sediment sampling. The general flow direction is from south to north. The River sample points denote river reaches within which multiple samples were collected in each year of sampling. The hillslope fan deposit (LG02047/1) and the hillslope tracer budget analysis was located upslope from the 3rdmost upstream tributary sample point on the south side of Blue Gum Ck.
Page 9
3.6. Laboratory sample analysis 3.6.1. Preparation of soil samples All soil samples were initially weighed, dried at 40°C for 48 hours, and weighed again to determine field moisture content and bulk density. Typically, 300 g was then extracted for further analysis and the remainder archived. The samples were then placed in an oven at 450°C for 48 hours to determine the Loss on Ignition (LOI).
3.6.2. Particle size analysis Samples for radionuclide and geochemical analyses were wet sieved to extract the <63 µm fraction. From this, settling in a water column was used to extract the <10 µm fraction. This fraction was then ground to a fine powder in a rock mill.
3.6.3. Gamma spectrometry methods for analysis of low level radioactivity The sample powder was cast in a polyester resin matrix in either a ‘cup’ geometry (~250 g), ‘puck’ (~180g), ‘disk’ (~30 g), or ‘stick’ (~10 g), depending on the sample size. The samples were then stored for 28 days (6 half lives of 222Rn) to ensure equilibrium with the 222Rn parent, 226Ra. This enables concentrations of 226Ra to be determined with a higher sensitivity from the 222Rn daughters (Murray et al., 1987).
The detectors used for measurements in this study are ‘n’-type closed ended co-axials. Detection limits are about ± 0.3 Bq kg-1 for 137Cs, ± 3.0 Bq kg-1 for 210Pbex and ±1.0 Bq kg-1 for 7Be. The detectors were calibrated for Uranium (238U) series radionuclides using the Canadian Centre for Mineral Energy Technology (CANMET) uranium ore BL-5, and a standardised 137Cs solution (Amersham International). Detectors were calibrated for 226Ra by using a standardised solution from ANSTO. Independent checks on the calibrations were undertaken by participating in International Atomic Energy Association (IAEA) intercomparisons.
3.6.4. X-Ray Fluorescence sample preparation and analysis X-ray Fluorescence (XRF) analysis of major elements in the geochemistry, including P205, took place after 1 g of each oven dried sample (105°C) was accurately weighed with 4 g of 12-22 lithium borate matrix (Norrish and Hutton, 1969; Norrish and Chappell, 1977). The sample plus flux mixtures were transferred into Pt/Au crucibles, heated to 1050°C for 12 minutes then poured into a 32 mm Pt/Au mould heated to a similar temperature. The melt was cooled quickly over a compressed air stream; the resulting glass disks were analysed on a Phillips PW 1480 wavelength dispersive XRF. Analyses were carried out at the CSIRO Land & Water Laboratories in Adelaide.
Major element analyses (weight %) were normalised to 100% to correct for variations in the organic fraction. Where a given oxide analysis was less than the Lower Limit of Detection (LLD), a value of half the LLD for that element was assigned. P2O5 (wt %) analyses were converted to elemental P (ppm) using the atomic weight conversion factor of 436.4.
Page 10
4. Results & interpretation
4.1. Post-fire discharge Figure 8 shows the daily discharge record from the Little River (gauge 2122809) for the study period. The sediment sampling dates are shown by arrows. 7Be activities were corrected to the event of greater than 100 ML/d prior to each sampling date, being 17/4/2002, 16/5/2003 and 22/3/2005, and these events are labelled by dots. The largest discharge in the sampling period was 1312 ML/d in May 2003; the return period of this event is 2.3 years.
0
200
400
600
800
1000
1200
1400
1/01/2
001
1/01/2
002
1/01/2
003
1/01/2
004
1/01/2
005
1/01/2
006
Mea
n da
ily d
isch
arge
ML/
d
Figure 8: Daily discharge (ML/d) for the Little River gauge 2122809, showing the timing of sediment sampling (arrows) and runoff events >100 ML/d prior to each sampling date (dots); (SCA, unpublished data, 2005).
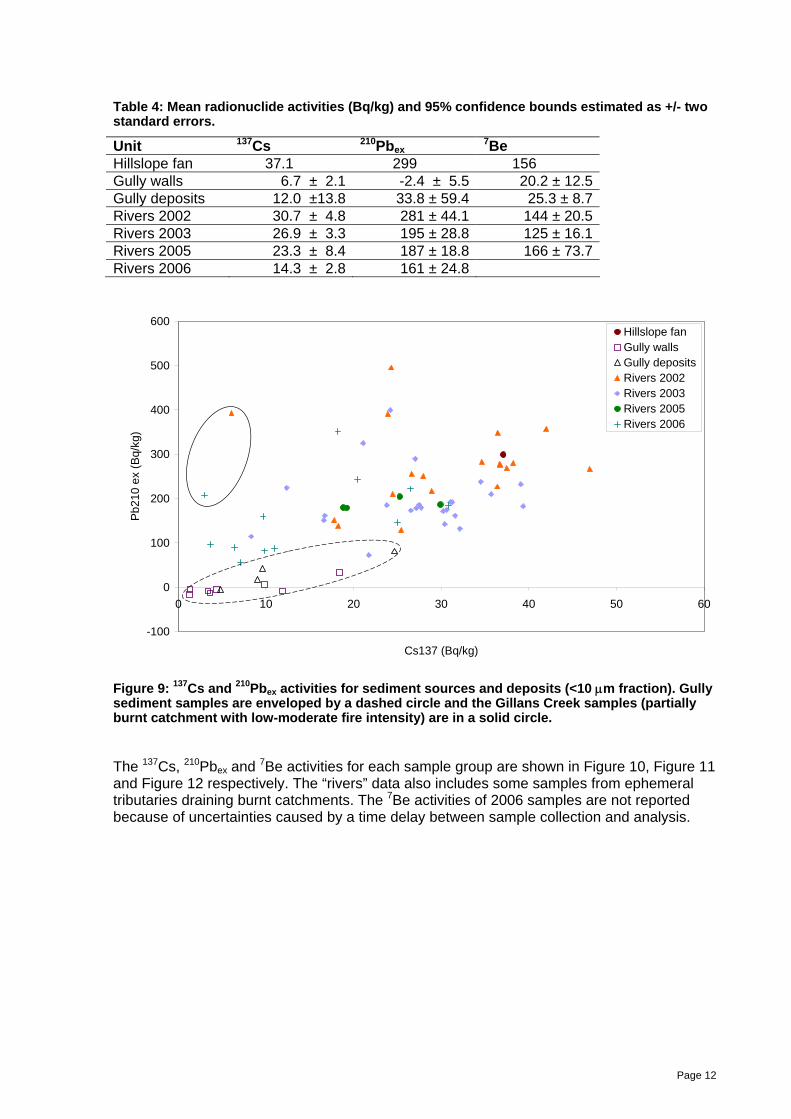
4.2. The effect of fire on sources of river sediment 4.2.1. Sediment radionuclide activities Table 4 shows the mean radionuclide activities for each sample group. The 137Cs and 210Pbex activities for sources and river deposits are plotted against each other in Figure 9. The activities of the two radionuclides generally increase with each other along an axis, indicating little variation in sediment age since erosion. Gillans Ck sediment is an exception as discussed below.
Page 11
Table 4: Mean radionuclide activities (Bq/kg) and 95% confidence bounds estimated as +/- two standard errors.
Figure 9: 137Cs and 210Pbex activities for sediment sources and deposits (<10 μm fraction). Gully sediment samples are enveloped by a dashed circle and the Gillans Creek samples (partially burnt catchment with low-moderate fire intensity) are in a solid circle.
The 137Cs, 210Pbex and 7Be activities for each sample group are shown in Figure 10, Figure 11 and Figure 12 respectively. The “rivers” data also includes some samples from ephemeral tributaries draining burnt catchments. The 7Be activities of 2006 samples are not reported because of uncertainties caused by a time delay between sample collection and analysis.
Page 12
0
10
20
30
40
Cs1
37 a
ctiv
ity (
Bq/
kg)
Hill
slop
e F
an
Gul
ly W
alls
Gul
ly D
epos
its
Riv
ers
2002
Riv
ers
2003
Riv
ers
2005
Riv
ers
2006
Figure 10: Box plot of 137Cs activities (<10 μm fraction) for the hillslope and gully sources, and deposited sediments. The boxes span the inter-quartile range and the whiskers span the full data range. The solid diamonds in the Rivers 2002 and 2006 data denote the partially burnt Gillans Ck
0
100
200
300
400
500
Pb2
10 e
xces
s ac
tivity
(B
q/kg
)
Hill
slop
e F
an
Gul
ly W
alls
Gul
ly D
epos
its
Riv
ers
2002
Riv
ers
2003
Riv
ers
2005
Riv
ers
2006
Figure 11: Boxplot of 210Pbex activities (<10 µm fraction) for the hillslope and gully sources, and deposited sediments. The symbols are as in Figure 10.
Page 13
50
100
150
200
Be7
act
ivity
(B
q/kg
)
Hillslop
e Fan
Gully W
alls
Gully D
epos
its
Rivers
200
2
Rivers
200
3
Rivers
200
5
Figure 12: Boxplot of 7Be activities for <10 µm fraction of sediment source and deposit samples, showing continued high activity in sediment deposits. These activities have been corrected for natural decay since the discharge event prior to sampling (Figure 8).
4.2.2. Sediment sources immediately post-fire The results in Table 4 confirm that the post-fire hillslope fan is surface derived material with high 137Cs and 210Pbex activities, and that surface erosion dominates sediment supply to rivers in 2002. The 137Cs and 210Pbex activities of the hillslope fan deposit exceed the corresponding activities of surface soil from grazing lands in the adjacent Murrumbidgee River catchment (Table 2) and this is reasonable given that surface soil in forests generally has higher radionuclide concentrations than grazing land (e.g., Wallbrink et al., 2003).
The proportions of surface and sub-surface sources supplying sediment to the river network can be estimated using a two-part mixing model of surface and sub-surface sources. The surface sediment source end-member in the mixing model was defined as the average of the hillslope fan deposit and samples of 2002 river sediment having higher 137Cs than the hillslope fan; 40.73.7 Bq/kg. The sub-surface source end-member was defined from the gully wall deposits, which had a mean 137Cs activity of 2.80.6 Bq/kg. Gully wall deposits with higher 137Cs activity than that of Gillans Ck sediment (4.50.3 Bq/kg) were deemed to be influenced by surface erosion and were excluded.
The results of the sediment mixing model show that the contribution of surface erosion to post-fire river sediment is strongly dependent on the proportion of upstream catchment that was burnt. The data used are the mean 137Cs activity of 2002 river sediment, for three catchments burnt to different extents; Gillans Ck, the Nattai River catchment upstream of Little River and the Little River catchment; the proportion of each catchment that was burnt is given in Table 1. The outcome is shown in Figure 13 and indicates that surface erosion in the study area pre-fire supplied no more than it did in Gillans Creek (52%), and that the 2001 fire and subsequent rainfall increased the proportion of sediment supplied from surface erosion up to approximately 846% in burnt catchments (subscripts are standard errors).
Page 14
y = 1.0658x - 0.2152R2 = 0.9994
0
0.2
0.4
0.6
0.8
1
0 0.2 0.4 0.6 0.8 1Proportion of catchment burnt
Pro
porti
on o
f sed
imen
t sur
face
der
ived
.
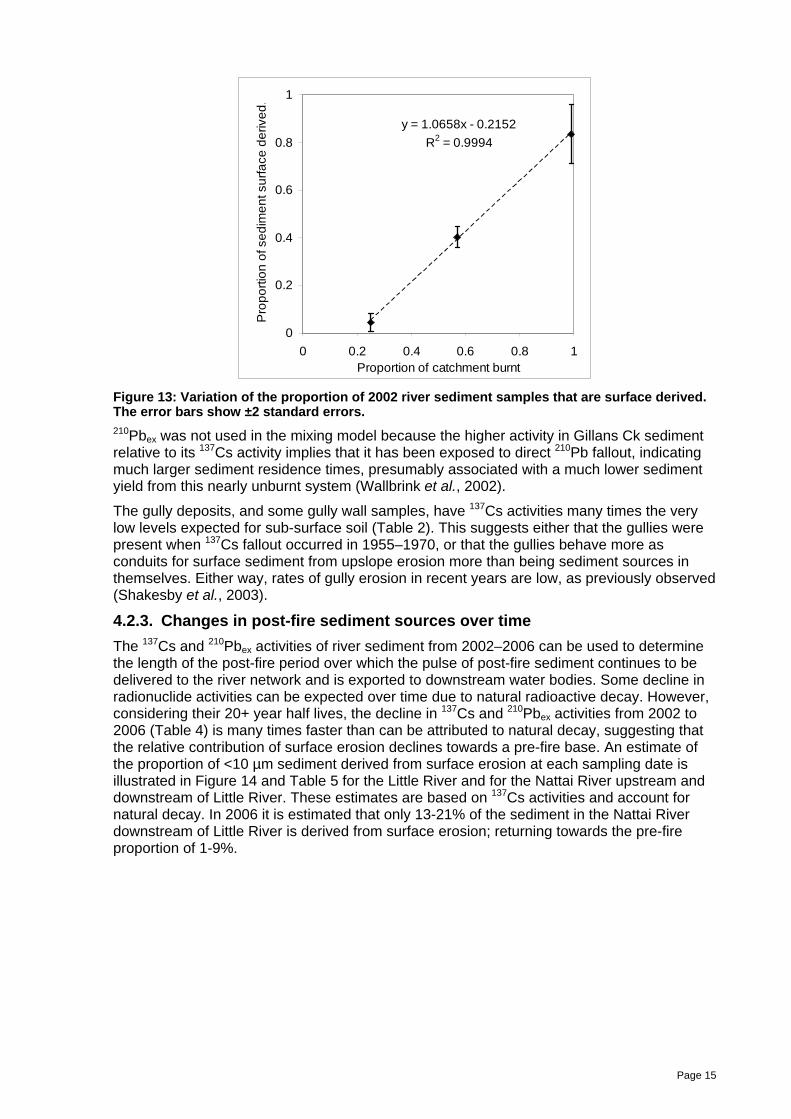
Figure 13: Variation of the proportion of 2002 river sediment samples that are surface derived. The error bars show ±2 standard errors. 210Pbex was not used in the mixing model because the higher activity in Gillans Ck sediment relative to its 137Cs activity implies that it has been exposed to direct 210Pb fallout, indicating much larger sediment residence times, presumably associated with a much lower sediment yield from this nearly unburnt system (Wallbrink et al., 2002).
The gully deposits, and some gully wall samples, have 137Cs activities many times the very low levels expected for sub-surface soil (Table 2). This suggests either that the gullies were present when 137Cs fallout occurred in 1955–1970, or that the gullies behave more as conduits for surface sediment from upslope erosion more than being sediment sources in themselves. Either way, rates of gully erosion in recent years are low, as previously observed (Shakesby et al., 2003).
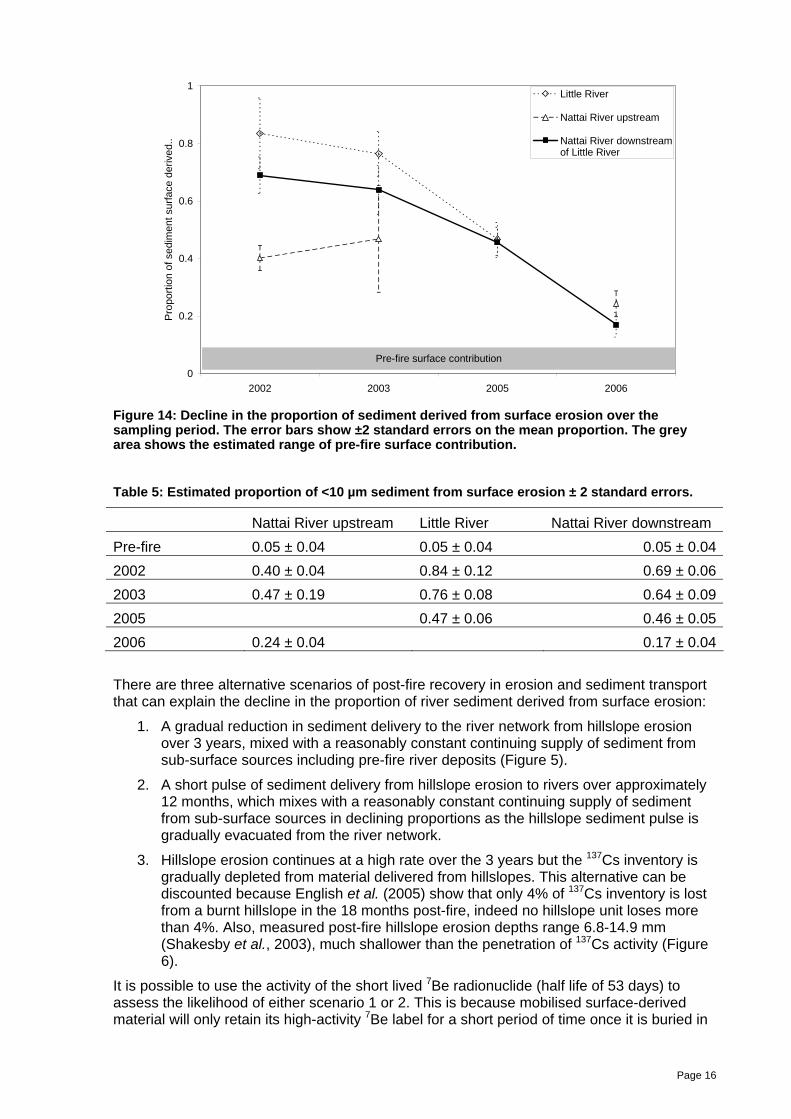
4.2.3. Changes in post-fire sediment sources over time The 137Cs and 210Pbex activities of river sediment from 2002–2006 can be used to determine the length of the post-fire period over which the pulse of post-fire sediment continues to be delivered to the river network and is exported to downstream water bodies. Some decline in radionuclide activities can be expected over time due to natural radioactive decay. However, considering their 20+ year half lives, the decline in 137Cs and 210Pbex activities from 2002 to 2006 (Table 4) is many times faster than can be attributed to natural decay, suggesting that the relative contribution of surface erosion declines towards a pre-fire base. An estimate of the proportion of <10 µm sediment derived from surface erosion at each sampling date is illustrated in Figure 14 and Table 5 for the Little River and for the Nattai River upstream and downstream of Little River. These estimates are based on 137Cs activities and account for natural decay. In 2006 it is estimated that only 13-21% of the sediment in the Nattai River downstream of Little River is derived from surface erosion; returning towards the pre-fire proportion of 1-9%.
Page 15
0
0.2
0.4
0.6
0.8
1
2002 2003 2005 2006
Pro
porti
on o
f sed
imen
t sur
face
der
ived
..
Little River
Nattai River upstream
Nattai River downstreamof Little River
Pre-fire surface contribution
Figure 14: Decline in the proportion of sediment derived from surface erosion over the sampling period. The error bars show ±2 standard errors on the mean proportion. The grey area shows the estimated range of pre-fire surface contribution.
Table 5: Estimated proportion of <10 µm sediment from surface erosion ± 2 standard errors.
There are three alternative scenarios of post-fire recovery in erosion and sediment transport that can explain the decline in the proportion of river sediment derived from surface erosion:
1. A gradual reduction in sediment delivery to the river network from hillslope erosion over 3 years, mixed with a reasonably constant continuing supply of sediment from sub-surface sources including pre-fire river deposits (Figure 5).
2. A short pulse of sediment delivery from hillslope erosion to rivers over approximately 12 months, which mixes with a reasonably constant continuing supply of sediment from sub-surface sources in declining proportions as the hillslope sediment pulse is gradually evacuated from the river network.
3. Hillslope erosion continues at a high rate over the 3 years but the 137Cs inventory is gradually depleted from material delivered from hillslopes. This alternative can be discounted because English et al. (2005) show that only 4% of 137Cs inventory is lost from a burnt hillslope in the 18 months post-fire, indeed no hillslope unit loses more than 4%. Also, measured post-fire hillslope erosion depths range 6.8-14.9 mm (Shakesby et al., 2003), much shallower than the penetration of 137Cs activity (Figure 6).
It is possible to use the activity of the short lived 7Be radionuclide (half life of 53 days) to assess the likelihood of either scenario 1 or 2. This is because mobilised surface-derived material will only retain its high-activity 7Be label for a short period of time once it is buried in
Page 16
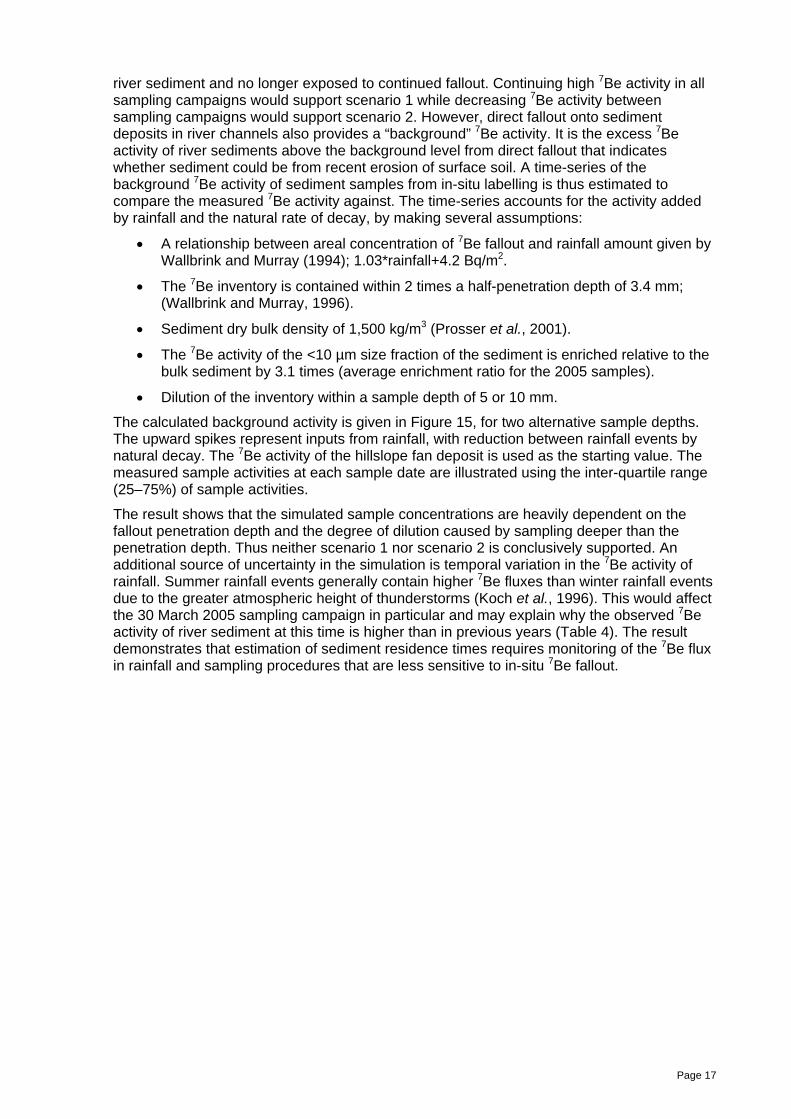
river sediment and no longer exposed to continued fallout. Continuing high 7Be activity in all sampling campaigns would support scenario 1 while decreasing 7Be activity between sampling campaigns would support scenario 2. However, direct fallout onto sediment deposits in river channels also provides a “background” 7Be activity. It is the excess 7Be activity of river sediments above the background level from direct fallout that indicates whether sediment could be from recent erosion of surface soil. A time-series of the background 7Be activity of sediment samples from in-situ labelling is thus estimated to compare the measured 7Be activity against. The time-series accounts for the activity added by rainfall and the natural rate of decay, by making several assumptions:
• A relationship between areal concentration of 7Be fallout and rainfall amount given by Wallbrink and Murray (1994); 1.03*rainfall+4.2 Bq/m2.
• The 7Be inventory is contained within 2 times a half-penetration depth of 3.4 mm; (Wallbrink and Murray, 1996).
• Sediment dry bulk density of 1,500 kg/m3 (Prosser et al., 2001).
• The 7Be activity of the <10 µm size fraction of the sediment is enriched relative to the bulk sediment by 3.1 times (average enrichment ratio for the 2005 samples).
• Dilution of the inventory within a sample depth of 5 or 10 mm.
The calculated background activity is given in Figure 15, for two alternative sample depths. The upward spikes represent inputs from rainfall, with reduction between rainfall events by natural decay. The 7Be activity of the hillslope fan deposit is used as the starting value. The measured sample activities at each sample date are illustrated using the inter-quartile range (25–75%) of sample activities.
The result shows that the simulated sample concentrations are heavily dependent on the fallout penetration depth and the degree of dilution caused by sampling deeper than the penetration depth. Thus neither scenario 1 nor scenario 2 is conclusively supported. An additional source of uncertainty in the simulation is temporal variation in the 7Be activity of rainfall. Summer rainfall events generally contain higher 7Be fluxes than winter rainfall events due to the greater atmospheric height of thunderstorms (Koch et al., 1996). This would affect the 30 March 2005 sampling campaign in particular and may explain why the observed 7Be activity of river sediment at this time is higher than in previous years (Table 4). The result demonstrates that estimation of sediment residence times requires monitoring of the 7Be flux in rainfall and sampling procedures that are less sensitive to in-situ 7Be fallout.
Direct fallout activity (5 mm sample)Direct fallout activity (10 mm sample)Sample interquartile range
Figure 15: Simulated time-series of the background 7Be activity of river samples resulting from in-situ labelling and two different amounts of inventory dilution within samples. The inter-quartile range of the measured sample activities from 2002, 2003 and 2005 are shown as vertical bars.
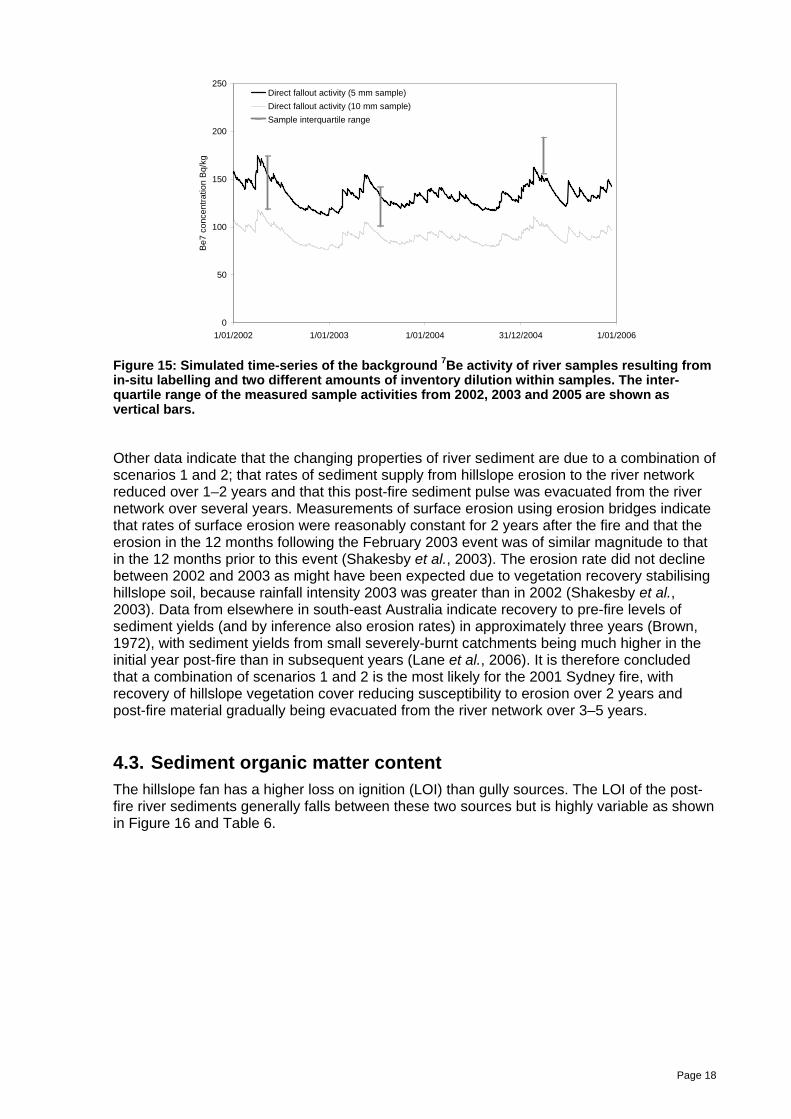
Other data indicate that the changing properties of river sediment are due to a combination of scenarios 1 and 2; that rates of sediment supply from hillslope erosion to the river network reduced over 1–2 years and that this post-fire sediment pulse was evacuated from the river network over several years. Measurements of surface erosion using erosion bridges indicate that rates of surface erosion were reasonably constant for 2 years after the fire and that the erosion in the 12 months following the February 2003 event was of similar magnitude to that in the 12 months prior to this event (Shakesby et al., 2003). The erosion rate did not decline between 2002 and 2003 as might have been expected due to vegetation recovery stabilising hillslope soil, because rainfall intensity 2003 was greater than in 2002 (Shakesby et al., 2003). Data from elsewhere in south-east Australia indicate recovery to pre-fire levels of sediment yields (and by inference also erosion rates) in approximately three years (Brown, 1972), with sediment yields from small severely-burnt catchments being much higher in the initial year post-fire than in subsequent years (Lane et al., 2006). It is therefore concluded that a combination of scenarios 1 and 2 is the most likely for the 2001 Sydney fire, with recovery of hillslope vegetation cover reducing susceptibility to erosion over 2 years and post-fire material gradually being evacuated from the river network over 3–5 years.
4.3. Sediment organic matter content The hillslope fan has a higher loss on ignition (LOI) than gully sources. The LOI of the post-fire river sediments generally falls between these two sources but is highly variable as shown in Figure 16 and Table 6.
Page 18
10
15
20
25
30
Loss
On
Igni
tion
%
Hillslop
e Fan
Gully W
alls
Gully D
epos
its
Rivers
200
2
Rivers
200
3
Rivers
200
5
Figure 16: Loss On Ignition (LOI) of the <10 µm fraction of sediment sources and deposits. Table 6: Sediment mean loss on ignition and Phosphorus contents, with 95% confidence bounds (+/- two standard errors).
Unit Loss on ignition (%) P (ppm) Hillslope fan 32.4 122 Gully walls 13 +/- 5.0 70 +/- 13Gully deposits 16 +/- 5.2 80 +/- 11Rivers 2002 22 +/- 2.8 238 +/-154Rivers 2003 25 +/- 2.6 106 +/- 6.0Rivers 2005 24 +/- 4.2 95 +/- 10
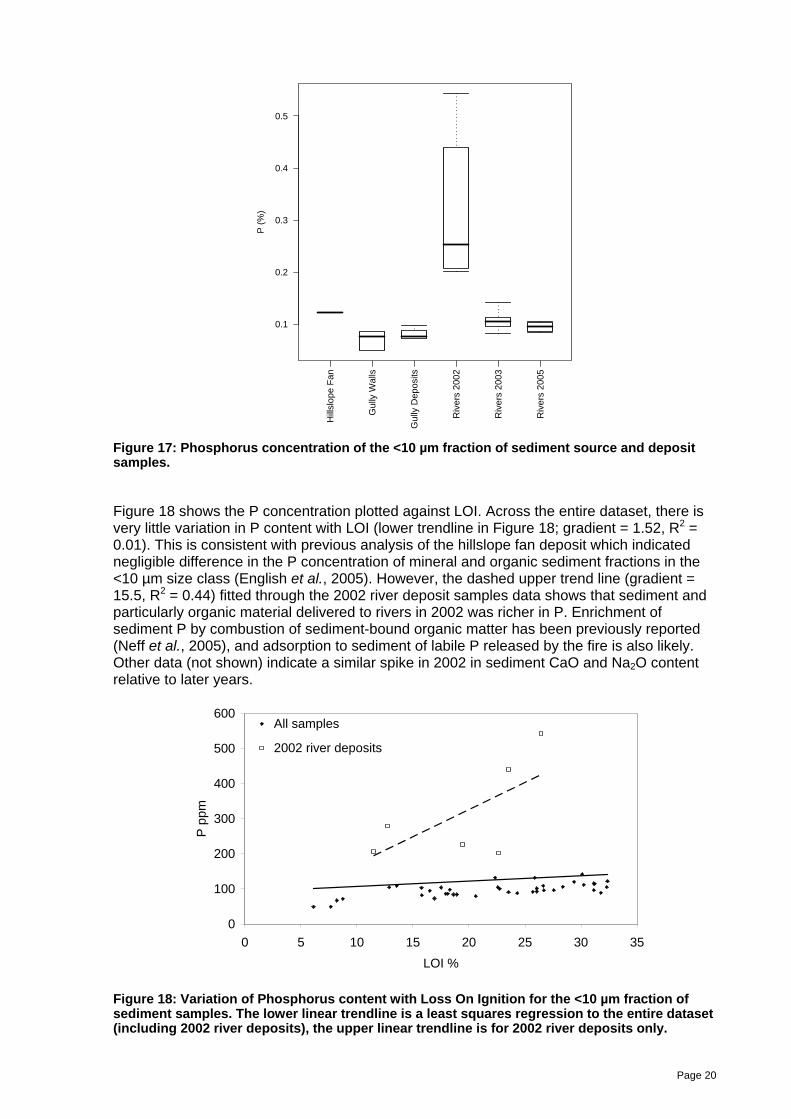
4.4. Sediment phosphorus content Figure 17 shows the phosphorus (P) content of <10 µm sediment. The median P content of 2002 river deposits (253 ppm) is 2.1 times the P concentration of the hillslope fan deposit and approximately 3.3 times the median concentration of all gully samples. By 2003 the median P content has declined 65% from the 2002 peak. The P content of the 2002 river deposits is variable but generally increases with the proportion of catchment burnt in the same way as 137Cs; for example Little River P content ranged 202 – 543 ppm and Nattai River 206 – 279 ppm. Little River 2002 sediment has P content 6 times that of gully walls.
Page 19
0.1
0.2
0.3
0.4
0.5
P (
%)
Hill
slop
e F
an
Gul
ly W
alls
Gul
ly D
epos
its
Riv
ers
2002
Riv
ers
2003
Riv
ers
2005
Figure 17: Phosphorus concentration of the <10 µm fraction of sediment source and deposit samples.
Figure 18 shows the P concentration plotted against LOI. Across the entire dataset, there is very little variation in P content with LOI (lower trendline in Figure 18; gradient = 1.52, R2 = 0.01). This is consistent with previous analysis of the hillslope fan deposit which indicated negligible difference in the P concentration of mineral and organic sediment fractions in the <10 µm size class (English et al., 2005). However, the dashed upper trend line (gradient = 15.5, R2 = 0.44) fitted through the 2002 river deposit samples data shows that sediment and particularly organic material delivered to rivers in 2002 was richer in P. Enrichment of sediment P by combustion of sediment-bound organic matter has been previously reported (Neff et al., 2005), and adsorption to sediment of labile P released by the fire is also likely. Other data (not shown) indicate a similar spike in 2002 in sediment CaO and Na2O content relative to later years.
0
100
200
300
400
500
600
0 5 10 15 20 25 30 35LOI %
P pp
m
All samples
2002 river deposits
Figure 18: Variation of Phosphorus content with Loss On Ignition for the <10 µm fraction of sediment samples. The lower linear trendline is a least squares regression to the entire dataset (including 2002 river deposits), the upper linear trendline is for 2002 river deposits only.
Page 20
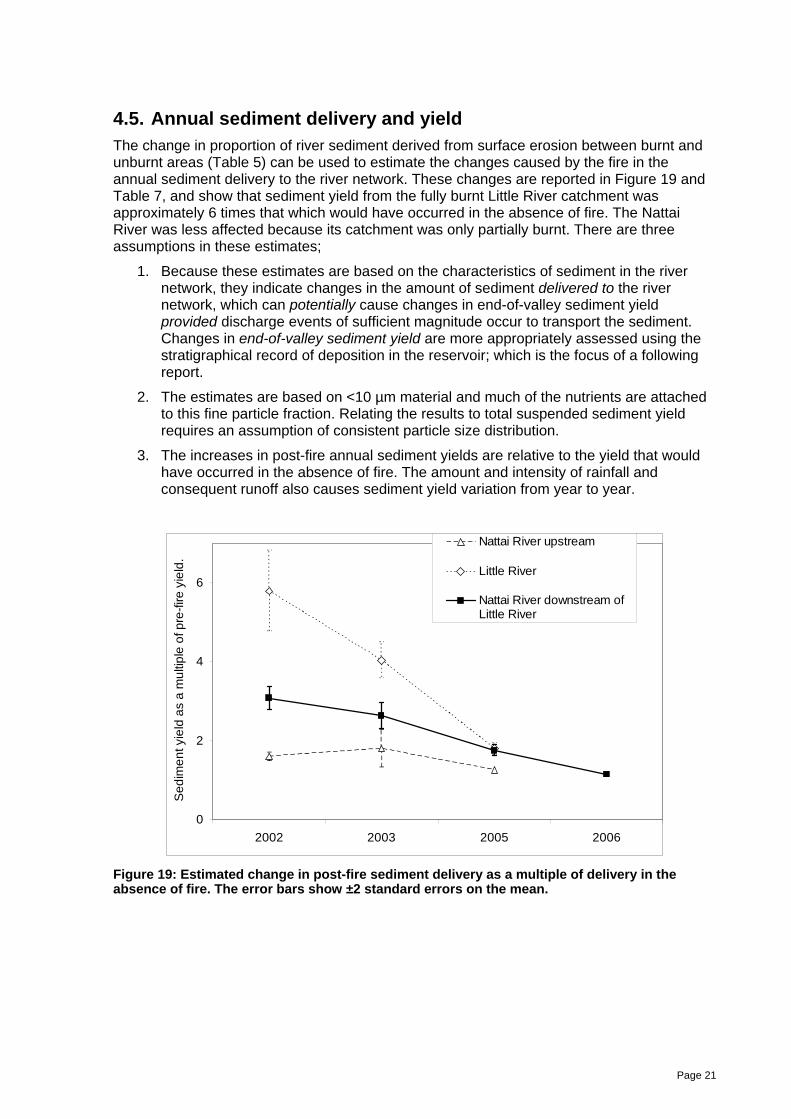
4.5. Annual sediment delivery and yield The change in proportion of river sediment derived from surface erosion between burnt and unburnt areas (Table 5) can be used to estimate the changes caused by the fire in the annual sediment delivery to the river network. These changes are reported in Figure 19 and Table 7, and show that sediment yield from the fully burnt Little River catchment was approximately 6 times that which would have occurred in the absence of fire. The Nattai River was less affected because its catchment was only partially burnt. There are three assumptions in these estimates;
1. Because these estimates are based on the characteristics of sediment in the river network, they indicate changes in the amount of sediment delivered to the river network, which can potentially cause changes in end-of-valley sediment yield provided discharge events of sufficient magnitude occur to transport the sediment. Changes in end-of-valley sediment yield are more appropriately assessed using the stratigraphical record of deposition in the reservoir; which is the focus of a following report.
2. The estimates are based on <10 µm material and much of the nutrients are attached to this fine particle fraction. Relating the results to total suspended sediment yield requires an assumption of consistent particle size distribution.
3. The increases in post-fire annual sediment yields are relative to the yield that would have occurred in the absence of fire. The amount and intensity of rainfall and consequent runoff also causes sediment yield variation from year to year.
0
2
4
6
2002 2003 2005 2006
Sed
imen
t yie
ld a
s a
mul
tiple
of p
re-fi
re y
ield
.
Nattai River upstream
Little River
Nattai River downstream ofLittle River
Figure 19: Estimated change in post-fire sediment delivery as a multiple of delivery in the absence of fire. The error bars show ±2 standard errors on the mean.
Page 21
Table 7: Estimated increases in annual sediment delivery as a multiple of yield in the absence of fire, ± 2 standard errors.
Year Nattai River upstream Little River Nattai River downstream 2002 1.6 ± 0.1 5.8 ± 1.0 3.1 ± 0.3
2003 1.8 ± 0.47 4.0 ± 0.46 2.6 ± 0.3
2005 1.8 ± 0.15 1.8 ± 0.14
2006 1.3 ± 0.1 1.2 ± 0.1 The estimated increase for the completely burnt Little River is less than the 8-9 times increase in yield measured in two small mountain streams in the 12 months after the 2003 Victorian fires (Lane et al., 2006); but this difference can be attributed to the Victorian catchments being much smaller than the Little River catchment, and half of the post-fire yield in those catchments was delivered in one intense rain event indicating the dependence of sediment yield on post-fire rainfall.
The estimated increase in post-fire sediment yield using the changes in river sediment 137Cs activity as reported in Table 7 is supported by a confluence mixing model of the 137Cs activities at the Nattai and Little Rivers confluence. Table 7 indicates that the yield of Little River increased 3.60.7 times more than that of the Nattai River (5.8 / 1.6). The confluence mixing model indicates that 669% of sediment exported from the Nattai River to the reservoir was sourced from Little River in 2002, and the mineral magnetic properties of the sediments indicate similar mixing proportions (Blake et al., 2006). Considering the relative catchment areas (the Little River catchment area is 41% that of the Nattai River catchment; see Table 1), the confluence mixing proportions indicate that the yield of the Little River in 2002 was 4.81.5 times that of the Nattai River (66% of the total sediment yield from 41% of the area), which is within the uncertainties of the estimate based on the changes in sediment 137Cs activity. This estimate assumes a similar area-specific sediment yield in the absence of fire.
The hillslope tracer budgets (English et al., 2005) indicate unrealistically large sediment delivery to the river network if literally interpreted as depths of sediment loss. Table 8 shows the estimated erosion depths from each tracer budget; giving a mean of 5 mm. This is comparable to the 6.8-14.9 mm erosion depths measured using the erosion bridges (Shakesby et al., 2003); but does not account for the similar magnitudes of deposition also measured using the erosion bridges. Thus, the resulting 2002 sediment delivery estimate of 7,400 t/km2 is unrealistically large. As well as not adequately representing delivery to stream, it is also suggested that the tracer budgets, particularly 210Pbex, were significantly affected by preferential transport of organic material.
Applying estimates of long-term end-of-valley sediment yield estimated by Rustomji and Wilkinson (in prep.), the 2002 Little River yield was approximately 400 t/km2, and the 2002 Nattai River yield upstream of Little River was 80 t/km2. Assuming the yields of Rustomji and Wilkinson (in prep.) are correct for 2002 indicates a delivery ratio from the hillslope budgets to the river network of approximately 5%.
Table 8: Estimated erosion depths from the hillslope tracer budgets. Half depths are estimated from Figure 6.
4.6. Event sediment and nutrient yields 4.6.1. Discharge and concentration data The effect on event yields is investigated using water quality data and the 15 minute discharge record for Little River. The period of the Little River water quality data analysed is shown in Figure 20. This figure indicates an inter-event base discharge of approximately 0.1 m3/s. The water quality data include more than four events > 1 m3/s prior to the fire, and one event subsequent to the fire (10-11 February 2003). The peak discharge of the sampled post-fire event was 2.98 m3/s, having a recurrence interval of approximately 1.4 years. The discharge and concentrations of pre and post-fire water quality samples are given in Table 9.
Table 9: Little River water quality samples analysed pre and post-fire; n = number of samples, Qmax = maximum observed discharge; concmax = maximum sampled concentration.
Pre-fire Post-fire Constituent
n Qmax (m3/s)
concmax (mg/l)
n Qmax (m3/s)
concmax (mg/l)
TSS 114 53.6 82 18 2.83 2646
TP 177 53.6 0.34 20 2.83 2.48
TP (dissolved) 164 34.2 0.050 20 2.83 0.064
TN 147 15.0 15 20 2.83 24.7
0.001
0.01
0.1
1
10
100
1/01/1
998
1/01/1
999
1/01/2
000
1/01/2
001
1/01/2
002
1/01/2
003
2/01/2
004
Dis
char
ge m
3/s
DischargeTSS sampleNutrient sample
Fire
Figure 20: Little River hydrograph, showing the discharge at which water quality samples were taken. Most samples were analysed for TSS and nutrients.
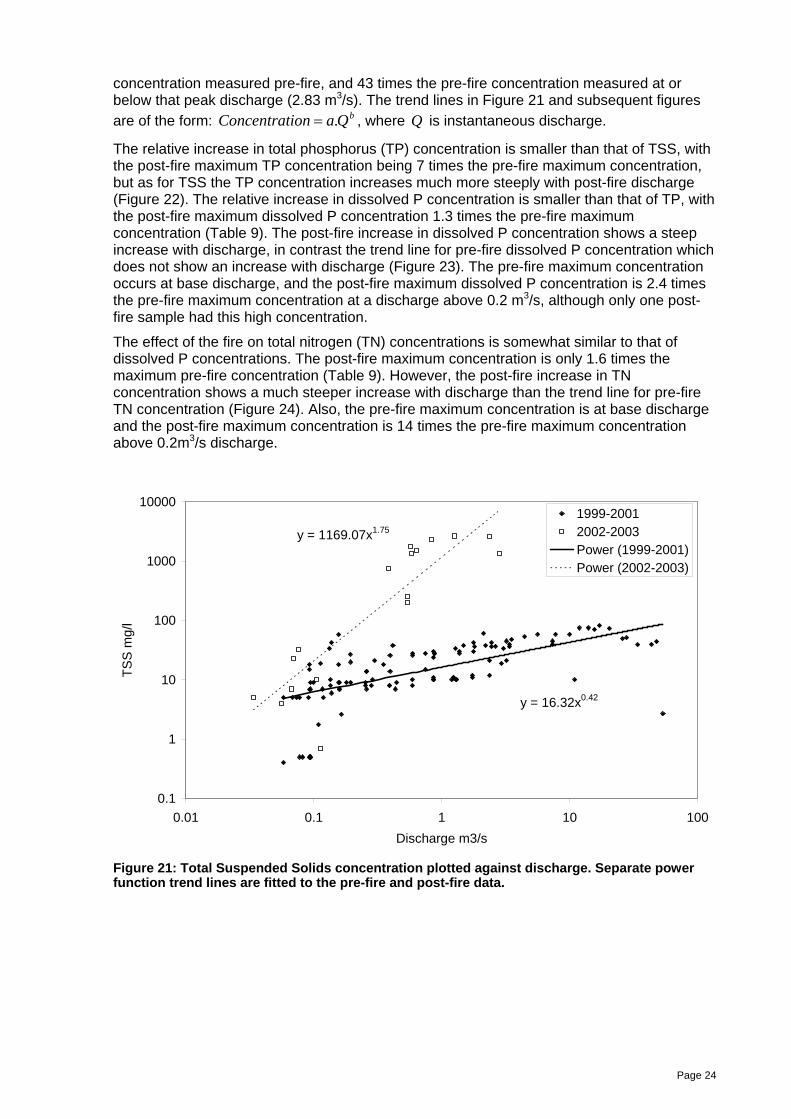
The post-fire TSS concentrations are similar to the pre-fire concentrations below 0.2 m3/s, but show a steep increase with discharge in the sampled post-fire event (Figure 21). The maximum TSS concentration in the sampled post-fire event is 32 times the maximum
Page 23
concentration measured pre-fire, and 43 times the pre-fire concentration measured at or below that peak discharge (2.83 m3/s). The trend lines in Figure 21 and subsequent figures are of the form: , where is instantaneous discharge. bQaionConcentrat .= Q
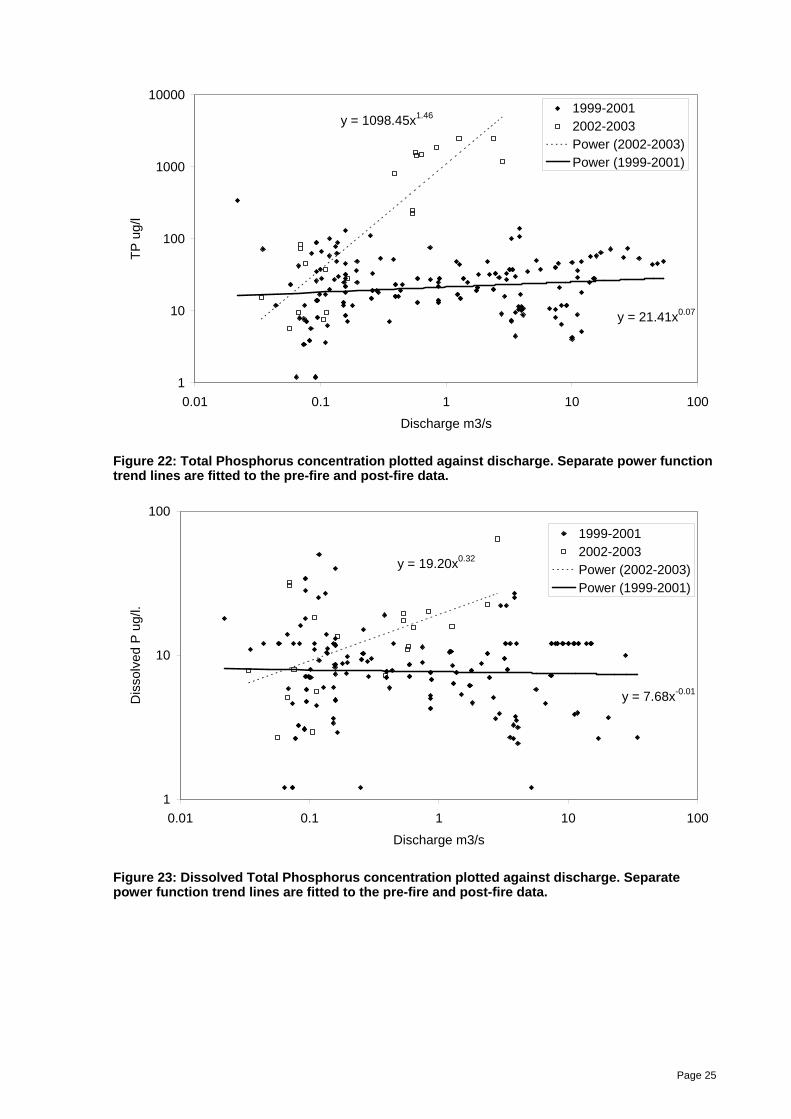
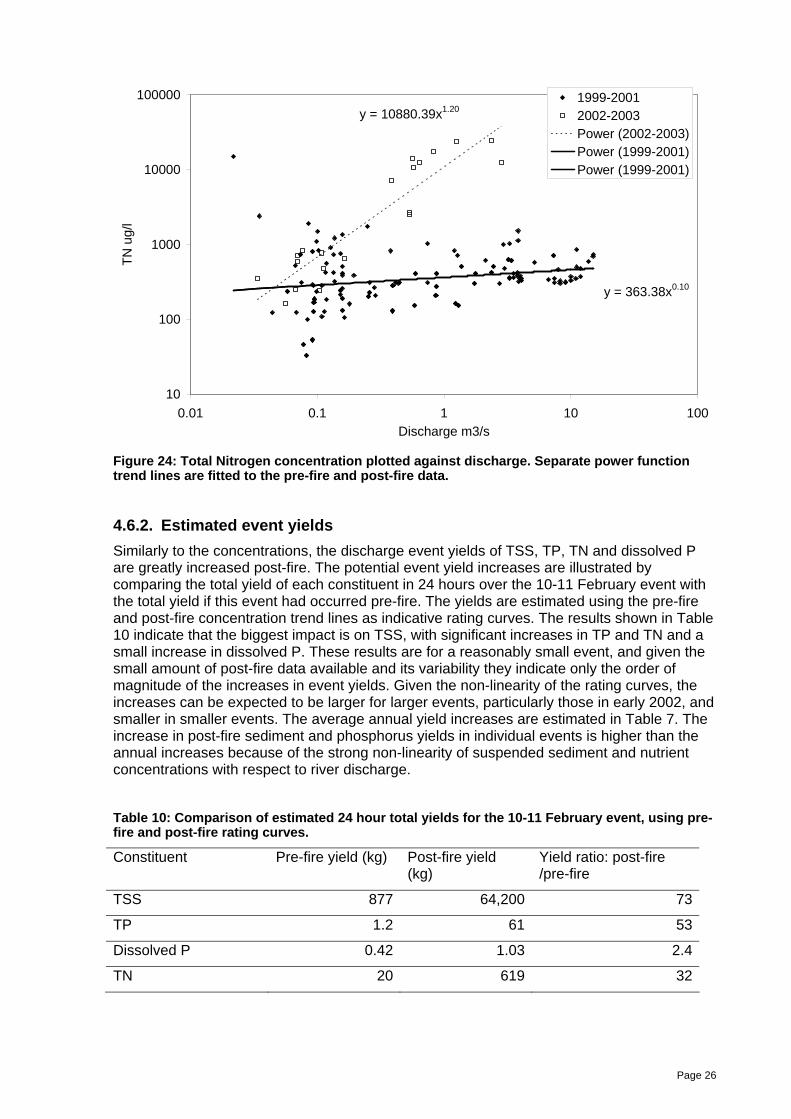
The relative increase in total phosphorus (TP) concentration is smaller than that of TSS, with the post-fire maximum TP concentration being 7 times the pre-fire maximum concentration, but as for TSS the TP concentration increases much more steeply with post-fire discharge (Figure 22). The relative increase in dissolved P concentration is smaller than that of TP, with the post-fire maximum dissolved P concentration 1.3 times the pre-fire maximum concentration (Table 9). The post-fire increase in dissolved P concentration shows a steep increase with discharge, in contrast the trend line for pre-fire dissolved P concentration which does not show an increase with discharge (Figure 23). The pre-fire maximum concentration occurs at base discharge, and the post-fire maximum dissolved P concentration is 2.4 times the pre-fire maximum concentration at a discharge above 0.2 m3/s, although only one post-fire sample had this high concentration.
The effect of the fire on total nitrogen (TN) concentrations is somewhat similar to that of dissolved P concentrations. The post-fire maximum concentration is only 1.6 times the maximum pre-fire concentration (Table 9). However, the post-fire increase in TN concentration shows a much steeper increase with discharge than the trend line for pre-fire TN concentration (Figure 24). Also, the pre-fire maximum concentration is at base discharge and the post-fire maximum concentration is 14 times the pre-fire maximum concentration above 0.2m3/s discharge.
Figure 21: Total Suspended Solids concentration plotted against discharge. Separate power function trend lines are fitted to the pre-fire and post-fire data.
Figure 22: Total Phosphorus concentration plotted against discharge. Separate power function trend lines are fitted to the pre-fire and post-fire data.
Figure 23: Dissolved Total Phosphorus concentration plotted against discharge. Separate power function trend lines are fitted to the pre-fire and post-fire data.
Figure 24: Total Nitrogen concentration plotted against discharge. Separate power function trend lines are fitted to the pre-fire and post-fire data.
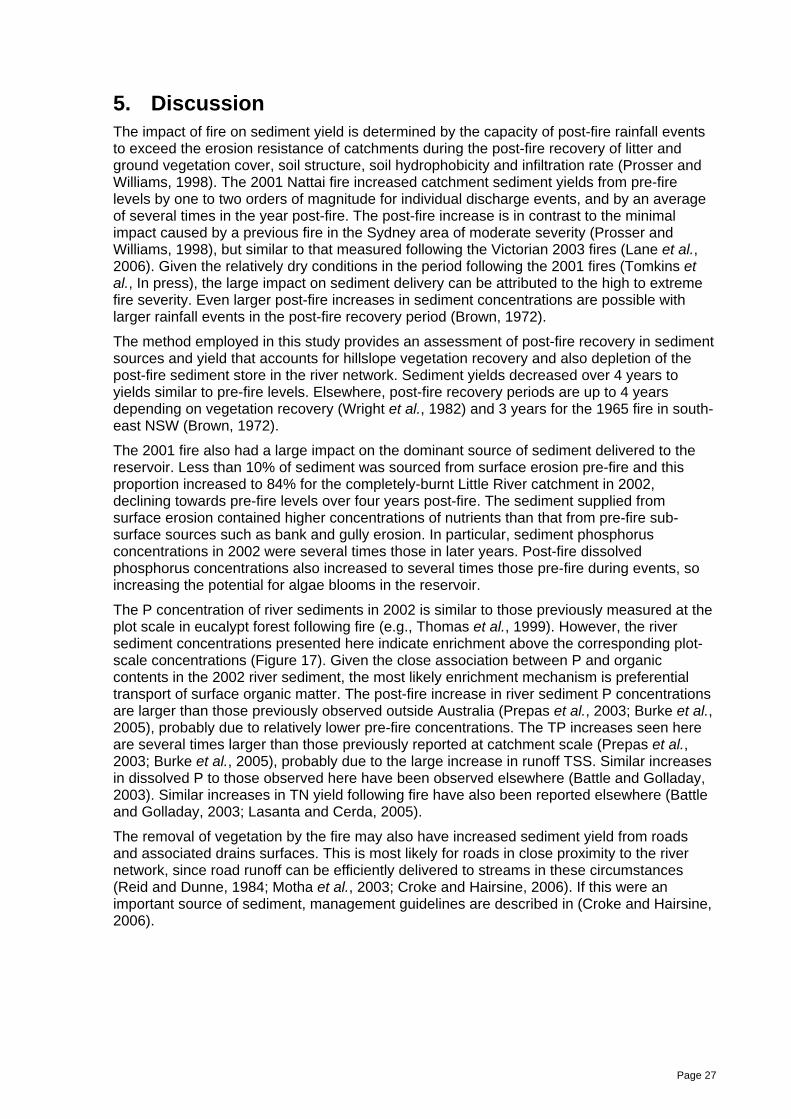
4.6.2. Estimated event yields Similarly to the concentrations, the discharge event yields of TSS, TP, TN and dissolved P are greatly increased post-fire. The potential event yield increases are illustrated by comparing the total yield of each constituent in 24 hours over the 10-11 February event with the total yield if this event had occurred pre-fire. The yields are estimated using the pre-fire and post-fire concentration trend lines as indicative rating curves. The results shown in Table 10 indicate that the biggest impact is on TSS, with significant increases in TP and TN and a small increase in dissolved P. These results are for a reasonably small event, and given the small amount of post-fire data available and its variability they indicate only the order of magnitude of the increases in event yields. Given the non-linearity of the rating curves, the increases can be expected to be larger for larger events, particularly those in early 2002, and smaller in smaller events. The average annual yield increases are estimated in Table 7. The increase in post-fire sediment and phosphorus yields in individual events is higher than the annual increases because of the strong non-linearity of suspended sediment and nutrient concentrations with respect to river discharge.
Table 10: Comparison of estimated 24 hour total yields for the 10-11 February event, using pre-fire and post-fire rating curves.
5. Discussion The impact of fire on sediment yield is determined by the capacity of post-fire rainfall events to exceed the erosion resistance of catchments during the post-fire recovery of litter and ground vegetation cover, soil structure, soil hydrophobicity and infiltration rate (Prosser and Williams, 1998). The 2001 Nattai fire increased catchment sediment yields from pre-fire levels by one to two orders of magnitude for individual discharge events, and by an average of several times in the year post-fire. The post-fire increase is in contrast to the minimal impact caused by a previous fire in the Sydney area of moderate severity (Prosser and Williams, 1998), but similar to that measured following the Victorian 2003 fires (Lane et al., 2006). Given the relatively dry conditions in the period following the 2001 fires (Tomkins et al., In press), the large impact on sediment delivery can be attributed to the high to extreme fire severity. Even larger post-fire increases in sediment concentrations are possible with larger rainfall events in the post-fire recovery period (Brown, 1972).
The method employed in this study provides an assessment of post-fire recovery in sediment sources and yield that accounts for hillslope vegetation recovery and also depletion of the post-fire sediment store in the river network. Sediment yields decreased over 4 years to yields similar to pre-fire levels. Elsewhere, post-fire recovery periods are up to 4 years depending on vegetation recovery (Wright et al., 1982) and 3 years for the 1965 fire in south-east NSW (Brown, 1972).
The 2001 fire also had a large impact on the dominant source of sediment delivered to the reservoir. Less than 10% of sediment was sourced from surface erosion pre-fire and this proportion increased to 84% for the completely-burnt Little River catchment in 2002, declining towards pre-fire levels over four years post-fire. The sediment supplied from surface erosion contained higher concentrations of nutrients than that from pre-fire sub-surface sources such as bank and gully erosion. In particular, sediment phosphorus concentrations in 2002 were several times those in later years. Post-fire dissolved phosphorus concentrations also increased to several times those pre-fire during events, so increasing the potential for algae blooms in the reservoir.
The P concentration of river sediments in 2002 is similar to those previously measured at the plot scale in eucalypt forest following fire (e.g., Thomas et al., 1999). However, the river sediment concentrations presented here indicate enrichment above the corresponding plot-scale concentrations (Figure 17). Given the close association between P and organic contents in the 2002 river sediment, the most likely enrichment mechanism is preferential transport of surface organic matter. The post-fire increase in river sediment P concentrations are larger than those previously observed outside Australia (Prepas et al., 2003; Burke et al., 2005), probably due to relatively lower pre-fire concentrations. The TP increases seen here are several times larger than those previously reported at catchment scale (Prepas et al., 2003; Burke et al., 2005), probably due to the large increase in runoff TSS. Similar increases in dissolved P to those observed here have been observed elsewhere (Battle and Golladay, 2003). Similar increases in TN yield following fire have also been reported elsewhere (Battle and Golladay, 2003; Lasanta and Cerda, 2005).
The removal of vegetation by the fire may also have increased sediment yield from roads and associated drains surfaces. This is most likely for roads in close proximity to the river network, since road runoff can be efficiently delivered to streams in these circumstances (Reid and Dunne, 1984; Motha et al., 2003; Croke and Hairsine, 2006). If this were an important source of sediment, management guidelines are described in (Croke and Hairsine, 2006).
Page 27
6. Conclusions From this study the following conclusions are made:
• The surface erosion and redistribution of sediment measured on hillslopes following the 2001 fires resulted in delivery of large amounts of surface material to the river network, in contrast to pre-fire sediment sources which were dominated by sub-soil sources.
• Erosion and delivery of surface material to the river network continued in declining amounts for several years, until at least 2006.
• Sediment phosphorus concentrations are elevated post-fire, particularly in 2002.
• In the post-fire period, sediment, phosphorus and nitrogen delivery through the river network is strongly event driven, with event yields being one to two orders of magnitude larger than pre-fire yields.
Page 28
7. References Battle, J. and Golladay, S. W. (2003). "Prescribed fire's impact on water quality of
depressional wetlands in southwestern Georgia." American Midland Naturalist 150(1): 15-25.
Blake, W. H., Wallbrink, P. J., Doerr, S. H., Shakesby, R. A. and Humphreys, G. S. (2006). "Magnetic enhancement in wildfire-affected soil and its potential for sediment-source ascription." Earth Surface Processes And Landforms 31(2): 249-264.
Brown, J. (1972). "Hydrologic effects of a bushfire in a catchment in south-eastern New South Wales." Journal of Hydrology 15: 77-96.
Burke, J. M., Prepas, E. E. and Pinder, S. (2005). "Runoff and phosphorus export patterns in large forested watersheds on the western Canadian Boreal Plain before and for 4 years after wildfire." Journal Of Environmental Engineering And Science 4(5): 319-325.
Chafer, C. J., Noonan, M. and Macnaught, E. (2004). "The post-fire measurement of fire severity and intensity in the Christmas 2001 Sydney wildfires." International Journal Of Wildland Fire 13(2): 227-240.
Croke, J. and Hairsine, P. (2006). "Sediment delivery in managed forests: A review." Environmental Reviews 14(1): 59 - 87.
English, P., Wallbrink, P., Humphreys, G., Shakesby, R., Doerr, S., Blake, W., Chafer, C. and Vigneswaran, B. (2005). Impacts on water quality by sediments and nutrients released during extreme bushfires: Report 2 Tracer assessment of post-fire sediment and nutrient redistribution on hillslopes: Nattai National Park, NSW. Client Report, CSIRO Land and Water, Canberra. http://www.clw.csiro.au/publications/consultancy/2005/SCA-Report2.pdf.
Koch, D. M., Jacob, D. J. and Graustein, W. C. (1996). "Vertical transport of tropospheric aerosols as indicated by Be-7 and Pb-210 in a chemical tracer model." Journal Of Geophysical Research-Atmospheres 101(D13): 18651-18666.
Lane, P. N. J., Sheridan, G. J. and Noske, P. J. (2006). "Changes in sediment loads and discharge from small mountain catchments following wildfire in south eastern Australia." Journal of Hydrology: In press.
Lasanta, T. and Cerda, A. (2005). "Long-term erosional responses after fire in the Central Spanish Pyrenees." Catena 60(1): 81-100.
Leitch, C. J., Flinn, D. W. and Van De Graaf, R. H. M. (1983). "Erosion and nutrient loss resulting from Ash Wednesday (February 1983) wildfires: a case study." Australian Forestry 46: 173-180.
Motha, J. A., Wallbrink, P. J., Hairsine, P. B. and Grayson, R. B. (2003). "Harvested areas and unsealed roads as sources of suspended sediment in a forested water supply catchment in south-eastern Australia." Water Resources Research 39 (3): 1056, doi:10.1029/2001WR000794.
Neff, J. C., Harden, J. W. and Gleixner, G. (2005). "Fire effects on soil organic matter content, composition, and nutrients in boreal interior Alaska." Canadian Journal Of Forest Research-Revue Canadienne De Recherche Forestiere 35(9): 2178-2187.
Norrish, K. and Hutton, J. T. (1969). "An accurate x-ray spectrometric method for the analysis of a wide range of geological samples." Geochimica et Cosmochimica Acta 33: 431-453.
Norrish, K. and Chappell, B. W. (1977). X-ray fluorescence spectrometry. Physical Methods in Determinative Mineralogy. J. e. Zussman. pp. 201-272, Academic Press, London.
Olley, J. M., Murray, A. S. and Wallbrink, P. J. (1996). "Identifying sediment in a partially logged catchment using natural and anthropogenic radioactivity." Z. Geomorph. NF Suppl. 105: 111–127.
Olley, J. M. and Deere, D. (2003). Targeting rectification action in the Wingecarribee catchment. Technical Report 47/03, CSIRO Land and Water, Canberra.
Paton, T. R., Humphreys, G. S. and Mitchell, P. B. (1995). Soils. A New Global View. UCL Press, London.
Peart, M. R. and Walling, D. E. (1986). Fingerprinting sediment source: The example of a drainage basin in Devon, U.K. Drainage Basin Sediment Delivery, IAHS Publ. No. 159, 41-54, IAHS Press.
Prepas, E. E., Burke, J. M., Chanasyk, D. S., Smith, D. W., Putz, G., Gabos, S., Chen, W., Millions, D. and Serediak, M. (2003). "Impact of wildfire on discharge and phosphorus export from the Sakwatamau watershed in the Swan Hills, Alberta, during the first two years." Journal Of Environmental Engineering And Science 2: S63-S72.
Prosser, I. P. and Williams, L. (1998). "The effect of wildfire on runoff and erosion in native Eucalyptus forest." Hydrological Processes 12(2): 251-265.
Prosser, I. P., Rustomji, P., Young, B., Moran, C. and Hughes, A. (2001). Constructing river basin sediment budgets for the National Land and Water Resources Audit. CSIRO Land and Water Technical Report 15/01. 34 pp,
Reid, I. M. and Dunne, T. (1984). "Sediment production from road surfaces." Water Resources Research 20: 1753-1761.
Rustomji, P. and Wilkinson, S. (in prep.). Estimated suspended sediment yields in the Lake Burragorang catchment. Science Report, CSIRO Land and Water, Canberra. (in prep),
Shakesby, R. A., Chafer, C. J., Doerr, S. H., Blake, W. H., Wallbrink, P., Humphreys, G. S. and Harrington, B. A. (2003). "Fire Severity, Water Repellency Characteristics and Hydrogeomorphological Changes Following the Christmas 2001 Sydney Forest Fires." Australian Geographer 34(2): 147-175.
Thomas, A. D., Walsh, R. P. D. and Shakesby, R. A. (1999). "Nutrient losses in eroded sediment after fire in eucalyptus and pine forests in the wet Mediterranean environment of northern Portugal." Catena 36(4): 283-302.
Tomkins, K. M., Humpreys, G. S., Skeen, H. J., Taylor, G. M., Farwig, V. J., Shakesby, R. A., Doerr, S. H., Wallbrink, P., Blake, W. H. and Chafer, C. J. (2004). Deciphering a colluvial mantle: Nattai catchment. SuperSoil 2004, 3rd Australian New Zealand Soils Conference, University of Sydney, Australia, 5 – 9 December 2004.
Tomkins, K. M., Humpreys, G. S., Wilkinson, M. T., Hesse, P. P., Doerr, S. H., Shakesby, R. A., J., W. P., Blake, W. H. and Fink, D. (In press). "Contemporary versus long-term denudation along a passive plate margin, Australia: the role of extreme events." Earth Surface Processes and Landforms.
Wallbrink, P., Olley, J. and Hancock, G. (2002). Estimating residence times of fine sediment in river chanels using fallout 210Pb. The structure, function and management implications of fluvial sedimentary systems, Proceedings of an international symposium held at Alice Springs, Australia, September 2002., 425-432, IAHS Publ. 276.
Wallbrink, P., English, P., Chafer, C., Humphreys, G., Shakesby, R., Blake, W. and Doerr, S. (2004). Impacts on water quality by sediments and nutrients released during extreme bushfires: Report 1: A review of the literature pertaining to the effect of fire on erosion and erosion rates, with emphasis on the Nattai catchment, NSW, following the 2001 bushfires. Client Report, CSIRO Land and Water, Canberra. http://www.clw.csiro.au/publications/consultancy/2004/nattai_catchment_fire_erosion.pdf.
Wallbrink, P. J. and Murray, A. S. (1993). "Use of fallout radionuclides as indicators of erosion processes." Hydrological Processes 7: 297–304.
Wallbrink, P. J. and Murray, A. S. (1994). "Fallout Of Be-7 In South Eastern Australia." Journal Of Environmental Radioactivity 25(3): 213-228.
Wallbrink, P. J. and Murray, A. S. (1996). "Distribution and variability of 7Be in soils under different surface cover conditions and its potential for describing soil redistribution processes." Water Resources Research 32: 467-476.
Wallbrink, P. J., Murray, A. S., Olley, J. M. and Olive, L. J. (1998). "Determining the sources and transit times of suspended sediment in the Murrumbidgee River, New South Wales, Australia, using fallout 137C and 210Pb." Water Resources Research 34(4): 879-887.
Wallbrink, P. J., Murray, A. S. and Olley, J. M. (1999). "Relating suspended sediment to its original soil depth using fallout radionuclides." Soil Science Society of America Journal 63: 369-378.
Wallbrink, P. J. and Croke, J. (2002). "A combined rainfall simulator and tracer approach to assess the role of Best Management Practices in minimising sediment redistribution and loss in forests after harvesting." Forest Ecology and Management 170(1-3): 217-232.
Wallbrink, P. J., Martin, C. E. and Wilson, C. J. (2003). "Quantifying the contributions of sediment, sediment-P and fertilizer-P from forested, cultivated and pasture areas at the landuse and catchment scale using fallout radionuclides and geochemistry." Soil & Tillage Research 69: 53-68.
Wallbrink, P. J., Blake, W., Doerr, S., Shakesby, R., Humphreys, G. and English, P. (2005). Using tracer based sediment budgets to assess redistribution of soil and organic material after severe bush fires. IAHS Publ. 292, 223-230, IAHS Press.
Wise, S. M. (1980). 137Cs and 210Pb: A review of the techniques and some applications in geomorphology. Time Scales in Geomorphology. 109-127, Wiley, Chicester.
Wright, H. A., Churchill, F. M. and Stevens, W. C. (1982). "Soil loss, runoff, and water quality of seeded and unseeded step watersheds following prescribed burning." Journal of Range Management 35: 382-385.