Page 1
Imperial College London
BCURA Agreement No: B82
Improvements in Amine Flue Gas Scrubbing Systems forCoal Fired Power Plants
Final Report
Project Duration: October 2006 - October 2009
University Project Manager:
Dr. C. S. Adjiman,
Centre for Process Systems Engineering
Department of Chemical Engineering
Imperial College London, SW7 2AZ
Tel: 020 7594 6638
Fax: 020 7594 6606
Email: [email protected]
BCURA Industrial Supervisor:
Mr. N. Booth
Power Technology Combustion and Emission Control Group
Ratcliffe-on-Soar
Nottinghamshire, NG11 0EE
Tel: 0115 9362682
Fax: 0115 9362205
E-mail: [email protected]
1
Page 2
1 Executive Summary
Mounting concern regarding the adverse effects associated with anthropogenically produced
greenhouse gasses (GHG) has led governments to introduce binding legislation to limit and re-
duce the rate and magnitude of their emission of GHG, with particular emphasis on CO2. While
there are many ways in which these ambitions could be achieved, so-called carbon capture and
storage (CCS) is considered to be a promising route to attaining a meaningful reduction in CO2
emissions in the near-term. It has been shown that CCS technology is particularly appropriate
for large fixed-point emission sources. Of these, the fossil-fuel based power generation indus-
try produces the lion’s share of total global CO2 emissions. Due to its technological maturity,
operational flexibility and its associated low technology risk, post-combustion capture (PCC)
of CO2 via solvent based chemisorption is likely to be the preferred technology option in this
important sector. However, current state-of-the-art PCC techniques have a significant energy
penalty associated with their operation (OPEX) and due to the scale of the problem, the capital
costs (CAPEX) associated with this technology are often considered prohibitive. Thus, there
exists a well-recognised imperative for the significant reduction of both the size of the equip-
ment required (CAPEX) and the cost of solvent regeneration (OPEX). The design of advanced
solvents represents the best opportunity for reducing these costs as it is the solvent that defines
the thermodynamic and kinetic limits of the process. However, conventional approaches to mod-
elling reactive separation processes, due to their heavy reliance on the availability of extensive
experimental data, do not easily lend themselves to reformulation as solvent design problems.
The goals of this project were the development and validation of detailed thermodynamic and
process models relevant to CO2 capture processes. The thermodynamic models have been de-
veloped using the SAFT-VR equation-of-state, and the process models have been implemented
in the gPROMS modelling environment. We have developed a novel technique for modelling the
phase behaviour and thermophysical properties of reactive fluid mixtures. Reliable models to
quantify the phase and chemical equilibrium of mixtures of CO2 + water + amine-based solvent
have been developed. The solvent molecules considered include ammonia (NH3), methylamine,
ethylamine, propylamine, butylamine, pentylamine, hexylamine, ethanol, monoethanolamine
(MEA), 2-amino-2-methyl-1-propanol (AMP), diethylamine, diethanolamine (DEA), triethy-
lamine, methyldiethylamine (MDEA). The models have been shown to be transferable so that
the behaviour with other similar solvents (e.g. alkylamines or other alkanolamines) can be pre-
dicted in the absence of experimental data. The models obtained are highly accurate, with
average absolute deviations less than 1.5% in saturated vapour pressure and liquid density.
1
Page 3
Building on this success, we have proposed a new methodology for building accurate, predictive
models of reactive separation processes, using rate-based models and taking advantage of the
fact that CO2 chemisorption is mass-transfer limited in commonly used solvents. The novel
approach that has been developed has a significantly reduced dependence on experimental data
when compared to other approaches. Further, due to the thermodynamic framework employed,
the process models are substantially simpler and, in our experience, require no adjustment of
model parameters as process operating conditions are changed or indeed as solvent blends are
changed. We have validated the predictions of our absorber model using pilot plant data ob-
tained from the International Test Centre in the University of Regina, Canada. This validation
was performed with solvents with a wide range of reaction kinetics, thus giving confidence in our
assumptions and results. The predictions of our desorber model have been validated using using
pilot plant data obtained from NTNU in Trondheim, Norway. In this way, we have proposed
a new approach for solving integrated solvent and process design problems in the context of
mass-transfer limited reactive separation processes.
On the basis of preliminary results in this area, we now have the underpinning tools in place
to design novel solvent blends, by optimising process performance (e.g., minimising energy con-
sumption given separation targets). By building on other tools developed in the research group
we can also tackle the issue of designing novel solvent molecules. Finally, to achieve a complete
description of the design problem, we need to incorporate oxidation and corrosion models into
our overall process model. All these offer promising and innovative avenues for further research.
Finally, from the work done in this project, results sufficient for eight journal papers have
been obtained, of which one has been accepted for publication in Industrial & Engineering
Chemistry Research with the remainder currently in preparation for journal publication and
sixteen conference presentations, of which eleven were oral presentations, have been given.
2
Page 4
Contents
1 Executive Summary 1
2 Introduction 5
2.1 Background . . . . . . . . . . . . . . . . . . . . . . . . . . . . . . . . . . . . . . . 5
2.2 Chemistry and thermophysical property methods . . . . . . . . . . . . . . . . . . 6
2.3 Approaches to modelling reactive separation systems . . . . . . . . . . . . . . . . 8
2.3.1 Equilibrium vs. rate-based models . . . . . . . . . . . . . . . . . . . . . . 8
2.3.2 Selection of a mass transfer model . . . . . . . . . . . . . . . . . . . . . . 8
3 Results and Discussion 9
3.1 Thermodynamic modelling of reactive fluid mixtures with SAFT-VR . . . . . . . 9
3.1.1 Ammonia based mixtures . . . . . . . . . . . . . . . . . . . . . . . . . . . 12
3.1.2 Monoethanolamine based mixtures . . . . . . . . . . . . . . . . . . . . . . 14
3.1.3 2-Amino-2-methyl-1-propanol based mixtures . . . . . . . . . . . . . . . . 17
3.1.4 Overview of incorporation of chemical reactions within the SAFT approach 19
3.2 Process modelling and validation . . . . . . . . . . . . . . . . . . . . . . . . . . . 19
3.2.1 Model development and validation . . . . . . . . . . . . . . . . . . . . . . 19
3.2.2 Initial solvent design study . . . . . . . . . . . . . . . . . . . . . . . . . . 21
4 Conclusions 22
5 Proposed work for a subsequent programme 23
3
Page 5
6 Publications arising from the project 23
Bibliography27
4
Page 6
2 Introduction
2.1 Background
Due to their energy density, proven resource base and established infrastructure for their ex-
ploitation and distribution, it is well accepted that energy derived from fossil fuels will continue
to play an important role in supplying the worlds energy [1]. At the same time, concerns sur-
rounding climate change due to anthropogenic emissions of CO2 have resulted in a number of
initiatives to reduce CO2 emissions [2]. So-called carbon capture and storage (CCS) technologies
are accepted as being a promising route to a near-term meaningful reduction in CO2 emissions.
The power generation sector is the largest stationary point source of CO2 emissions [3] and one
of most viable technologies for CO2 capture from power stations is post-combustion absorption
of CO2 with chemical solvents [4].
The current state-of-the-art technology is solvent scrubbing with amine based solvents [5]. How-
ever, this process is highly energy intensive, in particular it requires a significant amount of
energy for solvent regeneration [6]. Therefore, there exists a strong imperative to reduce the
energy penalty associated with CO2 capture [7]. In order to achieve these goals, the selection
and design of the solvent or solvent blend to be used is of upmost importance. Specifically, it
is desirable that the energy penalty associated with solvent regeneration be decreased, the rate
of reaction be increased and that the CO2 loading capacity can be increased [7]. Therefore, this
problem may be formulated as a solvent design problem, where proposed solvents and solvent
blends can be evaluated using appropriate performance indices. Process performance indices
help to quantify the overall solvent effect on the operation of the process. This leads to a tight
integration of process operation and solvent selection, and provides a rational basis for solvent
design [8].
Typically, in modelling systems with reactive separation, one either uses a sophisticated, compu-
tationally intensive methodology, such as in the work of Kucka et al. [9] or simplified enhancement
factor concepts, such as in the work of van Swaaij et al. [10]. However, enhancement factors are
exact only in a few special limiting cases, and typically approximations to describe more realistic
scenarios are employed [11,12]. Moreover both approaches rely on experimental data to provide
information on reaction kinetics and mass transfer. These data are unavailable in the context
of novel solvents. Finally, in solvent design problems, there exists the paradoxical requirement
to reduce as much as possible the computational complexity of the process model, while con-
currently retaining accuracy in model predictions in order that the results of any optimisation
5
Page 7
studies are as robust as possible [8].
In this project, we have developed a new methodology for the design and assessment of novel
solvent blends for fluid separation processes. Our approach is completely general and is equally
applicable to both physical and chemical based separation processes with no change in model
complexity, provided that the process is not kinetically limited. We use the statistical associating
fluid theory for potentials of variable range (SAFT-VR) [13, 14] both to account for the non-
idealities that are observed in aqueous mixtures of amines and also to represent the key reactions
that are present in this system, thereby simplifying the description of the chemical reactions at
the level of the process model. Thus, the only experimental data required for assessing solvent
blends are binary mixture vapour-liquid equilibria data, which are typically abundant, and are
relatively easy to measure if they are not available, as opposed to detailed information on the
kinetics and rate equations which are required in the usual approach. We propose that this
approach provides a suitable platform for the solution of solvent design problems for complex
and reacting fluid systems.
2.2 Chemistry and thermophysical property methods
The reactive nature of mixtures of amines in aqueous solution with CO2 is well known; there is a
large body of experimental and theoretical work in place detailing the mechanisms and rates of
these reactions [15–20]. Moreover, they have been presented several times in the literature, and
as such they will not be described in detail here. It suffices to say that the principle reactions
of interest are the formation of carbamate
Carbamate formation : CO2 + 2RNH2 � [RNHCO−2 +RNH
+3 ] (1)
and the subsequent reversion of carbamate to bicarbonate,
Carbamate reversion : RNHCO−2 +H2O� RNH2 +HCO−3 , (2)
where it can be seen that the overall stoichiometry of the reaction is such that each molecule of
CO2 is eventually associated with two amine molecules; the carbamate and protonated amine
can be considered as a tightly bound ion pair (denoted by the square brackets) particularly at
higher temperatures. In addition to these chemical reactions, there are also the ionic speciation
6
Page 8
equilibria of the CO2+H2O and aqueous amine mixtures to consider [21]. The chemical reac-
tions and ionic speciation that occur in these mixtures strongly influences the phase behaviour
of the system, and failure to adequately account for these interactions results in highly erro-
neous predictions [22–24]. Typically, in order to account for the non-idealities of this mixture a
quasichemical-based [25–28] lattice model of the liquid phase such as the electrolyte nonrandom
two liquid (eNRTL) model of Chen et al. [29, 30] (a modification of the NRTL model of Renon
and Prausnitz [31]) is used, as in the work of Kucka et al. [9]. However, lattice models are
inapplicable to the gas phase, and consequently, another theory must be used to describe its
phase behaviour. Often, cubic equations-of-state, like the Soave-Redlich-Kwong [32] equation
are used to describe the gas phase as in Kucka et al. [9], or sometimes the gas phase is treated
as ideal as in the work of Kvamsdal et al. [33] or Ziaii et al. [34].
Others, such as Gabrielsen et al. [35] and Aboudheir et al. [36] have developed their own cor-
relations using a Henry’s law type description of the phase behaviour, modified to incorporate
the effect of the reactions on the vapour pressure of each component. Some of these models
have been subsequently successfully incorporated in process models of CO2 absorption sys-
tems [37, 38]. These correlations are typically very simple in mathematical form, and are very
easy to use. However, their predictive ability is limited, and any attempt to use them outside
the region in which the correlation was developed can result in highly aphysical predictions.
The development and implementation of accurate process models requires extensive calculation
of the physical properties associated with the system. Thus, the ability to calculate and, more
importantly, accurately and reliably predict the phase behaviour and thermophysical properties
of complex, multicomponent systems is of paramount importance to developing robust process
models. In this way, accurate physical property predictions can be considered the raw materials
of optimal process design [39]. The implementation of a multistage nonequilibrium model in-
volves the repeated calculation of interfacial compositions (phase equilibria) and the enthalpies
of the bulk gas and liquid phases requiring the calculation of both pure component and mixture
enthalpies. As these quantities are themselves used again and again throughout the model in the
energy balance and rate equations, their accurate calculation is of vital importance to the accu-
racy of the the model as a whole. Further, many of the correlations used in typical engineering
design require the calculation of quantities such as liquid interfacial tension, enthalpy of vapori-
sation, heat capacity, gas and liquid densities. The ability to accurately calculate these quantities
in a predictive way with SAFT-VR will remove existing restrictions on exploring with confidence
the different operating regimes and also allow more confidence in solvent design activities. We
have used the SAFT-VR [13,14,40,41] equation of state (EOS) to calculate the thermodynamic
7
Page 9
properties and fluid phase equilibria of our system as it has previously been shown to model
complex associating and reactive mixtures successfully for a wide range of conditions.
2.3 Approaches to modelling reactive separation systems
2.3.1 Equilibrium vs. rate-based models
Most types of gas-liquid contactors can be considered as a cascade of segments or stages which
are related to one another through mass and energy balance equations [42]. In figure 14, different
model approaches representing different complexities concerning the description of mass transfer
and chemical reaction are presented. The simplest model is the classical equilibrium stage model
which assumes that the streams leaving a given stage are in equilibrium, with no reactions and
infinitely fast mass transport within the single stage [42]. As mass and heat transfer are rate
processes that are driven by gradients of chemical potential and temperature, equilibrium is
rarely attained and thus traditional “equilibrium stage models + efficiency factor” approaches
are inadequate for the description of chemisorption processes. In increasing the complexity of
the model, we can choose to include some details of the reaction kinetics while maintaining the
concept of the equilibrium stage [43].
For a model to be both rigorous and predictive, the effect of simultaneous heat and mass transfer,
the effect of chemical reactions and their coupled effects on the physical properties and phase
behaviour of the system must be included in the model. Mass transfer in multicomponent
mixtures is more complicated than in binary systems because of the possible coupling between
the individual concentration gradients. Phenomena such as reverse diffusion (diffusion of a
species against its own concentration gradient) or osmotic diffusion (diffusion of a species even
though no concentration gradient for that species exists) are possible in multicomponent systems
but not in binary mixtures. One of the interesting consequences of these interaction effects is
that the individual point efficiencies of different species are not constrained to lie between zero
and one. Instead, they may be found anywhere in the range from −∞ to +∞ [44]. It is not
possible to predict these phenomena with “equilibrium stage” models.
2.3.2 Selection of a mass transfer model
For reactive systems with a “fast” chemical reaction, i.e., where the process is not limited by
the reaction kinetics, the two-film model has been extensively used as the mass transfer model
8
Page 10
of choice almost since its inception by Lewis and Whitman in 1924 [45] and its subsequent
refinement by Hatta in 1932 [46]. See for example the journal papers of [33, 42, 44, 47–50] and
references therein for details. Also, it has been shown [51] that that the selection of the film
model can be justified on the basis of the value of Ha, the Hatta number [52, 53]. It has been
shown that systems characterised by a “rapid” chemical reaction, such as the absorption of acid
gases, where the chemical reaction can be considered to occur only in the liquid film, the liquid
holdup is not important and the rate of absorption will be large if the effective interfacial area
and the individual mass transfer coefficients and are large. This is called the physical kinetic
regime and is characterised by the condition:
Ha > 3 (3)
The Hatta, Ha, number may be defined as [54]:
Ha =Ni
NPhysi
(4)
This is the ratio of absorption with reaction, Ni, to that without reaction, NPhysi . Ha has
different functional forms depending on the nature of the reaction occurring (1st order 2nd etc).
As long as the condition in equation (3) is satisfied, the system will be well represented by the
two-film model.
3 Results and Discussion
This section is presented in three successive parts. First, some key results of the thermo-
dynamic modelling activities of this project are presented. This section is divided into three
distinct sections wherein the results of the work on NH3, MEA and AMP mixtures are presented.
Subsequently, the results of our process model development and validation work are presented.
Finally we present the results of our initial solvent design work.
3.1 Thermodynamic modelling of reactive fluid mixtures with SAFT-VR
In the SAFT-VR approach a molecule i is modelled as a homonuclear chain ofmii bonded square-
well segments of hard-core diameter σii. The square-well interactions are further characterised
9
Page 11
by a well depth εii and a range λii. In addition, a number of off-centre, square-well association
sites are used to mediate the association interactions. The sites are placed at a distance r∗d = 0.25
from the centre of a segment and the cut-off range between a site a on a segment i and a site
b on a segment j is denoted by r∗cab,ij = rcab,ij/σij . These two parameters define the volume
Kab,ij available for site-site bonding [55]. When two sites are within a distance of rc;ab,ij they
interact with a well depth εHBab,ij . The sites are commonly labelled as e or H, representing either
an electronegative atom (or its lone-pairs of electrons) or the hydrogen atoms in a molecule,
respectively; only e-H bonding is allowed. In all the models considered in this paper one e site
is allocated for each electron lone-pair and one H site for each hydrogen atom.
In order to model the mixtures, a number of unlike intermolecular potential parameters also need
to be specified. The arithmetic mean is used to obtain size-related intermolecular parameters,
so that the unlike contact diameter between two molecules i and j is given by
σij =σii + σjj2
, (5)
the unlike square-well range by
λij =λiiσii + λjjσjjσii + σjj
, (6)
and the unlike bonding volume by
Kab,ij =
[K1/3ab,ii +K
1/3ab,jj
2
]3
. (7)
These parameters are not readjusted at any point. The unlike dispersion and hydrogen bonding
energetic parameters are defined in terms of the geometric mean of the like interactions and a
correction factor, so that the unlike dispersion energy between two components i and j is given
by
εij = (1− kij)√εiiεjj , (8)
and the unlike hydrogen bonding energy between two sites a and b is given by
εHBab,ij = (1− kHBab,ij)
√εHBab,iiε
HBab,jj . (9)
10
Page 12
The adjustable parameters kij and kHBab,ij are determined by comparison to mixture experimental
data.
In reporting the performance of our models, we use the average absolute deviations AAD. For
the pure components, we use three descriptors of the quality of the fit: an overall percentage
AAD,
%AAD =100
NP +Nρ
{NP∑
i=1
∣∣∣∣∣
PExpv,i (Ti)− P
Calcv,i (Ti; θ)
PExpv,i (Ti)
∣∣∣∣∣+
Nρ∑
j=1
∣∣∣∣∣
ρExpl,j (Tj)− ρ
Calcl,j (Tj ; θ)
ρExpl,j (Tj)
∣∣∣∣∣
}
, (10)
and separate percentage AADs for vapour pressure and liquid density,
%AAD P =100
NP
NP∑
i=1
∣∣∣∣∣
PExpv,i (Ti)− P
Calcv,i (Ti; θ)
PExpv,i (Ti)
∣∣∣∣∣, (11)
%AAD ρl =100
Nρ
Nρ∑
i=1
∣∣∣∣∣
ρExpv,i (Ti)− ρ
Calcv,i (Ti; θ)
ρExpv,i (Ti)
∣∣∣∣∣. (12)
In the case of the mixtures, we report either the error in the calculated equilibrium pressure of
the mixture, at a given temperature and liquid composition given by
%AAD P =100
NP
NP∑
i=1
∣∣∣∣∣PExpi (T, xIi)− P
Calci (T, ρI, xIi; θ, φ)
PExpi (T, xIi)
∣∣∣∣∣, (13)
or the error in the calculated equilibrium temperature at given pressures and liquid compositions
%AAD T =100
NT
NT∑
i=1
∣∣∣∣∣TExpi (Pi, x
Ii)− T
Calci (Pi, ρ
I, xIi; θ, φ)
TExpi (Pi, xIi)
∣∣∣∣∣, (14)
and, if available, the error in the composition of the other equilibrium (vapour or liquid) phase
at each Ti or Pi and phase I composition. As mole fractions are constrained to be between zero
and one, an absolute measure of error is more appropriate,
AAD xII =1
Nx
Nx∑
i=1
∣∣∣xII,Expi − xII,Calci
∣∣∣ . (15)
11
Page 13
3.1.1 Ammonia based mixtures
Pure ammonia
Following the general scheme described in section 3.1, NH3 is modelled as a single spherical
segment. This is what one would expect as a model NH3 and the spatial density plots presented
by Thompson et al. [56] lend further credence to this view. The hydrogen bonding interactions
in NH3 are mediated by the inclusion of four off-centre association sites. A four-site model is
physically intuitive, and is consistent with the traditional physical chemistry molecular-orbital
view of ammonia and it is also consistent with the view of water for which there is abundant
simulation and experimental data, as presented by Clark et al. [57]. The four-site model is asym-
metric, with one e site to represent the lone pair of electrons on the nitrogen atom and three
H sites to represent the three hydrogen atoms. When modelling NH3, only e - H interactions
are permitted. A final model of NH3 is selected based on its ability to simultaneously correlate
vapour-liquid equilibria and predict the interfacial-tension, γ, and the enthalpy of vapourisa-
tion, ΔHfg of the NH3 molecule. As ΔHfg is a second derivative property of the Helmholtz
free energy, this constitutes a very severe test of our model. Further, this analysis of γ is help-
ful in establishing that we have the correct partitioning between the enthalpic and entropic
contributions to the free energy, as from
dAσ = −SdT σ − PdV σ + γdA+nc∑
i
μidni (16)
it can be seen that
(dAσ
dT
)
V σ ,A,ni
= −Sσ
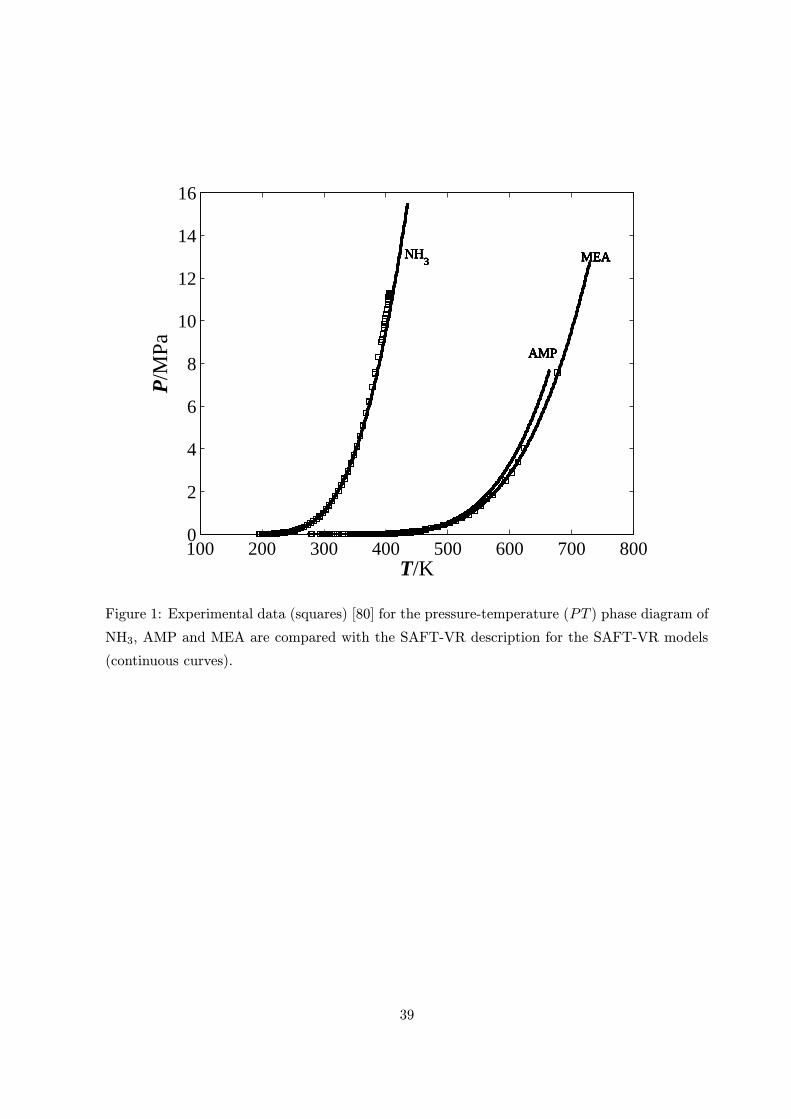
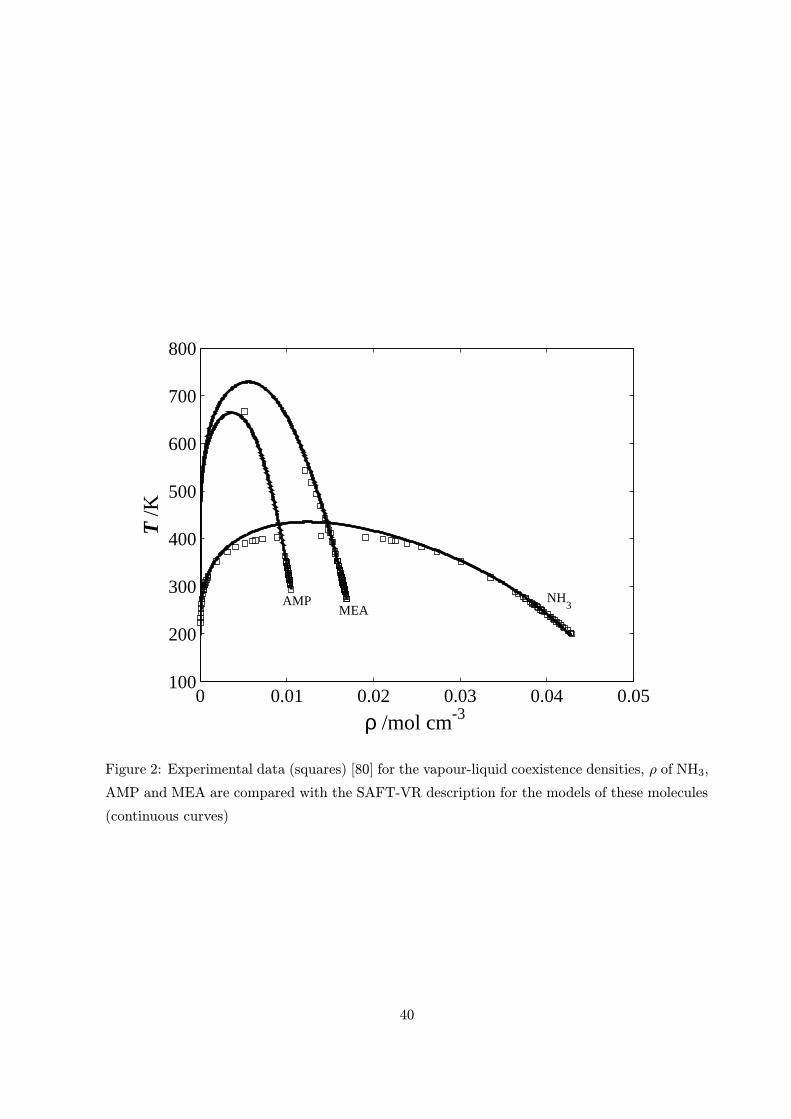
The results of this investigation are shown in figures 1, 2, 3a and 3b respectively. The AAD as
defined by equation (10) for the NH3 model was 1.48% in saturated vapour pressure and liquid
density. We consistently use this rationale to discriminate between molecular models for other
components considered in this work.
Aqueous ammonia mixtures
The modelling of binary mixtures of NH3 + H2O is interesting both from a practical and scientific
standpoint. The academic interest stems primarily from the fact that aqueous solutions of NH3
12
Page 14
significantly disassociate in water. In this work, we treat this dissociation without explicitly
treating the electrolytes, thus simplifying the model. In solutions with significant dissociation,
there will be significant deviation from Henrys law. This is significant as a failure to adequately
account for these interactions between NH3 adn H2O will result in a erroneous prediction of
vapour pressures [24]. From a more practical perspective, there has been a great deal of recent
interest in using NH3 as an alternative solvent with which to capture CO2. Obviously, before
NH3 can be deployed in practice, a detailed knowledge of the phase behaviour of aqueous NH3
mixtures and also the liquid phase behaviour of aqueous NH3 + CO2 mixtures is essential.
The NH3 + H2 mixture is a mixture of two associating fluids of similar molecular weight, it
is completely miscible and does not exhibit azeotropy. One would therefore expect the unlike
interactions in the system to be close to ideal. Consequently, the standard Lorentz-Berthelot
(LB) [58] combining rules should be an appropriate choice in this case. Unlike binary interaction
parameters were estimated by comparison with experimental data from the triple-point, Tt of
H2O to the critical point, Tc of NH3. This estimation was performed using the gPROMS software
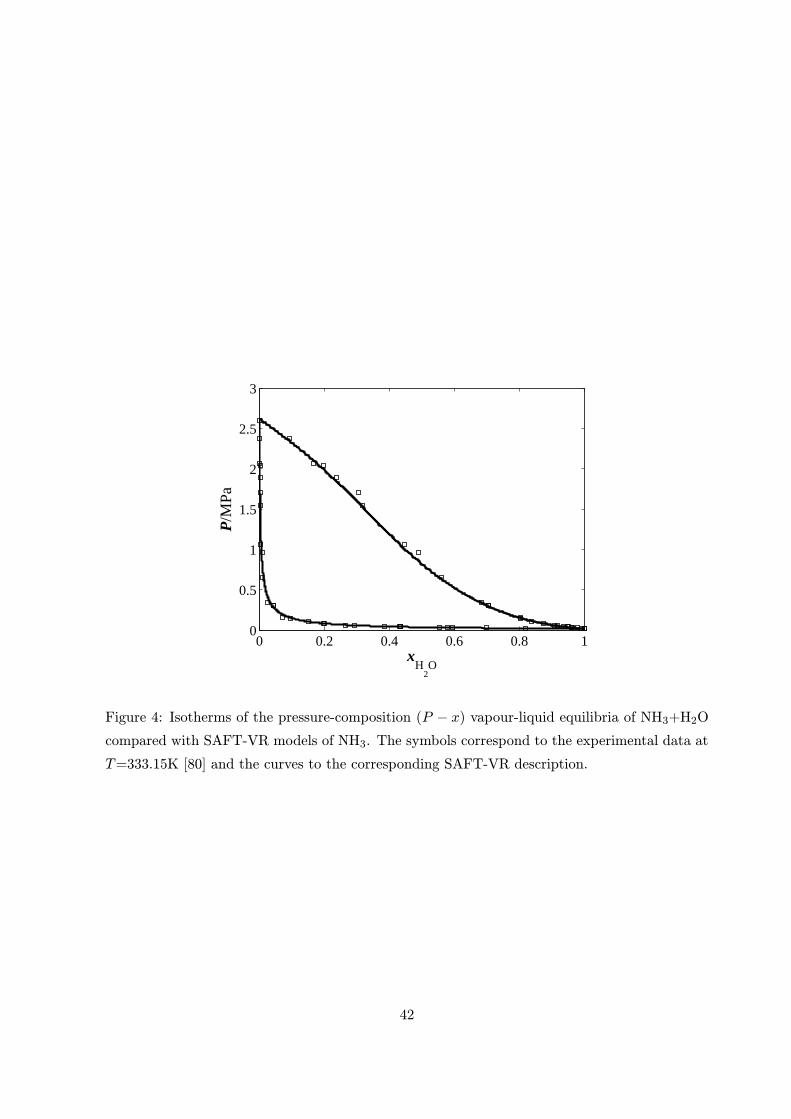
package [59]. A sample of graphical results are provided in figure 4. The accuracy of this model
as defined by equation (13) and (14) is 1.857% in temperature and pressure and 0.026 in mole
fraction as defined by equation (15). This mixture exhibits both positive and negative deviations
from Raoult’s law as well as extensive ionic speciation, and it is gratifying to see this feature
reproduced with our model.
Ammonia ternary mixtures
The immediate industrial relevance of this work is in the arena of amine based CO2 capture
from the flue gasses of fossil fuel fired power plants, so one obvious application of these results
is in the modelling, simulation and optimisation of such processes. Recently, there has been
a significant amount of industrial interest in NH3 based CO2 capture processes [60–63], and
accurate thermophysical models of this system are necessary for the development of accurate
and predictive process models. However, the complexity associated with modelling this mixture
is compounded by the fact that it is reactive, as opposed to simply associating. In modelling
the NH3+H2O+CO2 mixture, SAFT-VR intermolecular parameters describing the NH3+CO2
interactions were obtained using the experimental data presented by Goppert et al. [64].
Maurer [22] notes that if one is using a chemical-theory to calculate the phase equilibrium
of the reacting NH3+H2O+CO2 mixture, there are - in principle - 72 temperature dependent
binary interaction parameters which must be determined. It is unrealistic to assume that these
parameters can be determined by comparison with experimental VLE data, and as a result
13
Page 15
sensitivity analyses must be performed, and parameters of minor importance either estimated
or ignored. This further level of approximation in the approach inevitably reduces the accuracy
and predictivity of the models. In the SAFT approach, only five temperature-independent
binary-interaction parameters are required, and reliable values for these parameters can be
obtained by fitting to binary mixture VLE data. Of these, only two need be determined by
comparison to ternary VLE data. A sample of calculation results at conditions relevant to CCS
processes are presented in figures 5 and 6. We note that the unlike interaction parameters for the
NH3+CO2+H2O mixture were fitted to the data shown in figure 5, while the results presented
in figure 6 are predictions. Our simple, physical models predict the phase behaviour of this
complex mixture very accurately - the models developed for this mixture correlate and predict
the liquid phase CO2 loading to within 0.02.
3.1.2 Monoethanolamine based mixtures
In this section, a brief description of the development of a detailed SAFT-VR model of mo-
noethanolamine (MEA) is presented. In a recent publication [65], we describe in detail the
development of the SAFT-VR models of H2O, MEA and CO2, and readers are referred here and
to references therein for a complete description of the methods employed in the development of
SAFT-VR molecular models.
Pure monoethanolamine
Here we present a model of MEA that explicitly considers that the hydroxyl – hydroxyl interac-
tion, the amine – amine interaction, the hydroxyl electron lone-pair – amine hydrogen and the
hydroxyl hydrogen – amine electron lone-pair interactions all have different hydrogen bond en-
ergies. Inevitably, this increases the number of intermolecular parameters required to model the
multifunctional nature of MEA, but one can exploit the molecular nature of the SAFT theory
to reduce the number of intermolecular parameters that have to be determined by transferring
parameters from other molecules with the same functional groups: SAFT-VR models of ethanol
and ethylamine. In this way, we present a general methodology for the development of accurate,
predictive models of complex, multifunctional, associating molecules, and their mixtures with
other associating fluids.
The model of MEA is characterised by twelve parameters: mMEA, σMEA, εMEA, λMEA,
εHBeH,MEA, rc;eH,MEA, εHBe∗H∗,MEA, rc;e∗H∗,MEA, ε
HBeH∗,MEA, rc;eH∗,MEA, ε
HBe∗H,MEA and rc;e∗H,MEA,
which results in a parameter estimation problem of much higher dimensionality than is usual
14
Page 16
in SAFT-VR studies of associating systems. At this point, we take advantage of the physical
basis and transferability of parameters in SAFT (see for example the studies reported in ref-
erences [66, 67]) and propose to transfer the association parameters describing the interaction
between the hydroxyl groups of the MEA molecules (represented by the e−H site-site interac-
tion: εHBeH,MEA, rc;eH,MEA) from those obtained in a separate study for ethanol. Similarly, the
parameters related to the interaction between the amine groups of MEA (represented by the
e∗-H∗ site-site interaction: εHBe∗H∗,MEA, rc;e∗H∗,MEA) are determined from a separate study for
ethylamine. When these parameters for ethanol and ethylamine are transferred for the corre-
sponding interactions in MEA, the only association interactions that remain to be specified for
the MEA molecule are those for the cross amine-hydroxyl group association interactions. These
are represented by e∗-H and e-H∗ site-site interactions characterised by εHBe∗H,MEA, rc;e∗H,MEA,
εHBeH∗,MEA and rc;eH∗,MEA. To reduce further the number of parameters, we set the value of
the range of the association potential for the e-H∗ and e∗-H interactions to be the same such
that rc;eH∗,MEA=rc;e∗H,MEA. The %AAD (equation (10)) is not improved by using two different
values for rc;eH∗,MEA and rc;e∗H,MEA. The proposed procedure has allowed us to reduce the
number of parameters to six (σMEA, εMEA, λMEA, εHBeH∗,MEA, ε
HBe∗H,MEA and rc;eH∗,MEA), no
more than for other SAFT-VR models.
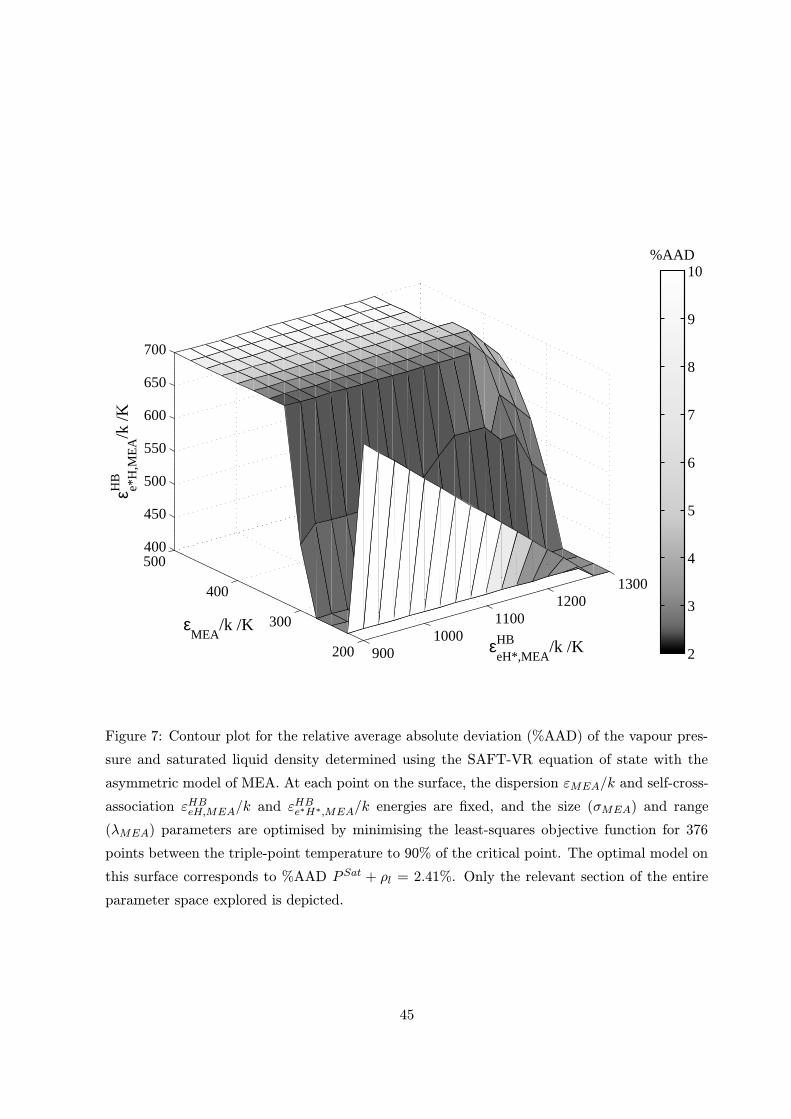
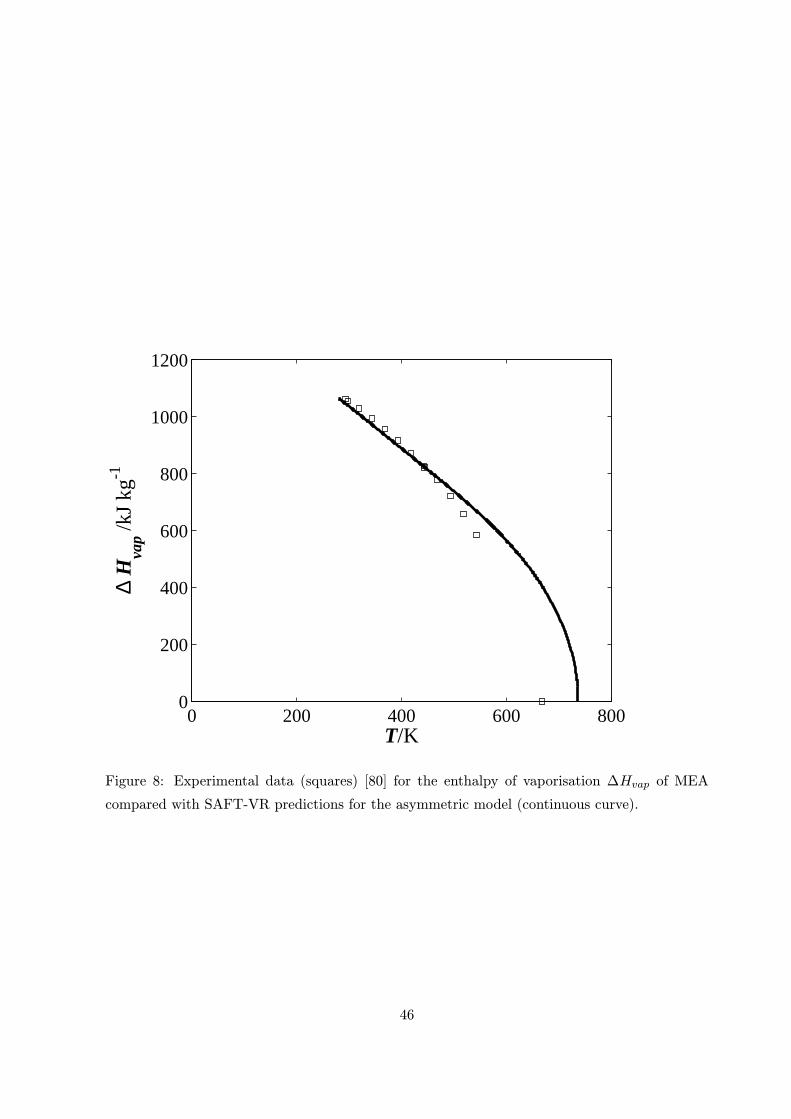
The performance of the final model of MEA can be seen in figures 1 and 2. The predictions
obtained for the enthalpy and the surface tension (figures 8 and 9) in particular are in excellent
agreement with the experimental data [68–71]. It is striking to see how the set of selected
molecular parameters is able to quantitatively predict the surface tension values over a wide
range of temperatures and pressures. The AAD as defined by equation (10) for the MEA model
was 2.41% in saturated vapour pressure and liquid density. These results give added confidence
in the adequacy of the model developed for the complex MEA molecule.
Aqueous MEA mixtures
A mixture of MEA and H2O modelled using the asymmetric model of MEA presented above
requires the determination of three adjustable unlike energy interaction parameters: the hy-
drogen bonding energy between water and the hydroxyl (εHBeH,MEA−H2O = εHBHe,MEA−H2O) and
amine (εHBe∗H,MEA−H2O = εHBH∗e,MEA−H2O) groups of MEA, and the unlike dispersion interactions
between MEA and water εMEA−H2O. In order to reduce the number of mixture parameters,
a transferable approach is proposed. The hydrogen-bonding interaction between the hydroxyl
group of MEA and water is transferred from that of a mixture of ethanol and water and, simi-
larly, the hydrogen-bonding interaction between the amine group and water is transferred from
15
Page 17
a study of ethylamine and water.
In figure 10, three isotherms of the vapour-liquid equilibrium for MEA+H2O at T= 298.15,
343.15, 364.15 K are presented; the adequacy of the description can be clearly seen from the
figure. The continuous lines represent calculations performed with the asymmetric model of
MEA and the dashed lines represent calculations performed with the symmetric model. The
accuracy of the models in describing the MEA+H2O mixture is %AAD=2.03% in temperature
and pressure and AAD=0.024 in vapour phase composition when using the asymmetric model
of MEA and %AAD=4.39% in temperature and pressure and AAD=0.008 in vapour phase
composition when using the symmetric model of MEA.
MEA ternary mixtures
Armed with the molecular models for pure component and binary mixtures developed in the
previous sections, we now come to a main goal of our work: the accurate representation of the
fluid phase behaviour of carbon dioxide in aqueous MEA. Numerous studies of the thermophys-
ical properties of the MEA+CO2+H2O mixture have been reported to date. There are also a
substantial number of correlations which describe the vapour-liquid equilibria of this system.
The majority of these expressions are however applicable only over a limited range of composi-
tions and/or temperature and pressure. Outside the recommended range, these expressions are
typically inapplicable and are therefore of limited use in the design and optimisation of novel
processes incorporating these components. One major advantage of the SAFT approach is that
the parameters used in the models are temperature and pressure independent and thus there
is in principle no region in the fluid range beyond description (with due caution taken in the
critical and near-critical regions). A caveat, however, in the context of the MEA+CO2+H2O
system, is that our models do not fully capture the various reaction mechanisms (we focus on
the formation of carbamate), so that use of the model far outside the region where the models
are developed may not be reliable (e.g., in the limit of low water concentration).
In modelling MEA + CO2 + H2O, we examine data over a temperature range from 298.15K to
373.15K, a pressure range from 0.001MPa to 10MPa, and a liquid phase CO2 concentration of
0.01 ≤ xCO2 ≤ 0.12 [72–74]. We have used the data at 313 K to estimate the MEA–CO2 associ-
ation energy εHBe∗α,MEA−CO2 using the gPROMS software package [59] assuming that εMEA−CO2
is given by the Berthelot rule, i.e., kMEA−CO2 = 0.0. Using these parameters we are able to
obtain and excellent description of the ternary system at these conditions and excellent quanti-
tative predictions of the ternary phase behaviour at 333 K and 335 K, with an AAD over the
three isotherms of 0.010 in liquid mole fraction of CO2, for MEA represented as the asymmetric
16
Page 18
model. This level of accuracy is in line with that presented in other contributions, for example
the recent work of Faramazi et al. [21]. We note that, unlike the many correlations that are
currently available, our model captures the behaviour of the data over the entire composition
range for which data is available.
The results of our SAFT-VR calculations for the phase equilibrium of MEA+CO2+H2O are
summarised in figure 11. As can be seen, a complex, non-linear behaviour is seen for the partial
pressure of CO2 of the coexisting gas phase as a function of the liquid phase CO2 mole fraction
(the latter is a direct measure of the extent of absorption of CO2 in the amine solvent). This
behaviour is due to a complex system of competing interactions, and it is very encouraging to
see this behaviour reproduced so accurately with our simple physical models of the chemical
association. From figure 11, one can also see that, though the various correlations can be used
to provide a good description of the absorption, their use is not appropriate over wide ranges
of conditions. Further, in figure 11a we compare the results of using both the symmetric and
asymmetric models of MEA to predict the phase behaviour of this mixture. It can be seen that
while the asymmetric model fully captures the complex fluid phase behaviour, the symmetric
model does not. This is because a fully symmetric model of MEAmisrepresents the stoichiometry
of the corresponding reactions of this system, and results in a vapour phase consisting almost
entirely of water. Finally, we have found that the inclusion of nitrogen (an essentially inert gas,
chemically speaking) in our SAFT-VR description does not modify the phase behaviour of the
liquid phase appreciably. This accurate representation of the fluid phase behaviour of MEA
+ CO2 + H2O (+N2) within our SAFT-VR platform is of paramount importance for use in a
detailed description of the CO2 capture process. Again, our models predict the phase behaviour
of this complex mixture very accurately - the models developed for this mixture correlate and
predict the liquid phase CO2 mole fraction with an accuracy of 0.0165 of CO2 mole fraction in
the liquid phase.
3.1.3 2-Amino-2-methyl-1-propanol based mixtures
Following the results of our study of MEA, we proceed to build models of 2-amino-2-methyl-1-
propanol (AMP). Apart from MEA, AMP is one of the most studied alkanolamine alternatives
for CO2 capture. This is because it is the sterically hindered form of MEA, and therefore
differences between the properties of AMP and MEA can unambiguously be ascribed to steric
effects. Given the results of the MEA work, we have a clear direction as to how to model AMP.
17
Page 19
Pure AMP
A detailed model of AMP has been developed, preserving the molecular detail of the molecule
by once again considering an asymmetric model of this compound. In order to reduce model
complexity, all association parameters required to describe AMP are transferred from the MEA
model. This is a reasonable decision, as both molecules are primary alkanolamines, and this is
consistent to group contribution approaches. Thus, AMP is modelled as having an aspect ratio
of 2.29, with the same association scheme as MEA. Again, results of the models developed for
AMP are presented in figures 1 and 2. The AAD as defined by equation (10) for the AMP model
was 0.29% in saturated vapour pressure and liquid density.
Aqueous AMP mixtures
Again, following the MEA mixture modelling, we transfer binary interaction parameters de-
scribing the unlike interactions between AMP and H2O from the work on MEA. In this case,
an excellent description of the binary vapour-liquid equilibria is obtained without adjusting any
binary interaction parameters. The accuracy of this model as defined by equation (13) and (14)
is 0.42% in temperature and pressure and 0.006 in mole fraction as defined by equation (15).
The transferable nature of the parameters developed to describe these complex mixtures is a
testament to the adequacy of our models and the rigourous physical basis of the SAFT approach.
Results of this work are provided in figure 12.
AMP ternary mixtures
Once again, it is necessary to develop models of AMP+CO2+H2O.We do this in a similar manner
to the MEA work. Results are presented in figure 13. We note that this is a prediction, with the
unlike interaction parameters describing the AMP+CO2 interactions having been obtained from
a separate data set at T = 313.15K. This is a highly complex system, with numerous compenting
interactions, and a high accuracy is achieved with relatively simple physical interpretations of
these interactions that nevertheless account for the complex, non-linear behaviour of this system.
Again, our models predict the phase behaviour of this complex mixture very accurately - the
models developed for this mixture correlate and predict the liquid phase CO2 mole fraction with
an accuracy of 0.02 of CO2 mole fraction in the liquid phase.
18
Page 20
3.1.4 Overview of incorporation of chemical reactions within the SAFT approach
We incorporate a description of the many interactions between the fluid components at the level
of the thermodynamic model, using the SAFT formalism to simultaneously mediate the effect
of the physical and chemical interactions in the fluid. This approach facilitates a consistent,
physically based description of the numerous, competing interactions in both the gas and liquid
phases, giving full consideration to all aspects of the non-ideality of this mixture. Moreover,
the SAFT approach allows implicit consideration of reaction products, i.e., when compounds
A and B react to form a product C, the product is described in the SAFT-VR model as an
A-B dimer, possessed of thermophysical properties which are defined by the unlike interaction
parameters of components A and B. This both simplifies the mass and energy balance equations
in the process model (i.e., there are no generation terms in these balance equations), and also
removes the requirement for an explicit description of the properties of the reaction products.
Finally, because reactions are incorporated in the physical description of the fluid, we no longer
need to use enhancement factor concepts to describe the effects of chemical reaction on the
process behaviour. We are therefore no longer constrained by the availability of experimental
data on the rate equations in reacting systems. This constitutes a major advantage in modelling
systems comprising novel solvents where these experimental data are not available. A caveat to
this approach is that it may not be appropriate in systems which are not limited by the kinetics
of the chemical reaction occurring.
3.2 Process modelling and validation
3.2.1 Model development and validation
The model described in this section has been implemented using the commercial software package
gPROMS [59] using a SAFT-VR Foreign Object [75].
Reactive separation processes are highly studied, but some significant challenges remain in de-
veloping predictive models of these processes. Principally, conventional models developed for
these processes require a large amount of experimental data to describe the effects of both the
physical interactions and chemical reactions on process behaviour. Further, so-called enhance-
ment factors are typically used to describe the accelerating effect of the reactions on the mass
transfer. However, these expressions are theoretically exact only in a few limiting cases, and
typically simplifications or approximations are used in practice. Moreover, enhancement factor
19
Page 21
expressions themselves require a lot of experimental information pertaining to the rate equations
and reaction kinetics associated with the system at hand. All this conspires to make predictive
modelling and solvent design difficult.
The SAFT-based approach which we have employed in our work significantly simplifies the
modelling of mass-transfer limited reactive separation systems. In our model, reaction products
are implicitly considered in the thermodynamic model of the fluid, as opposed to explicitly at the
level of the process model. This means less physicochemical properties are required to describe
the process behaviour. Moreover, there are fewer component balances required, and there are
no generation terms in the mass or energy balance equations. Finally, because of this, there is
no enhancement factor required to describe the effect of the reaction.
In order for us to have confidence in the predictions of our model, we must ensure that it predicts
accurately temperature and composition profiles along the length of the column, rather than
simply the conditions at the outlet of the column [76]. Therefore, we validate the predictions of
both our absorber and desorber models using published pilot plant data. To test the robustness
of the assumption of reaction equilibrium, we assess the adequacy of our model against both
MEA and AMP solvents, i.e., solvents which are considered to have both ‘fast” and “slow”
kinetics. Finally, we note that no adjustable parameters are used in the process model. The
results presented in this section are predictions.
For the absorber model presented in this paper, the required input to the model, in addition
to the column geometry and packing characteristics, the inlet gas phase pressure, temperature,
flowrate and composition and the inlet liquid temperature, flowrate and composition. The
validation of the proposed absorber model is performed by comparison of the model predictions
with experimental data presented by Tontiwachwuthikul et al. [49] for the data presented for
runs T22 and T26. The results presented in figure 17 were obtained using an MEA solvent and
those results presented in figure 17 were obtained using an AMP based solvent solution. The
results of these investigations are shown in figures 16 - 17. These data were chosen as they have
previously been independently reproduced by other workers [9,37]. Good agreement is observed
between the measured and simulated column profiles, particularly in light of the simplicity of
the proposed model. The accuracy of the predictions of our absorber model are in line with
other contributions in the literature. We emphasise the fact that no enhancement factors were
used in this work, nor were any kinetic data (rate constants, reaction enthalpies etc) required.
Moreover, no retuning of model parameters or correlations was required in switching between
MEA and AMP solvents. On this basis, we consider that we have provided rigorous validation
20
Page 22
of our assumptions, and that our model is robust. Consequently, we propose that this model
is a suitable initial point for the construction of a platform for the solution of solvent design
problems in reactive separation systems.
In the case of the desorber model, in addition to the column geometry and packing character-
istics, the required inputs are the inlet liquid flowrate, temperature, pressure and composition.
The inlet steam flowrate and pressure are assigned in the model, and may be used to either
provide a given amount of energy to the system, or achieve a given temperature in the reboiler.
Finally, the cooling water flowrate, inlet temperature and permissible temperature rise are as-
signed in order to specify a desired condensate temperature or a given condenser duty. The
validation of the proposed desorber model is performed by comparison of the model predictions
of the liquid phase temperature profile with experimental data presented by Tobiesen et al. [77].
The predicted liquid phase temperature profiles in the desorber column are in reasonably good
agreement with the experimental data and show the same linear temperature profile as the
temperature profiles presented by Tobiesen et al. [77]. Some results for this process presented
in figure 18. In order to validate the energetic aspects of our desorber model, we compare the
reboiler duty and the extent of solvent regeneration obtained by supplying steam to the reboiler
in order to obtain a desired reboiler temperature. In order to obtain the experimental reboiler
temperature set point of 119.5oC, the model required that 10.5kW of energy be supplied which
achieved a lean loading of 0.25 moles of CO2 per mole of amine. These results compare well
with the reported values of 9.6kW to obtain a lean loading of 0.24 moles of CO2 per mole of
amine. It is noted that due to the elevated temperatures at which the solvent regeneration
process operates, the assumption of reaction equilibrium is well accepted here. On this basis,
we consider the desorption process to be adequately validated and that we now have a suitable
platform for carrying out process performance indexed solvent design studies.
3.2.2 Initial solvent design study
Solvent blends, particularly those including sterically hindered compounds, are considered to be
an attractive approach to developing solvents for CO2 capture. Recently, blends of AMP (a slow
amine) and NH3 have been shown to be particularly promising when compared to a standard
30wt% MEA solvent [78,79]. Specifically, this blend was presented as having reaction kinetics as
fast as an MEA solvent, but with a significantly superior capacity for absorbing CO2. A 30wt%
AMP + 5wt% NH3 blend, denoted 30:5, has been suggested as promising. Our objective is to
use the proposed model to identify an improved blend. To this end, we formulate an objective
21
Page 23
function as follows:
fObj = AyCO2 +ByRNH2 + LCp (17)
where A, B are weights, with A=6,000 and B=8,500; yCO2 is the outlet mole fraction of CO2
in the flue gas, yRNH2 is the total outlet mole fraction of amine in the flue gas (i.e., the sum
of the mole fractions of AMP and NH3); L is the flow rate of the rich solvent stream leaving
the absorption column in units of kmol/s; Cp is the heat capacity of that stream in units of
kJ/kmol.K. The first term is related to the emission of CO2 to the atmosphere, the second to
the emission of amine, and the third to the regeneration cost expressed in terms of the total
heat capacity of the rich solvent stream. A solvent design problem has been solved on the basis
of the proposed objective function using the inlet temperature, T , and composition, xNH3 and
xAMP of the lean solvent stream and the flowrate L as design variables. The constraints include
a minimum water content of 50wt% for the lean solvent, to avoid corrosion problems due to the
presence of AMP. The results of the optimisation are compared to the best performance that
can be achieved with the 30:5 blend, and are presented in figure 19. The optimal solvent blend
has an increased AMP content and a decreased NH3 content, a greater solvent flow rate, and a
reduced inlet temperature. Its performance in terms of separation effectiveness is similar to that
of MEA: the mole fraction of CO2 in the flue gas (yCO2) is 0.004 for MEA and 0.009 with the
optimal blend. Given these promising results, a more realistic objective function must now be
developed, to account in more detail for the compromise between absorption effectiveness and
regeneration cost and to incorporate additional costs such as cooling the solvent to the desired
inlet temperature.
4 Conclusions
In this project, we have developed detailed molecular thermodynamic models for a range of
compounds of relevance to CO2 capture applications from coal-fired power-stations. These
thermodynamic models have been incorporated in a rigorous process model of a CO2 capture
process, whose performance has been validated using published pilot plant data for a range
of solvents and operating conditions. Finally, some preliminary solvent design work has been
completed, with blends of AMP and NH3 having been identified as promising solvents for CO2
capture. A significant part of this work has been the development of a novel approach for
22
Page 24
modelling reactive separation processes, which makes the solution of solvent design problems for
theses systems much more tractable.
5 Proposed work for a subsequent programme
The models developed in this project have accurately accounted for fluid phase reactions in the
case where there was only one reaction to consider, i.e., that between the amine and the CO2.
However, in real operations, it is possible that there will be multiple acidic components in a flue
gas, e.g., H2S and/or SOx. It would be of interest to investigate the suitability of the techniques
developed in this work to date to dealing with processes involving multiple, parallel reactions.
Further, an area which is now ready for investigation is detailed solvent design activities, using
a performance index linked to the performance of the entire CO2 capture process. It is possi-
ble to identify solvent blends that minimise energy consumption or other objective functions.
Additional research could also lead to the computer-aided design of novel solvent molecules.
However, one property which is currently beyond the reach of our models is the susceptibility
of amines to oxidative and other degradation. It is suggested that any rational solvent design
procedure should accurately account for this phenomenon. It would therefore be of interest to
develop a detailed, mechanistic understanding of the processes leading to solvent degradation,
and incorporate this in future, process performance indexed solvent design activities.
6 Publications arising from the project
The following conference presentations and journal papers have been produced as a result of the
work done in this project.
Journal articles:
N. Mac Dowell, F. Llovell, C. S. Adjiman, G. Jackson, A. Galindo “Modelling the phase be-
haviour of the CO2 + H2O + MEA mixture using transferable parameters with the SAFT-VR
approach”, Accepted, Industrial and Engineering Chemistry Research, 2009
23
Page 25
N. Mac Dowell, F. Llovell, A. Galindo, C. S. Adjiman, G. Jackson “Modelling the phase be-
haviour of CO2 +H2O + RNH2 mixtures with the SAFT-VR approach: a platform for solvent
design”, To be submitted to Journal of Physical Chemistry B
F. Llovell, N. Mac Dowell, A. Galindo, F. Blas, G. Jackson “Study and prediction of interfacial
properties of complex binary mixtures by means of a density functional theory based on the
SAFT-VR equation of state”, To be submitted to Fluid Phase Equilibria
N. Mac Dowell, A. Galindo, C. S. Adjiman, G. Jackson “Modelling and design of MEA-based
CO2 capture processes: Combining advanced thermodynamics and rate-based models”, To be
submitted to Chemical Engineering Science
N. Mac Dowell, A. Galindo, C. S. Adjiman, G. Jackson “Modelling and design of AMP-based
CO2 capture processes: Combining advanced thermodynamics and rate-based models”, For sub-
mission to Energy and Fuels, In preparation
N. Mac Dowell, A. Galindo, C. S. Adjiman, G. Jackson “An integrated process and solvent
design platform for CO2 capture from low pressure gas”, For submission to AIChE Journal, In
preparation
N. Mac Dowell, F. Llovell, A. Galindo, C. S. Adjiman, G. Jackson “On the modelling of multi-
functional molecules using transferable parameters with the SAFT-VR approach”, For submis-
sion to Fluid Phase Equilibria, In preparation
N. Mac Dowell, A. Galindo, C. S. Adjiman, G. Jackson, Buchard, A. P, Williams, C., Hallett,
J., Welton, T. and P. Fennell, “An overview of carbon capture technologies: State of the art
and future perspectives”, To be submitted to Energy and Environmental Science
Conference presentations:
N. Mac Dowell, C. S. Adjiman, A. Galindo, G. Jackson,“Towards integrated solvent and process
24
Page 26
design in amine-based processes for post-combustion CO2 capture” (talk), The International
Conference on Coal Science and Technology (ICCST), 28th - 31st August 2007, Nottingham
University, Nottingham, UK
N. Mac Dowell, C. S. Adjiman, A. Galindo, G. Jackson,“Thermodynamic modelling of amine
solvents” (poster), Thermodynamics 2007, 26th-28th September 2007, IFP, Rueil-Malmaison,
Paris, France
N. Mac Dowell, C. S. Adjiman, A. Galindo, G. Jackson,“Improvements in amine flue gas scrub-
bing systems for coal fired power stations” (talk), British Coal Utilisation Research Association,
Coal Research Forum (BCURA CRF) 4th June, 2008, Imperial College London, London, UK
N. Mac Dowell, C. S. Adjiman, A. Galindo, G. Jackson,“Modelling CO2 capture in amine sol-
vents with an advanced association model: Process optimisation and a platform for solvent
design” (talk), American Institute for Chemical Engineers (AIChE) 2008 Annual meeting, 16th-
21st November 2008, Philadelphia, USA
N. Mac Dowell, C. S. Adjiman, A. Galindo, G. Jackson,“Amine flue gas scrubbing systems:
Integrating advanced thermodynamic modelling with sophisticated process simulation - an opti-
misation platform” (poster), UK Carbon Capture and Storage Consortium (UKCCSC) meeting,
24th November 2008, IMechE, London, UK
N. Mac Dowell, C. S. Adjiman, A. Galindo, G. Jackson,“Advanced thermodynamic and process
modelling: Integration for amine scrubbing in post-combustion CO2 capture” (poster), Impe-
rial/Nature virtual conference on Climate Change and CO2 Storage, Dec. 3, 2008, Available
from Nature Precedings http://dx.doi.org/10.1038/npre.2008.2638.1 (2008)
N. Mac Dowell, C. S. Adjiman, A. Galindo, G. Jackson,“Model based optimisation of a mul-
ticomponent chemisorption process for CO2 capture: A solvent design platform” (talk), The
5th Trondheim Conference on CO2 Capture, Transport and Storage, 16-17 June, 2009, NTNU,
Trondheim, Norway
25
Page 27
N. Mac Dowell, F. Llovell, C. S. Adjiman, A. Galindo, G. Jackson,“Transferable association
models of amine + CO2 + H2O mixtures using the SAFT-VR approach” (poster), Thermody-
namics 2009, 23-25th September 2009, Imperial College London, London, UK
F. Llovell, N. Mac Dowell, G. Jackson, A. Galindo, F. J. Blas “Development of an accurate
SAFT-VR-DFT equation of state for the prediction of interfacial properties of complex mix-
tures” (short talk + poster), Thermodynamics 2009, 23-25th September 2009, Imperial College
London, London, UK
F. Llovell, N. Mac Dowell, G. Jackson, A. Galindo, F. J. Blas “A DFT formalism combined
with the SAFT-VR equation of state for the prediction of interfacial phenomena” (poster), XVI
Congreso de F́ısica Estad́ıstica, Huelva, Spain, 10th- 12th September 2009
N. Mac Dowell, C. S. Adjiman, A. Galindo, G. Jackson,“Modelling and design of MEA-based
CO2 capture processes: Combining advanced thermodynamics and rate-based models” (talk),
American Institute for Chemical Engineers (AIChE) 2009 Annual meeting, 8th- 13th November
2009, Nashville, USA
N. Mac Dowell, C. S. Adjiman, A. Galindo, G. Jackson,“An integrated process and solvent de-
sign platform for CO2 capture from low pressure gas” (talk), American Institute for Chemical
Engineers (AIChE) 2009 Annual meeting, 8th- 13th November 2009, Nashville, USA
N. Mac Dowell, C. S. Adjiman, A. Galindo, G. Jackson,“Modelling the phase behaviour of the
CO2 + H2O + Amine mixtures using transferable parameters with SAFT-VR” (talk), Ameri-
can Institute for Chemical Engineers (AIChE) 2009 Annual meeting, 8th- 13th November 2009,
Nashville, USA
N. Mac Dowell, A. Galindo, G. Jackson, C. S. Adjiman,“Integrated solvent and process design
for the reactive separation of CO2 from flue gases” (talk), ESCAPE-20, European Symposium
on Computer Aided Process Engineering, 6th-9th June, 2010, Naples, Italy
26
Page 28
N. Mac Dowell, A. Galindo, G. Jackson, C. S. Adjiman,“The integrated design of solvent blends
and separation processes for CO2 capture from flue gases” (talk), PPEPPD-12, Properties and
Phase Equilibria for Product and Process Design, May 16th - 21st, 2010, Suzhou, Jiangsu, China
F. Llovell, N. Mac Dowell, G. Jackson, A. Galindo, F. J. Blas “Fundamentals, development
and application of DFT theories to a SAFT-type equation of state for the prediction of interfa-
cial phenomena in complex mixtures” (talk), PPEPPD-12, Properties and Phase Equilibria for
Product and Process Design, May 16th - 21st, 2010, Suzhou, Jiangsu, China
27
Page 29
References
[1] Meeting the energy challenge A white paper on energy. Technical report, Department of
Trade and Industry, May 2007. www.berr.gov.uk/files/file39387.pdf.
[2] IPPC. Intergovernmental panel on climate change, third assessment report. Technical re-
port, IPCC, 2001.
[3] B. Metz, O. Davidson, H. C. de Coninck, M. Loos, and L. A. Meyer. IPCC, 2006: IPCC
Special Report of Carbon Dioxide Capture and Storage. Prepared by Working Group
III of the Intergovernmental Panel on Climate Change. Cambridge University Press,
Cambridge, United Kingdom and New York, NY, USA, 2005.
[4] J. H. St Clair and W. F. Simister. Process to recover CO2 from flus gas gets first large scale
tryout in Texas. Oil Gas J., 6:109–113, 1983.
[5] A. B. Rao and E. S. Rubin. A technical, economic and enviromental assessment of amine-
based CO2 capture technology for power plant greenhouse gas control. Environ. Sci.
Technol., 36(20):4467–4475, 2002.
[6] G. Astarita, D. W. Savage, and A. Biso. Gas Treating With Chemical Solvents. John Wiley
and Sons, New York, 1983.
[7] A. M. Wolsky, E. J. Daniels, and B. J. Jody. CO2 capture from the flue gas of conventional
fossil fuel fired power plants. Environ. Prog., 13:214–219, 1994.
[8] A. Giovanoglou, J. Barlatier, C. S. Adjiman, E. N. Pistokopoulos, and J. L. Cordiner.
Optimal solvent design for batch separation based on economic performance. AIChE J.,
49(12):3095–3109, 2003.
[9] L. Kucka, I. Muller, E. Y. Kenig, and A. Gorak. On the modelling and simulation of sour
gas absorption by aqueous amine solutions. Chem. Eng. Sci., 58(16):3571–3578, 2003.
[10] W. P. M. van Swaaij and G. F. Versteeg. Mass transfer accompanied with complex reversible
chemical reactions in gas-liquid systems: An overview. Chem. Eng. Sci., 47(13–14):3181–
3195, 1992.
[11] W. J. DeCoursey. Enhancement factors for gas absorption with reversible reaction. Chem.
Eng. Sci., 37(10):1483–1489, 1982.
[12] W. J. DeCoursey and R. W. Thring. Effects of unequal diffusivities on enhancement factors
for reversible and irreversible reaction. Chem. Eng. Sci., 44(8):1715–1721, 1989.
[13] A. Gil-Villegas, A. Galindo, P.J. Whitehead, S.J. Mills, and G Jackson. Statistical asso-
ciating fluid theory for chain molecules with attractive potentials of variable range. J.
28
Page 30
Chem. Phys., 106(10), 1997.
[14] A. Galindo, L.A. Davies, Gil-Villegas, and G. Jackson. The thermodynamics of mixtures
and the corresponding mixing rules in the SAFT-VR approach for potentials of variable
range. Mol. Phys., 93(2):241–252, 1998.
[15] G. Astarita. Mass Transfer With Chemical Reaction. Elsevier, London, 1967.
[16] H. Hikita, S. Asai, H. Ishikawa, and M. Honda. The kinetics of reactions of carbon diox-
ide with monoethanolamine, diethanolamine and triethanolamine by a rapid mixing
method. Chem. Eng. J., 13(1):7–12, 1977.
[17] P. V. Danckwerts. The reaction of CO2 with ethanolamines. Chem. Eng. Sci., 34(4):443–
446, 1979.
[18] S. S. Laddha and P. V. Danckwerts. Reaction of CO2 with ethanolamines: kinetics from
gas-absorption. Chem. Eng. Sci., 3(36):479–482, 1981.
[19] D.E. Penny and T.J. Ritter. Kinetic study of the reactions between carbon dioxide and
primary amines. J. Chem. Soc., Faraday Trans. I., 79:2103–2109, 1983.
[20] P.M.M. Blauwhoff, G.F. Versteeg, and W.P.M. van Swaaij. A study on the reaction between
CO2 and alkanolamines in aqueous solutions. Chem. Eng. Sci., 39(2):207–225, 1984.
[21] L. Faramarzi, G. M. Kontogeorgis, K. Thomsen, and E. H. Stenby. Extended UNIQUAC
model for thermodynamic modelling of CO2 absorption in aqueous alkanolamine solu-
tions. Fluid Phase Equilib., 282:121–132, 2009.
[22] G. Maurer. Phase equilibria in chemically reactive systems. Fluid Phase Equilib, 30:337–352,
1986.
[23] G. Maurer. Phase equilibria in chemical reactive fluid mixtures. Fluid Phase Equilib, 116:39–
51, 1996.
[24] J.M. Prausnitz, R.N. Lichtenthaler, and E.G. de Azevedo. Molecular thermodynamics of
fluid phase equilibria. Prentice Hall, 1999.
[25] E. A. Guggenheim. The statistical mechanics of regular solutions. Proc. R. Soc. Lond.,
Series A, 148(864):304–312, 1935.
[26] E. A. Guggenheim. The statistical mechanics of co-operative assemblies. Proc. R. Soc. Lond.
A, 169(936):134–148, 1938.
[27] G. S. Rushbrooke. A note on Guggenheim’s theory of strictly regular binary liquid mixtures.
Proc. R. Soc. Lond. A, 166(925):296–315, 1938.
29
Page 31
[28] E. A. Guggenheim. Mixtures. Clarendon Press, Oxford, 1952.
[29] C. C. Chen, H. I. Britt, J. F. Boston, and L. B. Evans. Local composition model for excess
Gibbs energy of electrolyte systems. Part I: Single solvent, single completely dissociated
electrolyte systems. AIChE J., 28(3):588–596, 1982.
[30] C. C. Chen and L. B. Evans. A local composition model for the excess Gibbs energy of
aqueous electrolyte systems. AIChE J., 32(3):444–454, 1986.
[31] H. Renon and J. M. Prausnitz. Local compositions in thermodynamic excess functions for
liquid mixtures. AIChE J., 14(1):135–144, 1968.
[32] G. Soave. Equilibrium constants from a modified Redlich-Kwong equation of state. Chemical
Engineering Science, 1972.
[33] H. M. Kvamsdal, J. P. Jakobsen, and K. A. Hoff. Dynamic modelling and simulation of a
CO2 absorber column for post-combustion CO2 capture. Chem. Eng. Proc., 48(1):135–
144, 2009.
[34] S. Ziaii, G. T. Rochelle, and T. F. Edgar. Dynamic modeling to minimize energy use for
CO2 capture in power plants by aqueous monoethanolamine. Ind. Eng. Chem. Res.,
48(13):6105–6111, 2009.
[35] J. Gabrielsen, M. L. Michelsen, E. H. Stenby, and G. M. Kontogeorgis. A model for esti-
mating CO2 solubility in aqueous alkanolamines. Ind. Eng. Chem. Res., 44:3348–3354,
2005.
[36] A. Aboudheir, P. Tontiwachwuthikul, A. Chakama, and R. Idem. Kinetics of the reactive ab-
sorption of carbon dioxide in high CO2 loaded concentrated aqueous monoethanolamine
solutions. Chem. Eng. Sci., 58:5195–5210, 2003.
[37] J. Gabrielsen, M. L. Michelsen, E. H. Stenby, and G. M. Kontogeorgis. Modeling of CO2
absorber using an AMP solution. AIChE J., 52(10):3443–3451, 2006.
[38] D. deMontigny, A. Aboudheir, and P. Tontiwachwuthikul. Modelling the performance of a
CO2 absorber containing structured packing. Ind. Eng. Chem. Res., 45(8):2594–2600,
2006.
[39] R. Dohrn and O. Pfohl. Thermophysical properties - Industrial directions. Fluid Phase
Equilib., 194–197:15–29, 2002.
[40] P. Paricaud, A. Galindo, and G. Jackson. Recent advances in the use of the SAFT ap-
proach in describing electrolytes, interfaces, liquid crystals and polymers. Fluid Phase
Equilibria, 194–197:87–96, 2002.
30
Page 32
[41] S. P. Tan, H. Adidharma, and M. Radosz. Recent advances and applications of statistical
associating fluid theory. Ind. Eng. Chem. Res., 47(21):8063–8082, 2008.
[42] R. Taylor and R. Krishna. Multicomponent Mass Transfer. Wiley, 1993.
[43] E. Y Kenig, R. Schneider, and A Gorak. Reactive absorption: Optimal process design via
optimal modelling. Chem. Eng. Sci., 56(2):343–350, 2001.
[44] R. Krishnamurthy and R. Taylor. A nonequilibrium stage model of multicomponent separa-
tion processes, Part I: Model description and method of solution. AIChE J., 31(3):449–
456, 1985.
[45] W. K. Lewis and W. G. Whitman. Principles of gas absorption. Ind. Eng. Chem.,
16(12):1215–1220, 1924.
[46] S. Hatta. On the absorption velocity of gases by liquids. Technical Reports from Tohoku
Imperial University, 10:119–135, 1932.
[47] R. E. Treybal. Adiabatic gas absorption and stripping in packed towers. Ind. Eng. Chem.,
61(7):36–41, 1969.
[48] J. D. Pandya. Adiabatic gas absorption and stripping with chemical reaction in packed
towers. Chem. Eng. Commun., 19:343–361, 1982.
[49] P. Tontiwachwuthikul, A. Meisen, and Lim C. J. CO2 absorption by NaOH, mo-
noethanolamine and 2-amino-2-methyl-1-propanol solutions in a packed column. Chem.
Eng. Sci., 47(2):381–390, 1992.
[50] E.Y. Kenig, R. Schneider, and A. Gorak. Rigorous dynamic modelling of complex reactive
absorption processes. Chem. Eng. Sci., 54(21):5195–5203, 1999.
[51] J. C. Charpentier. Multiphase chemical reactors Volume II - Design methods, chapter Gen-
eral characteristics of multiphase gas-liquid reactors: Hydrodynamics and mass transfer,
pages 157–270. Alphen aan den Rijn, The Netherlands, 1981.
[52] A. E. Rodrigues, J. M. Calo, and N. H. Sween, editors. Multiphase Chemical Reactors
Volumne I - Fundamentals. Nato Advanced Study Institutes Series, 1980.
[53] A. E. Rodrigues, J. M. Calo, and N. H. Sween, editors. Multiphase Chemical Reactors
Volumne II - Design Methods. Nato Advanced Study Institutes Series, 1980.
[54] R. B. Bird, W. E. Stewart, and E. N. Lightfoot. Transport Phenomena. Wiley, second
edition, 2007.
[55] G. Jackson, W. G. Chapman, and K. E. Gubbins. Phase equilibria of associating fluids
spherical molecules with multiple bonding sites. Mol. Phys., 65(1):1–31, 1988.
31
Page 33
[56] H. Thompson, J.C. Wasse, N.T. Skipper, C.A. Howard, D.T. Bowron, and A.K. Soper. The
structure of polaronic electron cavities in lithium-ammonia solutions. J. Phys.: Condens.
Matter, 16:5639–5652, 2004.
[57] G. N. I. Clark, A. J. Haslam, A. Galindo, and G. Jackson. Developing optimal Wertheim-
like models of water for use in statistical associating fluid theory (SAFT) and related
approaches. Mol. Phys., 104(22–24), 2006.
[58] J. S. Rowlinson and F. L Swinton. Liquids and Liquid Mixtures. Butterworth - Heinmann,
London, Third edition, 1982.
[59] PSE, 2007. http://www.psenterprise.com/.
[60] K. P. Resnik, J. T. Yeh, and H. W. Pennline. Aqua ammonia process for simultaneous
removal of CO2, SO2 and NOx. Int. J. of Environmental Technology & Management,
4(1/2):89–104, 2004.
[61] R. Peltier. Alstom’s chilled ammonia CO2 capture process advances toward commercialisa-
tion. Power, 2008. Available from: www.powermag.com/environmental/Alstoms chilled
ammonia CO2 capture process advances toward commercialization 86 p4.html.
[62] Chilling news for carbon capture. Mod. Power Syst., 26(12):17–18, 2006.
[63] A. C. Larsson. The chilled ammonia process by ALSTOM - Status of development. In The
5th Trondheim conference on CO2 capture, transport and storage, 2009. Available from:
www.energy.sintef.no/arr/CO2/2009/Presentations/A6-1.pdf.
[64] U. Goppert and G. Maurer. Vapour - liquid equilibria in aqueous solutions of ammonia and
carbon dioxide at temperatures between 333 and 393 K and pressures up to 7 MPa.
Fluid Phase Equilib., 41(1–2):153–185, 1988.
[65] N. Mac Dowell, F. Llovell, C. S. Adjiman, G. Jackson, and A. Galindo. Modelling the
fluid phase behaviour of carbon dioxide in aqueous solutions of monoethanolamine us-
ing transferable parameters with the SAFT-VR approach. Ind. Eng. Chem. Res. (Ac-
cepted)., 2009.
[66] A. Galindo, P. J. Whitehead, G. Jackson, and A. N. Burgess. Predicting the high-pressure
phase equilibria of water + n-alkanes using a simplified SAFT theory with transferable
intermolecular interaction parameters. J. Phys. Chem., 100(16):6781–6792, 1996.
[67] G. N. I. Clark, A. Galindo, G. Jackson, S. Rogers, and A. N. Burgess. Modeling and un-
derstanding closed-loop liquid-liquid immiscibility in aqueous solutions of poly(ethylene
glycol) using the SAFT-VR approach with transferable parameters. Macromolecules,
41(17):6582–6595, 2008.
32
Page 34
[68] D. Hopfe. Thermophysical data of pure substances. Data Compilation of Fiz Chemie Ger-
many, 1990.
[69] G. Vazquez, E. Alvarez, J. M. Navaza, R. Rendo, and E. Romero. Surface tension of binary
mixtures of water + monoethanolamine and water + 2-amino-2-methyl-1-propanol and
tertiary mixtures of these amines with water from 25 C to 50 C. J. Chem. Eng. Data,
42(1):57–59, 1997.
[70] K. Moerke and T. Roscher. Determination of the surface tension of some ethyleneamines.
Leuna protocol, 1982.
[71] G. Liessmann, W. Schmidt, and S. Reiffarth. Recommended thermophysical data. Data
compilation of the Saechsische Olefinwerke Boehlen Germany, 1995.
[72] J. I Lee, F. D. Otto, and A. E. Mather. Equilibrium between carbon dioxide and aqueous
monoethanolamine solutions. J. Appl. Biotechnol., 26(10):541–549, 1976.
[73] F. Y Jou, A. E. Mather, and F. D. Otto. The solubility of CO2 in a 30 mass percent
monoethanolamine solution. Can J. Chem. Eng., 73(1):140–147, 1995.
[74] R. Dugas. Pilot plant study of carbon dioxide capture by aqueous monoethanolamine.
Master’s thesis, The University of Texas at Austin, 2006.
[75] N. M. P. Kakalis, A. I. Kakhu, and C. C. Pantelides. Efficient solution of the association
term equations in the statistical associating fluid theory equation of state. Ind. Eng.
Chem. Res., 45(17):6056–6062, 2006.
[76] R. Taylor. (Di)Still modelling after all these years: A view of the state of the art. Ind. Eng.
Chem. Res., 46(13):4349–4357, 2007.
[77] F. A. Tobiesen, O. Juliussen, and H. F. Svendsen. Experimental validation of a rigorous
desorber model for CO2 postcombustion capture. Chem. Eng. Sci., 63:2641–2656, 2008.
[78] W. J. Choi, B. M. Min, B. H. Shon, J. B. Seo, and K. J. Oh. Characteristics of absorp-
tion/regeneration of CO2-SO2 bunary systems into aqueous AMP+ammonia solutions.
J. Ind. Eng. Chem., 2009. In Press.
[79] W. J. Choi, J. B. Seo, S. Y. Jang, J. H. Jung, and W. J. Oh. Removal characteristics of
CO2 using aqueous AME/AMP solutions in the absorption and regeneration process. J.
Env. Sci., 21:907–913, 2009.
[80] D. A. Fletcher, R. F. McMeeking, and D. Parkin. The United Kingdom Chemical Database
Service. J. Chem. Inf. Comput. Sci., 36(4):746–749, 1996.
33
Page 35
[81] D. Silkenbaeumer, B. Rumpf, and R. N. Lichtenthaler. Solubility of carbon dioxide in aque-
ous solutions of 2-amino-2-methyl-1-propanol and n-methyldiethanolamine and their
mixtures in the temperature range from 313 to 353 K and pressures up to 2.7 MPa. Ind.
Eng. Chem. Res., 38(8):3133–3141, 1988.
34
Page 36
List of Figures
1 Experimental data (squares) [80] for the pressure-temperature (PT ) phase dia-
gram of NH3, AMP and MEA are compared with the SAFT-VR description for
the SAFT-VR models (continuous curves). . . . . . . . . . . . . . . . . . . . . . . 39
2 Experimental data (squares) [80] for the vapour-liquid coexistence densities, ρ
of NH3, AMP and MEA are compared with the SAFT-VR description for the
models of these molecules (continuous curves) . . . . . . . . . . . . . . . . . . . . 40
3 a)Experimental data (squares) [80] for the enthalpy of vapourisation of NH3,
ΔHNH3fg , are compared with the SAFT-VR description for the models of these
molecules (continuous curves), b)Experimental data (squares) [80] for the vapour-
liquid interfacial tension of NH3, γNH3 ,are compared with the SAFT-VR descrip-
tion for the models of these molecules (continuous curves) . . . . . . . . . . . . . 41
4 Isotherms of the pressure-composition (P−x) vapour-liquid equilibria of NH3+H2O
compared with SAFT-VR models of NH3. The symbols correspond to the exper-
imental data at T=333.15K [80] and the curves to the corresponding SAFT-VR
description. . . . . . . . . . . . . . . . . . . . . . . . . . . . . . . . . . . . . . . . 42
5 Isothermal projection of the pressure-loading (P − x) vapour-liquid equilibria
of the ternary mixture of NH3+H2O+CO2, where θ is defined as xCO2/xNH3 .
The symbols correspond to the experimental data at T=333.15K and mNH3 =
0.591 [64] and the curves to the corresponding SAFT-VR description. This data
set was used to obtain the NH3+CO2 binary interaction parameters. . . . . . . . 43
6 Isothermal projections of the pressure-composition (P−x) vapour-liquid equilibria
of the ternary mixture of NH3+H2O+CO2, where θ is defined as xCO2/xNH3 .
The symbols correspond to the experimental data at T=353.15K and mNH3 =
0.591 [64] and the curves to the corresponding SAFT-VR description. These
results are a prediction, not a correlation. . . . . . . . . . . . . . . . . . . . . . . 44
35
Page 37
7 Contour plot for the relative average absolute deviation (%AAD) of the vapour
pressure and saturated liquid density determined using the SAFT-VR equation of
state with the asymmetric model of MEA. At each point on the surface, the dis-
persion εMEA/k and self-cross-association εHBeH,MEA/k and ε
HBe∗H∗,MEA/k energies
are fixed, and the size (σMEA) and range (λMEA) parameters are optimised by
minimising the least-squares objective function for 376 points between the triple-
point temperature to 90% of the critical point. The optimal model on this surface
corresponds to %AAD PSat+ ρl = 2.41%. Only the relevant section of the entire
parameter space explored is depicted. . . . . . . . . . . . . . . . . . . . . . . . . 45
8 Experimental data (squares) [80] for the enthalpy of vaporisation ΔHvap of MEA
compared with SAFT-VR predictions for the asymmetric model (continuous curve). 46
9 Experimental data (squares) [80] for vapour-liquid interfacial tension of MEA
compared with SAFT-VR predictions for the asymmetric model (continuous curve). 47
10 Isotherms of the pressure-composition (P−x) vapour-liquid equilibria of MEA+H2O
compared with SAFT-VR calculations with both the symmetric and asymmetric
models of MEA. The continuous curves are the calculations with the asymmet-
ric model of MEA and the dashed line curves those with the symmetric model
of MEA. Three representative temperatures are shown:�, T = 298.15 K; ◦,
T = 343.15 K; ♦, T = 363.15 K. The symbols correspond to the experimen-
tal data [80] and the curves to the corresponding SAFT-VR description. . . . . 48
11 Isothermal projections of the pressure-composition (Px) vapour-liquid equilibria
of the ternary mixture MEA+CO2+H2O compared with SAFT-VR description:
a) T = 313.15 K, b) T = 333.15 K, and c) T = 353.15 K. The thick continu-
ous curves correspond to SAFT-VR calculations with the asymmetric model of
MEA, and the thick dashed curve in a) to SAFT-VR calculations with the sym-
metric model of MEA. In all figures, the thin continuous curves corresponds to
a correlation presented by Aboudheir et al. [36] and the thin dashed curve cor-
responds to a correlation presented by Gabrielsen et al. [35] The symbols denote
the experimental data: � correspond to the data of Jou and Mather [73]; ♦ and
. correspond to the data of Dugas [74]; ◦ correspond to the data of Lee et al. [72] 49
36
Page 38
12 Binary VLE calculations for the AMP+H2O mixture compared with experimental
data. The continuous lines correspond to SAFT-VR calculations and the symbols
(�) to experimental data obtained from Pappa et al. [?] at a constant pressure
of P = 0.1MPa. . . . . . . . . . . . . . . . . . . . . . . . . . . . . . . . . . . . . . 50
13 Ternary VLE calculations for the AMP+CO2+H2O mixture compared with ex-
perimental data. The continuous lines correspond to SAFT-VR calculations and
the symbols (�) to the experimental data of [81] at a constant temperature of T
= 353.15 K . . . . . . . . . . . . . . . . . . . . . . . . . . . . . . . . . . . . . . . 51
14 Evolution of model complexity, taken from Kenig et al. [43] . . . . . . . . . . . . 52
15 Representation of column stage . . . . . . . . . . . . . . . . . . . . . . . . . . . . 52
16 a) Liquid phase temperature profile for absorber column, b) Gas phase CO2 con-
centration profile for absorber column, c) Liquid phase CO2 loading profile for
absorber column. The continuous curves correspond to the predictions of our
model, and the symbols correspond to pilot plant data obtained from run T22
in [49]. Stage 1 corresponds to the top of the column, and stage 25 to the bottom.
An MEA solvent is used. . . . . . . . . . . . . . . . . . . . . . . . . . . . . . . . . 53
17 a) Liquid phase temperature profile for absorber column, b) Gas phase CO2 con-
centration profile for absorber column, c) Liquid phase CO2 loading profile for
absorber column. The continuous curves correspond to the predictions of our
model, and the symbols correspond to pilot plant data obtained from run T26
in [49]. Stage 1 corresponds to the top of the column, and stage 25 to the bottom.
An AMP solvent is used. . . . . . . . . . . . . . . . . . . . . . . . . . . . . . . . . 54
18 Liquid phase temperature profile for NTNU desorber from [77]. The continuous
curves correspond to the predictions of our model, and the symbols correspond
to pilot plant data. Stage 1 corresponds to the top of the column, and stage 25
to the bottom.An MEA solvent is used. . . . . . . . . . . . . . . . . . . . . . . . 55
37
Page 39
19 Predicted temperature and composition profiles for an industrial scale absorption
column a) Liquid phase temperature profile b) Gas phase CO2 concentration
profile c) Liquid phase CO2 loading profile. The continuous curves correspond
to a 30wt% MEA solvent, the dotted curves correspond to a 30wt% AMP +
5wt%NH3 solvent blend and the dashed curves correspond to an optimised solvent
blend comprising 37.7wt% AMP and 1.96wt% NH3 mixture. . . . . . . . . . . . . 56
38
Page 40
100 200 300 400 500 600 700 8000
2
4
6
8
10
12
14
16
T/K
P/M
Pa
MEANH3
AMP
MEANH3
AMP
MEANH3
AMP
MEANH3
AMP
MEANH3
AMP
MEANH3
AMP
MEANH3
AMP
MEANH3
AMP
Figure 1: Experimental data (squares) [80] for the pressure-temperature (PT ) phase diagram of
NH3, AMP and MEA are compared with the SAFT-VR description for the SAFT-VR models
(continuous curves).
39
Page 41
0 0.01 0.02 0.03 0.04 0.05100
200
300
400
500
600
700
800
ρ /mol cm-3
T /K
MEANH
3AMP
Figure 2: Experimental data (squares) [80] for the vapour-liquid coexistence densities, ρ of NH3,
AMP and MEA are compared with the SAFT-VR description for the models of these molecules
(continuous curves)
40
Page 42
150 200 250 300 350 400 4500
5
10
15
20
25
30
Δ H
fg /k
Jmol
-1
T/K
150 200 250 300 350 400 4500
20
40
60
80
γ /m
Nm
-1
T/K
a)
b)
Figure 3: a)Experimental data (squares) [80] for the enthalpy of vapourisation of NH3, ΔHNH3fg ,
are compared with the SAFT-VR description for the models of these molecules (continuous
curves), b)Experimental data (squares) [80] for the vapour-liquid interfacial tension of NH3,
γNH3 ,are compared with the SAFT-VR description for the models of these molecules (continuous
curves)
41
Page 43
0 0.2 0.4 0.6 0.8 10
0.5
1
1.5
2
2.5
3
xH
2O
P/M
Pa
Figure 4: Isotherms of the pressure-composition (P − x) vapour-liquid equilibria of NH3+H2O
compared with SAFT-VR models of NH3. The symbols correspond to the experimental data at
T=333.15K [80] and the curves to the corresponding SAFT-VR description.
42
Page 44
0 0.2 0.4 0.6 0.8 1 1.2 1.40
0.2
0.4
0.6
0.8
1
1.2
1.4
θCO
2
P/M
Pa
Figure 5: Isothermal projection of the pressure-loading (P − x) vapour-liquid equilibria of the
ternary mixture of NH3+H2O+CO2, where θ is defined as xCO2/xNH3 . The symbols corre-
spond to the experimental data at T=333.15K and mNH3 = 0.591 [64] and the curves to the
corresponding SAFT-VR description. This data set was used to obtain the NH3+CO2 binary
interaction parameters.
43
Page 45
0.2 0.4 0.6 0.8 1 1.20
0.2
0.4
0.6
0.8
1
1.2
1.4
θCO
2
P/M
Pa
Figure 6: Isothermal projections of the pressure-composition (P − x) vapour-liquid equilibria
of the ternary mixture of NH3+H2O+CO2, where θ is defined as xCO2/xNH3 . The symbols
correspond to the experimental data at T=353.15K and mNH3 = 0.591 [64] and the curves to
the corresponding SAFT-VR description. These results are a prediction, not a correlation.
44
Page 46
9001000
11001200
1300
200
300
400
500400
450
500
550
600
650
700
εHBeH*,MEA
/k /Kε
MEA/k /K
εHB
e*H
,ME
A/k
/K
%AAD
2
3
4
5
6
7
8
9
10
Figure 7: Contour plot for the relative average absolute deviation (%AAD) of the vapour pres-
sure and saturated liquid density determined using the SAFT-VR equation of state with the
asymmetric model of MEA. At each point on the surface, the dispersion εMEA/k and self-cross-
association εHBeH,MEA/k and εHBe∗H∗,MEA/k energies are fixed, and the size (σMEA) and range
(λMEA) parameters are optimised by minimising the least-squares objective function for 376
points between the triple-point temperature to 90% of the critical point. The optimal model on
this surface corresponds to %AAD PSat + ρl = 2.41%. Only the relevant section of the entire
parameter space explored is depicted.
45
Page 47
0 200 400 600 8000
200
400
600
800
1000
1200
Δ H
vap /k
J kg
-1
T/K
Figure 8: Experimental data (squares) [80] for the enthalpy of vaporisation ΔHvap of MEA
compared with SAFT-VR predictions for the asymmetric model (continuous curve).
46
Page 48
200 300 400 500 600 700 8000
10
20
30
40
50
60
γ /m
N m
-1
T/K
Figure 9: Experimental data (squares) [80] for vapour-liquid interfacial tension of MEA com-
pared with SAFT-VR predictions for the asymmetric model (continuous curve).
47
Page 49
0 0.2 0.4 0.6 0.8 10
0.02
0.04
0.06
0.08
xH
2O
P /M
Pa
Figure 10: Isotherms of the pressure-composition (P −x) vapour-liquid equilibria of MEA+H2O
compared with SAFT-VR calculations with both the symmetric and asymmetric models of MEA.
The continuous curves are the calculations with the asymmetric model of MEA and the dashed
line curves those with the symmetric model of MEA. Three representative temperatures are
shown:�, T = 298.15 K; ◦, T = 343.15 K; ♦, T = 363.15 K. The symbols correspond to the
experimental data [80] and the curves to the corresponding SAFT-VR description.
48
Page 50
0 0.02 0.04 0.06 0.08 0.1 0.12 0.1410
-5
100
105
xCO
2
PC
O2/k
Pa
0 0.02 0.04 0.06 0.08 0.1 0.1210
-5
100
105
xCO
2
PC
O2/k
Pa
0 0.02 0.04 0.06 0.08 0.1 0.12
100
105
xCO
2
PC
O2/k
Pa
a)
c)
b)
Figure 11: Isothermal projections of the pressure-composition (Px) vapour-liquid equilibria of
the ternary mixture MEA+CO2+H2O compared with SAFT-VR description: a) T = 313.15 K,
b) T = 333.15 K, and c) T = 353.15 K. The thick continuous curves correspond to SAFT-
VR calculations with the asymmetric model of MEA, and the thick dashed curve in a) to
SAFT-VR calculations with the symmetric model of MEA. In all figures, the thin continuous
curves corresponds to a correlation presented by Aboudheir et al. [36] and the thin dashed
curve corresponds to a correlation presented by Gabrielsen et al. [35] The symbols denote the
experimental data: � correspond to the data of Jou and Mather [73]; ♦ and . correspond to the
data of Dugas [74]; ◦ correspond to the data of Lee et al. [72]
49
Page 51
0 0.2 0.4 0.6 0.8 1370
380
390
400
410
420
430
440
xH
2O
T /K
Figure 12: Binary VLE calculations for the AMP+H2O mixture compared with experimen-
tal data. The continuous lines correspond to SAFT-VR calculations and the symbols (�) to
experimental data obtained from Pappa et al. [?] at a constant pressure of P = 0.1MPa.
50
Page 52
0 0.5 1 1.5 210
-3
10-2
10-1
100
101
102
θCO
2
P/M
Pa
Figure 13: Ternary VLE calculations for the AMP+CO2+H2O mixture compared with exper-
imental data. The continuous lines correspond to SAFT-VR calculations and the symbols (�)
to the experimental data of [81] at a constant temperature of T = 353.15 K
51
Page 53
Figure 14: Evolution of model complexity, taken from Kenig et al. [43]
Figure 15: Representation of column stage
52
Page 54
0 5 10 15 20 25280
290
300
310
320
330
340
T (
K)
Stage
0 5 10 15 20 250
0.05
0.1
0.15
0.2
y CO
2
Stage
0 5 10 15 20 250
0.1
0.2
0.3
0.4
0.5
θC
O2
Stage
c)
a) b)
Figure 16: a) Liquid phase temperature profile for absorber column, b) Gas phase CO2 concen-
tration profile for absorber column, c) Liquid phase CO2 loading profile for absorber column.
The continuous curves correspond to the predictions of our model, and the symbols correspond
to pilot plant data obtained from run T22 in [49]. Stage 1 corresponds to the top of the column,
and stage 25 to the bottom. An MEA solvent is used.
53
Page 55
0 5 10 15 20 25280
290
300
310
320
330
340
T (
K)
Stage
0 5 10 15 20 250
0.05
0.1
0.15
0.2
y CO
2
Stage
0 5 10 15 20 250
0.1
0.2
0.3
0.4
0.5
θC
O2
Stage
a) b)
c)
Figure 17: a) Liquid phase temperature profile for absorber column, b) Gas phase CO2 concen-
tration profile for absorber column, c) Liquid phase CO2 loading profile for absorber column.
The continuous curves correspond to the predictions of our model, and the symbols correspond
to pilot plant data obtained from run T26 in [49]. Stage 1 corresponds to the top of the column,
and stage 25 to the bottom. An AMP solvent is used.
54
Page 56
0 5 10 15 20 25350
360
370
380
390
400
T (
K)
Stage
Figure 18: Liquid phase temperature profile for NTNU desorber from [77]. The continuous
curves correspond to the predictions of our model, and the symbols correspond to pilot plant
data. Stage 1 corresponds to the top of the column, and stage 25 to the bottom.An MEA solvent
is used.
55
Page 57
0 5 10 15 20 25280
300
320
340
360
T (
K)
Stage
0 5 10 15 20 250
0.05
0.1
0.15
0.2
y CO
2
Stage
0 5 10 15 20 250
0.2
0.4
0.6
0.8
θC
O2
Stage
Figure 19: Predicted temperature and composition profiles for an industrial scale absorption
column a) Liquid phase temperature profile b) Gas phase CO2 concentration profile c) Liquid
phase CO2 loading profile. The continuous curves correspond to a 30wt% MEA solvent, the
dotted curves correspond to a 30wt% AMP + 5wt%NH3 solvent blend and the dashed curves
correspond to an optimised solvent blend comprising 37.7wt% AMP and 1.96wt% NH3 mixture.
56