The accompanying notes are an integral part of these financial statements. Imperial Global Equity Income Pool Interim Financial Reports (unaudited) for the period ended June 30, 2016 Organization of the Fund (note 1) The Pool was established on January 28, 2008 (Date Established). Inception Date x x Class A February 4, 2008 x x Statements of Financial Position (unaudited) (in 000s, except per unit amounts) As at June 30, 2016 and December 31, 2015 (note 1) June 30, 2016 December 31, 2015 x x x x Assets x x x Current assets x Investments (non-derivative financial assets) (notes 2 and 3) $ 3,123,870 $ 2,742,371 x Cash including foreign currency holdings, at fair value 63,817 75,022 x Dividends receivable 11,620 8,449 x Receivable for portfolio securities sold 10,167 4,150 x Receivable for units issued 4,390 5,788 x Derivative assets 3,683 2,516 x x x Total Assets 3,217,547 2,838,296 x x x Liabilities x x x Current liabilities x Payable for portfolio securities purchased 17,034 30,485 x Payable for units redeemed 1,610 1,996 x Other accrued expenses 1 – x Distributions payable to holders of redeemable units 1,389 – x Derivative liabilities 1,069 – x x x Total Liabilities 21,103 32,481 x x x Net Assets Attributable to Holders of Redeemable Units (note 5) $ 3,196,444 $ 2,805,815 x x x Net Assets Attributable to Holders of Redeemable Units per Class x Class A $ 3,196,444 $ 2,805,815 x x x Net Assets Attributable to Holders of Redeemable Units per Unit (note 5) x Class A $ 10.98 $ 11.64 x 1
Transcript
The accompanying notes are an integral part of these financial statements.
Imperial Global Equity Income Pool
Interim Financial Reports (unaudited)for the period ended June 30, 2016
Organization of the Fund (note 1)The Pool was established on January 28, 2008 (Date Established).
Inception Datexx
Class A February 4, 2008xx
Statements of Financial Position (unaudited)(in 000s, except per unit amounts)
As at June 30, 2016 and December 31, 2015 (note 1)
Cash including foreign currency holdings, at fair value 63,817 75,022x
Dividends receivable 11,620 8,449x
Receivable for portfolio securities sold 10,167 4,150x
Receivable for units issued 4,390 5,788x
Derivative assets 3,683 2,516xxx
Total Assets 3,217,547 2,838,296xxx
Liabilitiesxxx
Current liabilitiesx
Payable for portfolio securities purchased 17,034 30,485x
Payable for units redeemed 1,610 1,996x
Other accrued expenses 1 –x
Distributions payable to holders of redeemable units 1,389 –x
Derivative liabilities 1,069 –xxx
Total Liabilities 21,103 32,481xxx
Net Assets Attributable to Holders ofRedeemable Units (note 5) $ 3,196,444 $ 2,805,815
xxx
Net Assets Attributable to Holders ofRedeemable Units per Class
x
Class A $ 3,196,444 $ 2,805,815xxx
Net Assets Attributable to Holders ofRedeemable Units per Unit (note 5)
x
Class A $ 10.98 $ 11.64x
1
The accompanying notes are an integral part of these financial statements.
Imperial Global Equity Income Pool
Statements of Comprehensive Income (unaudited)(in 000s, except per unit amounts)
For the periods ended June 30, 2016 and 2015 (note 1)
June 30, 2016 June 30, 2015x
x
Net Gain (loss) on Financial Instrumentsx
Interest for distribution purposes $ – $ 10x
Dividend revenue 67,384 38,008x
Other changes in fair value of investments andderivatives
x
Net realized gain (loss) on sale of investments andderivatives (19,274) 52,613
x
Net realized gain (loss) on foreign currency (notes 2fand g) 6,813 (183)
x
Net change in unrealized appreciation (depreciation)of investments and derivatives (117,904) 40,502
xxx
Net Gain (loss) on Financial Instruments ± (62,981) 130,950xx
x
Other Incomex
Foreign exchange gain (loss) on cash (362) (215)xxx
(362) (215)xx
x
Expenses (note 6)x
Management fees ±±± 4,113 2,430x
Audit fees 6 5x
Custodial fees 203 166x
Independent review committee fees 3 3x
Legal fees 15 7x
Regulatory fees 31 23x
Transaction costs ±±±± 1,540 1,062x
Unitholder reporting costs 312 149x
Withholding taxes (note 7) 6,957 4,191x
Other expenses 13 6xxx
13,193 8,042xx
x
Expenses waived/absorbed by the Manager (2,188) (1,332)xx
x
11,005 6,710xx
x
Increase (Decrease) in Net Assets Attributable toHolders of Redeemable Units (excludingdistributions) (74,348) 124,025
xx
x
Increase (Decrease) in Net Assets Attributable toHolders of Redeemable Units per Class(excluding distributions)
x
Class A $ (74,348) $ 124,025xxx
Average Number of Units Outstanding for theperiod per Class
x
Class A 271,447 151,119xxx
Increase (Decrease) in Net Assets Attributable toHolders of Redeemable Units per Unit(excluding distributions)
x
Class A $ (0.27) $ 0.83x
x
± Net Gain (Loss) on Financial Instruments(in 000s)
Net gains (losses)
Category June 30, 2016 June 30, 2015x..
Financial assets at FVTPL..
Held for Trading $ 6,482 $ 169..
Designated at Inception (69,463) 130,781......
Total financial assets at FVTPL $ (62,981) $ 130,950..
xx
±±± Maximum Chargeable Annual Management Fee Rates (note 6)xx
Class A 0.25%xx
±±±± Brokerage Commissions and Fees (notes 8 and 9)
2016 2015x
x
Brokerage commissions and other fees ($000s)x
Total Paid 659 405x
Paid to CIBC World Markets Inc. – –x
Paid to CIBC World Markets Corp. – –x
Soft dollars ($000s)x
Total Paid 61 –x
Paid to CIBC World Markets Inc. and CIBC World Markets Corp. – –xx
2
The accompanying notes are an integral part of these financial statements.
Imperial Global Equity Income Poolx
Statements of Changes in Net Assets Attributable to Holders of Redeemable Units (unaudited)(in 000s)For the periods ended June 30, 2016 and 2015 (note 1)
Class A Units
June 30, 2016 June 30, 2015xx.
Increase (Decrease) in Net Assets Attributable toHolders of Redeemable Units (excludingdistributions) $ (74,348) $ 124,025
xxx.
Distributions Paid or Payable to Holders ofRedeemable Units
x.
From net investment income (91,715) (55,439)x.xx
(91,715) (55,439)xxx.
Redeemable Unit Transactionsx.
Amount received from the issuance of units 739,611 699,606x.
Amount received from reinvestment of distributions 83,468 50,412x.
Amount paid on redemptions of units (266,387) (110,550)x.xx
556,692 639,468xxx.
Increase (Decrease) in Net Assets Attributable toHolders of Redeemable Units 390,629 708,054
x.
Net Assets Attributable to Holders of Redeemable Unitsat Beginning of Period 2,805,815 1,353,093
x.xx
Net Assets Attributable to Holders of Redeemable Unitsat End of Period $ 3,196,444 $ 2,061,147
xxx.
Redeemable Units Issued and Outstanding (note 5)x.
As at June 30, 2016 and 2015x.
Balance - beginning of period 240,948 124,353x.
Redeemable units issued 66,593 59,570x.
Redeemable units issued on reinvestments 7,572 4,298x.xx
315,113 188,221x.
Redeemable units redeemed (24,104) (9,429)x.xx
Balance - end of period 291,009 178,792xx
x
3
The accompanying notes are an integral part of these financial statements.
Imperial Global Equity Income Poolx
x
Statements of Cash Flows (unaudited)(in 000s)For the periods ended June 30, 2016 and 2015 (note 1)
June 30, 2016 June 30, 2015xx.
Cash Flows from Operating Activitiesx.
Increase (Decrease) in Net Assets Attributable to Holders of Redeemable Units from Operations (excluding distributions) $ (74,348) $ 124,025x.
Adjustments for:x.
Foreign exchange loss (gain) on cash 362 215x.
Net realized (gain) loss on sale of investments and derivatives 19,274 (52,613)x.
Net change in unrealized (appreciation) depreciation of investments and derivatives 117,904 (40,502)x.
Purchase of investments (1,298,036) (1,009,751)x.
Proceeds from the sale of investments 759,794 417,115x.
Dividends receivable (3,172) (2,222)x.
Other liabilities 1 –x.xx
(478,221) (563,733)xxx.
Cash Flows from Financing Activitiesx.
Amount received from the issuance of units 741,009 696,913x.
Amount paid on redemptions of units (266,773) (110,151)x.
Distributions paid to unitholders (6,858) (4,140)x.xx
467,378 582,622xxx.
Increase (Decrease) in Cash during the Period (10,843) 18,889xxx.
Foreign exchange loss (gain) on cash (362) (215)xxx.
Cash (Bank Overdraft) at Beginning of Period 75,022 43,319xxx.
Cash (Bank Overdraft) at End of Period $ 63,817 $ 61,993x
x.
Interest received $ – $ 10x.
Dividends received, net of withholding taxes $ 57,255 $ 31,595
4
The accompanying notes are an integral part of these financial statements.
Imperial Global Equity Income Pool
x
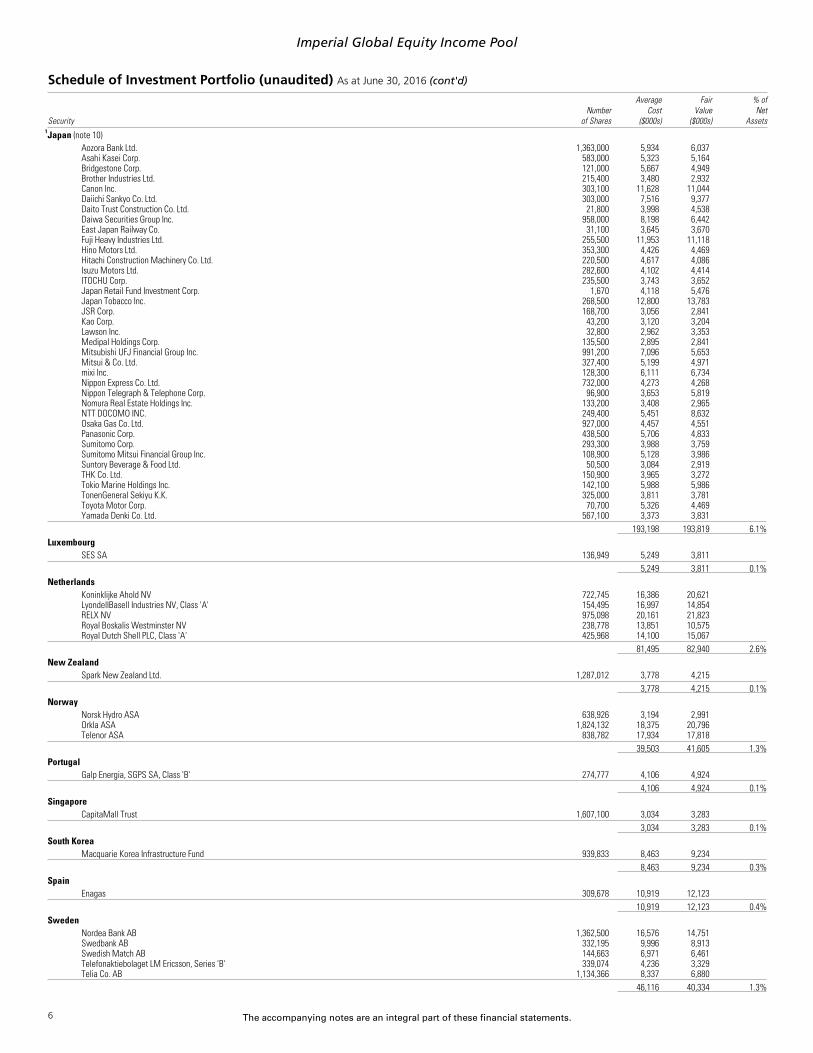
Schedule of Investment Portfolio (unaudited) As at June 30, 2016
SecurityNumber
of Shares
AverageCost
($000s)
FairValue
($000s)
% ofNet
Assetsx
CANADIAN EQUITIES..
Bank of Montreal 190,103 13,934 15,579..
Canadian Imperial Bank of Commerce 275,259 25,347 26,711..
Magna International Inc., Class 'A' 205,134 12,192 9,303..
Power Financial Corp. 629,219 19,996 18,656..
Royal Bank of Canada 316,013 23,318 24,124..
Sun Life Financial Inc. 292,336 12,107 12,407..
Thomson Reuters Corp. 146,928 7,811 7,680..
....
TOTAL CANADIAN EQUITIES 114,705 114,460 3.6%..x
INTERNATIONAL EQUITIES..
Australia..
AGL Energy Ltd. 173,063 2,719 3,217..
Aurizon Holdings Ltd. 713,571 3,267 3,314..
Bank of Queensland Ltd. 377,994 4,618 3,857..
Boral Ltd. 1,419,646 8,720 8,508..
Caltex Australia Ltd. 133,676 4,557 4,109..
Commonwealth Bank of Australia 193,997 15,131 13,901..
CSL Ltd. 43,808 4,094 4,735..
Dexus Property Group 1,278,317 8,908 11,110..
Flight Centre Travel Group Ltd. 119,718 4,630 3,643..
Goodman Group 737,856 4,219 5,055..
Incitec Pivot Ltd. 971,624 3,023 2,780..
Insurance Australia Group Ltd. 570,230 3,115 2,994..
Macquarie Group Ltd. 103,546 7,572 6,874..
Mirvac Group 2,677,259 4,787 5,211..
National Australia Bank Ltd. 140,993 3,949 3,455..
Scripps Networks Interactive Inc. 99,404 7,195 7,997..
Staples Inc. 3,693,812 43,262 41,136..
Sysco Corp. 838,950 44,947 54,996..
TEGNA Inc. 479,187 15,263 14,344..
The Dun & Bradstreet Corp. 145,330 20,699 22,876..
The Kraft Heinz Corp. 84,692 8,169 9,681..
TJX Cos. Inc. 183,372 17,513 18,296..
United Parcel Service Inc., Class 'B' 118,238 13,458 16,455..
Valero Energy Corp. 336,443 26,907 22,168..
Verizon Communications Inc. 508,823 29,474 36,708..
Walgreens Boots Alliance Inc. 87,328 9,968 9,395..
Wal-Mart Stores Inc. 119,798 9,834 11,301..
Wells Fargo & Co. 400,995 23,720 24,520..
Western Union Co. 1,600,413 39,475 39,658..
....
1,581,885 1,730,589 54.1%..
..
TOTAL INTERNATIONAL EQUITIES 2,901,281 3,009,410 94.1%..
..
TOTAL EQUITIES 3,015,986 3,123,870 97.7%..
..
Less: Transaction costs included in average cost (3,004).
..
..
TOTAL INVESTMENTS 3,012,982 3,123,870 97.7%..
..
Derivative assets 3,683 0.1%..
Derivative liabilities (1,069) 0.0%..
Other Assets, less Liabilities 69,960 2.2%..
....
TOTAL NET ASSETS ATTRIBUTABLE TO HOLDERS OFREDEEMABLE UNITS 3,196,444 100.0%
.
...
1Hedging reference number. Refers to a corresponding number on the Schedule of Derivative Assets and Liabilities - Forward Foreign Currency Contracts...
x
x
Schedule of Derivative Assets and Liabilities - Forward Foreign Currency Contracts (note 10)
Hedging Ref.No.** Counterparty
Credit Rating forCounterparty*
SettlementDate
CurrencyBuys Par Value
CurrencySells Par Value Forward Rate Current Rate
Unrealized Gain(Loss) ($000s)
x..
State Street Trust Co., London A-1+ 2016/09/20 GBP 14,806,839 JPY 2,116,800,445 142.961 137.207 (1,069)..
1 State Street Trust Co., London A-1+ 2016/09/20 CAD 2,613,844 JPY 204,670,487 78.303 79.727 47......
Derivative Assets and Liabilities - Forwards 2,614..
..
* The credit rating of each counterparty (as rated by S&P Global Ratings, a division of S&P Global) of the forward foreign currency contracts held by the Pool meets or exceeds the minimum approved credit rating...
** See corresponding reference number on the Schedule of Investment Portfolio.
8
The accompanying notes are an integral part of these financial statements.
Imperial Global Equity Income Pool
Supplemental Schedule to Schedule of Investment Portfolio (unaudited)
Offsetting Arrangements (note 2d)
(in 000s)
The Pool may enter into various master netting arrangements or other similar agreements that do not meet the criteria for offsetting in the Statements of Financial Position but still allowfor the related amounts to be set off in certain circumstances, such as bankruptcy or the termination of the contracts.
The following table reconciles the net amount of “Over-The-Counter” derivatives presented in the Statements of Financial Position, as at June 30, 2016 and December 31, 2015, to:
l The gross amount before offsetting required under IFRS; and
l The net amount after offsetting under the terms of master netting arrangements or other similar arrangements, but which do not meet the criteria for offsetting under IFRS.
x
Financial Assets and Liabilities Amounts Offset Amounts Not Offset Net
As at June 30, 2016 and December 31, 2015, the Pool had no investments in underlying funds where the ownership exceeded 20% of each underlying fund.
9
The accompanying notes are an integral part of these financial statements.
Imperial Global Equity Income Pool
Financial Instrument RisksInvestment Objective: Imperial Global Equity Income Pool (the Pool) seeks to provideincome and long-term capital appreciation by investing primarily in global equity and debtsecurities.
Investment Strategies: The Pool employs a combination of investment styles that mayinclude growth, value, core, and income-generating, to identify global securities withattractive yields and capital appreciation potential to make investment decisions.
Significant risks that are relevant to the Pool are discussed here. General information onrisk management and specific discussion on concentration, credit, currency, interest rate,liquidity, and other price/market risk can be found in note 2 of the financial statements.
In the following risk tables, Net Assets is defined as meaning “Net assets attributable toholders of redeemable units".
Concentration Risk as at June 30, 2016 and December 31, 2015The Schedule of Investment Portfolio presents the securities held by the Pool as at June30, 2016.The following table presents the investment sectors held by the Pool as at December 31,2015 and groups the securities by asset type, industry sector, geographic region, orcurrency exposure:
As at December 31, 2015
Portfolio Breakdown% of Net
Assetsx
x
Canadian Equities 3.1x
International Equitiesx
Australia 2.6x
Belgium 0.5x
China 0.2x
Denmark 0.2x
Finland 0.3x
France 2.1x
Germany 2.0x
Hong Kong 0.7x
Ireland 1.4x
Italy 0.7x
Japan 6.2x
Luxembourg 0.1x
Netherlands 3.4x
New Zealand 0.1x
Norway 0.9x
Portugal 0.2x
Singapore 0.1x
South Korea 0.3x
Spain 0.9x
Sweden 1.5x
Switzerland 6.3x
United Kingdom 10.2x
United States 53.7x
Derivative Assets (Liabilities) 0.1x
Other Assets, less Liabilities 2.2xxx
Total 100.0xx
Credit RiskCredit ratings represent a consolidation of the ratings provided by various outside serviceproviders and are subject to change, which could be material.
See the Schedule of Investment Portfolio for counterparty from over-the-counterderivative contracts, where applicable.
As at June 30, 2016 and December 31, 2015, the Pool had no significant investments indebt securities.
Currency RiskThe tables that follow indicate the currencies to which the Pool had significant exposureas at June 30, 2016 and December 31, 2015, based on the market value of the Pool'sfinancial instruments (including cash and cash equivalents) and the underlying principalamounts of forward foreign currency contracts, as applicable.
As at June 30, 2016
Currency (note 2l)Total Currency
Exposure* ($000s)% of
Net Assetsx
x
USD 1,778,214 55.6x
GBP 351,138 11.0x
EUR 274,262 8.6x
CHF 198,048 6.2x
JPY 195,613 6.1x
AUD 98,110 3.1x
NOK 41,779 1.3x
SEK 40,828 1.3x
HKD 18,864 0.6xxx
* Amounts reflect the carrying value of monetary and non-monetary items (including the notionalamount of forward foreign currency contracts, if any).
As at December 31, 2015
Currency (note 2l)Total Currency
Exposure* ($000s)% of
Net Assetsx
x
USD 1,558,827 55.6x
EUR 277,630 9.9x
JPY 231,647 8.3x
GBP 228,819 8.2x
CHF 162,751 5.8x
AUD 73,686 2.6x
SEK 43,858 1.6x
NOK 25,261 0.9x
HKD 18,705 0.7xxx
* Amounts reflect the carrying value of monetary and non-monetary items (including the notionalamount of forward foreign currency contracts, if any).
The table that follows indicates how net assets as at June 30, 2016 and December 31,2015 would have decreased or increased had the Canadian dollar strengthened orweakened by 1% in relation to all foreign currencies. This analysis assumes that all othervariables remain unchanged. In practice, the actual results may differ from this analysisand the difference could be material.
June 30, 2016 December 31, 2015x
x
Impact on Net Assets ($000s) 30,236 26,468xx
Interest Rate RiskAs at June 30, 2016 and December 31, 2015, the majority of the Pool’s financial assetsand liabilities are non-interest bearing and short-term in nature; accordingly, the Pool isnot subject to significant amounts of risk due to fluctuations in the prevailing levels ofmarket interest rates.
Liquidity RiskLiquidity risk is the risk that the Pool will encounter difficulty in meeting obligationsassociated with financial liabilities. The Pool is exposed to daily cash redemptions ofredeemable units. The Pool maintains sufficient cash on hand to fund anticipatedredemptions.
With the exception of derivative contracts, where applicable, all of the Pool’s financialliabilities are short-term liabilities maturing within 90 days after the period end.
For pools that hold derivative contracts with a term-to-maturity that exceeds 90 days fromthe period end, further information related to those contracts can be referenced in thederivative schedules following the Schedule of Investment Portfolio.
Other Price/Market RiskThe table that follows indicates how net assets as at June 30, 2016 and December 31,2015 would have increased or decreased had the value of the Pool’s benchmark(s)increased or decreased by 1%. This change is estimated based on the historicalcorrelation between the return of Class A units of the Pool as compared to the return ofthe Pool’s benchmark(s), using 36 monthly data points, as available, based on the monthlynet returns of the Pool. This analysis assumes that all other variables remain unchanged.The historical correlation may not be representative of the future correlation and,accordingly, the impact on net assets could be materially different..
Impact on Net Assets ($000s)
Benchmark June 30, 2016 December 31, 2015x
x
MSCI World Index 29,976 27,438xx
10
The accompanying notes are an integral part of these financial statements.
Imperial Global Equity Income Pool
Fair Value Measurement of Financial InstrumentsThe following is a summary of the inputs used as at June 30, 2016 and December 31,2015 in valuing the Pool’s financial assets and financial liabilities, carried at fair value:
As at June 30, 2016Level 1 (i) Level 2 (ii) Level 3 (iii) Total
Classification ($000s) ($000s) ($000s) ($000s)xx
Financial Assetsx
Equities 3,123,870 – – 3,123,870x
Derivative assets – 57,214 – 57,214xxx
Total Financial Assets 3,123,870 57,214 – 3,181,084xx
x
Financial Liabilitiesx
Derivative liabilities – (54,600) – (54,600)xxx
Total Financial Liabilities – (54,600) – (54,600)xx
x
Total Financial Assets and Liabilities 3,123,870 2,614 – 3,126,484xx
x
(i) Quoted prices in active markets for identical assetsx
(ii) Significant other observable inputsx
(iii) Significant unobservable inputs
As at December 31, 2015Level 1 (i) Level 2 (ii) Level 3 (iii) Total
Classification ($000s) ($000s) ($000s) ($000s)xx
Financial Assetsx
Equities 2,742,371 – – 2,742,371x
Derivative assets – 58,201 – 58,201xxx
Total Financial Assets 2,742,371 58,201 – 2,800,572xx
x
Financial Liabilitiesx
Derivative liabilities – (55,685) – (55,685)xxx
Total Financial Liabilities – (55,685) – (55,685)xx
x
Total Financial Assets and Liabilities 2,742,371 2,516 – 2,744,887xx
x
(i) Quoted prices in active markets for identical assetsx
(ii) Significant other observable inputsx
(iii) Significant unobservable inputs
Transfer of assets between Level 1 and Level 2Financial assets and liabilities transferred from Level 1 to Level 2 are the result ofsecurities no longer being traded in an active market.
For the periods ended June 30, 2016 and December 31, 2015, there were no transfers offinancial assets and liabilities from Level 1 to Level 2.
Financial assets and liabilities transferred from Level 2 to Level 1 are the result ofsecurities now being traded in an active market..
June 30, 2016 December 31, 2015x
x
Fair value of assets transferred from Level 2 toLevel 1 during the period ($000s) – 577,492
x
x
Reconciliation of financial asset and liability movement – Level 3The Pool did not hold any significant positions of Level 3 investments at the beginning of,during, or at the end of either reporting period.
11
Notes to Financial Statements (unaudited)
x
As at and for the periods as disclosed in the financial statements (note 1)
1. Organization of the Funds and Financial Reporting Periods
The Imperial Pools consist of Imperial Money Market Pool, Imperial Short-Term Bond Pool, Imperial Canadian Bond Pool, Imperial Canadian Diversified Income Pool, Imperial International Bond Pool, Imperial EquityHigh Income Pool, Imperial Canadian Dividend Income Pool, Imperial Global Equity Income Pool, Imperial Canadian Equity Pool, Imperial U.S. Equity Pool, Imperial International Equity Pool, Imperial Overseas Equity Pool,and Imperial Emerging Economies Pool (individually, a Pool, and collectively, the Pools).
Conservative Income Portfolio, Balanced Income Portfolio and Enhanced Income Portfolio (individually, a Portfolio, and collectively, the Portfolios) were established on December 14, 2015.
Each of the Imperial Pools and Portfolios (individually, a Fund, and collectively, the Funds) is a mutual fund trust organized under the laws of Ontario and governed by a declaration of trust (Declaration of Trust). Theaddress of the Funds' registered office is 18 York Street, Suite 1300, Toronto, Ontario.
Canadian Imperial Bank of Commerce (CIBC) is the manager (the Manager) of the Funds and CIBC Trust Corporation is the trustee (the Trustee) of the Funds. Each Fund may issue an unlimited number of classes ofunits and an unlimited number of units of each class. As at the date of these financial statements, Class A units of each of the Funds are available for sale, except for the Conservative Income Portfolio which offersClass T3 and Class T4 units, the Balanced Income Portfolio which offers Class T4 and Class T5 units, and the Enhanced Income Portfolio which offers Class T5 and Class T6 units.
The date upon which each Fund was established by Declaration of Trust (Date Established) and the date upon which units of each Fund was first sold to the public (Inception Date) are reported in footnote Organizationof the Fund on the Statements of Financial Position.
The Schedule of Investment Portfolio of each Fund is as at June 30, 2016. The Statements of Financial Position of each of the Funds are as at June 30, 2016 and December 31, 2015. The Statements of ComprehensiveIncome, Statements of Changes in Net Assets Attributable to Holders of Redeemable Units, and Statements of Cash Flows of each of the Funds are for the six-month periods ended June 30, 2016 and December 31,2015, except for Funds established during either year, in which case the information presented is from the Date Established or the Inception Date to June 30, 2016 or 2015.
These financial statements were approved for issuance by the Manager on August 18, 2016.xx
2. Summary of Significant Accounting Policies
These financial statements have been prepared in accordance with International Accounting Standards Interim Financial Reporting (IAS 34) as published by the International Accounting Standards Board (IASB).The Funds adopted IFRS in 2014 as required by Canadian securities legislation and the Canadian Accounting Standards Board. Previously, the Funds prepared their financial statements in accordance with Canadiangenerally accepted accounting principles (GAAP) as defined in Part V of the CPA Canada Handbook.
The financial statements have been prepared on a going concern basis using the historical cost convention. However, each Fund is an investment entity and primarily all financial assets and financial liabilities aremeasured at fair value in accordance with IFRS. Accordingly, the Funds’ accounting policies for measuring the fair value of investments and derivatives are consistent with those used in measuring the Net Asset Valuefor transactions with unitholders. In applying IFRS, these financial statements include estimates and assumptions made by management that affect the reported amounts of assets, liabilities, income, and expensesduring the reporting periods. However, existing circumstances and assumptions may change due to market changes or circumstances arising beyond the control of the Funds. Such changes are reflected in theassumptions when they occur.
These financial statements have been presented in Canadian dollars, which is the Funds’ functional currency (unless otherwise noted).
a) Financial Instruments
Classification and recognition of financial instruments
In accordance with IAS 39 Financial Instruments: Recognition and Measurement, financial assets and financial liabilities are classified at initial recognition into the following categories:
Financial assets and liabilities at fair value through profit or loss (FVTPL)
This category is sub-divided into:
l Financial instruments classified as Held For Trading: Financial assets and liabilities are classified as Held For Trading if they are acquired for the purpose of selling and/or repurchasing in the near term, andare acquired principally for the purpose of generating a profit from short-term fluctuations in price. Derivatives and securities sold short held by the Funds are classified as Held For Trading and do not meetthe definition of effective hedging instruments as defined by IAS 39.
l Financial instruments designated as FVTPL through inception: All investments held by the Funds, excluding those classified as Held For Trading (discussed above), are designated as fair value through profitor loss upon initial recognition. These financial assets are designated upon initial recognition on the basis that they are part of a group of financial assets that are managed and have their performanceevaluated on a fair value basis, in accordance with risk management and investment strategies of the Funds, as set out in the Funds’ prospectus.
Loans and receivables
The Funds include in this category receivable balances relating to portfolio investments and other short-term receivables such as receivable for units issued.
Other financial liabilities
This category includes all financial liabilities, other than those classified as fair value through profit or loss. The Funds include in this category amounts relating to payables for portfolio securities purchased and otheraccrued liabilities such as payable for units redeemed and distributions payable to holders of redeemable units.
All Funds have contractual obligations to distribute cash to the unitholders. As a result, each Fund's obligation for net assets attributable to holders of redeemable units represents a financial liability and is presentedat the redemption amount.
b) Risk Management
The Funds’ overall risk management approach includes formal guidelines that govern the extent of exposure to various types of risk, including diversification within asset classes and limits on the exposure to individualinvestments and counterparties. In addition, derivative financial instruments may be used to manage certain risk exposures. The Manager also has various internal controls to oversee the Funds’ investment activities,including monitoring compliance with the investment objectives and strategies, internal guidelines, and securities regulations. Please refer to each Fund’s Supplemental Schedule to Schedule of InvestmentPortfolio for specific risk disclosures.
Fair value of financial instruments by using valuation techniques
Financial instruments are valued at their fair value which is defined as the price that would be received to sell an asset or paid to transfer a liability in an orderly transaction between market participants at themeasurement date. Refer to note 3a to 3f for valuation of each specific type of financial instrument held by the Funds. The fair value of financial assets and liabilities traded in active markets are based on quotedmarket prices at the close of trading on the reporting date. The Funds use the last traded market price for both financial assets and financial liabilities where the last traded price falls within that day’s bid-ask spread.In circumstances where the last traded price is not within the bid-ask spread, the Manager determines the price that is most representative of fair value based on the specific facts and circumstances.
For financial assets and financial liabilities that are not traded in an active market, fair value is determined using valuation techniques.
The Funds classify fair value measurement within a hierarchy which gives the highest priority to unadjusted quoted prices in active markets for identical assets or liabilities (Level 1) and the lowest priority tounobservable inputs (Level 3). The three levels of the fair value hierarchy are:
Level 1: Quoted prices (unadjusted) in active markets for identical assets or liabilities that the entity can access at the measurement date;
Level 2: Inputs other than quoted prices included within Level 1 that are observable for the asset or liability, either directly or indirectly; and
Level 3: Inputs are unobservable for the asset or liability.
12
p / 2 Notes to Financial Statements (unaudited)
If inputs are used to measure an asset’s or liability’s fair value, the classification within the hierarchy is based on the lowest level input that is significant to the fair value measurement. Each Fund’s fair value hierarchyclassification of its assets and liabilities is included in the Supplemental Schedule to Schedule of Investment Portfolio.
The carrying values of all non-investment assets and liabilities approximate their fair values due to their short-term nature. Fair values are classified as Level 1 when the related security or derivative is actively tradedand a quoted price is available. If an instrument classified as Level 1 subsequently ceases to be actively traded, it is transferred out of Level 1. In such cases, instruments are reclassified into Level 2, unless themeasurement of its fair value requires the use of significant unobservable inputs, in which case it is classified as Level 3.
The Manager is responsible for performing the fair value measurements included in the financial statements of a Fund, including the Level 3 measurements. The Manager obtains pricing from third-party pricingvendors and the pricing is reviewed daily. At each financial reporting date, the Manager reviews and approves all Level 3 fair value measurements. The Funds also have a Valuation Committee which meets quarterly toperform detailed reviews of the valuations of investments held by the Funds, which includes discussion on Level 3 measurements.
Credit risk
Credit risk is the risk that a counterparty to a financial instrument, such as a fixed income security or a derivative contract, will fail to discharge an obligation or commitment that it has entered into with the Funds. Thevalue of fixed income securities and derivatives as presented on the Schedule of Investment Portfolio includes consideration of the creditworthiness of the issuer and, accordingly, represents the maximum credit riskexposure of the Funds. Certain Funds may invest in short-term fixed income securities issued or guaranteed primarily by the Government of Canada or any Canadian provincial government, obligations of Canadianchartered banks or trust companies, and commercial paper with approved credit ratings. The risk of default on these short-term fixed income securities is considered low and these securities primarily have creditratings of ‘A-1 (Low)’ or higher (as rated by S&P Global Ratings, a division of S&P Global, or equivalent rating from another rating service).
The bond ratings noted in the Funds’ ‘Financial Instruments Risk’ under sub-section ‘Credit Risk’ represent ratings collected and disseminated by recognized third party vendors. These ratings utilized by the Manager,while obtained from vendors skilled and recognized for bond rating services, may not be the same as those used directly by the portfolio advisor or portfolio sub-advisors. Ratings used by the portfolio advisor orportfolio sub-advisors could be higher or lower than those used for risk disclosure in the financial statements in compliance with their investment policy guidelines.
The Funds may engage in securities lending transactions. The credit risk related to securities lending transactions is limited by the fact that the value of cash or securities held as collateral by the Funds in connectionwith these transactions is at least 102% of the fair value of the securities loaned. The collateral and loaned securities are marked to market on each business day. Further information regarding the collateral andsecurities on loan can be found in the footnotes to the Statements of Financial Position and in note 2j.
Currency risk
Currency risk is the risk that the value of an investment will fluctuate due to changes in foreign exchange rates. Mutual funds may invest in securities denominated or traded in currencies other than the funds’reporting currency.
Interest rate risk
Prices of fixed income securities generally increase when interest rates decline and decrease when interest rates rise. This risk is known as interest rate risk. Prices of longer-term fixed income securities will generallyfluctuate more in response to interest rate changes than would shorter-term securities. Due to the nature of short-term fixed income securities with a remaining term-to-maturity of less than one year, theseinvestments are not generally exposed to a significant risk that their value will fluctuate in response to changes in the prevailing levels of market interest rates.
Liquidity risk
The Funds are exposed to daily cash redemptions of redeemable units. Generally, the Funds retain sufficient cash and cash equivalent positions to maintain adequate liquidity. However, liquidity risk also involves theability to sell an asset for cash easily and at a fair price. Some securities are illiquid due to legal restrictions on their resale, the nature of the investment, or simply a lack of interested buyers for a particular security orsecurity type. Certain securities may become less liquid due to changes in market conditions, such as interest rate changes or market volatility, which could impair the ability of a Fund to sell such securities quickly or ata fair price. Difficulty in selling securities could result in a loss or lower return for a Fund.
Other price/market risk
Other price/market risk is the risk that the value of investments will fluctuate as a result of changes in market conditions. Several factors can influence market trends, such as economic developments, changes ininterest rates, political changes, and catastrophic events. All investments are exposed to other price/market risk.
c) Investment Transactions, Income Recognition, and Recognition of Realized and Unrealized Gains and Losses
i) Interest for distribution purposes shown on the Statements of Comprehensive Income represents the coupon interest received by the Fund accounted for on an accrual basis. The Funds do not amortizepremiums paid or discounts received on the purchase of fixed income securities except for zero coupon bonds, which are amortized on a straight-line basis.
ii) Dividend income is recorded on the ex-dividend date.
iii) Securities that are exchange-traded are recorded at fair value established by the last traded market price when that price falls within that day’s bid-ask spread. Debt securities are recorded at fair value,established by the last traded price on the over-the-counter market (OTC) when that price falls within that day’s bid-ask spread. In circumstances where the last traded price is not within the bid-ask spread,the Manager determines the price that is most representative of fair value based on the specific facts and circumstances. Unlisted securities are recorded at fair value using fair valuation techniquesestablished by the Manager in establishing a fair value.
iv) Realized gains and losses on investments and unrealized appreciation or depreciation of investments are calculated using the average cost, excluding transaction costs, of the related investments.
v) Other income is the sum of income, excluding transaction costs, other than that which is separately classified on the Statements of Comprehensive Income.
d) Offsetting
Financial assets and liabilities are offset and the net amount reported in the Statements of Financial Position, if there is a currently enforceable legal right to offset the recognized amounts and there is an intention tosettle on a net basis, or to realize the asset and settle the liability simultaneously.
Where applicable, additional information can be found in the table Offsetting Arrangements as part of the Supplemental Schedule to Schedule of Investment Portfolio. This supplemental schedule discloses the OTCderivatives which are subject to offsetting.
e) Portfolio Securities
The cost of securities of a Fund is determined in the following manner: securities are purchased and sold at a market-traded price to arrive at a value for the position traded. The total purchased value represents thetotal cost of the security to the Fund. When additional units of the same security are purchased, the cost of those additional units is added to the total security cost. When units of the same security are sold, theproportionate cost of the units of the security sold is deducted from the total security cost. If there is a return of capital paid by a security, the amount of this return of capital is deducted from the total security cost.This method of tracking security cost is known as “average cost” and the current total for any one security is referred to as the “adjusted cost base” or “ACB” of the security. Transaction costs incurred in portfoliotransactions are excluded from the average cost of investments and are recognized immediately in net income and are presented as a separate expense item in the financial statements.
The difference between the fair value of securities and their average cost, excluding transaction costs, represents the unrealized appreciation (depreciation) in value of the portfolio investments. The applicable periodchange in unrealized appreciation (depreciation) of investments is included on the Statements of Comprehensive Income.
Short-term investments on the Schedule of Investment Portfolio are presented at their amortized cost which approximates the fair value. Accrued interest for bonds is disclosed separately on the Statements ofFinancial Position.
f) Foreign Exchange
The value of investments and other assets and liabilities denominated in foreign currencies is translated into Canadian dollars, which is the Funds’ functional and presentation currency at the current rates prevailing oneach valuation date (unless otherwise indicated).
Purchases and sales of investments, income, and expenses are translated into Canadian dollars, which is the Funds’ functional and presentation currency at the foreign exchange rates prevailing on the dates of suchtransactions. Foreign currency translation gains (losses) on investments and income transactions are included in Net realized gain (loss) on foreign currency on the Statements of Comprehensive Income.
13
Notes to Financial Statements (unaudited) p / 3
g) Forward Foreign Currency Contracts
The Funds may enter into forward foreign currency contracts for either hedging or non-hedging purposes where such activity is consistent with their investment objectives and as permitted by the Canadian securitiesregulatory authorities.
Changes in the fair value of forward foreign currency contracts are included in derivative assets or derivative liabilities on the Statements of Financial Position and are recorded as an Increase (decrease) in unrealizedappreciation (depreciation) of investments and derivatives during the applicable period on the Statements of Comprehensive Income.
The gain or loss arising from the difference between the value of the original forward foreign currency contract and the value of such contract at close or delivery is realized and recorded as Net realized gain (loss) onforeign currency for Pools that use the forward foreign currency contracts for hedging or as Derivative income (loss) for Pools that do not use the forward foreign currency contracts for hedging.
h) Futures Contracts
The margin deposits with brokers relating to futures contracts are included in Margin on the Statements of Financial Position. Any change in the margin requirement is settled daily and included in Receivable forportfolio securities sold or Payable for portfolio securities purchased on the Statements of Financial Position.
Any difference between the settlement value at the close of business on each valuation date and the settlement value at the close of business on the previous valuation date is recorded as Derivative income (loss) onthe Statements of Comprehensive Income.
i) Options
Premiums paid for purchased call and put options are included in derivative assets and subsequently measured at fair value on the Statements of Financial Position. When a purchased option expires, the Fund willrealize a loss in the amount of the cost of the option. For a closing transaction, the Fund will realize a gain or loss depending on whether the proceeds are greater or less than the premium paid at the time of purchase.When a purchased call option is exercised, the cost of the security purchased is increased by the premium paid at the time of purchase.
Premiums received from writing options are included in derivative liabilities and subsequently measured at fair value on the Statements of Financial Position as initial reductions in the value of investments. Premiumsreceived from writing options that expire unexercised are recorded as realized gains and reported as Net gain (loss) on sale of investments and derivatives on the Statements of Comprehensive Income. For a closingtransaction, if the cost of closing the transaction exceeds the premium received, the Fund will record a realized loss or, if the premium received at the time the option was written is greater than the amount paid,the Fund will record a realized gain and is reported as Net gain (loss) on sale of investments and derivatives. If a written put option is exercised, the cost for the security delivered is reduced by the premiums received atthe time the option was written.
j) Securities Lending
A Fund may lend portfolio securities in order to earn additional revenue, which is disclosed on the Statements of Comprehensive Income. The loaned assets of any one Fund are not permitted to exceed 50% of thefair value of the assets of that Fund (excluding collateral debt for the loaned securities). The minimum allowable collateral is 102% of the fair value of the loaned securities as per the requirements of NationalInstrument 81-102 – Investment Funds. Collateral can consist of the following:
i) Cash.
ii) Qualified securities.
iii) Irrevocable letters of credit issued by a Canadian financial institution that is not the counterparty, or an affiliate counterparty, of the pool in the transaction, if evidences of indebtedness of the Canadianfinancial institution that are rated as short-term debt by an approved credit rating organization have an approved credit rating.
iv) Securities that are immediately convertible into securities of the same issuer, class, or type, and the same term, as the securities loaned.
The fair value of the loaned securities is determined on the close of any valuation date and any additional required collateral is delivered to the Pool on the next business day. The securities on loan continue to beincluded on the Schedule of Investment Portfolio, and are included in the total value on the Statements of Financial Position in Investments (non-derivative financial assets) at fair value. Where applicable, a Fund’ssecurities lending transactions are reported in footnote Securities Lending on the Statements of Financial Position.
Changes to National Instrument 81-106 – Investment Fund Continuous Disclosure took effect for Funds with a financial year beginning on or after January 1, 2016. Those changes now require a reconciliation of thegross amount generated from the securities lending transactions of the Funds to the revenue from securities lending disclosed in the Funds’ Statements of Comprehensive Income. The gross amount generated fromsecurities lending includes interest paid on collateral, withholding taxes deducted, the fees paid to the Funds’ lending agent and the securities lending revenue received by the Funds. Where applicable, thereconciliation can be found in the footnotes to the Funds’ Statements of Comprehensive Income.
k) Loans and Receivables, Other Assets and Liabilities
Loans and Receivables, other assets and liabilities (other than those classified as FVTPL) are recorded at cost, which approximates their fair value, with the exception of Net Assets Attributable to Holders ofRedeemable Units which are presented at the redemption value.
l) Legend of Abbreviations
The following is a list of abbreviations (foreign currency translation and others) that may be used in the Schedule of Investment Portfolio:x
x..x
x
Currency Abbreviations
x..
ARS – Argentine Peso JPY – Japanese Yen..
AUD – Australian Dollar KES – Kenyan Shilling..
BRL – Brazilian Real KRW – South Korean Won..
CAD – Canadian Dollar MAD – Morocco Dirham..
CHF – Swiss Franc MXN – Mexican Peso..
CLP – Chilean Peso MYR – Malaysian Ringgit..
CNY – Chinese Renminbi NOK – Norwegian Krone..
COP – Colombian Peso NZD – New Zealand Dollar..
CZK – Czech Koruna PHP – Philippine Peso..
DKK – Danish Krone PLN – Polish Zloty..
EGP – Egyptian Pound RUB – Russian Ruble..
EUR – Euro SEK – Swedish Krona..
GBP – British Pound SGD – Singapore Dollar..
HKD – Hong Kong Dollar THB – Thai Baht..
HUF – Hungarian Forint TRY – New Turkish Lira..
IDR – Indonesian Rupiah TWD – Taiwan Dollar..
ILS – Israeli Shekel USD – United States Dollar..
INR – Indian Rupee ZAR – South African Rand
14
p / 4 Notes to Financial Statements (unaudited)
..
Other Abbreviations
..
ADR – American Depositary Receipt..
CVO – Contingent Value Obligations..
ETF – Exchange-Traded Fund..
GDR – Global Depositary Receipt Securities..
NVDR – Non-Voting Depositary Receiptxxxxxxxx
m) Standards issued but not yet effective
Standards issued but not yet effective up to the date of issuance of the Funds’ financial statements are listed below. The Funds intend to adopt applicable standards when they become effective.
IFRS 9, Financial Instruments - Classification and Measurement
In July 2014, the IASB issued the final version of IFRS 9, Financial Instruments which reflects all phases of the financial instruments project and replaces IAS 39, Financial Instruments: Recognition and Measurementand all previous versions of IFRS 9. The standard introduces new requirements for classification and measurement, impairment, and hedge accounting. IFRS 9 is effective for annual periods beginning on or afterJanuary 1, 2018, with early application permitted. The Funds are in the process of assessing the impact of IFRS 9.
n) Increase (Decrease) in Net Assets Attributable to Holders of Redeemable Units per Unit
Increase (decrease) in net assets attributable to holders of redeemable units per unit of each class is calculated by dividing the Increase (decrease) in net assets attributable to holders of redeemable units (excludingdistributions), as reported on the Statements of Comprehensive Income, by the weighted average number of units in issue during the related period.
3. Valuation of Investments
The valuation date (Valuation Date) for a Fund is any day when the Manager’s head office is open for business. The Manager may, at its discretion, establish other Valuation Dates.
The fair value of the investments or assets of a Fund is determined as follows:
a) Cash and Other Assets
Cash, accounts receivable, dividends receivable, distributions receivable, and interest receivable are valued at fair value or at their recorded cost, plus or minus any foreign exchange between recognition of the assetby the Fund and the current Valuation Date, which approximates fair value.
b) Bonds, Debentures, and Other Debt Obligations
Bonds, debentures, and other debt obligations are fair valued using the last traded price provided by a recognized vendor upon the close of trading on a Valuation Date, whereby the last traded price falls within thatday’s bid-ask spread. If the last traded price does not fall within that day’s bid-ask spread, then the Manager will determine the price that is most representative of fair value based on the specific facts andcircumstances.
c) Listed Securities, Unlisted Securities, and Fair Value Pricing of Foreign Securities
Any security that is listed or traded on a securities exchange is fair valued using the last traded price, whereby the last traded price falls within that day’s bid-ask spread or, if there is no traded price on that exchangeor the last traded price does not fall within that day’s bid-ask spread and in the case of securities traded on an OTC market, at the fair value as determined by the Manager as an appropriate basis for valuation. In suchsituations, a fair value will be determined by the Manager to establish current value. If any securities are inter-listed or traded on more than one exchange or market, the Manager will use the principal exchange ormarket for the fair value of such securities.
Units of each mutual fund in which a Fund invests will be valued at fair value using the most recent net asset value quoted by the Trustee or Manager of the mutual fund on the Valuation Date.
Unlisted securities are fair valued using the last traded price quoted by a recognized dealer, or the Manager may determine a price that more accurately reflects the fair value of these securities if the Manager feelsthe last traded price does not reflect fair value.
Fair value pricing is designed to avoid stale prices and to provide a more accurate fair value, and may assist in the deterrence of harmful short-term or excessive trading in the Fund. When securities listed or traded onmarkets or exchanges that close prior to North or South American markets or exchanges are valued by the Manager at their fair market value, instead of using quoted or published prices, the prices of such securitiesused to calculate the Fund’s net assets or net asset value may differ from quoted or published prices of such securities.
d) Derivatives
Long positions in options, debt-like securities, and listed warrants are valued at fair value using the last traded price as established on either their principal trading exchange or by a recognized dealer in such securities,whereby the last traded price falls within that day’s bid-ask spread and the credit rating of each counterparty (as rated by S&P Global Ratings, a division of S&P Global) meets or exceeds the minimum approved creditrating.
When any option is written by any Fund, the premium received by the Fund will be reflected as a liability that will be valued at an amount equal to the current fair value of the option that would have the effect ofclosing the position. Any difference resulting from revaluation shall be treated as an unrealized gain or loss on investment; the liability shall be deducted in arriving at the net assets attributable to holders ofredeemable units of the Fund. The securities that are the subject of a written option, if any, will be valued in the manner described above for listed securities.
Futures contracts, forward contracts, or swaps will be valued at fair value of the gain or loss, if any, that would be realized on the Valuation Date if the position in the futures contracts, forward contracts, or swapswere to be closed out.
Margin paid or deposited in respect of futures contracts and forward contracts will be reflected as an account receivable and margin consisting of assets other than cash will be noted as held as collateral.
Other derivatives and margin are fair valued in a manner that the Manager determines to represent their fair value.
e) Restricted Securities
Restricted securities purchased by any Fund will be fair valued in a manner that the Manager determines to represent their fair value.
f) Other Investments
All other investments of the Funds will be fair valued in accordance with the laws of the Canadian securities regulatory authorities, where applicable.
The value of any security or other property of a Fund for which a market quotation is not readily available or where the market quotations do not properly reflect the fair value of such securities will be determined bythe Manager by valuing the securities at their fair value. In such situations, fair value will be determined using the fair valuation technique that most accurately reflects the fair value as established by the Manager.
4. Interest in Underlying Funds
The Funds may invest in other investment funds (Underlying Funds). Each Underlying Fund invests in a portfolio of assets to generate returns in the form of investment income and capital appreciation for itsunitholders. Each Underlying Fund finances its operations primarily through the issuance of redeemable units, which are puttable at the unitholder's option and entitle the unitholder to a proportionate share of theunderlying fund's net assets. The Fund's interests in Underlying Funds held in the form of redeemable units, are reported in its Schedule of Investments at fair value, which represents the Funds’ maximum exposure onthose investments. The Funds' interests in underlying funds as at the prior year period ends are presented in the Financial Instruments Risks - Concentration Risk section in the Supplemental Schedule to Schedule ofInvestment Portfolio. Distributions earned from Underlying Funds are included in “Investment Income” in the Statements of Comprehensive Income. The total realized and change in unrealized gains (losses) arisingfrom Underlying Funds are also included in the Statement of Comprehensive Income. The Funds do not provide any additional significant financial or other support to Underlying Funds.
Where applicable, the table “Interests in Underlying Funds” presented as part of the Supplemental Schedule to Schedule of Investment Portfolio, provides additional information on the Funds’ investments inUnderlying Funds where the ownership interest exceeds 20% of each Underlying Fund.
15
Notes to Financial Statements (unaudited) p / 5
5. Redeemable Units Issued and Outstanding
Each Fund is permitted to have an unlimited number of classes of units and may issue an unlimited number of units of each class. The outstanding units represent the capital of a Fund. Each unit has no par value andthe value of each unit is the net assets attributable to holders of redeemable units per unit next determined. Settlement of the cost for units issued is completed as per security regulations in place at the time of issue.Distributions made by a Fund and reinvested by unitholders in additional units also constitute issued redeemable units of a Fund.
Units are redeemed at the net assets attributable to holders of a redeemable unit per unit of a Fund. A right to redeem units of a Fund may be suspended with the approval of the Canadian securities regulatoryauthorities or when normal trading is suspended on a stock, options, or futures exchange within Canada or outside of Canada on which securities or derivatives that make up more than 50% of the value or underlyingexposure of the total assets of a Fund, not including any liabilities of a Fund, are traded and when those securities or derivatives are not traded on any other exchange that represents a reasonably practical alternativefor a Fund. The Fund is not subject to any externally imposed capital requirements.
The capital received by a Fund is utilized within the respective investment mandate of the Fund. This includes the ability to make liquidity available to satisfy unitholder unit redemption requirements upon theunitholder’s request.
Changes in issued and outstanding units for the six-month periods ended June 30, 2016 and 2015 can be found on the Statements of Changes in Net Assets Attributable to Holders of Redeemable Units.x
6. Management Fees and Operating Expenses
Management fees are based on the net asset value of the Funds and are calculated daily. Management fees are paid to the Manager in consideration for providing, or arranging for the provision of, management,distribution, and portfolio advisory services. The maximum annual management fee expressed as a percentage of the average net asset value that can be charged by a Fund is reported in footnote MaximumChargeable Annual Management Fee Rates on the Statements of Comprehensive Income.
In addition to the management fees, the Funds are responsible for all expenses relating to the operation and conduct of the business of the Funds, which may include interest, operating, and administrative costs (otherthan advertising and promotional expenses, which are the responsibility of the Manager), brokerage fees, commissions, spreads, regulatory fees, Independent Review Committee fees, taxes, audit and legal fees andexpenses, safekeeping and custodial fees, investor servicing costs, and costs of unitholder reports, prospectuses, and other reports. All such operating expenses are paid by the Manager and recovered from the Funds.The Funds do not pay a fee to the Trustee.
The Manager may recover less than the actual operating expenses paid by the Manager, resulting in the Manager absorbing expenses. The Manager may also charge to a Fund less than the maximum managementfee in footnote Maximum Chargeable Annual Management Fee Rates on the Statements of Comprehensive Income, resulting in the Manager waiving management fees.
At its sole discretion, the Manager may stop absorbing operating expenses and/or waiving management fees at any time. Operating expenses absorbed and/or management fees waived by the Manager are disclosedon the Statements of Comprehensive Income.
In some cases, the Manager may charge management fees to a Fund that are less than the management fees the Manager is entitled to charge in respect of certain investors in a Fund. The difference in the amount ofthe management fees will be paid out by the Fund to the applicable investors as a distribution of additional units of the Fund (Management Fee Distributions). Management Fee Distributions are negotiable betweenthe Manager and the investor and are dependent primarily on the size of the investor’s investment in the Fund. Management Fee Distributions paid to qualified investors do not adversely impact the Fund or any of theFund’s other investors. The Manager may increase or decrease the amount of Management Fee Distributions to certain investors from time to time.
Where a Fund invests in units of an Underlying Fund, the Fund does not pay duplicate management fees on the portion of its assets that it invests in units of the Underlying Fund. In addition, the Fund will not payduplicate sales fees or redemption fees with respect to the purchase or redemption by it of units of the Underlying Fund. Some of the Underlying Funds held by the Funds may offer Management Fee Distributions. SuchManagement Fee Distributions of an Underlying Fund will be paid out as required for taxable distribution payments by a Fund. The manager of an Underlying Fund may, in some cases, waive a portion of an UnderlyingFund’s management fee and/or absorb a portion of an Underlying Fund’s operating expenses.
7. Income Taxes and Withholding Taxes
The Funds qualify as mutual fund trusts under the Income Tax Act (Canada). No income tax is payable by the Funds on net income and/or net realized capital gains that are distributed to unitholders. In addition, incometaxes payable on undistributed net realized capital gains are refundable on a formula basis when units of the Funds are redeemed. Sufficient net income and realized capital gains of the Funds have been, or will be,distributed to the unitholders such that no tax is payable by the Funds and, accordingly, no provision for income taxes has been made in the financial statements. Occasionally, a Fund may pay distributions in excess ofthe net income and net realized capital gains of the Fund. This excess distribution is called a return of capital and is non-taxable to the unitholder. However, a return of capital reduces the average cost of theunitholder’s units for tax purposes, which may result in a capital gain to the unitholder to the extent the average cost becomes less than zero.
Non-capital losses that arose in 2006 and thereafter are available to be carried forward for 20 years.
Capital losses for income tax purposes may be carried forward indefinitely and applied against capital gains realized in future years. Where applicable, a Fund’s net capital and non-capital losses are reported infootnote Net Capital and Non-Capital Losses on the Statements of Changes in Net Assets Attributable to Holders of Redeemable Units.
The Funds have a taxation year-end of December 15 (except Imperial Money Market Pool, which has a taxation year-end of December 31).
The Funds currently incur withholding taxes imposed by certain countries on investment income and capital gains. Such income and gains are recorded on a gross basis and the related withholding taxes are shown asa separate expense in the Statements of Comprehensive Income.
8. Brokerage Commissions and Fees
The total commissions paid by the Funds to brokers in connection with portfolio transactions are reported in footnote Brokerage Commissions and Fees on the Statements of Comprehensive Income of each Fund. Inallocating brokerage business to a dealer, consideration may be given by the portfolio sub-advisors of the Funds for the provision of goods and services by the dealer or a third party, other than order execution (referredto in the industry as “soft dollar” arrangements). These goods and services are paid for with a portion of brokerage commissions and assist the portfolio sub-advisors with their investment decision-making services tothe Funds or relate directly to executing portfolio transactions on behalf of the Funds. The total soft dollar payments paid by the Funds to brokers are reported in footnote Brokerage Commissions and Fees on theStatements of Comprehensive Income of each Fund. In addition, the Manager may enter into commission recapture arrangements with certain dealers with respect to the Fund. Any commission recaptured will be paidto the applicable Fund.
Fixed income and certain other securities are transacted in an OTC market, where participants are dealing as principals. Such securities are generally traded on a net basis and do not normally involve brokeragecommissions, but will typically include a “spread” (being the difference between the bid and the offer prices on the security of the applicable marketplace).
Spreads associated with fixed income securities trading and certain other securities are not ascertainable and, for that reason, are not included in the dollar amounts. In addition, the soft dollar amounts only includethe value of research and other services supplied by a third party to CIBC Asset Management Inc. (CAMI or the Portfolio Advisor) and any portfolio sub-advisors, as the value of the services supplied to the PortfolioAdvisor and any portfolio sub-advisors by the dealer is not ascertainable. When these services benefit more than one Fund, the costs are allocated among the Funds based on transaction activity or some other fairbasis as determined by the Portfolio Advisor and any portfolio sub-advisors.x
9. Related Party Transactions
CIBC and its affiliates have the following roles and responsibilities with respect to the Funds and receive the fees described below in connection with their roles and responsibilities. The Funds may hold securities ofCIBC. CIBC and its affiliates may also be involved in underwriting or lending to issuers of securities that may be held by the Funds, have purchased or sold securities from or to the Funds while acting as principal, havepurchased or sold securities from or to the Funds on behalf of another investment fund managed by CIBC or an affiliate, and also may have been involved as a counterparty to derivative transactions. Management feespayable and other accrued expenses on the Statements of Financial Position are amounts generally payable to a related party of the Fund.
Manager, Trustee, Portfolio Advisor, and certain Portfolio Sub-Advisors of the Funds
CIBC is the Manager, CIBC Trust Corporation is the Trustee, and CAMI is the Portfolio Advisor of each of the Funds. American Century Investment Management, Inc. (ACI) is a portfolio sub-advisor to certain Funds.Although not an affiliate, CIBC had previously owned a 41% equity interest in ACI. On December 21, 2015, CIBC announced that it entered into a definitive agreement to sell its minority position in ACI. The sale wascompleted on May 19, 2016.
The Manager also arranges for fund administrative services (other than advertising and promotional, which are the responsibility of the Manager), legal, investor servicing, and costs of unitholder reports,prospectuses, and other reports. The Manager is the registrar and transfer agent for the Funds and provides, or arranges for the provision of, all other administrative services required by the Funds. The dollar amount
16
p / 6 Notes to Financial Statements (unaudited)
(including all applicable taxes) of all fund administrative expenses (net of absorptions) that the Manager recovers from a Fund is reported in footnote Administrative and Other Fund Operating Expenses on theStatements of Comprehensive Income.
Brokerage Arrangements and Soft Dollars
The Portfolio Advisor generally delegates trading and execution authority to the portfolio sub-advisors. Where applicable, disclosure of the amounts of soft dollars can be found in the Brokerage Commission andFees schedule on the Statements of Comprehensive Income for each Fund.
The Portfolio Advisor and portfolio sub-advisors make decisions, including the selection of markets and dealers and the negotiation of commissions, with respect to the purchase and sale of portfolio securities, certainderivative products (including futures and forwards), and the execution of portfolio transactions. Brokerage business may be allocated by the Portfolio Advisor and portfolio sub-advisors to CIBC World Markets Inc. andor CIBC World Markets Corp., each a subsidiary of CIBC. The total commissions paid to related brokers in connection with portfolio transactions are reported in footnote Brokerage Commissions and Fees on theStatements of Comprehensive Income of each Fund.
CIBC World Markets Inc. and CIBC World Markets Corp. may also earn spreads on the sale of fixed income and other securities, and certain derivative products (including futures and forwards) to the Funds. Dealers,including CIBC World Markets Inc. and CIBC World Markets Corp., may furnish goods and services, other than order execution, to the Portfolio Advisor and portfolio sub-advisors that process trades through them(referred to in the industry as “soft dollar” arrangements). These goods and services are paid for with a portion of brokerage commissions and assist the Portfolio Advisor and portfolio sub-advisors with theirinvestment decision-making services to the Fund or relate directly to executing portfolio transactions on behalf of the Fund. As per terms of the portfolio sub-advisory agreements, such soft dollar arrangements are incompliance with applicable laws. Custodial fees directly related to portfolio transactions incurred by a Fund, otherwise payable by the Fund, shall be paid by CAMI, and/or dealer(s) directed by CAMI, up to the amountof the credits generated under soft dollar arrangements from trading on behalf of the Fund, or a portion of the Fund, during that month. The total soft dollar payments paid by the Fund to related brokers are reported infootnote Brokerage Commissions and Fees on the Statements of Comprehensive Income of each Fund. In addition, the Manager may enter into commission recapture arrangements with certain dealers with respect tothe Funds. Any commission recaptured will be paid to the relevant Fund.
Custodian
The custodian holds all cash and securities for the Funds and ensures that those assets are kept separate from any other cash or securities that the custodian might be holding. The custodian also provides otherservices to the Funds including record keeping and processing of foreign exchange transactions. CIBC Mellon Trust Company is the custodian of the Funds (the Custodian). The Custodian may hire sub-custodians forthe Funds. The fees and spreads for services of the Custodian directly related to the execution of portfolio transactions by a Fund, or a portion of a Fund, are paid by CAMI and/or dealer(s) directed by CAMI up to theamount of the credits generated under soft dollar arrangements from trading on behalf of the Funds during that month. All other fees for the services of the Custodian are paid by the Manager, and charged tothe Funds on a recoverable basis. CIBC owns a 50% interest in CIBC Mellon Trust Company.
Service Provider
CIBC Mellon Global Securities Services Company (CIBC GSS) provides certain services to the Funds, including securities lending, fund accounting and reporting, and portfolio valuation. Such servicing fees are paid bythe Manager and charged to the Funds on a recoverable basis. CIBC indirectly owns a 50% interest in CIBC GSS.
The dollar amount paid by the Funds (including all applicable taxes) to CIBC Mellon Trust Company for custodial fees (net of absorptions) and to CIBC GSS for securities lending, fund accounting and reporting, andportfolio valuation (net of absorptions) for the six-month periods ended June 30, 2016 and 2015 is reported in footnote Service Provider on the Statements of Comprehensive Income.
10. Hedging
Certain foreign currency denominated positions have been hedged, or partially hedged, by forward foreign currency contracts as part of the investment strategies of certain Pools. These hedges are indicated by ahedging reference number on the Schedule of Investment Portfolio and a corresponding hedging reference number on the Schedule of Derivative Assets and Liabilities Forward Foreign Currency Contracts for thosePools.
11. Collateral on Specified Derivatives
Short-term investments may be used as collateral for futures contracts outstanding with brokers.x