70
ICAO Address City, Country, Code Implementation Manual for the Universal Access Transceiver (UAT) Revision 1.2 31 January 2005 Document # Prepared by: DD MM YYYY © 2004.

ICAO
Address City, Country, Code
Implementation Manual for the Universal Access Transceiver (UAT)
Revision 1.2 31 January 2005
Document # Prepared by: DD MM YYYY © 2004.

Change Record
Date/Version Change 21 July 2003/v0.1 Original Draft
20 February 2004/v0.2 As prepared for review for the UAT Subgroup meeting in Montreal, 1-4 March 2004.
4 March 2004/v0.3 As modified during the UAT Subgroup meeting in Montreal, 1-4 March 2004
12 August 2004/v0.4
a. Indicating suggestions made during ICAO ACP WG-C meeting in Montreal, 19-21 April 2004, and entering those suggestions as actions, highlighted in yellow,
b. incorporating other material as completions of action items, highlighted in yellow, and
c. generally preparing the document for review for the UAT Subgroup meeting in Madrid, 15-17 September 2004.
17 September 2004/v0.5 Review of the status of action items and discussion during the UAT Subgroup meeting in Madrid, 15-17 September 2004.
16 November 2004/v1.0
As agreed to in the Minutes of WG-C Meeting in Munich, the revision level was set to v1.0 after no comments were received from WG-C members. Version 1.0 was the document going into the review during the UAT Subgroup meeting in Montreal, 16-18 November 2004.
18 November 2004/v1.1
Action Item completions were included and highlighted in yellow for the benefit of review by the UAT Subgroup during the meeting in Montreal, 16-18 November. The UAT Subgroup performed detailed page-by-page reviews and made numerous editorial changes and modifications of Action Items as reflected in Version 1.1.
31 January 2005/v1.2 Add an Action Item in §7.2 for Larry Bachman to include a table that shows separation distance as a function of DME/TACAN power.
i
TABLE OF CONTENTS
1 INTRODUCTION .............................................................................................................................. 11
1.1 OUTLINE OF THE MANUAL .............................................................................................................. 11 1.2 OBJECTIVE AND SCOPE.................................................................................................................... 12 1.3 DEFINITIONS ..................................................................................................................................... 12
2 OPERATING CONCEPTS ............................................................................................................... 15
2.1 APPLICATIONS SUPPORTED............................................................................................................. 15 2.1.1 AUTOMATIC DEPENDENT SURVEILLANCE –BROADCAST (ADS-B) ............................................... 15 2.1.2 GROUND UPLINK SERVICES............................................................................................................ 15 2.1.3 UAT BROADCAST CONNECTIVITY ................................................................................................. 16 2.2 FREQUENCY CHANNEL AND WAVEFORM DESCRIPTION............................................................... 17 2.3 TIMING STRUCTURE AND MEDIUM ACCESS................................................................................... 18 2.3.1 UAT ADS-B MESSAGE TRANSMISSION BY AIRCRAFT .................................................................. 19 2.3.2 GROUND UPLINK SERVICES............................................................................................................ 20 2.4 BASIC AVIONICS OPERATION AND EQUIPAGE LEVELS ................................................................. 20 2.4.1 AVIONICS OPERATING CONCEPT .................................................................................................... 20 2.4.2 EXAMPLES OF UAT EQUIPAGE CLASSES........................................................................................ 21 2.4.2.1 Transmitting Subsystem .............................................................................................................. 25 2.4.2.2 Receiving Subsystem................................................................................................................... 25 2.5 GROUND STATION OPERATION ....................................................................................................... 25
3 SCHEDULING OF UAT ADS-B MESSAGES................................................................................ 28
3.1 PAYLOAD SELECTION CYCLE.......................................................................................................... 28 3.1.1 ADS-B PAYLOAD TYPE ALLOCATION............................................................................................ 28 3.1.2 MESSAGE TRANSMISSION CYCLE................................................................................................... 28
4 UAT TRANSMITTER INPUT REQUIREMENTS ........................................................................ 30
5 UAT AIRCRAFT INSTALLATION GUIDANCE.......................................................................... 32
5.1 AIRCRAFT MUTUAL SUPPRESSION BUS .......................................................................................... 32 5.2 UAT SUPPRESSION PULSE IMPACT ON COSITE SSR, TCAS/ACAS AND DME PERFORMANCE 32 5.2.1 ANALYSIS OF IMPACT ON DME...................................................................................................... 33 5.2.2 ANALYSIS OF IMPACT ON TCAS/ACAS......................................................................................... 33 5.2.3 ANALYSIS OF IMPACT ON SSR TRANSPONDERS............................................................................. 34 5.3 SHARING ANTENNAS WITH SSR TRANSPONDER............................................................................. 34 5.3.1 OPTIONAL DIPLEXER REQUIREMENTS............................................................................................ 35 5.3.1.1 The UAT Diplexer Channel ........................................................................................................ 35 5.3.1.2 The Transponder Diplexer Channel............................................................................................. 36
ii
5.3.1.3 UAT Diplexer Channel to Transponder Diplexer Channel Isolation .......................................... 36 5.4 COMPATIBILITY WITH SSR IF NOT SHARING ANTENNAS............................................................. 37 5.5 DELIVERY OF TIMING SIGNALS TO THE UAT SYSTEM ................................................................. 37 5.5.1 BACKGROUND................................................................................................................................. 37 5.5.2 INSTALLED END-END TIMING PERFORMANCE ............................................................................... 37 5.5.3 UAT TIMING REQUIREMENTS ........................................................................................................ 39 5.5.4 CONSIDERATIONS FOR ADS-B VALIDATION TECHNIQUES ............................................................ 40
6 UAT GROUND INFRASTRUCTURE............................................................................................. 42
6.1 GENERAL DESCRIPTION .................................................................................................................. 42 6.1.1 UPLINK: BROADCAST ..................................................................................................................... 42 6.1.1.1 Geometric Coverage .................................................................................................................... 42 6.1.1.1.1 Radio Coverage ........................................................................................................................ 42 6.1.1.1.2 FIS-B Product Coverage........................................................................................................... 43 6.1.1.1.3 TIS-B Product Coverage .......................................................................................................... 44 6.1.1.2 Data Source for Ground Broadcast.............................................................................................. 44 6.1.2 DOWNLINK: SURVEILLANCE........................................................................................................... 45 6.1.3 SUMMARY OF INFRASTRUCTURE AND IMPLICATIONS .................................................................... 45 6.2 GROUND STATION DEPLOYMENT ................................................................................................... 46 6.2.1 TIME SLOTS AND “CHANNELS” ...................................................................................................... 46 6.2.2 ANTENNA CONSIDERATIONS FOR UPLINK...................................................................................... 47 6.2.3 TIS-B SITE IDENTIFIER (ID) ........................................................................................................... 49 6.2.4 SECTORIZED CELLS AND CO-SITE TRANSMISSION ISOLATION ...................................................... 51 6.3 RF INTERFERENCE........................................................................................................................... 52 6.3.1 JTIDS INTERFERENCE..................................................................................................................... 53 6.3.2 DME INTERFERENCE ...................................................................................................................... 53 6.4 MULTIPLE ADS-B LINKS................................................................................................................. 54
7 UAT FREQUENCY PLANNING CRITERIA ................................................................................ 55
7.1 USE OF 978 MHZ FOR DME/TACAN IN LOW-LEVEL UAT ENVIRONMENTS ............................. 55 7.2 DME/TACAN TO UAT GROUND STATION SITING CRITERIA...................................................... 55 7.3 UAT GROUND STATION CHANNEL ASSIGNMENT GUIDANCE ....................................................... 56 7.3.1 INTRODUCTION ............................................................................................................................... 56 7.3.2 IDEAL CASE .................................................................................................................................... 56 7.3.2.1 Alternative View of Ideal Case.................................................................................................... 59 7.3.2.2 Alternative URA Assignments .................................................................................................... 62 7.3.3 EXEMPLARY DEPLOYMENT ............................................................................................................ 62 7.3.3.1 An Implementation Example....................................................................................................... 63
8 POTENTIAL FUTURE SERVICES OF UAT................................................................................. 66
A. ACRONYMS & DEFINITION OF TERMS................................................................................... 3
A.1 ACRONYMS......................................................................................................................................... 3 A.2 DEFINITION OF TERMS...................................................................................................................... 7
iii
B UAT SYSTEM PERFORMANCE SIMULATION RESULTS ....................................................... 3
B.1 INTRODUCTION .................................................................................................................................. 3 B.1.1 ORGANIZATION ................................................................................................................................ 3 B.1.2 BACKGROUND .................................................................................................................................. 3 B.1.3 GENERAL ASSUMPTIONS.................................................................................................................. 4 B.1.4 UAT DETAILED SIMULATION DESCRIPTION AND LIMITATIONS...................................................... 4 B.2 TLAT ANTENNA MODEL .................................................................................................................. 6 B.3 RECEIVER PERFORMANCE MODEL.................................................................................................. 8 B.3.1 MEASURED DATA ............................................................................................................................ 8 B.3.2 RECEIVER MODEL ASSUMPTIONS .................................................................................................. 12 B.3.3 RECEIVER MODEL ACCURACY ...................................................................................................... 15 B.4 MULTI-AIRCRAFT SIMULATION (MAUS) RESULTS...................................................................... 19 B.4.1 LOS ANGELES BASIN 2020 (LA2020) ............................................................................................ 19 B.4.2 CORE EUROPE SCENARIOS ............................................................................................................. 35 B.4.2.1 Current Core Europe ................................................................................................................... 36 B.4.2.2 Core Europe 2015 ....................................................................................................................... 60 B.4.3 LOW DENSITY SCENARIO............................................................................................................... 73 B.4.4 ACQUISITION PERFORMANCE......................................................................................................... 75 B.4.5 SURFACE PERFORMANCE ............................................................................................................... 76 B.4.6 AN A0 ON THE SURFACE RECEIVING AN AIRCRAFT THAT IS ON APPROACH................................. 86 B.5 MODEL VALIDATION....................................................................................................................... 87
C STANDARD INTERFERENCE ENVIRONMENT......................................................................... 3
C.1 BACKGROUND.................................................................................................................................... 3 C.2 OPERATIONAL ENVIRONMENTS ....................................................................................................... 3 C.3 CO-SITE ENVIRONMENT ................................................................................................................... 6 C.4 SCENARIO ASSESSMENTS.................................................................................................................. 7
D. UAT RECEIVER PERFORMANCE IN THE PRESENCE OF JTIDS/MIDS, DME/TACAN AND SELF-INTERFERENCE.................................................................................................................. 3
D.1 INTRODUCTION.................................................................................................................................. 3 D.2 PRE-PRODUCTION TESTING ............................................................................................................. 3 D.2.1 DME/TACAN TESTING................................................................................................................... 3 D.2.2 JTIDS/MIDS TESTING................................................................................................................... 11 D.2.3 UAT SELF-INTERFERENCE TESTING.............................................................................................. 12 D.2.4 COMBINED INTERFERENCE TESTING ............................................................................................. 12 D.3 PRODUCTION TESTING.................................................................................................................... 12 D.3.1 DME/TACAN TESTING................................................................................................................. 12 D.3.2 UAT SELF-INTERFERENCE TESTING.............................................................................................. 13 D.3.3 COMBINED INTERFERENCE TESTING ............................................................................................. 13 D.4 SUMMARY ........................................................................................................................................ 13
E UAT ERROR DETECTION AND CORRECTION PERFORMANCE ........................................ 3
F. DME OPERATION IN THE PRESENCE OF UAT SIGNALS..................................................... 3

iv
G. EXAMPLE ADS-B MESSAGE ENCODING.................................................................................. 3
G.1 REED SOLOMON ENCODING OF MESSAGE PAYLOAD..................................................................... 3 G.2 REED SOLOMON ENCODING OF BASIC TYPE 0 ADS-B MESSAGE PAYLOAD................................ 3 G.3 REED SOLOMON ENCODING OF LONG TYPE 1 ADS-B MESSAGE PAYLOAD ................................ 5
H. AIRCRAFT ANTENNA CHARACTERISTICS............................................................................. 3
H.1 ANTENNA CHARACTERISTICS .......................................................................................................... 3 H.1.1 GENERAL CHARACTERISTICS .......................................................................................................... 3 H.1.2 RADIATION PATTERNS..................................................................................................................... 3 H.1.3 DIRECTIONAL GAIN RADIATION PATTERNS .................................................................................... 3 H.2 TYPICAL VSWR MEASUREMENTS OF EXISTING TRANSPONDER / DME ANTENNAS................... 5 H.2.1 SENSOR SYSTEMS L BAND BLADE ANTENNA P/N S65-5366-7L .................................................... 7 H.2.2 AEROANTENNA P/N AT-130-1........................................................................................................ 7 H.2.3 ¼ WAVE WHIP ANTENNA ................................................................................................................ 7 H.3 PASSIVE ANTENNA DIPLEXER CHARACTERISTICS ......................................................................... 8 H.3.1 ANTENNA DIPLEXER TESTING ......................................................................................................... 9 H.3.1.1 SSR Transponder Testing ............................................................................................................. 9 H.3.1.2 UAT Diplexer Testing ................................................................................................................ 12 H.3.1.3 Prototype Diplexer Performance ................................................................................................ 13 H.3.2 TYPICAL INSTALLATION DIAGRAM ............................................................................................... 16
I. SIMULATED RESULTS FOR DELIVERY OF FOUR TRAJECTORY CHANGE REPORTS OVER UAT IN CORE EUROPE 2015 ..................................................................................................... 3
I.1 INTRODUCTION ................................................................................................................................... 3 I.2 INTENT RESULTS USING FOUR-SECOND EPOCH .............................................................................. 3 I.3 INTENT RESULTS USING FIVE SECOND EPOCH ................................................................................ 5
LIST OF FIGURES Figure 2-1: UAT Connectivity.................................................................................................................... 16 Figure 2-2: UAT Frame .............................................................................................................................. 19 Figure 2-3: High Level Function of UAT Avionics ................................................................................... 20 Figure 2-4: UAT Ground Station Simplified Block Diagram..................................................................... 26 Figure 3-2: Transmitter Antenna Use for Diversity Installations ............................................................... 29 Figure 6-1: Example Coverage Cell Layout ............................................................................................... 43 Figure 6-2: General Form of Ground Infrastructure ................................................................................... 46 Figure 6-3: 7-Cell Re-Use Pattern .............................................................................................................. 47 Figure 6-4: Self-Interference with Low-Gain Antenna............................................................................... 48 Figure 6-5: Self-Interference with DME-Type Antenna............................................................................. 49 Figure 6-6: Example of TIS-B Site ID and Channel................................................................................... 50 Figure 6-7: Sectorized Antenna Pattern (3 sectors) .................................................................................... 52 Figure 6-8: Possible UAT Ground Station Antenna Geometries................................................................ 52 Figure 7-1: Basic Pattern (4)...................................................................................................................... 58 Figure 7-2: The (4, 4) Pattern ..................................................................................................................... 59 Figure 7-3: Tier 3 of Pattern (4, 3, 3).......................................................................................................... 60 Figure 7-4: Tiers 2 and 3 of Pattern (4, 3, 3) .............................................................................................. 61
v
Figure 7-5: Complete Pattern (4, 3, 3) ........................................................................................................ 61 Figure 7-6: East Coast Coverage at 40000’ AMSL .................................................................................... 64 Figure 7-7: East Coast Coverage at 10000’ AGL ....................................................................................... 64 Figure 7-8: East Coast Coverage at 3000’ AGL ......................................................................................... 65 Figure A-1: Ideal eye diagram ...................................................................................................................... 9 Figure A-2: Distorted eye diagram ............................................................................................................... 9 Figure B-1: TLAT Antenna Model Elevation Gain...................................................................................... 7 Figure B-2: TLAT Random Azimuth Gain................................................................................................... 8 Figure B-3: Test Setup for measuring BER .................................................................................................. 9 Figure B-4: BER Due to DME interference................................................................................................ 11 Figure B-5: BER Due to DME Interference ............................................................................................... 11 Figure B-6: Link 16 Interference ................................................................................................................ 12 Figure B-7: Assumed Piecewise Linear llBER Vs. SINR Curve (Typical)................................................ 13 Figure B-8: BER Vs. SINR Curve Corresponding to Figure B-7............................................................... 13 Figure B-9: Gaussian Noise + Single UAT, 1.2 MHz Receiver ................................................................. 16 Figure B-10: Gaussian Noise + Two Equal UATs, 1.2 MHz Receiver ...................................................... 16 Figure B-11: Two Unequal UATs, INR >> 0 dB, 0.8 MHz Receiver ........................................................ 17 Figure B-12: N Equal UATs, INR >> 0, 0.8 MHz Receiver ...................................................................... 17 Figure B-13 Model Errors for All Data, 1.2 MHz Receiver ....................................................................... 18 Figure B-14: Model Errors for All Data, 0.8 MHz Receiver ...................................................................... 18 Figure B-15: A3 Receiver in LA2020 at High Altitude Receiving A3 Transmissions............................... 21 Figure B-16: A3 Receiver in LA2020 at High Altitude Receiving A2 Transmissions............................... 21 Figure B-17: A3 Receiver in LA2020 at High Altitude Receiving A1H Transmissions............................ 22 Figure B-18: A3 Receiver in LA2020 at FL 150 Receiving A3 Transmissions ......................................... 22 Figure B-19: A3 Receiver in LA2020 at FL 150 Receiving A2 Transmissions ......................................... 23 Figure B-20: A3 Receiver in LA2020 at FL 150 Receiving A1 and A0 Transmissions ............................ 23 Figure B-21: A2 Receiver in LA2020 at High Altitude Receiving A3 Transmissions............................... 24 Figure B-22: A2 Receiver in LA2020 at High Altitude Receiving A2 Transmissions............................... 24 Figure B-23: A2 Receiver in LA2020 at High Altitude Receiving A1H Transmissions............................ 25 Figure B-24: A2 Receiver in LA2020 at FL 150 Receiving A3 Transmissions ......................................... 25 Figure B-25: A2 Receiver in LA2020 at FL 150 Receiving A2 Transmissions ......................................... 26 Figure B-26: A2 Receiver in LA2020 at FL 150 Receiving A1 and A0 Transmissions ............................ 26 Figure B-27: A1H Receiver in LA2020 at High Altitude Receiving A3 Transmissions............................ 27 Figure B-28: A1H Receiver in LA2020 at High Altitude Receiving A2 Transmissions............................ 27 Figure B-29: A1H Receiver in LA2020 at High Altitude Receiving A1H Transmissions......................... 28 Figure B-30: A1 Receiver in LA2020 at FL 150 Receiving A3 Transmissions ......................................... 28 Figure B-31: A1 Receiver in LA2020 at FL 150 Receiving A2 Transmissions ......................................... 29 Figure B-32: A1 Receiver in LA2020 at FL 150 Receiving A1 and A0 Transmissions ............................ 29 Figure B-33: A0 Receiver in LA2020 at FL 150 Receiving A3 Transmissions ......................................... 30 Figure B-34: A0 Receiver in LA2020 at FL 150 Receiving A2 Transmissions ......................................... 30 Figure B-35: A0 Receiver in LA2020 at FL 150 Receiving A1 and A0 Transmissions ............................ 31 Figure B-36: Ground Receiver in LA2020 Receiving A3 Transmissions .................................................. 31 Figure B-37: Ground Receiver in LA2020 Receiving A2 Transmissions .................................................. 32 Figure B-38: Ground Receiver in LA2020 Receiving A1 and A0 Transmissions...................................... 32 Figure B-39: Ground Receiver in LA with Sectorized Antenna with a 10 kW TACAN at 980
MHz located 1000' away................................................................................................... 33 Figure B-40: Standard Ground Receiver in LA with TACAN that delivers –90 dBm at 980 MHz
to the UAT Ground Antenna ............................................................................................ 33 Figure B-41: State Vector Updates from Ground Vehicle Transmitters for all Types of Receivers
at 2000 feet Altitude ......................................................................................................... 34 Figure B-42: A3 Receiver at High Altitude in Current Europe Receiving A3 Transmissions ................... 37 Figure B-43: A3 Receiver at High Altitude in Current Europe Receiving A2 Transmissions ................... 38 Figure B-44: A3 Receiver at High Altitude in Current Europe Receiving A1H Transmissions ................ 38

vi
Figure B-45: A3 Receiver at FL 150 in Current Europe Receiving A3 Transmissions.............................. 39 Figure B-46: A3 Receiver at FL 150 in Current Europe Receiving A2 Transmissions.............................. 39 Figure B-47: A3 Receiver at FL 150 in Current Europe Receiving A1 and A0 Transmissions ................. 40 Figure B-48: A2 Receiver at High Altitude in Current Europe Receiving A3 Transmissions ................... 40 Figure B-49: A2 Receiver at High Altitude in Current Europe Receiving A2 Transmissions ................... 41 Figure B-50: A2 Receiver at High Altitude in Current Europe Receiving A1H Transmissions ................ 41 Figure B-51: A2 Receiver at FL 150 in Current Europe Receiving A3 Transmissions.............................. 42 Figure B-52: A2 Receiver at FL 150 in Current Europe Receiving A2 Transmissions.............................. 42 Figure B-53: A2 Receiver at FL 150 in Current Europe Receiving A1 and A0 Transmissions ................. 43 Figure B-54: A1H Receiver at High Altitude in Current Europe Receiving A3 Transmissions ................ 43 Figure B-55: A1H Receiver at High Altitude in Current Europe Receiving A2 Transmissions ................ 44 Figure B-56: A1H Receiver at High Altitude in Current Europe Receiving A1H Transmissions ............. 44 Figure B-57: A1 Receiver at FL 150 in Current Europe Receiving A3 Transmissions.............................. 45 Figure B-58: A1 Receiver at FL 150 in Current Europe Receiving A2 Transmissions.............................. 45 Figure B-59: A1 Receiver at FL 150 in Current Europe Receiving A1 and A0 Transmissions ................. 46 Figure B-60: A0 Receiver at FL 150 in Current Europe Receiving A3 Transmissions.............................. 46 Figure B-61: A0 Receiver at FL 150 in Current Europe Receiving A2 Transmissions.............................. 47 Figure B-62: A0 Receiver at FL 150 in Current Europe Receiving A1 and A0 Transmissions ................. 47 Figure B-63: A3 Receivers in the Worst-Case Current DME Position (154 equipped aircraft) at
High Altitude Receiving A3 Transmissions ..................................................................... 49 Figure B-64: A3 Receivers in the Worst-Case Current DME Position (154 equipped aircraft) at
High Altitude Receiving A2 Transmissions ..................................................................... 49 Figure B-65: A3 Receivers in the Worst-Case Current DME Position (154 equipped aircraft) at
High Altitude Receiving A1H Transmissions .................................................................. 50 Figure B-66: A3 Receiver at FL 150 in the Worst-Case Current DME Position (154 equipped
aircraft) Receiving A3 Transmissions............................................................................... 50 Figure B-67: A3 Receiver at FL 150 in the Worst-Case Current DME Position (154 equipped
aircraft) Receiving A2 Transmissions............................................................................... 51 Figure B-68: A3 Receiver at FL 150 in the Worst-Case Current DME Position (154 equipped
aircraft) Receiving A1 and A0 Transmissions.................................................................. 51 Figure B-69: A2 Receiver at High Altitude in the Worst-Case Current DME Position (154
equipped aircraft) Receiving A3 Transmissions............................................................... 52 Figure B-70: A2 Receiver at High Altitude in the Current Worst-Case DME Position (154
equipped aircraft) Receiving A2 Transmissions............................................................... 52 Figure B-71: A2 Receiver at High Altitude in the Worst-Case Current DME Position (154
equipped aircraft) Receiving A1H Transmissions ............................................................ 53 Figure B-72: A2 Receiver at FL 150 in the Worst-Case Current DME Position (154 equipped
aircraft) Receiving A3 Transmissions............................................................................... 53 Figure B-73: A2 Receiver at FL 150 in the Worst-Case Current DME Position (154 equipped
aircraft) Receiving A2 Transmissions............................................................................... 54 Figure B-74: A2 Receiver at FL 150 in the Worst-Case Current DME Position (154 equipped
aircraft) Receiving A1 and A0 Transmissions.................................................................. 54 Figure B-75: A1H Receiver at High Altitude in the Worst-Case Current DME Position (154
equipped aircraft) Receiving A3 Transmissions............................................................... 55 Figure B-76: A1H Receiver at High Altitude in the Worst-Case Current DME Position (154
equipped aircraft) Receiving A2 Transmissions............................................................... 55 Figure B-77: A1H Receiver at High Altitude in the Worst-Case Current DME Position (154
equipped aircraft) Receiving A1H Transmissions ............................................................ 56 Figure B-78: A1 Receiver at FL 150 in the Worst-Case Current DME Position (154 equipped
aircraft) Receiving A3 Transmissions............................................................................... 56 Figure B-79: A1 Receiver at FL 150 in the Worst-Case Current DME Position (154 equipped
aircraft) Receiving A2 Transmissions............................................................................... 57

vii
Figure B-80: A1 Receiver at FL 150 in the Worst-Case Current DME Position (154 equipped aircraft) Receiving A1 and A0 Transmissions.................................................................. 57
Figure B-81: A0 Receiver at FL 150 in the Worst-Case Current DME Position (154 equipped aircraft) Receiving A3 Transmissions............................................................................... 58
Figure B-82: A0 Receiver at FL 150 in the Worst-Case Current DME Position (154 equipped aircraft) Receiving A2 Transmissions............................................................................... 58
Figure B-83: A0 Receiver at FL 150 in the Worst-Case Current DME Position (154 equipped aircraft) Receiving A1 and A0 Transmissions.................................................................. 59
Figure B-84: A3 Receiver in CE2015 at High Altitude Receiving A3 Transmissions............................... 61 Figure B-85: A3 Receiver in CE2015 at High Altitude Receiving A2 Transmissions............................... 61 Figure B-86: A3 Receiver in CE2015 at High Altitude Receiving A1H Transmissions ............................ 62 Figure B-87: A3 Receiver in CE2015 at FL 150 Receiving A3 Transmissions ......................................... 62 Figure B-88: A3 Receiver in CE2015 at FL 150 Receiving A2 Transmissions ......................................... 63 Figure B-89: A3 Receiver in CE2015 at FL 150 Receiving A1 and A0 Transmissions............................. 63 Figure B-90: A2 Receiver in CE2015 at High Altitude Receiving A3 Transmissions............................... 64 Figure B-91: A2 Receiver in CE2015 at High Altitude Receiving A2 Transmissions............................... 64 Figure B-92: A2 Receiver in CE2015 at High Altitude Receiving A1 and A0 Transmissions .................. 65 Figure B-93: A2 Receiver in CE2015 at FL 150 Receiving A3 Transmissions ......................................... 65 Figure B-94: A2 Receiver in CE2015 at FL 150 Receiving A2 Transmissions ......................................... 66 Figure B-95: A2 Receiver in CE2015 at FL 150 Receiving A1 and A0 Transmissions............................. 66 Figure B-96: A1H Receiver in CE2015 at High Altitude Receiving A3 Transmissions ............................ 67 Figure B-97: A1H Receiver in CE2015 at High Altitude Receiving A2 Transmissions ............................ 67 Figure B-98: A1H Receiver in CE2015 at High Altitude Receiving A1H Transmissions ......................... 68 Figure B-99: A1 Receiver in CE2015 at FL 150 Receiving A3 Transmissions ......................................... 68 Figure B-100: A1 Receiver in CE2015 at FL 150 Receiving A2 Transmissions ....................................... 69 Figure B-101: A1 Receiver in CE2015 at FL 150 Receiving A1 and A0 Transmissions........................... 69 Figure B-102: A0 Receiver in CE2015 at FL 150 Receiving A3 Transmissions ....................................... 70 Figure B-103: A0 Receiver in CE2015 at FL 150 Receiving A2 Transmissions ....................................... 70 Figure B-104: A0 Receiver in CE2015 at FL 150 Receiving A1 and A0 Transmissions........................... 71 Figure B-105: Ground Receiver in CE2015 with 3-Sector Antenna in Brussels Receiving all
Equipage Transmissions ................................................................................................... 71 Figure B-106: Ground Receiver in CE2015 with 3-Sector Antenna in Brussels, co-located with a
979 MHz TACAN delivering –50 dBm power to antenna, Receiving All Equipage Transmissions ................................................................................................... 72
Figure B-107: Receptions of Ground Vehicle Transmissions by All Equipage Classes on Approach (at constant 2000 foot altitude) in CE2015 with 10 kW 979 MHz TACAN at Airport ............................................................................................................ 72
Figure B-108: A3 Receiver in Low Density Scenario Receiving A3 Transmissions ................................. 74 Figure B-109: Receptions of A3 Transmissions by a Standard Ground Receiver in a Low Density
Scenario co-located with a TACAN at 979 MHz with –30 dBm Power at the UAT Antenna.................................................................................................................... 75
Figure B-110: A3 Receiver on the Surface in LA2020 Scenario Receiving A3 Transmissions................. 77 Figure B-111: A3 Receiver on the Surface in LA2020 Scenario Receiving A2 Transmissions................. 78 Figure B-112: A3 Receiver on the Surface in LA2020 Scenario Receiving A1 Transmissions................. 78 Figure B-113: A3 Receiver on the Surface in LA2020 Scenario Receiving A0 Transmissions................. 79 Figure B-114: A2 Receiver on the Surface in LA2020 Scenario Receiving A3 Transmissions................. 79 Figure B-115: A2 Receiver on the Surface in LA2020 Scenario Receiving A2 Transmissions................. 80 Figure B-116: A2 Receiver on the Surface in LA2020 Scenario Receiving A1 Transmissions................. 80 Figure B-117: A2 Receiver on the Surface in LA2020 Scenario Receiving A0 Transmissions................. 81 Figure B-118: A1 Receiver on the Surface in LA2020 Scenario Receiving A3 Transmissions................. 81 Figure B-119: A1 Receiver on the Surface in LA2020 Scenario Receiving A2 Transmissions................. 82 Figure B-120: A1 Receiver on the Surface in LA2020 Scenario Receiving A1 Transmissions................. 82 Figure B-121: A1 Receiver on the Surface in LA2020 Scenario Receiving A0 Transmissions................. 83
viii
Figure B-122: A0 Receiver on the Surface in LA2020 Scenario Receiving A3 Transmissions................. 83 Figure B-123: A0 Receiver on the Surface in LA2020 Scenario Receiving A2 Transmissions................. 84 Figure B-124: A0 Receiver on the Surface in LA2020 Scenario Receiving A1 Transmissions................. 84 Figure B-125: A0 Receiver on the Surface in LA2020 Scenario Receiving A0 Transmissions................. 85 Figure B-126: A0 Receivers on the Ground in LA2020 Receiving All Aircraft on Approach at an
Altitude of 2000 feet ......................................................................................................... 86 Figure B-127: A0 Receivers on the Ground in CE2015 Receiving All Aircraft on Approach at an
Altitude of 2000 ft to Brussels co-located with a 10 kW 979 MHz TACAN................... 87 Figure B-128: Comparison of Bench Test Measurements of MOPS-Compliant UAT Reception in
LA2020 Self-Interference with Predictions by MAUS..................................................... 88 Figure B-129: Bench Test Measurements of UAT Performance in Core Europe UAT Self-
Interference, Combined with DME/TACAN and Link 16 Interference ........................... 89 Figure B-130: Bench Test Measurements of UAT Performance in the LA2020 UAT Self-
Interference, Combined with DME/TACAN and Link 16 Interference ........................... 90 Figure C-1: Sample Scenario ....................................................................................................................... 5 Figure C-2: Normalized DME Pattern .......................................................................................................... 5 Figure C-3: Normalized TACAN Pattern ..................................................................................................... 6 Figure C-4: Targets of Interest for Computing Update Interval ................................................................. 10 Figure D-1: 3 Figure D-2: 3 Figure D-3: UAT Receiver Performance DME 2700 Pulse Pairs at +2 MHz .............................................. 4 Figure D-4: UAT Basic Receiver Performance DME 2700 Pulse Pairs at +1 MHz..................................... 5 Figure D-5: UAT High Performance Receiver with DME 2700 Pulse Pairs at +1 MHz ............................. 6 Figure D-6: UAT Basic Receiver Performance DME 2700 Pulse Pairs On Frequency ............................... 6 Figure D-7: UAT High Performance Receiver DME 2700 Pulse Pairs on Frequency................................. 7 Figure D-8: UAT Basic Receiver Performance DME 3600 Pulse Pairs at +2 MHz..................................... 7 Figure D-9: UAT High Performance Receiver DME 3600 Pulse Pairs at +2 MHz ..................................... 8 Figure D-10: UAT Basic Receiver Performance DME 3600 Pulse Pairs at +1 MHz................................... 8 Figure D-11: UAT High Performance Receiver DME 3600 Pulse Pairs at +1 MHz ................................... 9 Figure D-12: UAT Basic Receiver Performance DME 3600 Pulse Pairs On Frequency ............................. 9 Figure D-13: UAT High Performance Receiver DME 3600 Pulse Pairs on Frequency............................. 10 Figure D-14: UAT Receiver Performance DME 2700 Pulse Pairs Offset in Frequency............................ 10 Figure D-15: UAT Receiver Performance TACAN 2700 and DME 3600 Pulse Pairs at +1 MHz............ 11 Figure D-16: UAT Receiver Performance with the first JTIDS/MIDS Scenario ....................................... 12 Figure E-1: Basic ADS-B Message Performance ......................................................................................... 4 Figure E-2: Long ADS-B Message Performance.......................................................................................... 4 Figure E-3: Ground Up Link Message Performance .................................................................................... 5 Figure E-4: Ground Up Link Message Undetected Message Error Rate...................................................... 6 Figure E-5: Ground Up Link Message Total Message Error Rate................................................................ 6 Figure E-6: Logical Flow of ADS-B Reception ........................................................................................... 7 Figure F-1: Bendix King KD-7000 Frequency Offset Test .......................................................................... 4 Figure F-2: Bendix King KD-7000 Reply Efficiency Test........................................................................... 5 Figure F-3: Bendix King KD-7000 CW testing: DME level –83 dBm ........................................................ 6 Figure F-4: Narco DME-890 Frequency Offset Test.................................................................................... 7 Figure F-5: Narco DME-890 Reply Efficiency Test .................................................................................... 8 Figure F-6: Narco DME-890 CW testing: DME level -75 dBm................................................................... 8 Figure F-7: Honeywell KDM-706A Frequency Offset Test......................................................................... 9 Figure F-8: Honeywell KDM-706A Reply Efficiency Test ....................................................................... 10 Figure F-9: Honeywell KDM-706A CW testing: DME level –83 dBm..................................................... 11 Figure F-10: Rockwell-Collins DME-900 Frequency Offset Test ............................................................. 11 Figure F-11: Rockwell-Collins DME-900 Reply Efficiency Test .............................................................. 12 Figure F-12: Rockwell-Collins DME-900 CW testing: DME level –83 dBm............................................ 12 Figure F-13: Comparison of all DME Frequency Offset Tests................................................................... 13

ix
Figure F-14: Comparison of all DME Reply Efficiency Tests ................................................................... 14 Figure F-15: Comparison of all DME CW Interference Tests.................................................................... 14 Figure F-16: JTIDS and UAT Combined Interference Analysis ................................................................ 16 Figure H-1: L-Band Passive Gain Antenna .................................................................................................. 4 Figure H-2: Gain Array Antenna Azimuth Pattern ...................................................................................... 5 Figure H-3: Jet Transport Antenna ............................................................................................................... 7 Figure H-4: Capstone Antenna ..................................................................................................................... 7 Figure H-5: ¼ Wave Whip Antenna ............................................................................................................. 8 Figure H-6: Sensitivity Variation with Frequency, All 1’s Interrogation, Transponder MS-1................... 12 Figure H-7: Diplexer UAT Port .................................................................................................................. 13 Figure H-8: Diplexer Transponder Port ...................................................................................................... 14 Figure H-9: Diplexer UAT-to-Transponder Port Isolation ......................................................................... 15 Figure H-10: Diplexer Installation.............................................................................................................. 16 Figure I-1: 95th Percentile Trajectory Change Report Update Times for an A3 Receiver at High
Altitude in CE 2015 over Brussels Using TC Rotation to Deliver Messages Containing Information for 3 or 4 TCRs ............................................................................ 4
Figure I-2: 95th Percentile Trajectory Change Report Update Times for an A3 Receiver at High Altitude in CE 2015 over Brussels Using a 5 Second Epoch to Deliver 4 TC Messages............................................................................................................................. 5
Figure I-3: 95th Percentile Target Change Report Update Times for an A3 Receiver at High Altitude in CE 2015 over Brussels Comparing Both Methods for Delivering 4 TC Messages............................................................................................................................. 6
LIST OF TABLES Table 2-1: Examples of UAT Installed Equipment Classes........................................................................ 24 Table 2-2: Transmitter Power Levels.......................................................................................................... 25 Table 3-1: Payload Type Code Allocation.................................................................................................. 28 Table 4-1: UAT ADS-B Transmitter Input Requirements.......................................................................... 31 Table 5-1: Transmitter to Receiver Time Offset Worst Case ..................................................................... 39 Table 6-1: Example of Site ID Table .......................................................................................................... 50 Table 7-1: Channel Mapping to URA for the 5-4-2 Plan .......................................................................... 62 Table 8-1: Summary of Potential Future Applications of UAT.................................................................. 67 Table B-1: Ranges of ADS-B MASPS Compliance for UAT Transmit-Receive Combinations in
the LA2020 Scenario ........................................................................................................ 34 Table B-2: Ranges of ADS-B MASPS Compliance for UAT Transmit-Receive Combinations in
CE 2015 Scenario ............................................................................................................. 73 Table B-3: Acquisition Requirements......................................................................................................... 76 Table B-4: 99th Percentile Range for Information Acquisition for Various Combinations of
Transmit-Receive Pairs (NM)........................................................................................... 76 Table C-1: Signal Level Analysis of the Sample Scenario ........................................................................... 6 Table C-2: Interference Scenarios and Implementation Assumptions.......................................................... 8 Table C-3: Received Power Levels (dBm) for Current European DME/TACAN Environment.................. 9 Table C-4: Received Power Levels (dBm) for 2015 European DME/TACAN Environment ...................... 9 Table C-5: Co-site Environment ................................................................................................................... 9 Table C-6: Overview of Scenario Assessments .......................................................................................... 11 Table E-1: Maximum Undetected RS Word Error Rates.............................................................................. 3 Table E-2: Upper Bounds on Undetected Message Error Probabilities........................................................ 9 Table G-1: Example of Basic ADS-B Message Payloads............................................................................. 4 Table G-2: Example of Long Type 1 ADS-B Message Payloads................................................................. 6 Table H-1: Typical Antennas........................................................................................................................ 6

x
Table H-2: Diplexer Testing with ATC Transponders ............................................................................... 10

11
© 2004
1 Introduction
1.1 Outline of the Manual
This Manual contains general informative information and implementation guidance for the Universal Access Transceiver (UAT).
Section 1 of this document presents the objectives and scope of the manual and provides definition of key terms used in the manual.
Section 2 describes the applications supported by UAT and the fundamentals of system operation and introduces an example set of airborne equipage classes.
Section 3 provides guidance for scheduling of UAT ADS-B Message transmissions by each of the example airborne equipage classes described in Section 2.
Section 4 provides guidance on UAT ADS-B transmitter inputs by each of the example airborne equipage classes described in Section 2.
Section 5 provides guidance on UAT aircraft installation aspects.
Section 6 provides guidance on the implementation of UAT Ground Infrastructure. Assumptions consistent with this guidance have been used to estimate UAT performance when supporting air-ground applications of ADS-B.
Section 7 describes potential future services that could be supported by UAT
Appendix A is a listing of acronyms and definition of terms.
Appendix B summarizes results of detailed UAT System performance simulations in the Standard Interference Environments of Appendix C. Air-to-air, air-to-ground and ground-to-air system performances are assessed. All performance estimates reflect broadcast of all State Vector (SV), Mode Status (MS), and Intent information (including both Target State and Trajectory Change Reports), as appropriate to the UAT equipage class. Action #1 assigned to Larry Bachman to update Appendix B by 15 January 2005 and provide a short memo to indicate the changes. Subgroup members to review and provide comments at UAT SWG08.
Appendix C describes the standard interference environments assumed for the performance simulations documented in Appendix B. These environments are based upon internationally-developed traffic scenarios for future high and low density airspace and near-worst-case estimates of interference caused by other systems transmitting on or near the UAT intended operational frequency of 978 MHz. Action #2 assigned to all Subgroup members to bring any comments to this Appendix to UAT SWG08.
12
© 2004
Appendix D describes measurement data that were collected on UAT equipment, including production-level equipment, to characterize UAT receiver performance in various interference environments, including JTIDS/MIDS, DME/TACAN and self-interference, as described in Appendix C. Action #3 assigned to Tom Pagano to provide the updated draft of Appendix D at the Langen, Jan/Feb 2005 meeting.
Appendix E describes the UAT Error Detection and Correction Performance.
Appendix F describes test results that substantiate compatibility of the UAT System with Distance Measuring Equipments (DMEs).
Appendix G contains a specific example of a UAT ADS-B Message with an exemplary payload, formatted in a manner consistent with Section 12.4.4 of the UAT SARPs and Section 2.1 of the UAT Technical Manual.
Appendix H contains information and guidance regarding Aircraft Antenna Characteristics. A technique for sharing existing transponder antennas is described.
Appendix I contains an approach for UAT to convey Trajectory Change Reports (TCRs), a type of intent information. The Appendix contains a description of how up to four (4) TCRs may be supported by the system.
1.2 Objective and Scope
The objective of this manual is to supplement the UAT SARPs and the UAT Technical Manual with additional information related to implementation guidance and UAT system performance.
1.3 Definitions
Appendix A provides a definition of the terms and acronyms used in this document. This section expands upon the definitions of key terms in order to increase document clarity and establish a common foundation of terminology.
UAT: Universal Access Transceiver (UAT) is a broadcast data link intended to operate globally on a single frequency channel, with a channel signaling rate of 1.041667 Mbps.
UAT ADS-B Message: UAT ADS-B Messages are broadcast once per second by each aircraft to convey State Vector and other information. UAT ADS-B Messages can be in one of two forms depending on the amount of information to be transmitted in a given second: the Basic UAT ADS-B Message or the Long UAT ADS-B Message (see §12.4.4.1 of the UAT SARPs for definition of each).
UAT Ground Uplink Message: The UAT Ground Uplink Message is used by ground stations to uplink flight information, such as text and graphical weather data, advisories, and other aeronautical information, to any aircraft that may be in the service volume of the ground uplink station message (see §12.4.4.2 of the UAT SARPs for further details).

13
© 2004
Basic Receiver: A general purpose receiver with less rejection of interference from adjacent frequency channel DMEs than the High Performance receiver (see §12.3.2.2 of the UAT SARPs for further details).
High Performance Receiver: A UAT receiver with additional filter selectivity to aid in the rejection of adjacent frequency channel DME interference (see §12.3.2.2 of the UAT SARPs for further details).
Optimum Sampling Point: The optimum sampling point of a received UAT bit stream is at the nominal center of each bit period, when the frequency offset is either plus or minus 312.5 kHz.
Action #4: Requested by WG-C during Mtg 7: Provide material on how UAT fits into the ATM environment, assigned to George Ligler for the November 2004 meeting in Montreal, and carried over until the Langen meeting.

14
© 2004
This Page Intentionally Left Blank

15
© 2004
2 Operating Concepts
2.1 Applications Supported
2.1.1 Automatic Dependent Surveillance –Broadcast (ADS-B)
Automatic Dependent Surveillance – Broadcast (ADS-B) is a surveillance technique in which aircraft automatically provide, via a broadcast-mode data link, data derived from on-board navigation and position fixing systems, including aircraft identification, four-dimensional position, and additional data as appropriate.
With such information made available by ADS-B from other proximate aircraft, it is possible to establish the relative position and movement of those aircraft with reference to one's own aircraft. It is also possible for ground-based facilities to monitor ADS-B broadcasts to enable basic surveillance capabilities, or to supplement existing surveillance systems. Other data that are shared using ADS-B include information related to the aircraft's intended flight path (“intent” data), aircraft type, and other information.
ADS-B is automatic in the sense that no pilot or controller action is required for the information to be broadcast. It is dependent surveillance in the sense that the aircraft surveillance-type information is derived from on-board navigation equipment.
ADS-B is considered to be a key enabling technology to enhance safety and efficiency in airspace operations. These include basic applications, such as the use of ADS-B to enhance the pilot's visual acquisition of other nearby aircraft1, as well as more advanced applications, such as enabling enhanced closely spaced parallel approach operations. Other applications involving airport surface operations, improved surveillance in non-radar airspace, and advanced conflict management are also described. Fleet management and search and rescue are also applications that can be supported by ADS-B.
2.1.2 Ground Uplink Services
In the context of this manual, Traffic Information Service - Broadcast (TIS-B) is a ground-based service to UAT-equipped aircraft to provide surveillance data on non-UAT-equipped aircraft. The service is intended to provide UAT-equipped aircraft with a more-complete traffic picture in situations where not all aircraft are equipped with UAT.
When providing surveillance data for non-ADS-B equipped aircraft, TIS-B involves three major functions. First, another source of surveillance information on non-ADS-B aircraft (such as Secondary Surveillance Radar [SSR]) must be available. Second, this surveillance information must be converted and processed so as to be usable by UAT-equipped aircraft. And third, UAT is used to convey this information to UAT-equipped aircraft.
1 Ground vehicles in the movement area, obstacles, etc., may also transmit UAT ADS-B Messages when appropriate. In appropriate contexts, the term “aircraft” may include such other transmitters.

16
© 2004
When providing surveillance data for ADS-B equipped aircraft that are equipped with a data link other than UAT, the TIS-B service takes as input ADS-B reports from such aircraft and converts those reports to a format appropriate to UAT, for uplink broadcast to UAT equipped aircraft.
UAT preferably supports TIS-B by having UAT ground uplink stations transmit TIS-B information as UAT ADS-B Messages in the ADS-B segment of the UAT frame. Alternatively, if necessary, TIS-B information could be broadcast in the ground segment of the UAT frame.
FIS-B is the ground-to-air broadcast of non-control, advisory information needed by pilots to operate more safely and efficiently. For example, FIS-B may provide weather graphics and text (e.g., METAR and TAF), Special Use Airspace information, Notices to Airmen, and other information. UAT has been designed to support the broadcast of FIS-B information in the ground segment of the UAT frame using the ground uplink message.
2.1.3 UAT Broadcast Connectivity
Figure 2-1 below shows the connectivity supported by UAT for ADS-B air-air, ADS-B air-ground, and the uplink services of TIS-B and FIS-B.
ADS-B
ADS-B
Weather andAeronautical
Information (FIS-B)
TrafficInformation
(TIS-B)
FIS-BTIS- B
ADS-B
ADS-B
UAT Ground Station
FIS-BTIS- B
Transmit Only
Figure 2-1: UAT Connectivity

17
© 2004
Aircraft UAT equipment may support transmit-only or transmit and receive capability. When aircraft are in coverage of a ground station, uplink services may be provided and the ground station can serve as a surveillance sensor for ground based ADS-B applications. Regardless of whether airborne users are in coverage of a ground station or not, air-air ADS-B connectivity is available. While networking of ground stations can offer certain advantages, each can also operate independently of others if desired. Requirements for coordination among ground stations are that they all operate on a common time standard and that the ground uplink slots on which they transmit are assigned through appropriate spectrum management procedures.
2.2 Frequency Channel and Waveform Description
The UAT employs a single common global frequency channel to support ADS-B and appropriate ground uplink services. The UAT frequency channel is at 978 MHz and has a signaling rate of just over 1 Mbps. A single channel architecture ensures seamless air-to-air connectivity and obviates the need for multi-channel receivers or tuning procedures. The UAT frequency channel has been sized to ensure ADS-B performance is maintained in future high traffic density environments. Additionally, the UAT waveform has been designed specifically to provide tolerance to self-interference and other pulsed interference encountered in the frequency band of UAT operation. The UAT waveform is defined in the UAT RF SARPs.
Detailed information on UAT ADS-B performance assessment in low density and in projected future high-density traffic environments is provided in Appendix B. This assessment also accounts for all expected sources of interference from other systems as described in Appendix C. Appendix D describes the bench test measurements used to develop receiver performance models that provide the underpinning of the simulations in Appendix B.
There are two types of broadcast transmissions - or messages - on the UAT frequency channel: the UAT ADS-B Message, and the UAT Ground Uplink Message. Regardless of type, each message has two fundamental components: the message payload that contains user information, and message overhead, principally consisting of Forward Error Correction (FEC) code parity, that supports the error-free transfer of the data. The FEC was selected to ensure that UAT Messages would have a transmission integrity at the UAT link layer of at most one in 10-8 probability of an undetected error per message. Details on the format of these message types are provided in §12.4.4 of the UAT SARPs. Details on the contents and format of the message payloads are provided in §2.1 of the UAT Technical Manual.
Information on the error detection and correction performance of the UAT FEC scheme is provided in Appendix E.
Finally, test results assessing the impact of the UAT waveform on DME equipment is presented in Appendix F.
18
© 2004
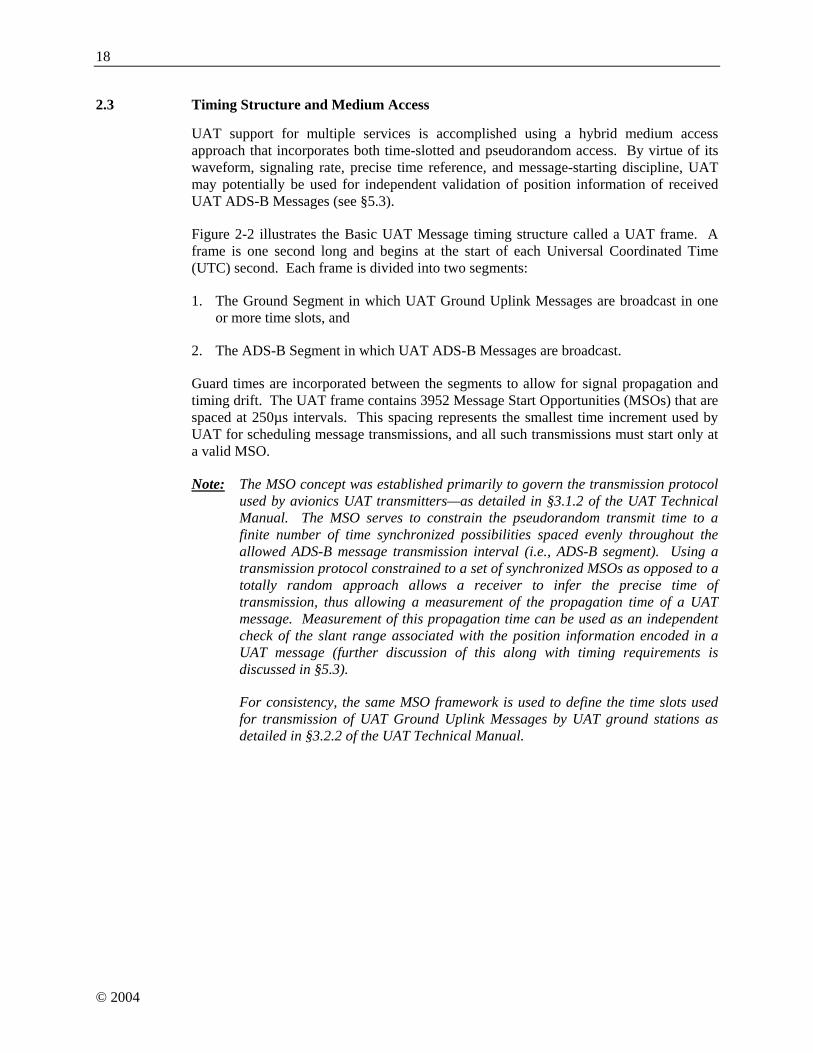
2.3 Timing Structure and Medium Access
UAT support for multiple services is accomplished using a hybrid medium access approach that incorporates both time-slotted and pseudorandom access. By virtue of its waveform, signaling rate, precise time reference, and message-starting discipline, UAT may potentially be used for independent validation of position information of received UAT ADS-B Messages (see §5.3).
Figure 2-2 illustrates the Basic UAT Message timing structure called a UAT frame. A frame is one second long and begins at the start of each Universal Coordinated Time (UTC) second. Each frame is divided into two segments:
1. The Ground Segment in which UAT Ground Uplink Messages are broadcast in one or more time slots, and
2. The ADS-B Segment in which UAT ADS-B Messages are broadcast.
Guard times are incorporated between the segments to allow for signal propagation and timing drift. The UAT frame contains 3952 Message Start Opportunities (MSOs) that are spaced at 250µs intervals. This spacing represents the smallest time increment used by UAT for scheduling message transmissions, and all such transmissions must start only at a valid MSO.
Note: The MSO concept was established primarily to govern the transmission protocol used by avionics UAT transmitters—as detailed in §3.1.2 of the UAT Technical Manual. The MSO serves to constrain the pseudorandom transmit time to a finite number of time synchronized possibilities spaced evenly throughout the allowed ADS-B message transmission interval (i.e., ADS-B segment). Using a transmission protocol constrained to a set of synchronized MSOs as opposed to a totally random approach allows a receiver to infer the precise time of transmission, thus allowing a measurement of the propagation time of a UAT message. Measurement of this propagation time can be used as an independent check of the slant range associated with the position information encoded in a UAT message (further discussion of this along with timing requirements is discussed in §5.3).
For consistency, the same MSO framework is used to define the time slots used for transmission of UAT Ground Uplink Messages by UAT ground stations as detailed in §3.2.2 of the UAT Technical Manual.
19
© 2004
6 m s 6 m s1 2 m s
U A T F r a m e = O n e U T C S e c o n d
( S t a r t : o n t h e U T C s e c o n d ) ( E n d )
M S O 0 M S O 3 9 5 1
M e s s a g e S t a r t O p p o r t u n i t i e s ( M S O s )
A D S - B S e g m e n t 8 0 0 m s
G r o u n d S e g m e n t 1 7 6 m s
M S O 7 5 2M S O 7 0 4
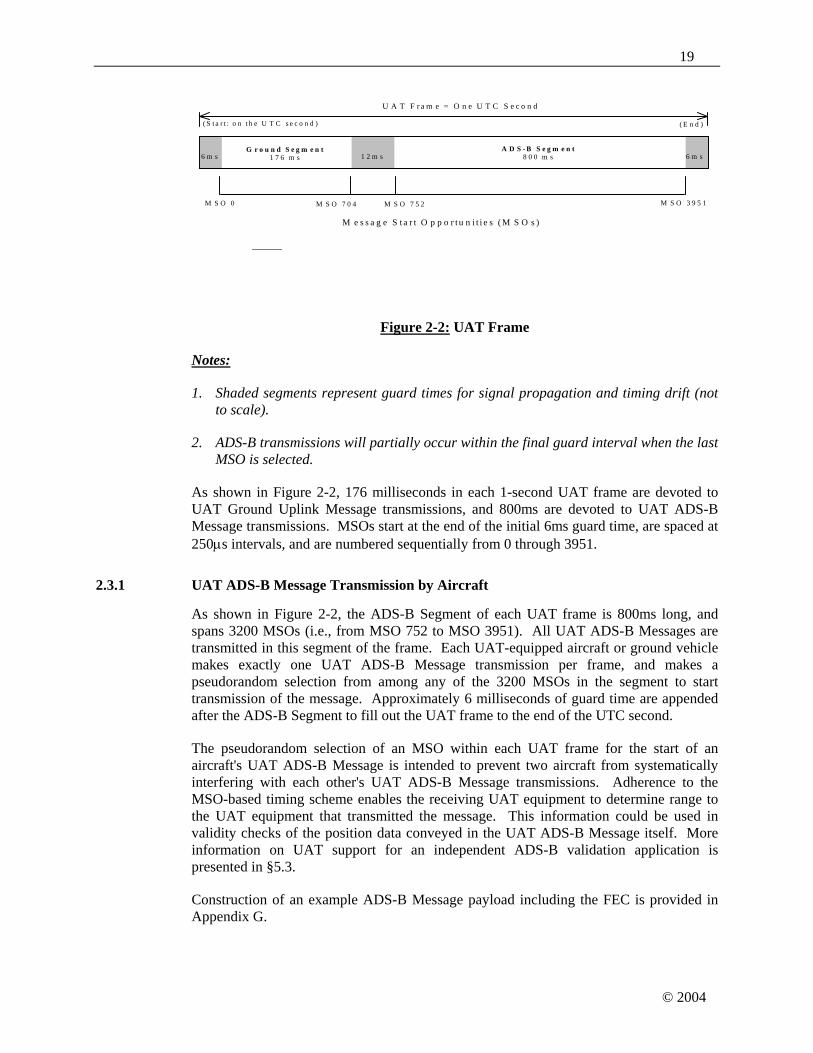
Figure 2-2: UAT Frame
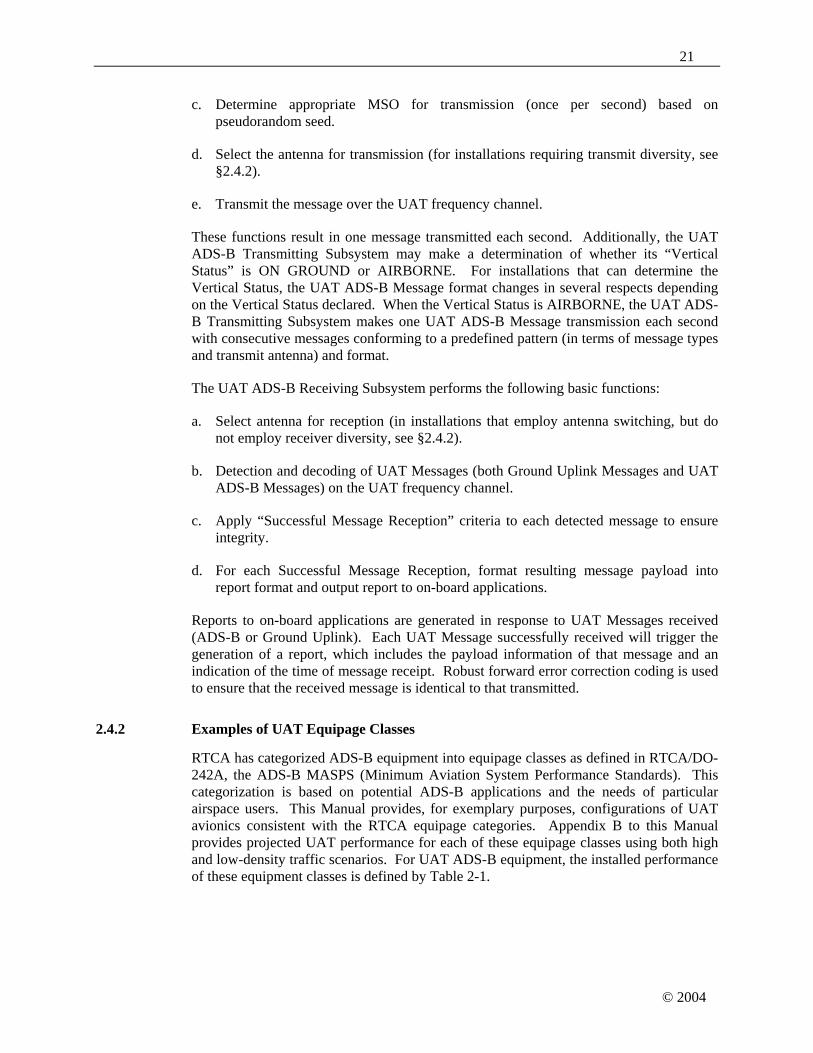
Notes:
1. Shaded segments represent guard times for signal propagation and timing drift (not to scale).
2. ADS-B transmissions will partially occur within the final guard interval when the last MSO is selected.
As shown in Figure 2-2, 176 milliseconds in each 1-second UAT frame are devoted to UAT Ground Uplink Message transmissions, and 800ms are devoted to UAT ADS-B Message transmissions. MSOs start at the end of the initial 6ms guard time, are spaced at 250μs intervals, and are numbered sequentially from 0 through 3951.
2.3.1 UAT ADS-B Message Transmission by Aircraft
As shown in Figure 2-2, the ADS-B Segment of each UAT frame is 800ms long, and spans 3200 MSOs (i.e., from MSO 752 to MSO 3951). All UAT ADS-B Messages are transmitted in this segment of the frame. Each UAT-equipped aircraft or ground vehicle makes exactly one UAT ADS-B Message transmission per frame, and makes a pseudorandom selection from among any of the 3200 MSOs in the segment to start transmission of the message. Approximately 6 milliseconds of guard time are appended after the ADS-B Segment to fill out the UAT frame to the end of the UTC second.
The pseudorandom selection of an MSO within each UAT frame for the start of an aircraft's UAT ADS-B Message is intended to prevent two aircraft from systematically interfering with each other's UAT ADS-B Message transmissions. Adherence to the MSO-based timing scheme enables the receiving UAT equipment to determine range to the UAT equipment that transmitted the message. This information could be used in validity checks of the position data conveyed in the UAT ADS-B Message itself. More information on UAT support for an independent ADS-B validation application is presented in §5.3.
Construction of an example ADS-B Message payload including the FEC is provided in Appendix G.
20
© 2004
2.3.2 Ground Uplink Services
UAT Ground Uplink Messages are used to support services such as FIS-B and TIS-B. UAT Ground Uplink Messages will occur within one or more of the 32 time slots defined within the ground segment of the UAT frame. Detailed procedures for UAT Ground Uplink Message transmission are provided in §3.
UAT Ground Stations can support TIS-B through transmission of individual messages in the ADS-B format in the ADS-B segment of the frame. Using this approach, TIS-B transmissions will appear to be nearly identical to UAT ADS-B Messages both in terms of message format and media access. Each such TIS-B transmission must start only at a valid MSO as is the case with transmission of ADS-B Messages from aircraft. UAT can also support TIS-B through transmissions in the Ground Uplink segment. This approach for transmission of TIS-B information is beyond the scope of this Manual.
2.4 Basic Avionics Operation and Equipage Levels
2.4.1 Avionics Operating Concept
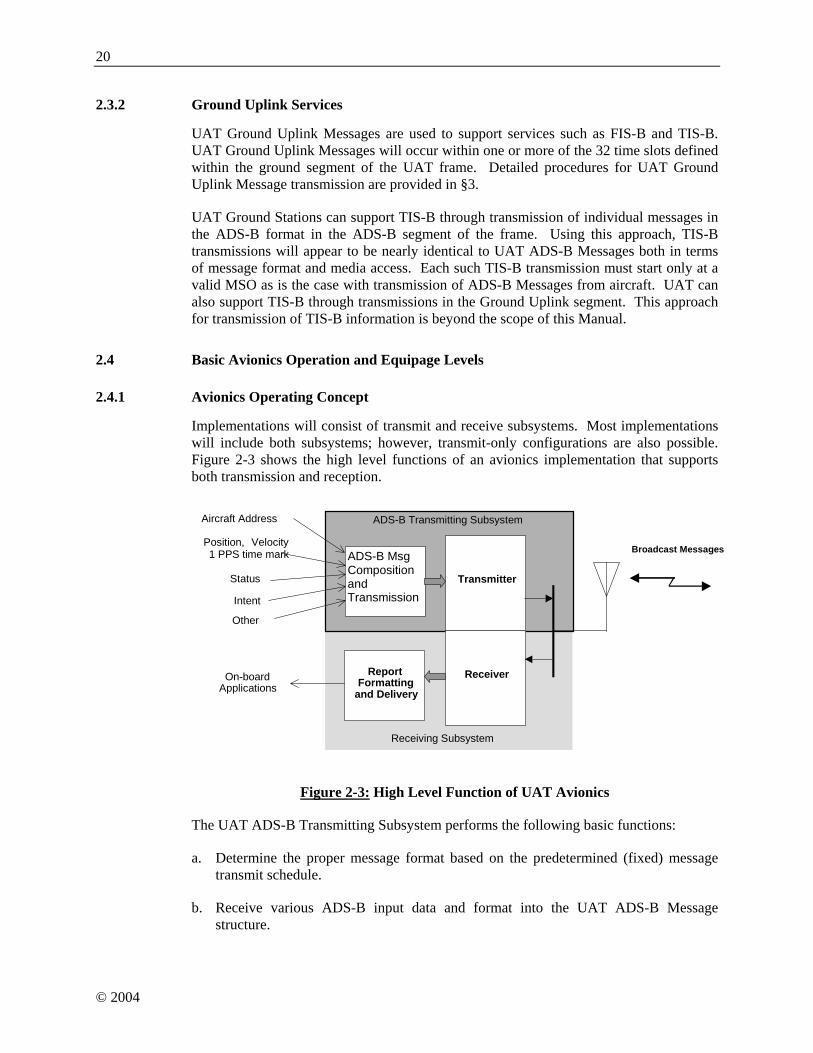
Implementations will consist of transmit and receive subsystems. Most implementations will include both subsystems; however, transmit-only configurations are also possible. Figure 2-3 shows the high level functions of an avionics implementation that supports both transmission and reception.
ReportFormatting
and Delivery
ADS-B MsgComposition andTransmission
Transmitter
Receiver
Status
Intent Other
On-board Applications
ADS-B Transmitting Subsystem
Receiving Subsystem
Position, Velocity 1 PPS time mark
Aircraft Address
Broadcast Messages
Figure 2-3: High Level Function of UAT Avionics
The UAT ADS-B Transmitting Subsystem performs the following basic functions:
a. Determine the proper message format based on the predetermined (fixed) message transmit schedule.
b. Receive various ADS-B input data and format into the UAT ADS-B Message structure.
21
© 2004
c. Determine appropriate MSO for transmission (once per second) based on pseudorandom seed.
d. Select the antenna for transmission (for installations requiring transmit diversity, see §2.4.2).
e. Transmit the message over the UAT frequency channel.
These functions result in one message transmitted each second. Additionally, the UAT ADS-B Transmitting Subsystem may make a determination of whether its “Vertical Status” is ON GROUND or AIRBORNE. For installations that can determine the Vertical Status, the UAT ADS-B Message format changes in several respects depending on the Vertical Status declared. When the Vertical Status is AIRBORNE, the UAT ADS-B Transmitting Subsystem makes one UAT ADS-B Message transmission each second with consecutive messages conforming to a predefined pattern (in terms of message types and transmit antenna) and format.
The UAT ADS-B Receiving Subsystem performs the following basic functions:
a. Select antenna for reception (in installations that employ antenna switching, but do not employ receiver diversity, see §2.4.2).
b. Detection and decoding of UAT Messages (both Ground Uplink Messages and UAT ADS-B Messages) on the UAT frequency channel.
c. Apply “Successful Message Reception” criteria to each detected message to ensure integrity.
d. For each Successful Message Reception, format resulting message payload into report format and output report to on-board applications.
Reports to on-board applications are generated in response to UAT Messages received (ADS-B or Ground Uplink). Each UAT Message successfully received will trigger the generation of a report, which includes the payload information of that message and an indication of the time of message receipt. Robust forward error correction coding is used to ensure that the received message is identical to that transmitted.
2.4.2 Examples of UAT Equipage Classes
RTCA has categorized ADS-B equipment into equipage classes as defined in RTCA/DO-242A, the ADS-B MASPS (Minimum Aviation System Performance Standards). This categorization is based on potential ADS-B applications and the needs of particular airspace users. This Manual provides, for exemplary purposes, configurations of UAT avionics consistent with the RTCA equipage categories. Appendix B to this Manual provides projected UAT performance for each of these equipage classes using both high and low-density traffic scenarios. For UAT ADS-B equipment, the installed performance of these equipment classes is defined by Table 2-1.

22
© 2004
Aircraft systems supporting both transmission and reception of UAT Messages, termed Class A UAT Systems, are defined by equipage classification according to the provided user capability. All Class A UAT Airborne configurations support the provision of at least basic air-ground ATC surveillance services. The variations listed below are primarily distinguished by their support of air-to-air applications. The following types of Class A1 systems are defined:
1. Class A0: Supports minimum Message transmission and reception capability for UAT ADS-B participants that always operate below 18,000 feet MSL. Air-to-air ADS-B applications for this Class of equipage are supported to a range of at least 10 NM between participants. Broadcast UAT ADS-B Messages are based upon own-platform source data. UAT ADS-B Messages received from other aircraft support generation of UAT ADS-B reports that are used by on-board applications.
2. Class A1: Supports all class A0 functionality and supports ADS-B air-to-air applications to a range of at least 20 NM between participants. For UAT, the A1 equipage class has been divided into two classes. For A1 aircraft that always operate below 18,000 feet MSL, the “A1 Low” class is created, and abbreviated throughout this document as “A1L.” For A1 aircraft that have no altitude operating restrictions, the “A1 High” class is created, and abbreviated throughout this document as “A1H.” The major equipment performance difference between classes A1L and A1H is the Transmitter RF output power.
3. Class A2: Supports all Class A1 functionality and additionally provides extended range for ADS-B air-to-air applications of at least 40 NM and information processing to support longer range applications. This service requires the broadcast and receipt of intent information contained in Target State and Trajectory Change reports.
4. Class A3: Supports all Class A2 functionality and has additional range capability for UAT ADS-B air-to-air applications between A3 equipped users of at least 120 NM. Class A3 has the ability to broadcast and receive multiple Trajectory Change reports. The analysis in Appendix B, which assumes a particular method of transmitting two Trajectory Change reports, indicates that the exchange of a second Trajectory Change report at distances of 120 NM is accomplished at approximately one-half of the update rate of the first Trajectory Change report. Alternative methods of transmitting up to four Trajectory Change reports for an ADS-B system participant are discussed in Appendix I.
1 There may be future recognition of Receive-Only configurations in which the requirements for an appropriate Class A Receive capability are met. Such configurations would be intended for use only in aircraft that support an interactive capability on an alternate ADS-B data link.

23
© 2004
The UAT SARPs refer to “Basic” and “High Performance” receivers. Class A3 equipment employs the High Performance receiver and the remaining Class A equipments employ the Basic receiver.
The High Performance Receiver employs a narrower bandwidth filter to allow it to better reject adjacent channel DME emissions. The use of High Performance Receivers is recommended to support longer range air-to-air ADS-B applications in air spaces which have a significant number of DME assignments on channels adjacent to the 978 MHz UAT transmission frequency. The narrow bandwidth introduces some distortion of the desired signal that degrades the co-channel performance. However the benefit of rejecting the DME energy offsets this effect in terms of overall performance. The full effect of the narrow bandwidth filter was accounted for in the performance assessments in Appendix B.
Some UAT ADS-B system participants will not need to receive information from other participants but will only need to broadcast their State Vector and associated data. Class B UAT ADS-B systems meet the needs of these participants. Class B UAT systems are defined as follows:
1. Class B0: Aircraft broadcast-only system. Class B0 systems require an interface with own-platform navigation systems. Class B0 systems require transmit powers and information capabilities equivalent to those of Class A0. For UAT, Class B0 installations are on aircraft that always operate below 18,000 feet MSL.
2. Class B1: Aircraft broadcast-only system. Class B1 UAT systems require an interface with own-platform navigation systems. Class B1 UAT systems require transmit powers and information capabilities equivalent to those of Class A1H.
3. Class B2: Ground vehicle broadcast-only UAT ADS-B system. Class B2 UAT systems require a high-accuracy source of navigation data and a nominal 5 NM effective broadcast range. Surface vehicles qualifying for UAT ADS-B equipage may be limited to those that operate within the surface movement area.
4. Class B3: Fixed obstacle broadcast-only UAT ADS-B system. Collocation of the transmitting antenna with the obstacle is not required as long as broadcast coverage requirements are met. Structures and obstructions identified by ATCS authorities as safety hazards may have their positions communicated to aircraft using UAT.
UAT ground stations are discussed in §2.5.
The complete set of ADS-B information transmitted will vary somewhat for each equipment class as determined by the schedule of ADS-B Message payloads to be transmitted by each equipment class (see §3.1.1 of this Manual). Receiving applications can infer the equipment class of a system participant by observing the set of ADS-B Message payloads being received from each participant. Certain air-to-air applications may require the receiving application to determine the applications supported by ADS-B targets under surveillance. In the future this information will be explicitly encoded in the payload of the Mode Status Element (see the UAT Technical Manual §2.1.5.4).

24
© 2004
Important characteristics of the UAT ADS-B Class A and Class B equipage classes are summarized in Table 2-1.
Table 2-1: Examples of UAT Installed Equipment Classes
Intended Antenna Diversity (when Airborne for Classes A & B0-B1) Equipage Class
Air-to-Air Application
Ranges Supported
Transmit RF Power Delivered to Antenna
System Transmit Receive
A0 10 NM Single Antenna (see Note 4)
Single Antenna (see Note 4)
A1L
Low Power (Altitude always
below 18,000 feet) Alternating every 2 sec.
Alternating every sec.
A1H 20 NM
Medium Power Alternating every 2 sec.
Alternating every sec.
A2 40 NM Medium Power Alternating every 2 sec. Dual Receiver
A3 120 NM High Power Alternating every 2 sec. Dual Receiver
B0 10 NM Low Power
(Altitude always below 18,000 feet)
Single Antenna (see Note 4) n/a
B1 20 NM Medium Power Alternating every 2 sec. n/a
B2 5 NM +28 to +32 dBm Single Antenna n/a
B3 5 NM +30 dBm (minimum) Single Antenna n/a
Notes:
1. See §2.4.2.1 for definition of Transmitter RF power levels.
2. Transmitter RF power requirement depends on the aircraft maximum altitude capability. Low-altitude aircraft (maximum certified altitude for aircraft <18,000 feet MSL) need not support the higher-power transmitter requirements due to line-of-sight limitations.
3. Top antenna is not required if use of a single antenna does not degrade signal propagation. This allows for single antenna installation on radio-transparent airframes.
4. For a single-antenna installation, antenna gain pattern performance should be shown at least equivalent to that of a quarter-wave resonant antenna mounted on the fuselage bottom surface.

25
© 2004
5. For further information on Antenna diversity see RTCA DO-282A, §2.2.8.1 and §2.2.6.1.3 or equivalent certification guidance.
2.4.2.1 Transmitting Subsystem
A UAT ADS-B Transmitting Subsystem is classified according to the unit’s range capability and the set of parameters it is capable of transmitting. Table 2-2 defines the transmitter power levels. Power levels are measured in terms of power presented to the transmitting antenna.
Table 2-2: Transmitter Power Levels
Power Classification
Minimum Power at Antenna
Maximum Power at Antenna
Low 7.0 watts (+38.5 dBm) 18 watts (+42.5 dBm)
Medium 16 watts (+42 dBm) 40 watts (+46 dBm)
High 100 watts (+50 dBm) 250 watts (+54 dBm)
Note: These transmitter power levels are referenced to the power at the antenna end of the cable that connects the UAT equipment to the antenna. A unity gain (0.0 dBi) antenna is assumed. Alternate means that demonstrate equivalent performance can be used. Refer to Appendix H in this Manual for guidance.
2.4.2.2 Receiving Subsystem
All Class A receivers have the same sensitivity requirements. The receiver sensitivity at the receiver antenna end of the cable connecting the antenna to the equipment (after antenna gain and before cable loss), for 90% Message Success Rate in the absence of interference, is –93 dBm for Long UAT ADS-B Messages, –94 dBm for Basic UAT ADS-B Messages, and –91 dBm for Ground Uplink (ground-to-air) messages. Performance of Class A receivers in the presence of interference is discussed in Appendices B and D.
2.5 Ground Station Operation
The UAT ground station will operate as a UAT ADS-B sensor similar to that of airborne units. The UAT System has been designed to support line-of-sight air-to-ground ADS-B coverage from a single ground station, even in future high-density airspaces. The ground subsystem will also be capable of transmitting UAT Ground Uplink Messages in one or more of the 32 assigned Ground Segment time slots. TIS-B uplink from a UAT ground station can utilize the UAT ADS-B Message format and the ADS-B segment of the UAT frame; in this event, the avionics receiving subsystem makes no distinction in its processing of UAT ADS-B and TIS-B data (although the airborne application can distinguish these via the Address Qualifier field). Alternatively, in particular traffic environments, a UAT ground station may transmit TIS-B information in one or more of the 32 assigned Ground Segment time slots.

26
© 2004
The typical UAT Ground Station antenna is 6-8 dBi gain, omni-directional, and DME-like. High-density traffic environments may require use of separate transmit and receive antenna, and/or sectorized receive antenna (see Appendix H of this Manual). The air-ground performance estimates of Appendix B assume a Ground Station receiver sensitivity of –98 dBm, measured at the receiver end of the cable connecting the UAT equipment to the Ground Station antenna. Figure 2-4 gives an overview of the ground station.
T/R
TIS-B Reports,uplink data
ADS-B ReportsUAT Ground Station
Transceiver Application Processor(s)
Timing Reference
Figure 2-4: UAT Ground Station Simplified Block Diagram
A single Ground Station antenna/transceiver is capable of supporting the following functions:
1. Receiving air-ground UAT ADS-B Messages and producing UAT ADS-B reports.
2. Providing time-of-arrival measurement of UAT ADS-B receptions for range-to-target measurement that is independent of the ADS-B reported position.
3. Ground broadcast service uplink (e.g., TIS-B, FIS-B).
4. Providing timing beacon to airborne users that can provide backup timing (see the UAT Technical Manual, §3.1.1.2(c)). In order to implement this backup timing capability the Ground Station will need to provide Ground Uplink Messages on a regular basis.
Networked Ground Stations with overlapping coverage can support surveillance based on the “multilateration” technique even if the aircraft that is under surveillance does not have a position available to be reported within its UAT ADS-B Message.
Additional guidance on operation of ground infrastructure including network aspects and interference considerations is provided in Section §6 of this Manual.

27
© 2004
This Page Intentionally Left Blank

28
© 2004
3 Scheduling of UAT ADS-B Messages
3.1 Payload Selection Cycle
UAT ADS-B Messages payload types are to be transmitted according to a payload selection cycle defined to ensure timely transmission of appropriate ADS-B information. For the exemplary equipment classes of Table 2-1, UAT ADS-B Messages of seven different payload types (out of 32 possible payload types) have been defined. Each equipment class transmits up to four of these payload types in a pre-determined sequence: Payload Selection (PS)-A, PS-B, PS-C, and PS-D.
3.1.1 ADS-B Payload Type Allocation
For the exemplary equipment classes of Table 2-1 of this Manual, Table 3-1 below specifies the payload selections, using UAT ADS-B Payload Type Codes defined in Table 2-2 of the UAT Technical Manual.
Table 3-1: Payload Type Code Allocation
Equipment Class PS-A PS-B PS-C PS-D A0, A1L, A1H, B0, B1 1 0 2 0 A1H, B1 (see Note 2) 3 6 0 6 A2 1 4 4 4 A3 1 4 5 4 B2, B3 1 0 0 0
Notes:
1. This schedule is to be followed regardless of the unavailability of any payload fields.
2. Optional Payload Type Code assignment if the installation can support transmission of Target State information.
3.1.2 Message Transmission Cycle
A message transmission cycle of 16 seconds is defined to ensure a proper mix of message payloads for installations that support ADS-B Message transmission from dual (diversity) antennas. When an aircraft is determined to be in the AIRBORNE condition, transmissions occur through Top (T) (if so equipped) and Bottom (B) antennas each Message Transmission Cycle as shown in Figure 3-2.
29
© 2004
Antenna T T B B T T B B T T B B T T B B
PS # A B C D D A B C C D A B B C D A
Seconds 1 2 3 4 5 6 7 8 9 10 11 12 13 14 15 16
Time
Message Transmission Cycle
Figure 3-2: Transmitter Antenna Use for Diversity Installations
Notes:
1. There is no requirement that transmission cycle boundaries be aligned among Aircraft/Vehicles (A/Vs); it is used only to ensure proper mix of transmitted message types.
2. For A1 receivers with antenna diversity provided by switching according to §2.4.2, this transmission pattern ensures that each payload type is communicated via each possible transmit/receive antenna combination (T/T, T/B, B/T, B/B) once during each 16 second cycle. It also minimizes the maximum spacing between any two transmissions of the same type.
When an aircraft is determined to be in the ON-GROUND condition, the top antenna (if so equipped) is selected for all transmissions. The transmission sequences are as shown in Figure 3-2, second and third rows.
30
© 2004
4 UAT Transmitter Input Requirements
a. The UAT ADS-B Transmitting Subsystem should accept the input data elements listed in Table 4-1 via an appropriate data input interface and use such data to establish the corresponding ADS-B Message contents.
b. Data elements indicated as “Optional,” that have no input interface, should always indicate the “data unavailable” condition, or be processed using the “data unavailable” procedures related to that element.
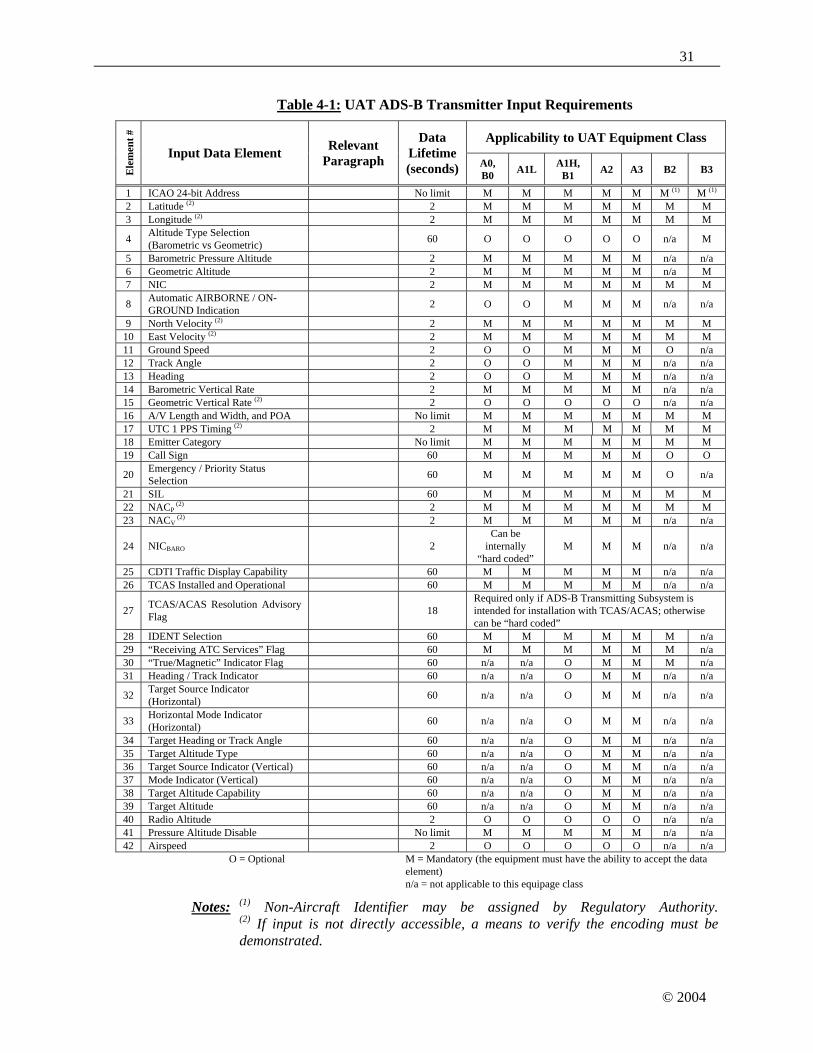
31
© 2004
Table 4-1: UAT ADS-B Transmitter Input Requirements
Applicability to UAT Equipment Class E
lem
ent #
Input Data Element Relevant Paragraph
Data Lifetime (seconds) A0,
B0 A1L A1H, B1 A2 A3 B2 B3
1 ICAO 24-bit Address No limit M M M M M M (1) M (1)
2 Latitude (2) 2 M M M M M M M 3 Longitude (2) 2 M M M M M M M
4 Altitude Type Selection (Barometric vs Geometric) 60 O O O O O n/a M
5 Barometric Pressure Altitude 2 M M M M M n/a n/a 6 Geometric Altitude 2 M M M M M n/a M 7 NIC 2 M M M M M M M
8 Automatic AIRBORNE / ON-GROUND Indication 2 O O M M M n/a n/a
9 North Velocity (2) 2 M M M M M M M 10 East Velocity (2) 2 M M M M M M M 11 Ground Speed 2 O O M M M O n/a 12 Track Angle 2 O O M M M n/a n/a 13 Heading 2 O O M M M n/a n/a 14 Barometric Vertical Rate 2 M M M M M n/a n/a 15 Geometric Vertical Rate (2) 2 O O O O O n/a n/a 16 A/V Length and Width, and POA No limit M M M M M M M 17 UTC 1 PPS Timing (2) 2 M M M M M M M 18 Emitter Category No limit M M M M M M M 19 Call Sign 60 M M M M M O O
20 Emergency / Priority Status Selection 60 M M M M M O n/a
21 SIL 60 M M M M M M M 22 NACP
(2) 2 M M M M M M M 23 NACV
(2) 2 M M M M M n/a n/a
24 NICBARO 2 Can be
internally “hard coded”
M M M n/a n/a
25 CDTI Traffic Display Capability 60 M M M M M n/a n/a 26 TCAS Installed and Operational 60 M M M M M n/a n/a
27 TCAS/ACAS Resolution Advisory Flag 18
Required only if ADS-B Transmitting Subsystem is intended for installation with TCAS/ACAS; otherwise can be “hard coded”
28 IDENT Selection 60 M M M M M M n/a 29 “Receiving ATC Services” Flag 60 M M M M M M n/a 30 “True/Magnetic” Indicator Flag 60 n/a n/a O M M M n/a 31 Heading / Track Indicator 60 n/a n/a O M M n/a n/a
32 Target Source Indicator (Horizontal) 60 n/a n/a O M M n/a n/a
33 Horizontal Mode Indicator (Horizontal) 60 n/a n/a O M M n/a n/a
34 Target Heading or Track Angle 60 n/a n/a O M M n/a n/a 35 Target Altitude Type 60 n/a n/a O M M n/a n/a 36 Target Source Indicator (Vertical) 60 n/a n/a O M M n/a n/a 37 Mode Indicator (Vertical) 60 n/a n/a O M M n/a n/a 38 Target Altitude Capability 60 n/a n/a O M M n/a n/a 39 Target Altitude 60 n/a n/a O M M n/a n/a 40 Radio Altitude 2 O O O O O n/a n/a 41 Pressure Altitude Disable No limit M M M M M n/a n/a 42 Airspeed 2 O O O O O n/a n/a
O = Optional M = Mandatory (the equipment must have the ability to accept the data element)
n/a = not applicable to this equipage class
Notes: (1) Non-Aircraft Identifier may be assigned by Regulatory Authority. (2) If input is not directly accessible, a means to verify the encoding must be demonstrated.

32
© 2004
5 UAT Aircraft Installation Guidance
5.1 Aircraft Mutual Suppression Bus
The UAT Technical Manual, in section 4.2, requires UAT equipment to output suppression pulses during UAT transmission. In practice these pulses will be transmitted on the aircraft’s Mutual Suppression Bus. On aircraft without such a bus, the installation of UAT equipment effectively results in such a bus being implemented. The Mutual Suppression Bus is used in aircraft for L-Band systems such as Secondary Surveillance Radar (SSR) transponders, TCAS/ACAS and DMEs. The L-Band systems on the aircraft physically connect to the common bus. The L-Band systems that are connected to the bus may drive the bus to announce to other systems that a transmission is taking place during the interval that the bus is activated. They may also listen on the bus to react to other L-Band transmissions on the aircraft. The L-Band systems that listen on the bus may choose to delay their own transmissions so as not to simultaneously transmit while another L-Band system is transmitting and/or desensitize its receiver to protect itself during high powered transmissions which could damage or impair its receive capability. Overall guidance is normally given for Mutual Suppression Bus circuitry so that it is designed to protect from malfunctioning devices connected to the Bus from impacting other systems connected to it.
5.2 UAT Suppression Pulse Impact on Cosite SSR, TCAS/ACAS and DME Performance
As mentioned above, systems operating within the L-Band frequency band may need interference protection from each other to insure safe and proper operation. A major consideration of systems connecting to and driving the mutual suppression bus is to minimize the duration of the suppression to minimize the impact to other connected systems. This section describes analysis that demonstrates that UAT operation does not unacceptably impact performance of cosite SSR, TCAS/ACAS or DME systems.
UAT is required to drive the Mutual Suppression Bus during the UAT transmission. UAT does not monitor the Mutual Suppression Bus so it does not inhibit or delay its transmissions as a result of Mutual Suppression Bus pulses from other L-Band systems connected to the bus. The impact to the UAT receiver during other L-Band transmissions was considered when assessing UAT receiver performance in high density airspace, as the UAT receiver was considered completely blanked during on-board L-Band transmissions from TCAS/ACAS, SSR transponders and DME. The UAT system performance estimates in Appendix B reflect this conservative blanking assumption. UAT averages one transmission per second and transmits either a Basic Message, which is 280 microseconds in duration, or a Long Message, which is 420 microseconds. The suppression interval is required, per section 4.2 of the UAT Technical Manual, to be active during the transmission interval when the power is -20 dBm or higher. The -20 dBm requirement was developed based on the maximum power allowable without SSR transponders generating unsolicited replies when signal levels from the UAT frequency skirts within the transponder receiver band are above the transponder receiver threshold. The worst case maximum suppression interval allowed is 430 microseconds. The impact of this suppression interval to other L-Band systems will be shown individually.
33
© 2004
5.2.1 Analysis of Impact on DME
The impact of the mutual suppression interval as a result of on-board UAT transmissions on DME systems was assessed. The short duration of the UAT suppression is insignificant to the DME transmitter/interrogator. The DME operation can safely withstand interrogation delays of 430 microseconds that may result if worst case delay were imposed on the DME. Looking at the receiver blanking of DME that would result from UAT suppression activity, the 0.043% worst case blanking is insignificant when considering that DME operation is acceptable at relatively low reply efficiencies. Appendix F of the UAT Implementation Manual contains data showing consistent DME operation on four different DME units when a reply efficiency of 30% or more is achieved. The measurements were performed relative to two performance criteria used in DME operation: 1) Acquire Stable Operating Point (ASOP), the point that prohibits the DME to acquire a track, 2) Break Stable Operating Point (BSOP), the point that causes DME to lose a track that it has already acquired. DME reply efficiency is reduced by many factors including interference from other systems and compatibility studies have been conducted to verify satisfactory DME operation against potential interference rates from these systems. UAT Mutual Suppression bus occupation rate of 0.043% is an insignificant factor to DME reply efficiency reduction.
5.2.2 Analysis of Impact on TCAS/ACAS
TCAS/ACAS systems connect to the Mutual Suppression Bus and are required to accept and respond to suppression pulses from the bus so that TCAS/ACAS activity is disabled when other L-Band equipment transmit. The TCAS/ACAS receiver, which decodes SSR Mode C/S signals, is required to recover to within 3 dB of normal receiver sensitivity within 15 microseconds after the end of the suppression pulse. UAT Long Message transmissions would result in a worst case 445 microsecond desensitization of the TCAS/ACAS receiver. TCAS/ACAS activity can be divided into three major functions: 1) Listening period for transponder acquisition squitters, 2) Whisper-shout interrogation/reply processing, 3) Mode S interrogation/reply processing. The impact of UAT Mutual Suppression Bus activity can be assessed for each of these functions. The potential blanking of a 430 microsecond interval during the Listening period of squitters is not a significant performance issue. Acquisition squitters are broadcast randomly on average once per second. The probability of reception of an aircraft squitter is reduced by 0.045% by the UAT Mutual Suppression Pulses and is not a significant factor in squitter acquisition. The probability of two squitters from the same aircraft being missed on subsequent seconds due to UAT is in the order of 2 x 10⁻⁷. The impact of missing a single acquisition squitter at any point in time is not a performance issue for TCAS/ACAS given that the link margin allows reception of acquisition squitters with enough margin to obtain a squitter and allowing TCAS/ACAS to acquire the aircraft prior to the aircraft being within range of the aircraft for threat determination. The whisper-shout function is an interrogation sequence to acquire SSR Mode A/C transponder equipped aircraft which varies interrogation power levels to reduce aircraft replies in a systematic way to reduce reply garbling that can occur in high density airspace. Whisper-shout interrogations occur at defined power levels and typically one to six power levels are transmitted under normal operating conditions. Whisper-shout interrogation power levels can go over 120 per second in a high density aircraft situation. The 430 microsecond UAT interval per second is not a significant impact to the Whisper-shout sequence of TCAS/ACAS. The 430 microseconds may blank the receiver and cause one or more missed replies in any one second. But since the UAT transmission is

34
© 2004
random and a low probability exists for losing more than one reply from any individual aircraft from the Whisper-shout interrogation sequence, this aspect of TCAS/ACAS performance remains acceptable with UAT Mutual Suppression Bus blanking. The impact of UAT Mutual Suppression Bus to the Mode S interrogation interval of TCAS/ACAS is not a significant performance issue. The ability of TCAS/ACAS to re-interrogate a particular aircraft if a reply is not received mitigates any risk of not receiving a reply from any individual interrogation. Replies may not be decoded by TCAS/ACAS for various reasons, the main source of interference are co-channel SSR Mode A/C/S fruit that overlaps desired replies. The limited UAT blanking of the TCAS/ACAS receiver is not a significant factor.
5.2.3 Analysis of Impact on SSR Transponders
The impact of UAT occupation of the Mutual Suppression Bus on SSR transponders was also considered. This was looked at from the perspective of the addition of UAT suppression interval to transponder availability. With the exception of the Acquisition and Extended Squitter transmissions of a Mode S transponder, the transponder transmits on a request basis from Ground and Airborne interrogators, including Ground SSR Mode A/C/S, both EnRoute and Terminal, and TCAS/ACAS. Transponder availability is impacted by several mechanisms. Transponders have side lobe suppression (SLS) functionality to inhibit the transponder from responding to interrogations for a defined interval (typically 35 microseconds). Ground interrogators use SLS to prevent transponders from replying to interrogations that are not within the main beam of the rotating antenna. The transponder is additionally not available due to active interrogation acceptance/reply and recovery interval. In high density airspace, where the number of Ground interrogators and the number of aircraft is high, the transponder has a reduced availability due to the high number of interrogations. The transponder is also not available due to other on-board L-Band systems such as TCAS/ACAS and DME that blank the transponder receiver. Worst case transponder availability relative to all of these factors can be determined for a high density environment by using the number of SSR Mode A/C/S and TCAS/ACAS interrogations in the Core Europe 2015 future high density scenario contained in Appendix C, Table C-5, along with measured data from high density areas. The worst case transponder availability is calculated to be around 90%. The addition of the UAT Mutual Suppression Bus blanking of the SSR transponder receiver reduces the availability at most from 90% to 89.957%. This reduction is not a significant impact to SSR transponders.
5.3 Sharing antennas with SSR transponder
A potential method of providing an antenna for the UAT is to use a passive frequency Diplexer that is installed between an existing transponder and its antenna. The use of a Diplexer to operate UAT equipment and the on-board SSR transponder must insure proper operation of UAT equipment and SSR transponders. Certain characteristics were critical to enable the use of a Diplexer. The power loss across the Diplexer was an important consideration. The typical cable attenuation that installations allow between the SSR transponder and antenna is 3 dB. The Diplexer cannot use up a significant portion of this allocation without eliminating most existing transponder installations as candidates for UAT antenna sharing. The requirement that the Diplexer loss cannot exceed 0.5 dB is expected to enable most existing installations to use a Diplexer and share the transponder antenna. The goals of the Diplexer design were to support a

35
© 2004
transponder port that would minimize the insertion loss in the 1090 / 1030 MHz band and possessing adequate passband so that 1030 MHz interrogation signals and 1090 MHz reply signals were unaffected by the Diplexer. An optional DC path in the Diplexer’s Transponder Diplexer Channel is allowed so that installations that require antenna sensing can maintain the capability to sense the presence of an antenna. The Diplexer’s Transponder Diplexer Channel will attenuate signals at 978 MHz, providing isolation from the UAT. In some cases, Diplexer isolation actually exceeds the level of isolation obtained by using separate transponder and UAT antennas. The latter is a function of distance between antennas. The UAT’s Diplexer port can provide minimal insertion loss to the antenna at 978 MHz while manifesting a high impedance at the 1030 / 1090 MHz band.
5.3.1 Optional Diplexer Requirements
An option to use a passive frequency Diplexer is provided to allow sharing of a single antenna between the Mode A/C/S Transponder and the UAT unit is provided herein. Sharing a common antenna between the two systems may be desirable in aircraft to minimize antenna installation cost and complexity. The Diplexer is a passive device and consists of three ports that provide connectivity from the UAT port to the antenna port (UAT Diplexer Channel) and connectivity from the Mode A/C/S port (Transponder Diplexer Channel) to the antenna port. The UAT Diplexer Channel frequency response requirements insure adequate passband bandwidth around the 978 MHz UAT frequency to insure that UAT signal integrity is maintained through the UAT unit, Diplexer and antenna path. Likewise, the Transponder Diplexer Channel frequency response requirements insure adequate passband bandwidth around the 1030 MHz and 1090 MHz frequencies to insure that interrogation and reply signal integrity is maintained through the transponder, Diplexer and antenna path. The Diplexer characteristics must insure that performance of both the UAT and Transponder systems is equivalent to their performance without the Diplexer with the exception of the attenuation and delay of signal through the Diplexer. The insertion loss and delay characteristics of the Diplexer must be taken into consideration when determining cable loss and cable delay budgets between the UAT unit and antenna and the Transponder and the antenna. The use of the Diplexer does not preclude the UAT from driving the suppression bus during UAT transmissions. Diplexer installations must include connection and use of the suppression bus driven by the UAT and received by the Transponder. Installations that incorporate the Diplexer must insure that the off frequency power seen by the front end of the UAT equipment and the Mode A/C/S transponders through the Diplexer are within the design tolerances of each unit to insure proper operation. The design of the UAT needs to consider the power seen at the input from the transponder and it should be verified that the transponder design can handle the UAT power through the isolation provided by the Diplexer.
5.3.1.1 The UAT Diplexer Channel
The Diplexer includes a UAT Channel that conveys UAT signals without distortion of the waveform. The UAT Diplexer Channel conveys UAT Basic, Long and Ground Uplink Messages while maintaining the modulation accuracy of the input UAT signals as specified in §12.4.3 in the UAT RF SARPs, and produce no more than 0.5 dB amplitude attenuation and no more than 30 nanoseconds in propagation delay. Additionally, the variation in delay is no more than 10 nanoseconds over the frequency band of 977 MHz

36
© 2004
to 979 MHz. The UAT Diplexer Channel provides a passband from no greater than 977 MHz to no less than 979 MHz (2.0 MHz minimum) and a maximum attenuation of 0.5 dB. The minimum and maximum attenuation in the passband are different by no greater than 0.20 dB. The UAT port of the Diplexer is capable of peak power transmissions according to the appropriate aircraft equipage class given by Table 2-1. The VSWR produced by the Diplexer at the UAT port, when the other two ports are terminated in a 50 ohm load, does not exceed 1.3:1 for frequencies within the passband.
5.3.1.2 The Transponder Diplexer Channel
The Diplexer includes a Transponder Diplexer Channel that conveys received 1030 MHz interrogation and 1090 MHz reply signals without distortion of the waveform. The Transponder Diplexer Channel conveys pulses that are amplitude modulated on either 1030 MHz or 1090 MHz and having rise and fall times of 50 nanoseconds or more and produce no more than 0.5 dB amplitude attenuation and no more than 10 nanoseconds delay while retaining the pulse rise and fall times and pulse width of the input pulses. Additionally, the variation in delay is no more than 5 nanoseconds over the frequency band of 1015 MHz to 1105 MHz. The Transponder Diplexer Channel provides a passband from no greater than 1015 MHz to no less than 1105 MHz (90 MHz minimum) and a maximum attenuation of 0.5 dB. The minimum and maximum attenuation in the passband are different by no greater than 0.20 dB. The Transponder port is capable of handling 1000 Watts instantaneous power. The VSWR produced by the Diplexer at the Transponder port, when the other two ports are terminated in a 50 ohm load, does not exceed 1.3:1 for frequencies within the passband. If required by the transponder installation, the Diplexer supports DC coupling from the Transponder port to the antenna port as required by the electrical characteristics of the installed equipment.
5.3.1.3 UAT Diplexer Channel to Transponder Diplexer Channel Isolation
The Diplexer provides RF isolation between the UAT Diplexer Channel and the Transponder Diplexer Channel. The Diplexer provides a minimum of 50 dB of isolation between these ports at 1090 MHz. Additionally, the Diplexer provides a minimum isolation of 30 dB between the UAT and Transponder ports of the Diplexer at 1030 MHz. The Diplexer provides a minimum of 20 dB of isolation between the ports at 978 MHz.
Note: Installations that incorporate the Diplexer must insure that the off frequency power seen by the front end of the UAT equipment and the SSR Mode A/C/S transponders through the Diplexer are within the design tolerances of each unit to insure proper operation. It has been determined that the isolations provided above should insure safe operation for most transponder designs with respect to off frequency effects. The design of the UAT needs to consider the power seen at the input from the transponder and it should be verified that the transponder design can handle the UAT power through the isolation provided.

37
© 2004
5.4 Compatibility with SSR If Not Sharing Antennas
This compatibility is assured by the UAT equipment providing suppression pulses as provided by section 4.2 of the UAT Technical Manual, and the supporting analysis shown in section 5.3 above.
5.5 Delivery of Timing Signals to the UAT System
5.5.1 Background
The UAT Technical Manual contains timing requirements related to both the transmission of ADS-B Messages and reception of ADS-B and Ground Uplink Messages. The primary objective of these requirements is to support a range measurement between an ADS-B Transmitting and Receiving Subsystems that is independent of the ADS-B reported position data. This range calculation can be made from knowledge of the precise Time of Message Transmission (TOMT) and Time of Message Receipt (TOMR) of ADS-B Messages. An ADS-B validation technique can compare this one-way time of propagation range measurement with the range determined from the ADS-B Message to increase confidence that the message came from a bona fide transmitter. As an example, certain pairwise procedures may only be authorized when the range to the other aircraft in the pair passes appropriate validation tests.
This ADS-B validation technique should only be used in cases where both the transmitting and receiving stations are UTC coupled, that is, they are receiving time from a GPS/GNSS source or equivalent. A non-UTC coupled condition can occur due to a temporary unavailability of the GPS/GNSS source or equivalent. At any given time, a UAT transmitter is obligated to announce whether or not it is in the UTC coupled condition.
The purposes of the following sections are:
1. Document the expected total installed end-to-end timing performance as guidance to UAT installers and to developers of ADS-B validation applications.
2. Provide rationale for the timing related requirements given in the UAT Technical Manual in the context of the expected total installed performance.
3. List additional considerations for developing ADS-B validation techniques.
5.5.2 Installed End-End Timing Performance
Listed below are the identified components of possible timing errors and their assumed worst-case values using a GPS/GNSS source as an example.
a) Errors due to the GPS signal in space: This is assumed bounded by the performance
specifications of the GPS Standard Positioning Service with SA OFF. Uncertainty range = -100 to +100 ns.
38
© 2004
b) GPS antenna and coax effects. This is assumed bounded by a 20 meter maximum installed cable length. Uncertainty range = 0 to +66 ns
c) GPS-UTC time offsets: This is applicable to GPS receivers that output GPS time
instead of UTC time. Since GPS sensors that may be used for ADS-B are not required to make the UTC correction, this offset must be included. GPS specifications allow GPS time to deviate from UTC time by up to 1 microsecond. This is expected to be very conservative. Uncertainty range = -1000 ns to +1000 ns.
d) Delays due to interconnection of GPS sensor and UAT: This component applies to
installations with external UTC coupled time source. Allowance is needed for delays induced in lightening protection filters and interconnect cable capacitance between the GPS/GNSS sensor and the UAT. Total uncertainty range based on tests has been determined to be = 0 to +800 ns.
e) UAT Tx/Rx time errors: These are errors due to control of transmitter turn on and in
marking message time of arrival within the receiver. An uncertainty range specifically for this component is established in the UAT Technical Manual. Uncertainty range = -500 ns to +500 ns.
f) UAT antenna/coax effects: This is assumed bounded by a 20 meter maximum
installed cable length. Uncertainty range = 0 to +66 ns
While some of the timing errors are of a fixed offset nature, it was determined that any form of timing calibration procedure required of the UAT system installer would be undesirable.
Table 5-1 shows the worst case timing offset possible between a transmitting UAT and a receiving UAT given the individual error components listed above. This suggests that a value just under 0.7 NM would represent the absolute worst-case range measurement error due to timing offsets between transmitter and receiver under normal (UTC Coupled) conditions.
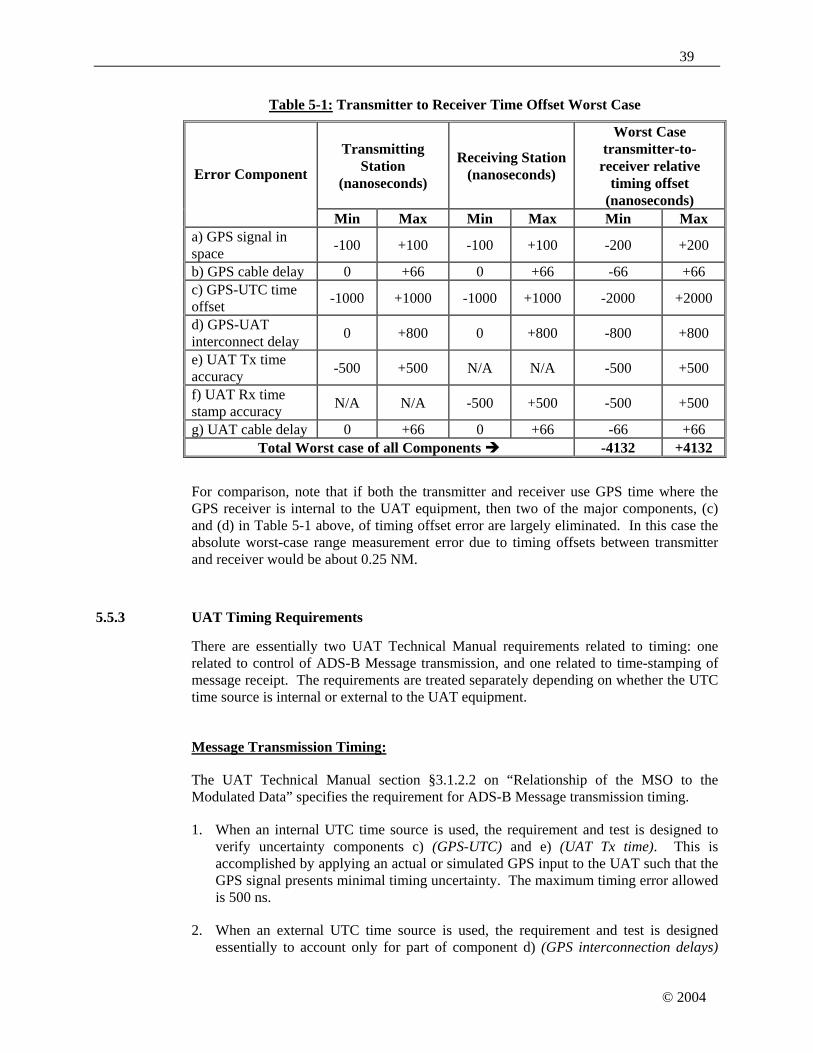
39
© 2004
Table 5-1: Transmitter to Receiver Time Offset Worst Case
Transmitting Station
(nanoseconds)
Receiving Station(nanoseconds)
Worst Case transmitter-to-
receiver relative timing offset
(nanoseconds)
Error Component
Min Max Min Max Min Max a) GPS signal in space -100 +100 -100 +100 -200 +200
b) GPS cable delay 0 +66 0 +66 -66 +66 c) GPS-UTC time offset -1000 +1000 -1000 +1000 -2000 +2000
d) GPS-UAT interconnect delay 0 +800 0 +800 -800 +800
e) UAT Tx time accuracy -500 +500 N/A N/A -500 +500
f) UAT Rx time stamp accuracy N/A N/A -500 +500 -500 +500
g) UAT cable delay 0 +66 0 +66 -66 +66 Total Worst case of all Components -4132 +4132
For comparison, note that if both the transmitter and receiver use GPS time where the GPS receiver is internal to the UAT equipment, then two of the major components, (c) and (d) in Table 5-1 above, of timing offset error are largely eliminated. In this case the absolute worst-case range measurement error due to timing offsets between transmitter and receiver would be about 0.25 NM.
5.5.3 UAT Timing Requirements
There are essentially two UAT Technical Manual requirements related to timing: one related to control of ADS-B Message transmission, and one related to time-stamping of message receipt. The requirements are treated separately depending on whether the UTC time source is internal or external to the UAT equipment.
Message Transmission Timing:
The UAT Technical Manual section §3.1.2.2 on “Relationship of the MSO to the Modulated Data” specifies the requirement for ADS-B Message transmission timing.
1. When an internal UTC time source is used, the requirement and test is designed to verify uncertainty components c) (GPS-UTC) and e) (UAT Tx time). This is accomplished by applying an actual or simulated GPS input to the UAT such that the GPS signal presents minimal timing uncertainty. The maximum timing error allowed is 500 ns.
2. When an external UTC time source is used, the requirement and test is designed essentially to account only for part of component d) (GPS interconnection delays)

40
© 2004
and component e) (UAT Tx time). This is accomplished by applying a test 1PPS or Time Mark input that is essentially free of uncertainty components a), b), c), and most of d). The maximum timing error allowed is 500 ns.
Accuracy of Time Stamping on Message Receipt:
The UAT Technical Manual section §4.1.1 on “Receiver Time of Message Receipt” specifies the requirement for time-stamping of received messages.
1. When an internal UTC time source is used, the requirement and test is designed to verify uncertainty components c) (GPS-UTC) and e) (UAT Rx timestamp). This is accomplished by applying an actual or simulated GPS input to the UAT such that the GPS signal presents minimal timing uncertainty. The maximum timing error allowed is 500 ns.
2. When an external UTC time source is used, the requirement and test is designed essentially to account only for part of component d) (GPS interconnection delay) and component e) (UAT Rx timestamp). This is accomplished by applying a test 1PPS or Time Mark input that is essentially free of uncertainty components a), b), c), and most of d). The maximum timing error allowed is 500 nanoseconds.
5.5.4 Considerations for ADS-B Validation Techniques
Receiver Time of Message Receipt (TOMR)
The UAT Technical Manual details the requirements for accuracy and resolution of making the raw measurements on which a range calculation can be made. TOMR is relative to the start of the UTC second, and is reported in units of 100 nanoseconds.
The UAT receiver or an external application can directly calculate the range to the target by knowing how many whole and fractions of an MSO (250 microseconds) elapsed between transmission and receipt of the message. The fractional portion is directly calculated from each SV report received, which gives fine-scale resolution to about 30 meters (100 nanoseconds times 3.0e+8 meters/second). The integer portion provides resolution of about 40.47 NM (250 microseconds times 3.0e+8 meters/second)
Acquisition of full TOMR Range
The full TOMR range (integer and fractional parts) can be determined once a Long ADS-B message containing the Transmission Epoch field has been received (the Long Type 1 ADS-B message). The Transmission Epoch field has sufficient span to unambiguously identify in which MSO the message was transmitted. The receiving UAT or the external application can then calculate the integer portion of TOMR, and derive the full TOMR value.
Once the full TOMR range has been acquired, the fractional portion can be used to maintain a track of the range value during the interval between receipts of a message containing the Transmission Epoch.

41
© 2004
TOMR Range Filtering
The raw TOMR range values will likely require some filtering prior to use. An alpha-beta recursive filter, which allows for uneven time between message receptions (because of dropped messages, etc.), can be used to both smooth and predict range values.
Correlation of TOMR Range vs. SV-based Range
Slant Range: The filtered range value includes the slant range effects, and will normally exceed the great-circle range calculated from the SV position of the target and the ownship SV position. The correlation of the target’s range will require either some compensation of the great-circle range to include an estimate of the slant range, or a correlation window that has greater tolerance for increased slant range at high elevation angles. Since it is possible that some targets may not be reporting their altitude, provision must be made for cases where slant range compensation is not possible.
Datalink latency: One other phenomenon affecting the TOMR range calculation is that the range measured is based on the time of transmission, while the SV-based range calculation is based on the message Time of Applicability. This can lead to some additional variation between the measured and calculated range, which would be particularly noticeable in head-on or reciprocal encounters at high velocity. For example, at a closing rate of 1200 knots, the range closes at about 620 meters per second. The range differential amounts to at most 0.33 NM.
Note that for a given pair of aircraft, most of the timing errors can either be compensated for, or are fixed intervals. This allows the possibility that the residual range differential (after removal of fixed or compensate-able errors) could be used as an independent means of closure rate measurement.

42
© 2004
6 UAT Ground Infrastructure
This section describes the working concept for a UAT ground infrastructure. This infrastructure supports the ground-air segment of the overall UAT network. This is not intended to be a specification or set of requirements for such a ground infrastructure, but rather a context in which to understand the intentions of the UAT data link and the provisions made to support the ground infrastructure.
6.1 General Description
The role of the ground infrastructure is twofold:
1. To receive ADS-B broadcasts and generate a summary of the air traffic in a given area, possibly fusing it with other surveillance data (e.g. radar or multilateration systems).
2. To transmit this traffic data along with other flight service information, e.g. weather, NOTAMS, to aircraft for use in the cockpit.
There is considerable flexibility for the deployment and functionality of the ground infrastructure. The receive and transmit functions may be physically separate and even have different providers, or they could be a single ground network of transceivers feeding an integrated system providing all the above functions. This will probably be decided more by economics and regulations than by engineering design. This section only describes enough of the system to allow understanding of the UAT data link and be reasonably sure that it will provide the necessary functionality.
6.1.1 Uplink: Broadcast
6.1.1.1 Geometric Coverage
Because of the limited range and geometry of a single ground station, a network of ground broadcast transmitting stations will be required. Each station will have associated with it two types of coverage. One is the radio coverage of the transmitted signal. This is the airspace that can be usefully reached by signal from the ground station. The other type of coverage is the product coverage. This is the geographic scope of responsibility the ground station assumes for each product (such as a weather map) broadcast. Two product categories, TIS-B and FIS-B, are discussed separately, since they require different strategies.
6.1.1.1.1 Radio Coverage
In designing the radio coverage, there are two concerns. One is the coverage being relied upon. This is the minimum required coverage. The other is the maximum coverage under the “best” conditions. This can cause reception by an aircraft of transmissions form one ground station to be interfered with by transmissions from a second ground station distant to the first. Minimum radio coverage is designed to assure proper data link
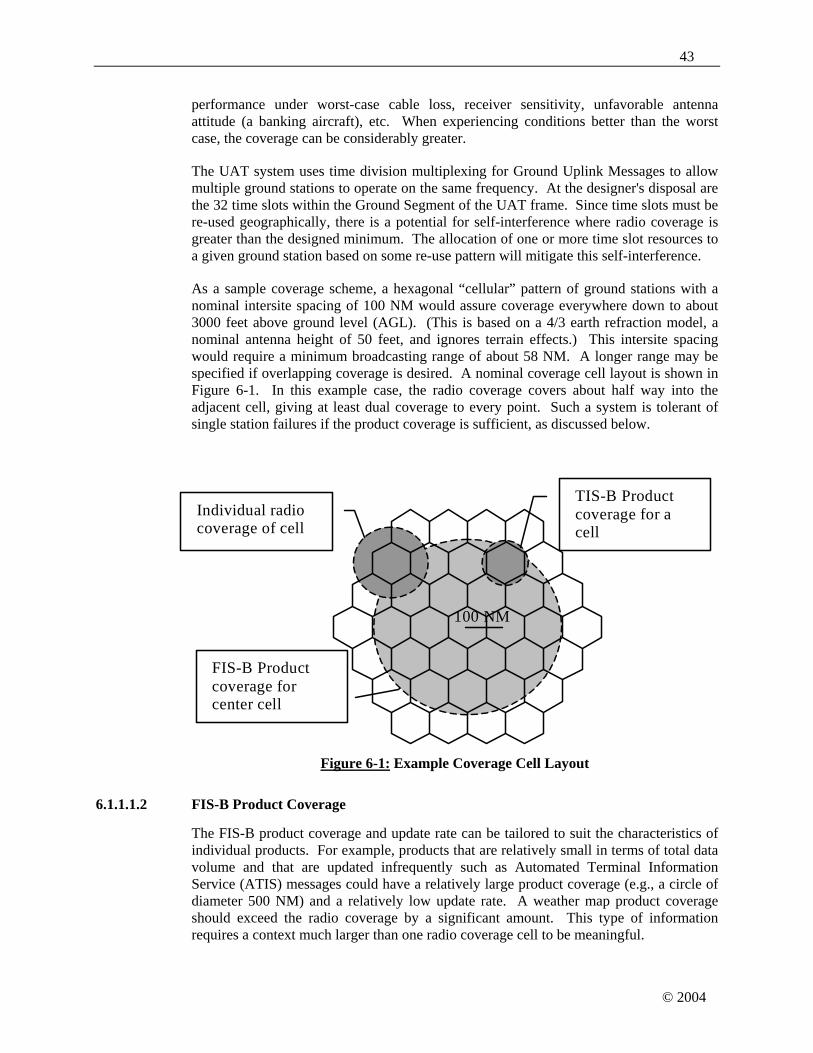
43
© 2004
performance under worst-case cable loss, receiver sensitivity, unfavorable antenna attitude (a banking aircraft), etc. When experiencing conditions better than the worst case, the coverage can be considerably greater.
The UAT system uses time division multiplexing for Ground Uplink Messages to allow multiple ground stations to operate on the same frequency. At the designer's disposal are the 32 time slots within the Ground Segment of the UAT frame. Since time slots must be re-used geographically, there is a potential for self-interference where radio coverage is greater than the designed minimum. The allocation of one or more time slot resources to a given ground station based on some re-use pattern will mitigate this self-interference.
As a sample coverage scheme, a hexagonal “cellular” pattern of ground stations with a nominal intersite spacing of 100 NM would assure coverage everywhere down to about 3000 feet above ground level (AGL). (This is based on a 4/3 earth refraction model, a nominal antenna height of 50 feet, and ignores terrain effects.) This intersite spacing would require a minimum broadcasting range of about 58 NM. A longer range may be specified if overlapping coverage is desired. A nominal coverage cell layout is shown in Figure 6-1. In this example case, the radio coverage covers about half way into the adjacent cell, giving at least dual coverage to every point. Such a system is tolerant of single station failures if the product coverage is sufficient, as discussed below.
Individual radio coverage of cell
FIS-B Product coverage for center cell
100 NM
TIS-B Product coverage for a cell
Figure 6-1: Example Coverage Cell Layout
6.1.1.1.2 FIS-B Product Coverage
The FIS-B product coverage and update rate can be tailored to suit the characteristics of individual products. For example, products that are relatively small in terms of total data volume and that are updated infrequently such as Automated Terminal Information Service (ATIS) messages could have a relatively large product coverage (e.g., a circle of diameter 500 NM) and a relatively low update rate. A weather map product coverage should exceed the radio coverage by a significant amount. This type of information requires a context much larger than one radio coverage cell to be meaningful.

44
© 2004
When an aircraft receives uplinks from multiple ground stations, it has the task of fusing these data. This task can be minimized by having the ground infrastructure assure that redundant information from different ground stations is identical. For example, adjacent uplink stations reporting precipitation strength for a given point or grid element should report exactly the same data. Then the application in the aircraft need only associate the reports and choose either for displaying or processing (rather than averaging, interpolating, or inferring data integrity). Note that with autonomous, isolated ground stations this is not an issue.
Looking back at Figure 6-1, a sample product coverage is shown along with radio coverage for a single cell. For this coverage, there is ample overlap for at least dual coverage of any point and a seamless, consistent picture of the product as the aircraft flies through, even with failure of a single ground station.
6.1.1.1.3 TIS-B Product Coverage
A product such as traffic data (TIS-B) calls for a relatively high update rate and a smaller coverage area to keep data link bandwidth requirements at a reasonable level. TIS-B product coverage, in contrast to FIS-B data, should actually be smaller than the radio coverage, assuming that the radio coverage has significant overlap to assure no coverage gaps. TIS-B overlap between sites should be just enough to assure service continuity across the boundary. This approach keeps the load on the data link as low as possible and minimizes the burden on the ADS-B Receiving Subsystems to eliminate redundant reports.
6.1.1.2 Data Source for Ground Broadcast
Contents of the ground broadcast messages can be put in the following categories:
1. Flight Information Services-Broadcast (FIS-B) – the broadcast distribution of weather and aeronautical information.
2. Traffic information from other surveillance sources (radar, multilateration) – this augments the ADS-B data received directly from the air-to-air link.
3. ADS-B data collected from non-UAT links.
4. Other.
In the UAT data link, FIS-B and “other” information is sent during the ground broadcast segment. Traffic uplink (TIS-B) data can be sent during the air-to-air segment of the UAT epoch in a form similar to the air-to-air format or during the ground segment in a special uplink format.
There are many possible configurations for the flow of information for the uplink stations. Not all stations need to be configured the same way. The one chosen will depend on the products being provided. In any case, the UAT equipment is a minor part of the ground system. The system will be primarily defined by the ground communication links (satellite, land line (phone, fiber) or microwave or other dedicated RF link), by the sources of the data for ground broadcast (radar, multilateration, weather
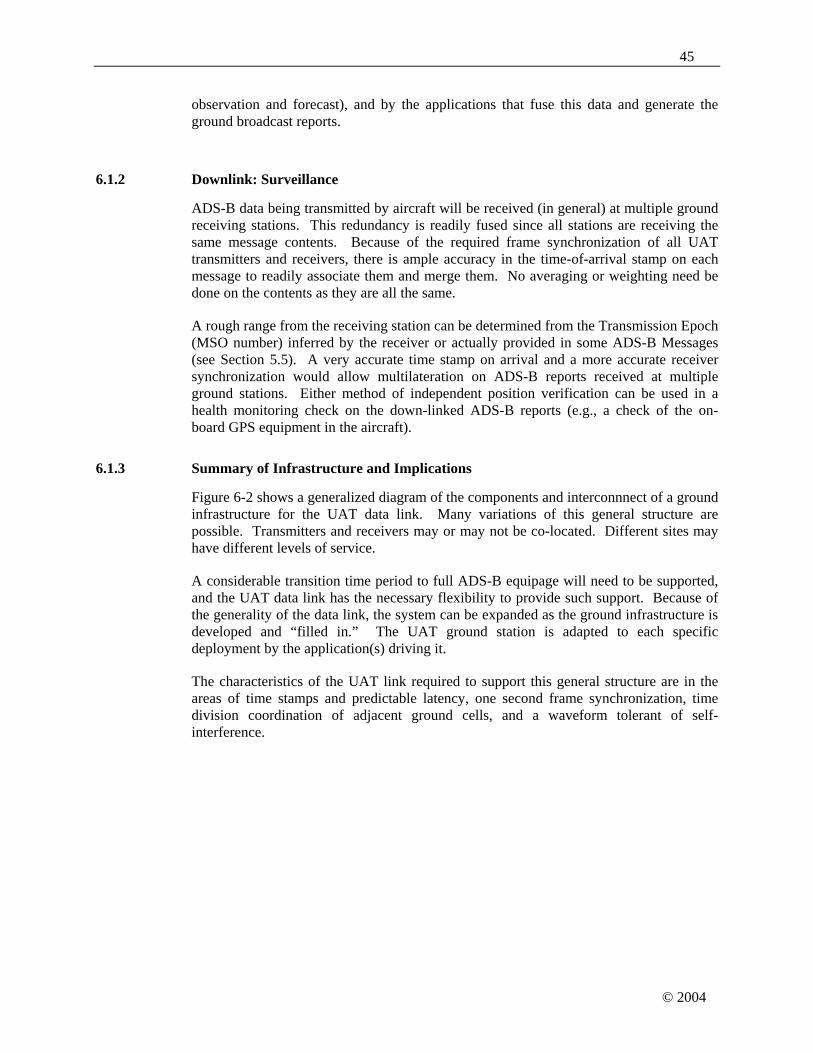
45
© 2004
observation and forecast), and by the applications that fuse this data and generate the ground broadcast reports.
6.1.2 Downlink: Surveillance
ADS-B data being transmitted by aircraft will be received (in general) at multiple ground receiving stations. This redundancy is readily fused since all stations are receiving the same message contents. Because of the required frame synchronization of all UAT transmitters and receivers, there is ample accuracy in the time-of-arrival stamp on each message to readily associate them and merge them. No averaging or weighting need be done on the contents as they are all the same.
A rough range from the receiving station can be determined from the Transmission Epoch (MSO number) inferred by the receiver or actually provided in some ADS-B Messages (see Section 5.5). A very accurate time stamp on arrival and a more accurate receiver synchronization would allow multilateration on ADS-B reports received at multiple ground stations. Either method of independent position verification can be used in a health monitoring check on the down-linked ADS-B reports (e.g., a check of the on-board GPS equipment in the aircraft).
6.1.3 Summary of Infrastructure and Implications
Figure 6-2 shows a generalized diagram of the components and interconnnect of a ground infrastructure for the UAT data link. Many variations of this general structure are possible. Transmitters and receivers may or may not be co-located. Different sites may have different levels of service.
A considerable transition time period to full ADS-B equipage will need to be supported, and the UAT data link has the necessary flexibility to provide such support. Because of the generality of the data link, the system can be expanded as the ground infrastructure is developed and “filled in.” The UAT ground station is adapted to each specific deployment by the application(s) driving it.
The characteristics of the UAT link required to support this general structure are in the areas of time stamps and predictable latency, one second frame synchronization, time division coordination of adjacent ground cells, and a waveform tolerant of self-interference.
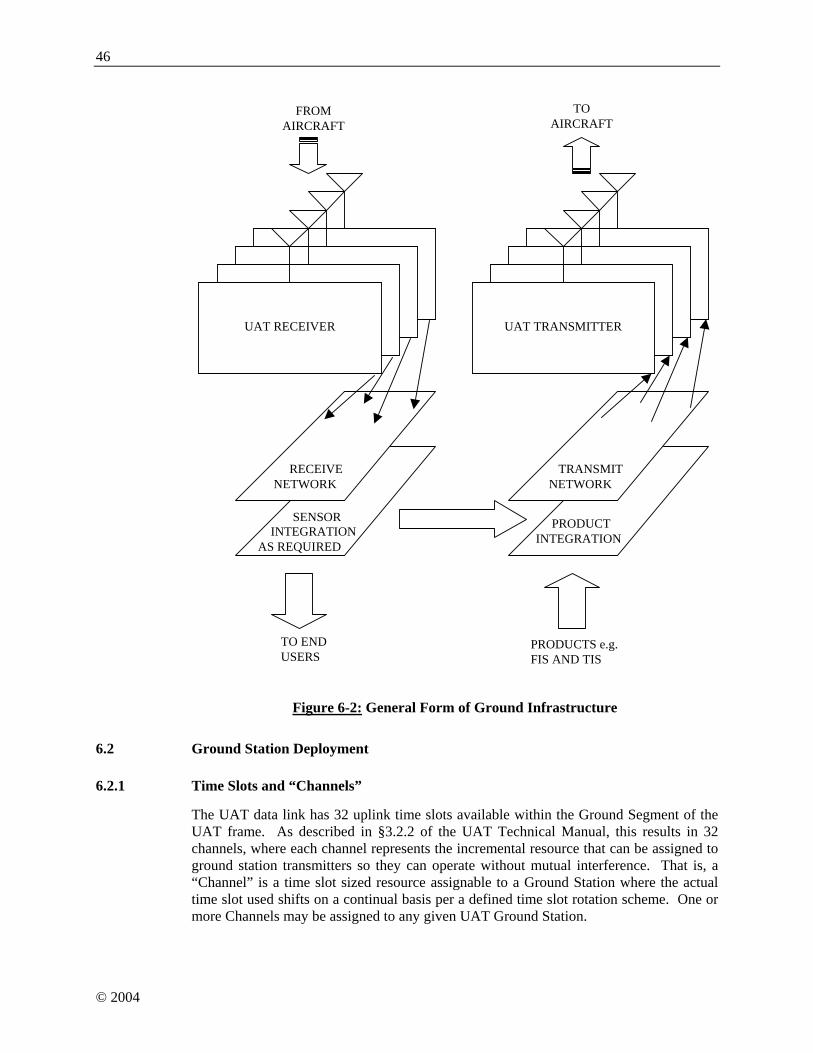
46
© 2004
UAT RECEIVERUAT RECEIVER
UAT RECEIVERUAT RECEIVER
UAT RECEIVERUAT RECEIVER
UAT RECEIVERUAT TRANSMITTER
RECEIVENETWORK
TRANSMITNETWORK
SENSOR INTEGRATIONAS REQUIRED
PRODUCTINTEGRATION
TOAIRCRAFT
TO ENDUSERS
PRODUCTS e.g.FIS AND TIS
FROMAIRCRAFT
Figure 6-2: General Form of Ground Infrastructure
6.2 Ground Station Deployment
6.2.1 Time Slots and “Channels”
The UAT data link has 32 uplink time slots available within the Ground Segment of the UAT frame. As described in §3.2.2 of the UAT Technical Manual, this results in 32 channels, where each channel represents the incremental resource that can be assigned to ground station transmitters so they can operate without mutual interference. That is, a “Channel” is a time slot sized resource assignable to a Ground Station where the actual time slot used shifts on a continual basis per a defined time slot rotation scheme. One or more Channels may be assigned to any given UAT Ground Station.
47
© 2004
A conservative approach to allocating the channels is to give one channel to each ground station. In a hexagonal deployment, for example, the nearest station using the same channel as a given station will on average be about 6 cell spacings away. (A cell and 3 tiers around it totals 37 cells. This is roughly a circle with a diameter of 7 individual cell spacings.) Considering propagation loss and the horizon, there would be essentially no chance of significant interference.
It will be desirable to have higher slot re-use in practice. This will allow the uplink bandwidth necessary for each ground station to deliver its entire product. A re-use pattern of 7 will meet this objective by allowing cells to re-use a given channel to be separated by about 2.5 cell diameters as shown in Figure 6-3.
BGE
CDAF
BGE
AF
CD
Figure 6-3: 7-Cell Re-Use Pattern
Note: The cell re-use pattern of Figure 6-3 is provided for illustrative purposes and is suitable for providing services within a limited altitude range. A possible approach that covers a wide range of altitudes is discussed in Section 7.3.
6.2.2 Antenna Considerations for Uplink
Considering the cell re-use described above, the possibility arises for self-interference with the UAT signal. The Ground Uplink Message can readily be received in self-interference if the interference is sufficiently below the desired signal level. The required ratio depends on the target density and distribution. The two figures below show a self-interference analysis for the following set of ground station assumptions:
• 7 cell re-use pattern
• 90 NM inter-site spacing of ground stations
• 10 dB desired/undesired signal ratio for successful receipt of Ground Uplink Messages (this figure does not take into account antenna pattern variations for the desired and undesired signals at the receiving aircraft).
Each figure shows two sets of seven cells in a repeating reuse pattern as in Figure 6-3. Consider the two cells labeled “G” sharing channel resources. The shaded area in each
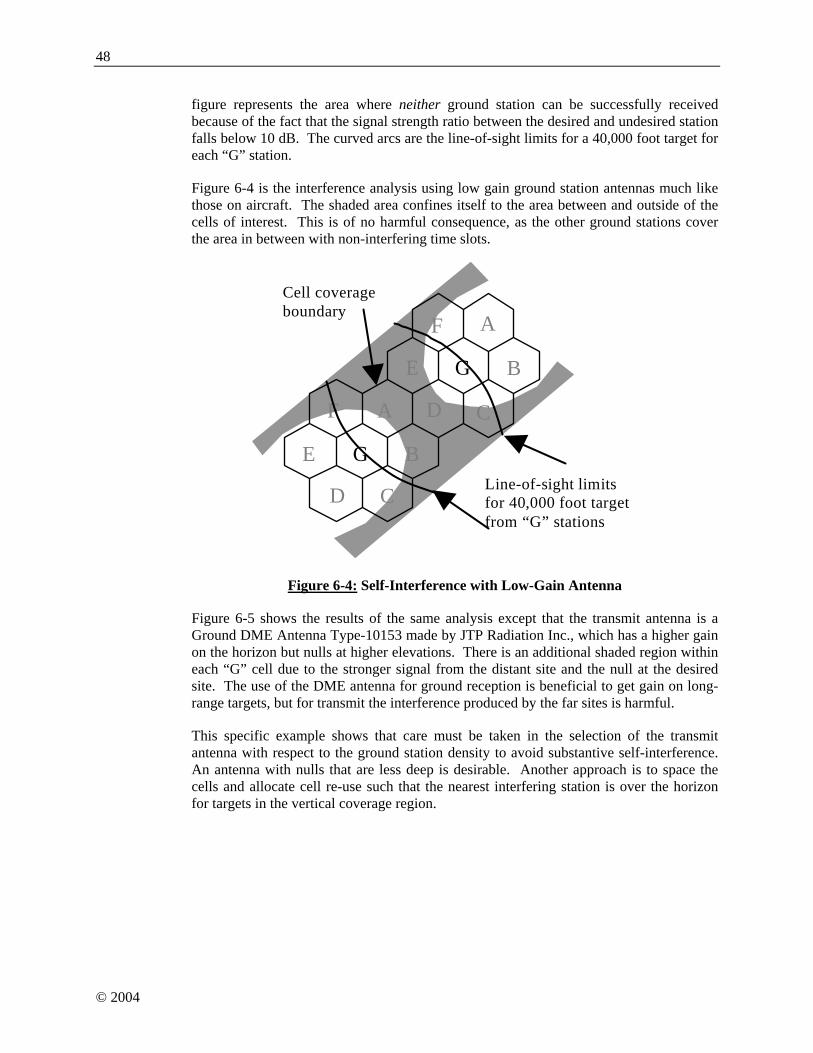
48
© 2004
figure represents the area where neither ground station can be successfully received because of the fact that the signal strength ratio between the desired and undesired station falls below 10 dB. The curved arcs are the line-of-sight limits for a 40,000 foot target for each “G” station.
Figure 6-4 is the interference analysis using low gain ground station antennas much like those on aircraft. The shaded area confines itself to the area between and outside of the cells of interest. This is of no harmful consequence, as the other ground stations cover the area in between with non-interfering time slots.
BGE
CDAF
BGE
AF
CD
Cell coverageboundary
Line-of-sight limitsfor 40,000 foot targetfrom “G” stations
Figure 6-4: Self-Interference with Low-Gain Antenna
Figure 6-5 shows the results of the same analysis except that the transmit antenna is a Ground DME Antenna Type-10153 made by JTP Radiation Inc., which has a higher gain on the horizon but nulls at higher elevations. There is an additional shaded region within each “G” cell due to the stronger signal from the distant site and the null at the desired site. The use of the DME antenna for ground reception is beneficial to get gain on long-range targets, but for transmit the interference produced by the far sites is harmful.
This specific example shows that care must be taken in the selection of the transmit antenna with respect to the ground station density to avoid substantive self-interference. An antenna with nulls that are less deep is desirable. Another approach is to space the cells and allocate cell re-use such that the nearest interfering station is over the horizon for targets in the vertical coverage region.

49
© 2004
BGE
CDAF
BGE
AF
CD Additional lostcoverage
Figure 6-5: Self-Interference with DME-Type Antenna
6.2.3 TIS-B Site Identifier (ID)
Each station is assigned a TIS-B Site ID number (UAT Technical Manual §2.2.1.8). This number is not unique, having only a 4-bit value. The purpose of the ID is to give a brief (few bits) way of identifying the source of a TIS-B uplink message. This source identification is useful for confidence measures of time synchronization and to counteract spoofing. In low-density areas, only one station with a given ID will be within reception range. In more dense areas, more than one ground station can be received (but not a large number) with the same ID and any range checking can be performed, using uplinked ground station locations, on all stations with that ID to get verification.
As an example, consider a 7-cell reuse pattern of Channels. Figure 6-6 shows an assignment of 7 of the 32 Channels (labeled A through G) and of the 16 TIS-B Site ID numbers (labeled 0 through 15). To see the repeat pattern in this example, look at a cell with slot label “G” as the center of a 7-cell cluster. A through F are clockwise around it. These clusters are then packed hexagonally. This is just an illustrative example to demonstrate the idea.
The approximate reception area of an aircraft is shaded in Figure 6-6. The aircraft’s trajectory is shown by the arrowed line and the swath of the reception area is shown by the dotted lines. During the Ground Uplink Segment, the aircraft is solidly receiving data in Channels A, B, D, and E (labeled A9, B14, D10, and E5). The aircraft can tell that these stations are within a normal reception range based on the location broadcast in the uplink.
Table 6-1 shows a list of these locations and TIS-B Site ID’s as they can be kept in the aircraft’s ADS-B application. The aircraft receives uplinks on a given slot possibly from two different G ground stations (G13 and G6). The storage in a table of the locations of these ground stations permits the use of the range validation technique described in section 5.5.4. Entries can be dropped from the table when they are beyond range by

50
© 2004
some pre-determined amount. At the time shown, there are also two entries in the table with TIS-B Site ID 4 as well as two entries with TIS-B Site ID 8. Note that the Channel indicator (labeled A-G) in the table is for clarity of the example only. Retaining a Channel identifier is not important for the range validation technique or for any ground station function once propagation time has been computed.
Current radioreception
F15
B14
G13
C6
D5
A4
E12
C11
D10
A9
G1
E0
F8
B7
G6
E5
F12
C4
D3
A2
F1
B0
G8
E3
C2
F10
B9
D1
C13
D12
A7 E
14F
6
A2
F1
B0
G11
Path ofaircraft
Figure 6-6: Example of TIS-B Site ID and Channel
Table 6-1: Example of Site ID Table
TIS-B Site ID Location Channel
9 lat long A 14 lat long B 4 lat long C
10 lat long D 5 lat long E
13 lat long G 6 lat long G 8 lat long F
15 lat long F 11 lat long C 0 lat long E 4 lat long A 8 lat long G

51
© 2004
Each of these ground stations transmits TIS-B messages in the ADS-B Segment of the UAT frame. Since these are in random MSO’s, they can all be received with high probability. In addition, other more distant stations can transmit TIS-B messages and be received. When any TIS-B message arrives with its Site ID (0-15), its apparent distance from the aircraft (from the time-of-arrival) can be checked with all entries in the table having that Site ID. If it matches, that message is validated. If not, it can be rejected as unreliable.
It is possible that a legitimate TIS-B message can be rejected from a distant station based on this method, if the station is not on the list. This is not a problem because if the target is important to the aircraft it will be included in the TIS-B uplinks of a nearer station giving good range validation checks. This can be assured by the design of the product coverage for each cell.
6.2.4 Sectorized Cells and Co-Site Transmission Isolation
In some areas of dense air traffic, a ground station at maximum range can experience poor ADS-B target state update performance due to UAT self-interference. In this event, the area of coverage might be reduced, but it is undesirable to have multiple equipment sites to cover the range. An alternative solution to this problem is to co-locate several units with sectorized radio coverage.
In cases where UAT ground equipment is co-located with other transmitting equipment at a nearby frequency (e.g. a DME/TACAN installation at 979 MHz,) it is desirable to get as much rejection of that interfering signal as possible. In these cases, the same sectorized antenna mentioned above can also help. Section 6.3 discusses the required signal rejection in cases of interference.
Figure 6-7 shows a pattern for a 3-sector UAT ground station antenna. The solid curve is one sector and the dashed curves are the other two sectors. This pattern is representative of a DME-type column antenna with a reflector behind it to shape the pattern and block the backlobe. Figure 6-8 shows two possible geometries that will produce isolation between co-sited DME equipment and UAT equipment. The required isolation will depend on the power of the DME equipment and the desired maximum signal level of the interference at the UAT equipment. Sections B.4.1 and B.4.2 in Appendix B discuss performance with various scenarios of DME/TACAN interference. For a low-density scenario and a DME at 979 MHz, the UAT equipment can tolerate a DME level of –30 dBm. In a future Core Europe scenario, for example, the tolerable level is –50 dBm. This is discussed further in §6.3.2.
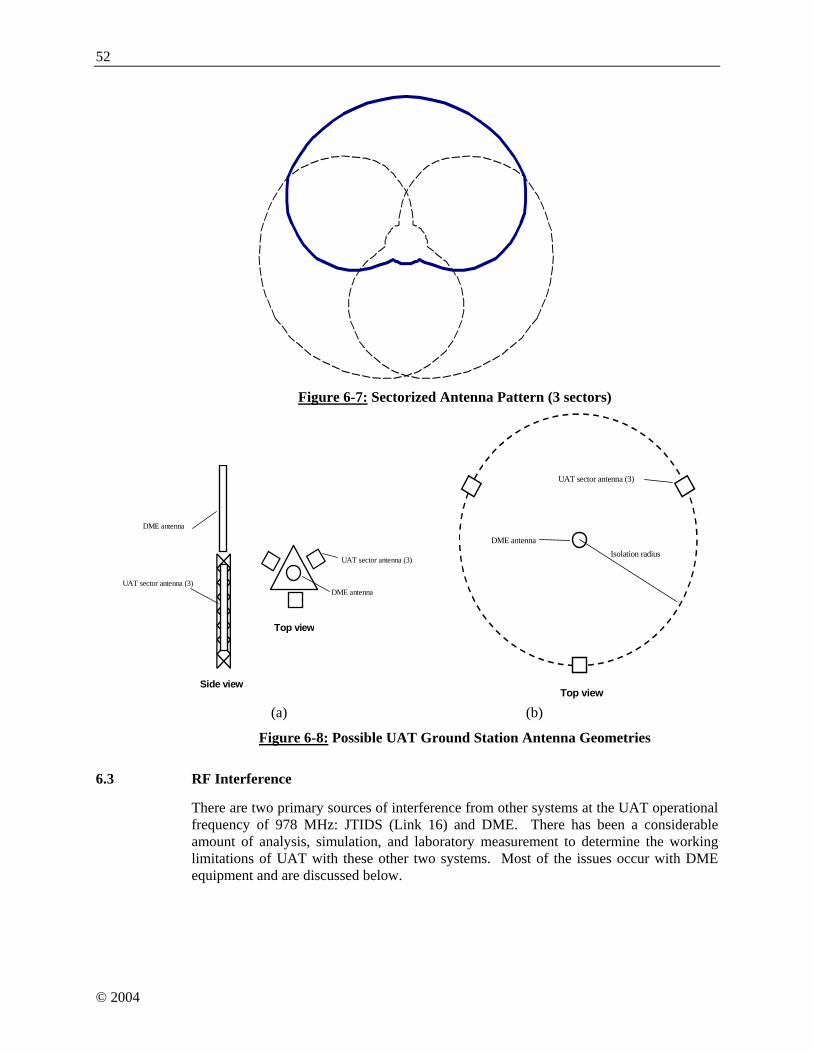
52
© 2004
Figure 6-7: Sectorized Antenna Pattern (3 sectors)
Side view
Top view
UAT sector antenna (3)
DME antennaUAT sector antenna (3)
DME antenna
Top view
UAT sector antenna (3)
DME antennaIsolation radius
(a) (b)
Figure 6-8: Possible UAT Ground Station Antenna Geometries
6.3 RF Interference
There are two primary sources of interference from other systems at the UAT operational frequency of 978 MHz: JTIDS (Link 16) and DME. There has been a considerable amount of analysis, simulation, and laboratory measurement to determine the working limitations of UAT with these other two systems. Most of the issues occur with DME equipment and are discussed below.
53
© 2004
6.3.1 JTIDS Interference
The mutual effects of JTIDS and UAT are discussed in Appendix D. In short, between the spread spectrum nature of JTIDS and the interference rejection of the UAT modulation, the systems operate compatibly.
6.3.2 DME Interference
An important source of interference to the UAT link operating at 978 MHz is DME equipment operating near that frequency. UAT/DME channel planning criteria to support future high-level UAT environments will specify that the closest assignable DME Ground Station transmitting frequencies relative to the UAT frequency of 978 MHz are the first adjacent DME channels. There are a small number of 978 MHz (Channel 17X) DME installations in several States. The effect of this is that UAT Ground Stations co-located with this DME equipment will experience degradation of the update rate on aircraft in a dense environment. This degradation can be mitigated by separating the UAT and DME ground equipment and by reassigning the DME equipment to other frequencies as the UAT equipage grows to higher levels.
For a DME/TACAN at 979 MHz and operating at 10 kW ERP (Effective Radiated Power) with siting to allow at least 1000 foot separation of the DME and UAT omni-directional antennas, there is a DME/TACAN signal level of approximately –10 dBm at the UAT ground station. Even with this separation (which may be too large for many installations), Appendix B indicates that this power level gives enough interference to cause unacceptable update time for UAT targets at range in a dense target scenario (such as the future traffic scenarios defined in Appendix B). In such a scenario, the interfering power level must be reduced to a level of –50 dBm. If the site is using sectorized antennas (Section 6.2.4) there may be, on the order of, a 25 dB attenuation by having the DME antenna in the UAT antenna backlobe. Vertical stacking of the antennas may yield even more isolation. The performance is ultimately a function of the interfering signal level.
Other possible techniques to achieve the necessary isolation are a very sharp (e.g. tuned cavity) filter, or adaptive cancellation on the UAT Ground Station. In the case of a filter, the approach would be to find a filter for the UAT receiver with acceptable in-band loss for the desired sensitivity to be achieved and then use the 979 MHz rejection of the filter to ease the burden on the antenna separation. A representative filter will give less than 5 dB of in-band (insertion) loss while rejecting the out-of-band (979 MHz) interference by 40 dB. This net benefit of 35 dB is available if the insertion loss can be tolerated by the receiver sensitivity and the intended range of the ground station.
In the case of adaptive cancellation, an auxiliary array can be positioned to sample the interferer signal or it can be delivered by a direct connection. The system can then adaptively subtract a replica of this sample from the received UAT signal to achieve the best signal-to-interference ratio. This approach requires considerable equipment expense, but may be economical in difficult siting situations if it avoids needing additional sites.
In environments where the nearest DME is at 980 MHz (or higher frequencies) instead of 979 MHz, the above isolation techniques are not likely to be necessary, provided that the DME and UAT Ground Stations are separated by a minimum of TBD feet.
54
© 2004
6.4 Multiple ADS-B Links
It is likely that the ADS-B system in high-density airspaces will include multiple data links. Through its support of ADS-B re-broadcast, the UAT data link is capable of supporting a multi-link deployment. Power levels and antenna locations are specified such that air-air as well as air-ground links are established over the coverage area. This allows information on any non-UAT ADS-B traffic to be obtained by the ground infrastructure and supplied to UAT-equipped aircraft.

55
© 2004
7 UAT Frequency Planning Criteria
As previously discussed, the UAT frequency channel is centered at 978 MHz with a nominal bandwidth of 1 MHz. UAT/DME frequency channel planning criteria to support future high-level UAT environments will specify that the closest assignable DME Ground Station transmitting frequencies relative to the UAT frequency of 978 MHz are the first adjacent DME channels.
7.1 Use of 978 MHz for DME/TACAN in Low-Level UAT Environments
Test, simulation and analysis have shown that UAT and co-frequency DME can be operated on a compatible basis when both the number of DME stations in view to the UAT is limited, and the density of UAT transmitters is low. As 978 MHz is only sparsely used for DME on a worldwide basis, the limiting factor is generally UAT density. Therefore, while low density UAT and 978 MHz DME are compatible, for States intending to implement UAT on a large scale, it is recommended that 978 MHz DMEs have their frequencies reassigned. It should be noted however that the use of 978 MHz for DME ramp test equipment can still be supported, as the characteristics of the operational interaction scenario for UAT-to-ramp tester serves to preclude interference.
7.2 DME/TACAN to UAT Ground Station Siting Criteria
Extensive testing has indicated no operationally significant impact to DME/TACAN in a high density UAT environment when DME/TACANs are receiving on the first upper adjacent DME channel (979 MHz) to the UAT frequency (978 MHz). A similar result can be inferred for DME reception at the lower first adjacent channel of 977 MHz. Analysis of an example approach/landing scenario in Core Europe 2015 has shown that first adjacent channel DME operation is also compatible with an environment that includes a nearby UAT ground station broadcasting at a high duty factor.
Any limitations on the siting of UAT ground stations vis-à-vis DME/TACANs are likely to result from the effects of DME/TACAN transmissions on UAT performance. This question has been studied by examining UAT performance with a first upper adjacent channel DME/TACAN ground station co-located with a UAT ground station receiver at a high density airport. Air-air, ground-air, air-ground, and surface-surface performance were studied. The result of the combined analysis of these cases is a recommendation that a sufficient level of isolation be provided between a DME/TACAN transmit antenna and a UAT receiver on the surface. This could be supplied through either separation by distance or some other means, and the amount of isolation required depends on the parameters of the DME/TACAN and the design of the UAT receive system. For example, a separation distance of around 1.2 km between a 10 kw DME/TACAN transmitting at 979 MHz and a three-sector UAT ground receive antenna at a high density airport in the Core Europe 2015 scenario provides more than adequate isolation for UAT air-ground operation. A similar separation distance would be sufficient for UAT and a DME/TACAN operating at a power level of 1 kw or less on the first lower adjacent channel of 977 MHz; further analysis on a case by case basis is required for a DME/TACAN operating at a power level above 1 kw on this frequency.

56
© 2004
ACTION #5: Need to include a table here that shows separation distance as a function of DME/TACAN power.
7.3 UAT Ground Station Channel Assignment Guidance
7.3.1 Introduction
In order to maximize the volume of airspace within which aircraft equipped with UAT receivers can receive up-linked information from Ground Stations (GS), the locations of the GS must be carefully chosen. In addition, the coverage volume depends critically on the way the ground up-link segment resources (32 Channels) are distributed among the GS. The set of one or more Channels assigned to a UAT Ground Station will be called the station’s “uplink resource allocation” (URA). The reason this maximization is not trivial is that there are two conflicting criteria that must be satisfied. In order to provide low-level coverage GS must be spaced closely together due to line-of-site (LOS) considerations. On the other hand, aircraft at high altitudes will see many of the closely-spaced GS. Thus, in order to avoid unwanted interference, all the GS within view of a particular aircraft should, to the degree possible, use separate URAs. This means that if a wide range of altitudes is to be supported, there may need to be many different URAs. However, the number of such sets is very limited. Assume, for the moment, that each GS has on the average four Channels’ worth of information to transmit each second. In that case, there will be only 8 URAs. In what follows it will be shown that the way these URAs are assigned to the GS can have a profound impact on the overall system coverage performance.
In the §7.3.2, an ideal case where the Earth is assumed to be a smooth sphere and where ground sites can be freely chosen to be on a nearly perfect hexagonal grid will be considered. In §7.3.3, a more realistic approach is considered where siting is constrained and terrain effects come into play.
7.3.2 Ideal Case
There are well-known rules for assigning resources on a hexagonal grid. Normally, the resource is a frequency assignment, but in this case it is a URA assignment. The rules are the same. There are certain allowable patterns such as the 7-fold pattern commonly used in cellular telephone systems. All the patterns employ a number of separate resources given by:
22 nmnmN ++=
where m and n are any two nonnegative integers. Below, the focus will be on patterns with N=3, N=4, and N=7. Each pattern will be referred to the by its value of N. For instance pattern (7) corresponds to m = 2 and n = 1.
Figure 7-1 shows pattern (4). (Only part of the grid is filled out. The remainder should be obvious.) The URA assignments are labeled A, B, C and D. Note that two of the A cells have been singled out by coloring them red and blue. These two have the potential
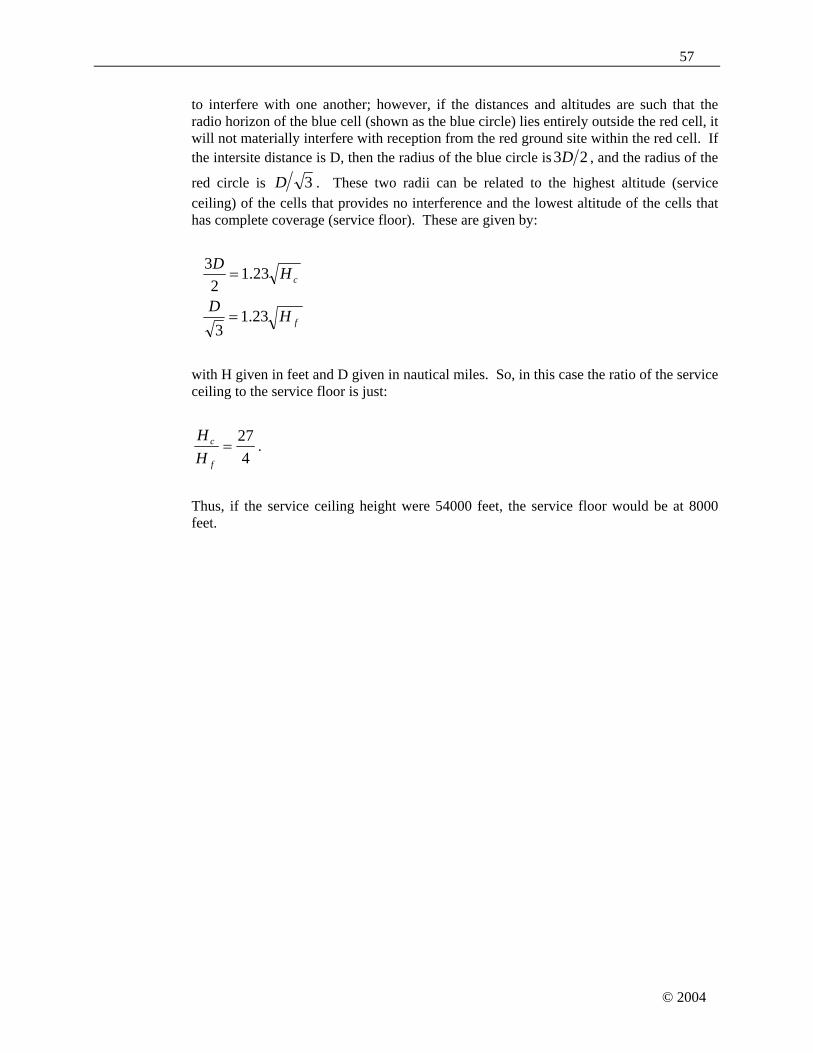
57
© 2004
to interfere with one another; however, if the distances and altitudes are such that the radio horizon of the blue cell (shown as the blue circle) lies entirely outside the red cell, it will not materially interfere with reception from the red ground site within the red cell. If the intersite distance is D, then the radius of the blue circle is 23D , and the radius of the
red circle is 3D . These two radii can be related to the highest altitude (service ceiling) of the cells that provides no interference and the lowest altitude of the cells that has complete coverage (service floor). These are given by:
f
c
HD
HD
23.13
23.12
3
=
=
with H given in feet and D given in nautical miles. So, in this case the ratio of the service ceiling to the service floor is just:
427
=f
c
HH
.
Thus, if the service ceiling height were 54000 feet, the service floor would be at 8000 feet.
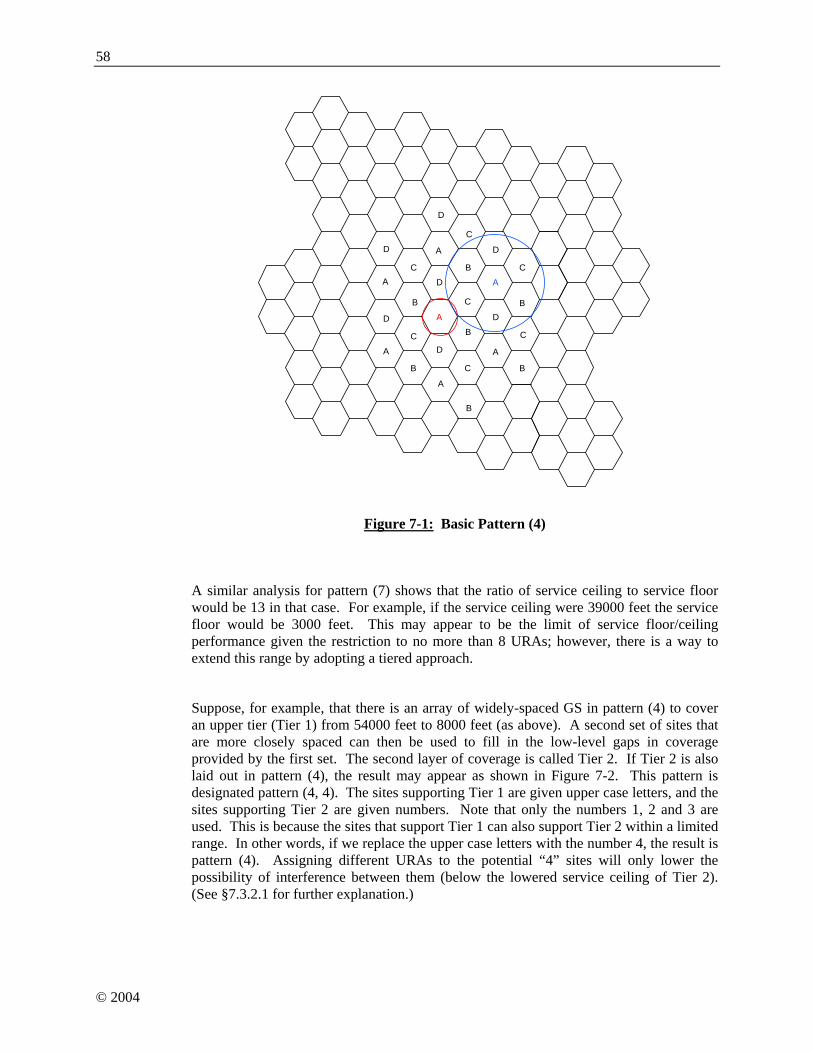
58
© 2004
A
A
A
A
A
A
B
B
B
B
B
B
C
C
C
C
C
B
D
D
D
D
D
D
D
C
C
A
Figure 7-1: Basic Pattern (4)
A similar analysis for pattern (7) shows that the ratio of service ceiling to service floor would be 13 in that case. For example, if the service ceiling were 39000 feet the service floor would be 3000 feet. This may appear to be the limit of service floor/ceiling performance given the restriction to no more than 8 URAs; however, there is a way to extend this range by adopting a tiered approach.
Suppose, for example, that there is an array of widely-spaced GS in pattern (4) to cover an upper tier (Tier 1) from 54000 feet to 8000 feet (as above). A second set of sites that are more closely spaced can then be used to fill in the low-level gaps in coverage provided by the first set. The second layer of coverage is called Tier 2. If Tier 2 is also laid out in pattern (4), the result may appear as shown in Figure 7-2. This pattern is designated pattern (4, 4). The sites supporting Tier 1 are given upper case letters, and the sites supporting Tier 2 are given numbers. Note that only the numbers 1, 2 and 3 are used. This is because the sites that support Tier 1 can also support Tier 2 within a limited range. In other words, if we replace the upper case letters with the number 4, the result is pattern (4). Assigning different URAs to the potential “4” sites will only lower the possibility of interference between them (below the lowered service ceiling of Tier 2). (See §7.3.2.1 for further explanation.)
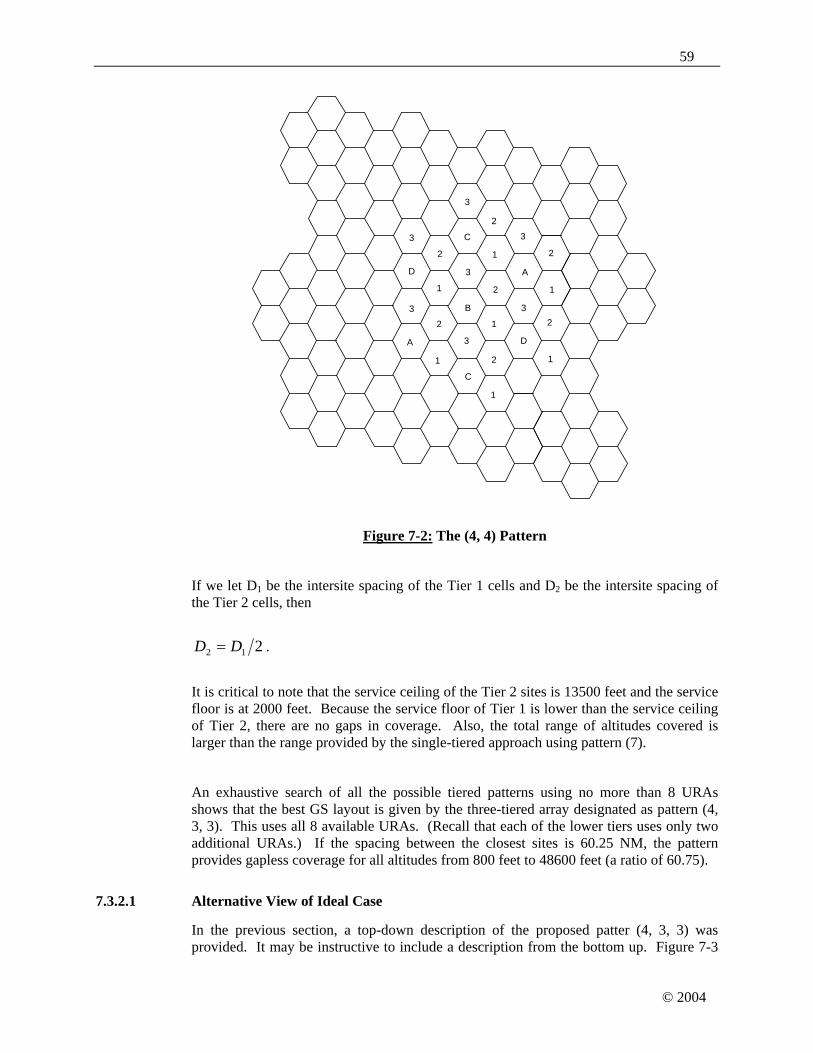
59
© 2004
A
B
AD
C
C
D
1
2
3
1
2
3
1
2
3
1
2
3
1
23
1
2
3
1
2
3
Figure 7-2: The (4, 4) Pattern
If we let D1 be the intersite spacing of the Tier 1 cells and D2 be the intersite spacing of the Tier 2 cells, then
212 DD = .
It is critical to note that the service ceiling of the Tier 2 sites is 13500 feet and the service floor is at 2000 feet. Because the service floor of Tier 1 is lower than the service ceiling of Tier 2, there are no gaps in coverage. Also, the total range of altitudes covered is larger than the range provided by the single-tiered approach using pattern (7).
An exhaustive search of all the possible tiered patterns using no more than 8 URAs shows that the best GS layout is given by the three-tiered array designated as pattern (4, 3, 3). This uses all 8 available URAs. (Recall that each of the lower tiers uses only two additional URAs.) If the spacing between the closest sites is 60.25 NM, the pattern provides gapless coverage for all altitudes from 800 feet to 48600 feet (a ratio of 60.75).
7.3.2.1 Alternative View of Ideal Case
In the previous section, a top-down description of the proposed patter (4, 3, 3) was provided. It may be instructive to include a description from the bottom up. Figure 7-3
60
© 2004
shows a standard set of pattern (3) hexagons labeled 1, 2 and 3. These will constitute the Tier 3 sites. If they are separated by 60.25 NM they will provide coverage from 800 feet to 3200 feet.
1
3
2
1
2
1 1 1
3 3 3 3
2 2 222
3
1 1 1 1 1 1
3
1
2
3
3
2
1
3
1
2
3
2
3
1
1
3
2
3
2
1
3
1
3
2
3
2
1
3
1
2
3
2
1
3
2
1
3
2
3
2
1
2
1
3
2
1
3
1
3
2
1
2
3
2
1
3
2
1
3
2
3
2
1
3
1
3
1
32
1
3
1
2
3
2
1
2
1
3
2
3
2
1
1
2
1
2
1
Figure 7-3: Tier 3 of Pattern (4, 3, 3)
For coverage above 3200’, the sites labeled 3 in Figure 7-3 are relabeled as a, b or c as shown in Figure 7-4. These Tier 2 sites are separated by 104.35 NM and provide coverage from 2400 feet to 9600 feet.
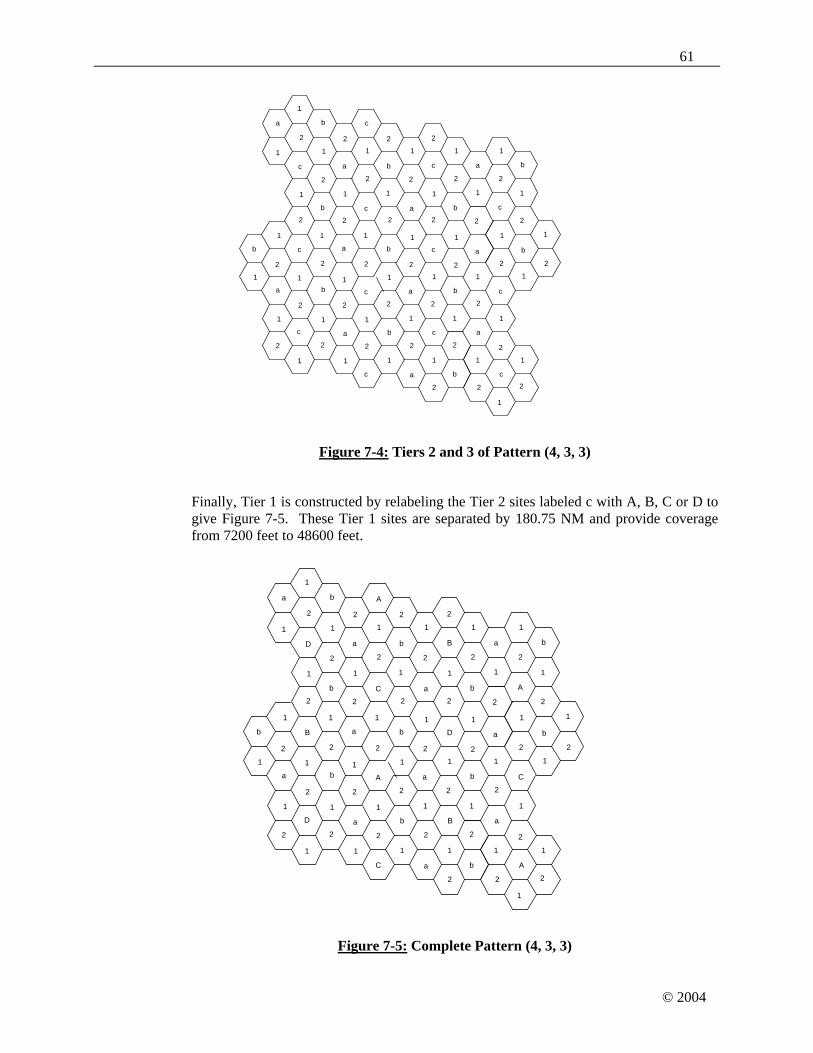
61
© 2004
1
a
2
1
2
1 1 1
b c a b
2 2 222
c
1 1 1 1 1 1
a
1
2
a
a
2
1
c
1
2
c
2
b
1
1
b
2
c
2
1
c
1
a
2
b
2
1
b
1
2
c
2
1
a
2
1
c
2
b
2
1
2
1
a
2
1
c
1
b
2
1
2
b
2
1
a
2
1c
2
b
2
1
a
1
b
1
c
2
1
c
1
2
b
2
1
2
1
c
2
a
2
1
1
2
1
2
1
Figure 7-4: Tiers 2 and 3 of Pattern (4, 3, 3)
Finally, Tier 1 is constructed by relabeling the Tier 2 sites labeled c with A, B, C or D to give Figure 7-5. These Tier 1 sites are separated by 180.75 NM and provide coverage from 7200 feet to 48600 feet.
1
a
2
1
2
1 1 1
b D a b
2 2 222
B
1 1 1 1 1 1
a
1
2
a
a
2
1
A
1
2
C
2
b
1
1
b
2
C
2
1
A
1
a
2
b
2
1
b
1
2
D
2
1
a
2
1
B
2
b
2
1
2
1
a
2
1
A
1
b
2
1
2
b
2
1
a
2
1D
2
b
2
1
a
1
b
1
C2
1
B
1
2
b
2
1
2
1
A
2
a
2
1
1
2
1
2
1
Figure 7-5: Complete Pattern (4, 3, 3)

62
© 2004
7.3.2.2 Alternative URA Assignments
Up to this point it has been assumed that the URAs assigned to the different ground sites all have the same capacity, i.e., they all consist of 4 Channels. However, it seems likely that the sites servicing the larger volumes (the higher tiers) will have more information to convey. Thus, it may be advantageous to assign the capacity unevenly. For example, for the pattern (4, 3, 3) the numbers of Channels assigned per site might be 5, 4 and 2 (going from Tier 1 to Tier 3). If that were the case, then the total number of Channels assigned would be 5x4+4x2+2x2 = 32; all the Channels would be assigned to one type of site or another.
In the original case where each URA consists of 4 Channels. The Channels assigned to each URA can always be allocated to GS so that in each second individual GS can transmit on a schedule with evenly-spaced transmissions 8 Channels apart. This will ease the up-link transmitter design by keeping the short-term duty factor low. However, for the 5-4-2 plan described in the previous paragraph, this is not possible. For this Channel usage plan the following schedule ensures that successive transmissions from any GS are no closer than 6 Channels. (Channels are numbered from 1 to 32.) Of course, the actual slots are rotated on a second-by-second basis according the rules of section §3.2.2.2 of the UAT Technical Manual.
Table 7-1: Channel Mapping to URA for the 5-4-2 Plan
URA Channel 1 1,17 2 9,25 a 3,11,19,27 b 7,15,23,31 A 5,12,18,24,30 B 2,8,14,21,28 C 4,10,16,22,29 D 6,13,20,26,32
7.3.3 Exemplary Deployment
In an actual deployment site selection for UAT will tend to be limited to ground locations that are already available to the service provider. Also, varying terrain may enhance radio line-of-sight range (LOS) if a site is at a high elevation or limit it if a site is surrounded by mountains, for example. Thus, the coverage of the ground sites will be anything but regular, and a perfect cellular layout will not be possible. Nevertheless, it seems that the method of providing a tiered approach may still be a good one. The question is how to most efficiently construct the tiers.
Important parameters that will determine the solution of the channel assignment problem are the desired service ceiling and service floor altitudes. The achievable service floor is largely determined by the intersite spacing. If the spacing between any two sites is large, the bottom of the coverage between them will be high. To achieve a low service floor will require close spacing. That, in turn, may require a large number of ground sites to cover a given geographical region. Of course, low level coverage may only be necessary

63
© 2004
in selected locations, so the number of sites could be reduced. On the other hand, the effects of terrain variation may increase the number of sites needed.
One strategy for channel assignment would be to begin with all the available sites and attempt to create Tier 1. An initial site for assignment of URA “A” could be chosen near the edge of the overall coverage area, and then a second site could be chosen such that its LOS did not impinge upon the desired coverage of the initial site and the LOS of the initial site did not impinge upon the desired coverage of the second site. To do this it is necessary to define what is meant by the “desired coverage” of a site. That depends on the ideal pattern being approximated. Suppose it is pattern (4, 3, 3). If the target Tier 3 intersite distance, D3, is taken to be 60.25 NM (from the previous paragraph), then the next reuse of URA “A” would be about 2D1 = 6D3 = 361 NM away, and the desired LOS would be somewhere between NMD 902/1 = and NMD 1043/1 = . Choose the closest site that meets the noninterference criteria. The next site to use URA “A” should be the one of the remaining sites that is closest to the first two and also obeys the noninterference criteria. In this case “closest” could mean the one for which the sum of the distances to the two nearest sites using URA “A” is the least. This process should continue until no more URA “A” sites can be assigned. This process should then be repeated using B, C and D URAs. When choosing these sites, care should be taken to pick locations that most closely approximate the desired hexagonal effect. If all goes well, this process will provide total coverage from 48600 feet down to an altitude below the service ceiling of Tier 2. Tier 2 can now be populated using a similar method. For selected locations that need particularly low altitude coverage, Tier 3 locations can also be identified using similar techniques.
7.3.3.1 An Implementation Example
The process described in the previous plan has been used on a limited basis to make URA assignments for a deployment of 30 GS in the southeastern part of the United States. Using the top-down approach it was relatively easy to define the Tier 1 sites with the proper spacing. The Tier 2 sites were more difficult to define since the available sites were not evenly distributed geographically. It was nearly impossible to assign Tier 3 sites according to the rule of the ideal model. These were assigned on a more ad hoc basis by trying to maximize the distance between any two sites using the same slot set, independent of their relation to the pattern of the top two tiers. The performance of the resulting assignment plan can be judged by observing the coverage at altitudes of 40000 feet, 10000 feet and 3000 feet shown in Figure 7-6, Figure 7-7 and Figure 7-8. The shaded portions denote areas with coverage by at least one GS. Note that at the highest altitude the coverage is determined with respect to altitude Above Mean Sea Level (AMSL), while the coverage at the lower two altitudes was Above Ground Level (AGL). In these figures terrain effects have been taken into account, which explains the sometimes irregular shapes of the individual coverage volumes.

64
© 2004
Figure 7-6: USA East Coast Coverage at 40000’ AMSL
Figure 7-7: USA East Coast Coverage at 10000’ AGL

65
© 2004
Figure 7-8: USA East Coast Coverage at 3000’ AGL
66
© 2004
8 Potential Future Services of UAT
Some potential future services for UAT-equipped aircraft are described in this section. The services identified here support position determination of UAT-equipped aircraft based on Time of Message Reception (TOMR) of UAT signals. The services are listed below:
1. Range validation of ADS-B reported position data, based on the one way propagation time of the ADS-B Message. This function can be performed by a single receiving station and relies on both the transmitter and receiver having access to precise timing information (referred to as being in the “UTC coupled” condition). This is useful mainly to attain some confidence the ADS-B transmission is from a bona fide user and is not a result of “spoofing”.
2. Localization of a mobile ADS-B transmitter from a fixed ground receiver network. This function requires reception of the ADS-B Message by at least 3 ground stations. Each ground station requires precise knowledge of time in order to provide the TOMR with each reception. The TOMR allows a central processor to localize the transmitter via the time-difference-of arrival technique. The mobile transmitter does not require knowledge of its own position nor does it require precise knowledge of time. This capability—coupled with the reported identification and barometric altitude—could provide backup air-ground surveillance in the event of widespread outage of GNSS.
3. Localization of the mobile (ownship) ADS-B receiver. This is based on reception of 3 or more ground station “beacon” transmissions within the same UTC second. Each ground station beacon transmission is based on precise knowledge of time. The ownship UAT receiver need not have precise knowledge of time, but determines position from the time-difference-of arrival technique and knowledge of the ground beacon locations encoded in the received messages. This capability could provide a crude form of backup navigation in the event of widespread outage of GNSS.

67
© 2004
Table 8-1: Summary of Potential Future Applications of UAT
Potential Future UAT
Service
UAT Transmitter Requirements
UAT Receiver Requirements
Primary Application Limitations
Range Validation
Navigation input, UTC Coupled
Navigation input, UTC Coupled
Integrity check of ADS-B
Total timing errors limit
range accuracy to ~ 0.7 NM (see 5.5.4)
Backup Air-Ground
Surveillance None UTC Coupled Surveillance
backup for GNSS
Service available only
in areas of significant
ground station infrastructure
Backup Navigation
UTC Coupled (stable source can operate without
GNSS for hours)
None Navigation backup for GNSS
Service available only
in areas of significant
ground station infrastructure
68
© 2004
Action Items Summary:
1. Assigned to Larry Bachman to update Appendix B by 15 January 2005 and provide a short memo to indicate the changes. Subgroup members to review and provide comments at UAT SWG08.
2. Assigned to all Subgroup members to bring any comments to Appendices C, E, F, G, and H to UAT SWG08, Langen Meeting.
3. Assigned to Tom Pagano to provide the updated draft of Appendix D at the Langen, Jan/Feb 2005 meeting.
4. Requested by WG-C during Mtg 7, 19-21 April 2004: Provide material on how UAT fits into the ATM environment. Assigned to George Ligler for the November 2004 meeting in Montreal, and carried over until the Langen meeting.
5. Assigned to Larry Bachman to include a table that shows separation distance as a function of DME/TACAN power.


