Implementation of the API RP 584 Integrity Operating Windows Methodology at the Gibson Island Ammonia Manufacturing Plant* A process gas leak outside of the primary reformer caused a serious fire incident at the Gibson Island Works (GIW) ammonia manufacturing plant in Brisbane, Australia. As part of their global reliability improvement strategy, Incitec Pivot Ltd. (IPL) selected GIW as a pilot for the pending API RP 584 In- tegrity Operating Windows (IOW) standard. An all-inclusive review of plant performance was conduct- ed, including a creep remnant life assessment and stress analyses of the primary reformer. This paper presents a safety overview of the GIW facility and presents a case study of how the IOW standard was implemented at the facility. The steps used to mitigate risk and improve the methods used for additional facilities are also covered. L. Bateman, D. Keen Incitec Pivot /Dyno Nobel, Brisbane Qld, Australia Q. Rowson^, B. Fletcher*, O. Kwon^, C. Thomas^, A. Saunders-Tack^, A. Karstensen# Quest Integrity Group, ^Lower Hutt, New Zealand, *Boulder, Co, USA, #Brisbane, Qld, Australia *Presented at the Nitrogen + Syngas 2014 Conference in Paris, France failure led to a significant fire outside of the primary reformer at Incitec Pivot Ltd. (IPL) Gibson Island ammonia plant (GIW) in December 2010. The impact of this incident on the plant reliability and safety management processes led to the de- cision to pilot the implementation of the API RP 584 Integrity Operating Windows standards (IOW) best practice [1]. This paper describes the implementation process for this standard for the reforming section of the plant. INTRODUCTION & BACKGROUND To properly understand the nature of the IOW implementation process, a basic understanding of the equipment involved is required. The pro- cess loop in question is the fired section of the front end steam reformer at GIW in Brisbane Australia. The front end is made up of a generic type fired pre-heater up-stream of a typical 1960’s vintage Foster Wheeler terrace-wall fired radiant section reformer, complete with a mixed feed coils and an auxiliary fired convection bank. The items of equipment and their configu- ration are shown in Figure 1 in the simplified process flow diagram excerpt. The items of equipment addressed in the IOW process in- clude the preheat furnace (EF602) and the steam reformer (R601). The reason that this loop is a focus for the IOW process is because it is the highest risk loop in the plant in addition to it having experienced the incident in December 2010. A
Transcript
Implementation of the API RP 584 Integrity Operating Windows Methodology at the Gibson Island
Ammonia Manufacturing Plant*
A process gas leak outside of the primary reformer caused a serious fire incident at the Gibson Island
Works (GIW) ammonia manufacturing plant in Brisbane, Australia. As part of their global reliability
improvement strategy, Incitec Pivot Ltd. (IPL) selected GIW as a pilot for the pending API RP 584 In-
tegrity Operating Windows (IOW) standard. An all-inclusive review of plant performance was conduct-
ed, including a creep remnant life assessment and stress analyses of the primary reformer. This paper
presents a safety overview of the GIW facility and presents a case study of how the IOW standard was
implemented at the facility. The steps used to mitigate risk and improve the methods used for additional
facilities are also covered.
L. Bateman, D. Keen
Incitec Pivot /Dyno Nobel, Brisbane Qld, Australia
Q. Rowson^, B. Fletcher*, O. Kwon^, C. Thomas^, A. Saunders-Tack^, A. Karstensen#
Quest Integrity Group, ^Lower Hutt, New Zealand, *Boulder, Co, USA, #Brisbane, Qld, Australia
*Presented at the Nitrogen + Syngas 2014 Conference in Paris, France
failure led to a significant fire outside
of the primary reformer at Incitec Pivot
Ltd. (IPL) Gibson Island ammonia
plant (GIW) in December 2010. The
impact of this incident on the plant reliability
and safety management processes led to the de-
cision to pilot the implementation of the API RP
584 Integrity Operating Windows standards
(IOW) best practice [1]. This paper describes
the implementation process for this standard for
the reforming section of the plant.
INTRODUCTION & BACKGROUND
To properly understand the nature of the IOW
implementation process, a basic understanding
of the equipment involved is required. The pro-
cess loop in question is the fired section of the
front end steam reformer at GIW in Brisbane
Australia. The front end is made up of a generic
type fired pre-heater up-stream of a typical
1960’s vintage Foster Wheeler terrace-wall fired
radiant section reformer, complete with a mixed
feed coils and an auxiliary fired convection
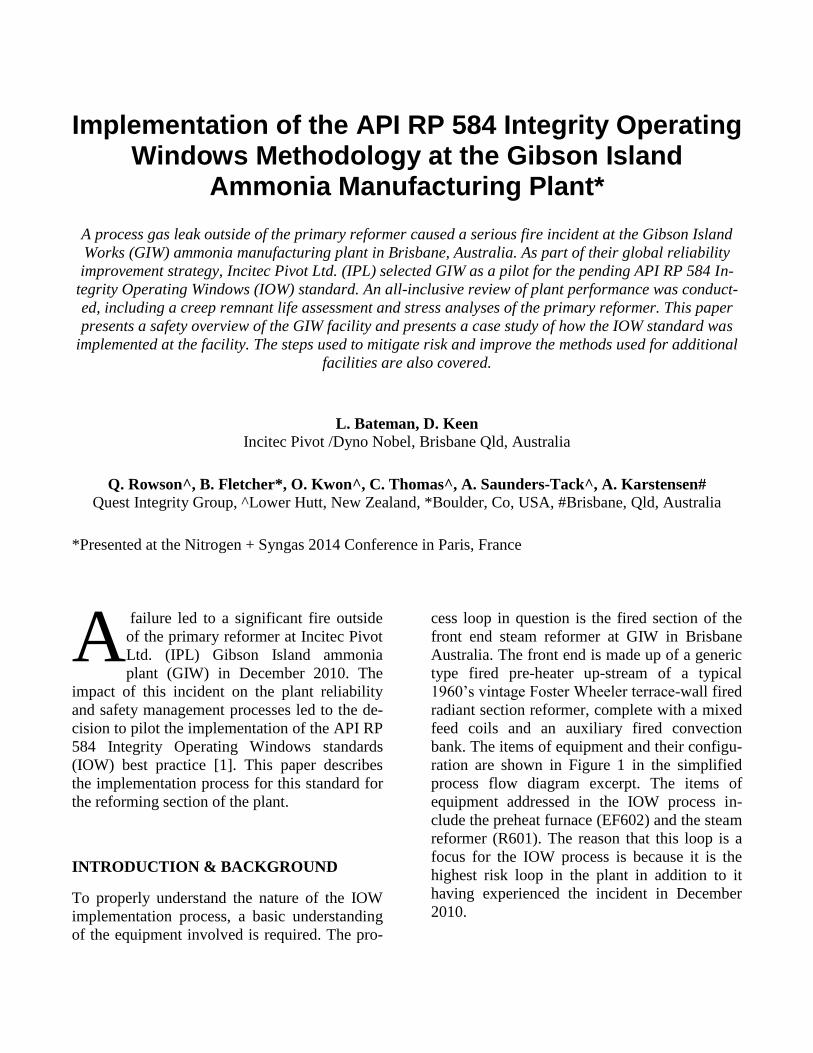
bank. The items of equipment and their configu-
ration are shown in Figure 1 in the simplified
process flow diagram excerpt. The items of
equipment addressed in the IOW process in-
clude the preheat furnace (EF602) and the steam
reformer (R601). The reason that this loop is a
focus for the IOW process is because it is the
highest risk loop in the plant in addition to it
having experienced the incident in December
2010.
A
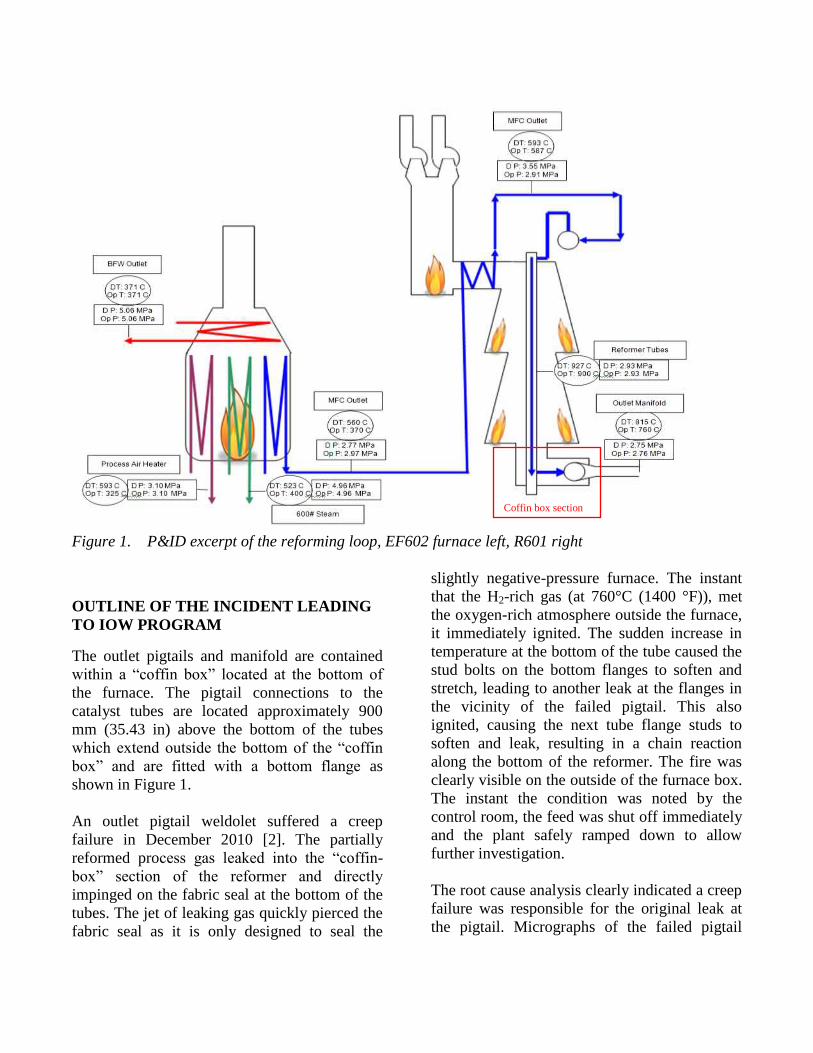
Figure 1. P&ID excerpt of the reforming loop, EF602 furnace left, R601 right
OUTLINE OF THE INCIDENT LEADING
TO IOW PROGRAM
The outlet pigtails and manifold are contained
within a “coffin box” located at the bottom of
the furnace. The pigtail connections to the
catalyst tubes are located approximately 900
mm (35.43 in) above the bottom of the tubes
which extend outside the bottom of the “coffin
box” and are fitted with a bottom flange as
shown in Figure 1.
An outlet pigtail weldolet suffered a creep
failure in December 2010 [2]. The partially
reformed process gas leaked into the “coffin-
box” section of the reformer and directly
impinged on the fabric seal at the bottom of the
tubes. The jet of leaking gas quickly pierced the
fabric seal as it is only designed to seal the
slightly negative-pressure furnace. The instant
that the H2-rich gas (at 760°C (1400 °F)), met
the oxygen-rich atmosphere outside the furnace,
it immediately ignited. The sudden increase in
temperature at the bottom of the tube caused the
stud bolts on the bottom flanges to soften and
stretch, leading to another leak at the flanges in
the vicinity of the failed pigtail. This also
ignited, causing the next tube flange studs to
soften and leak, resulting in a chain reaction
along the bottom of the reformer. The fire was
clearly visible on the outside of the furnace box.
The instant the condition was noted by the
control room, the feed was shut off immediately
and the plant safely ramped down to allow
further investigation.
The root cause analysis clearly indicated a creep
failure was responsible for the original leak at
the pigtail. Micrographs of the failed pigtail
Coffin box section
showed that the material of a single pigtail
contained extensive creep voids, while nearby
pigtails were in good condition. The root cause
of the incident was extended operation at high
temperatures meaning operation had been above
a safe “Operating Window”. The pigtails were
installed in 2007, had under gone 10 thermal
cycles in that time and had a design pressure
and temperature of 2.75MPa (0.4 ksi) and 815˚C
(1500 °F) respectively. This conclusion led to
the development of an IOW programme
involving analysis of all the components and
pipework within the front end of the ammonia
plant.
EXPLANATION OF THE IOW
PROGRAMME
IOW Definition:
The definition, monitoring and control of key
process as well as operational parameters,
commonly referred to as the plant Integrity
Operating Window (IOW). This is an essential
step in ensuring optimal reliability, availability
and profitability of critical plant equipment.
Purpose:
To provide sustained operational reliability and
understanding of the relationship between
campaign life, production rates, and
opportunities for improvement.
Deliverables:
A clear understanding of likely failure modes,
remaining life and integrity of components
under controllable process variables (e.g.
temperature, pressure, flow, etc.) and
operational guidelines outlining the upper and
lower bounds of these limitations.
The end goal of the IOW process is illustrated in
Figure 2 below.
Figure 2. Integrity Operating Window limits
IOW PROCESS AS EXECUTED BY
IPL/QUEST INTEGRITY
The IOW process consists of series of steps used
to limit operational variables that govern the
most likely failure mechanism for a given item
of equipment.
The actual process begins similarly to the Risk
Based Inspection (RBI) program [3] as outlined
in Figure 3. A team of experts assesses the risk
of failure with respect to a given mode and
mechanism of failure. RBI then branches off to
create Inspection Test Plans (ITPs) and
inspection schedules to reduce these risks.
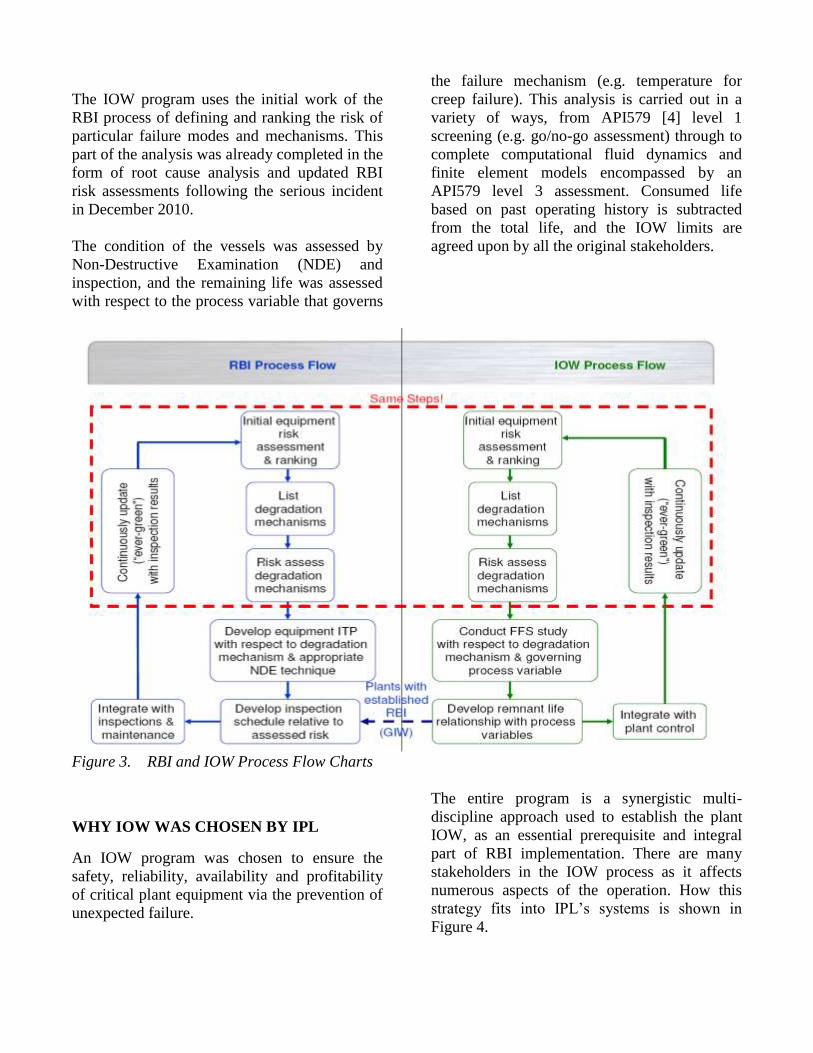
The IOW program uses the initial work of the
RBI process of defining and ranking the risk of
particular failure modes and mechanisms. This
part of the analysis was already completed in the
form of root cause analysis and updated RBI
risk assessments following the serious incident
in December 2010.
The condition of the vessels was assessed by
Non-Destructive Examination (NDE) and
inspection, and the remaining life was assessed
with respect to the process variable that governs
the failure mechanism (e.g. temperature for
creep failure). This analysis is carried out in a
variety of ways, from API579 [4] level 1
screening (e.g. go/no-go assessment) through to
complete computational fluid dynamics and
finite element models encompassed by an
API579 level 3 assessment. Consumed life
based on past operating history is subtracted
from the total life, and the IOW limits are
agreed upon by all the original stakeholders.
Figure 3. RBI and IOW Process Flow Charts
WHY IOW WAS CHOSEN BY IPL
An IOW program was chosen to ensure the
safety, reliability, availability and profitability
of critical plant equipment via the prevention of
unexpected failure.
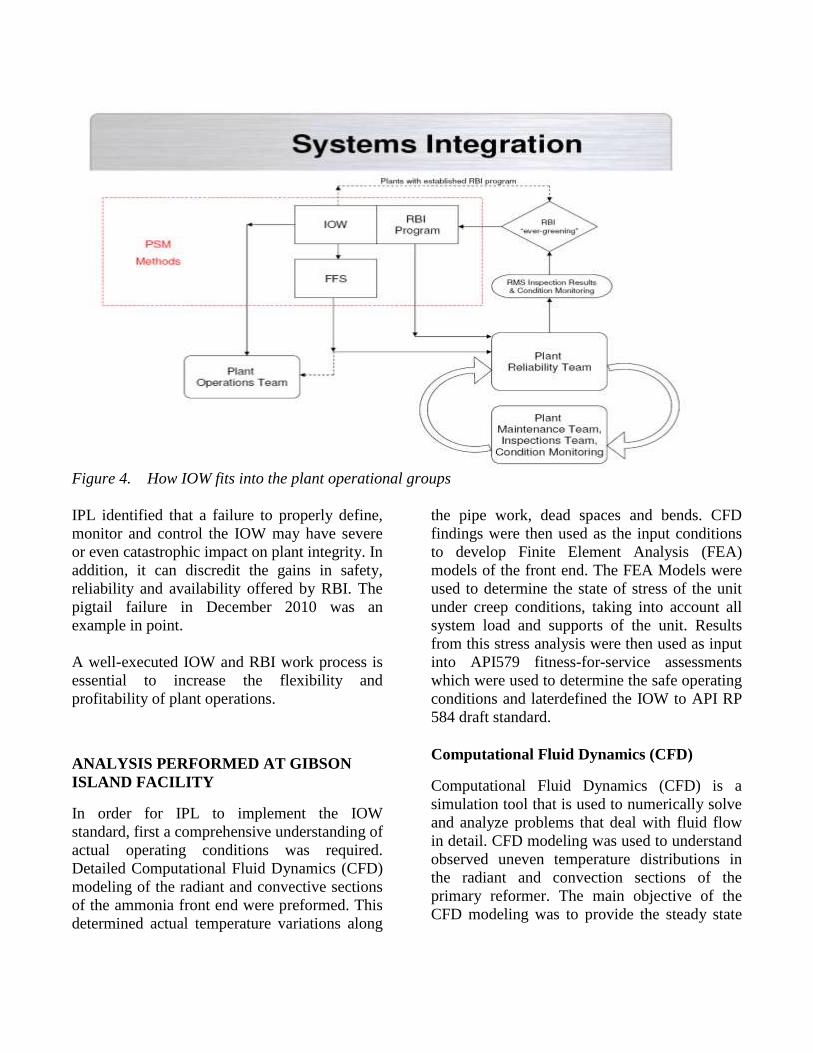
The entire program is a synergistic multi-
discipline approach used to establish the plant
IOW, as an essential prerequisite and integral
part of RBI implementation. There are many
stakeholders in the IOW process as it affects
numerous aspects of the operation. How this
strategy fits into IPL’s systems is shown in
Figure 4.
Figure 4. How IOW fits into the plant operational groups
IPL identified that a failure to properly define,
monitor and control the IOW may have severe
or even catastrophic impact on plant integrity. In
addition, it can discredit the gains in safety,
reliability and availability offered by RBI. The
pigtail failure in December 2010 was an
example in point.
A well-executed IOW and RBI work process is
essential to increase the flexibility and
profitability of plant operations.
ANALYSIS PERFORMED AT GIBSON
ISLAND FACILITY
In order for IPL to implement the IOW
standard, first a comprehensive understanding of
actual operating conditions was required.
Detailed Computational Fluid Dynamics (CFD)
modeling of the radiant and convective sections
of the ammonia front end were preformed. This
determined actual temperature variations along
the pipe work, dead spaces and bends. CFD
findings were then used as the input conditions
to develop Finite Element Analysis (FEA)
models of the front end. The FEA Models were
used to determine the state of stress of the unit
under creep conditions, taking into account all
system load and supports of the unit. Results
from this stress analysis were then used as input
into API579 fitness-for-service assessments
which were used to determine the safe operating
conditions and laterdefined the IOW to API RP
584 draft standard.
Computational Fluid Dynamics (CFD)
Computational Fluid Dynamics (CFD) is a
simulation tool that is used to numerically solve
and analyze problems that deal with fluid flow
in detail. CFD modeling was used to understand
observed uneven temperature distributions in
the radiant and convection sections of the
primary reformer. The main objective of the
CFD modeling was to provide the steady state
flow field distribution inside the steam reformer
while operating under typical firing conditions.
In this study, three-dimensional steady state
CFD models were developed to determine the
flow field solution distribution (pressure,
temperature, velocity, etc.) throughout the
primary reformer. The CFD modeling included
the combustion of hydrocarbons as well as
radiation heat transfer in an effort to accurately
predict the flue gas distribution in the
convection and radiant sections of the reformer.
The overall geometry of the CFD model is
presented in Figure 5.
Figure 5. Isometric view of the CFD model.
The CFD analysis predicted flue gas
distributions containing large vortex structures
spinning at low velocities in the radiant section
of the unit [5]. Low flue gas velocities were
expected since the heat transfer mechanism is
predominately governed by radiation rather than
forced convection in this region. The modeling
predicted cooler flue gas temperatures for the
catalyst tubes adjacent to the end walls in the
radiant section; these lower temperatures were
also observed by IPL through the use of infrared
imagery. Figures 6 and 7 shows significantly
lower flue gas temperatures predicted at the end
walls at the lower portion of the radiant section.
The CFD modeling indicated the flow
emanating from the lower radiant burners
closest to the end walls were slowed down and
pushed away from the wall by standing vortices
located at the bottom of the radiant section.
These vortices were caused by the flow being
slowed down due to the presence of the catalyst
tubes.
Figure 6. Flue gas temperature distribution in
the radiant section.
Figure 7. Flue gas temperature distribution in
the radiant section.
Similar insights for other flow distribution
issues within the unit as well as burner
performance observations were obtained from
the CFD modeling. The use of the CFD analysis
has provided IPL with understanding on how
the reformer tube and burner layout and
configuration affected the temperature
distribution within the unit. This model can be
used to make future operational decisions
increasing the safe and economic operation of
the unit, such as investigating the remaining life
for a given flow-embedded component using
CFD-predicted heat loads when updating the
design or operating conditions. The added value
of having an existing CFD model of the unit is
that it can be readily used to understand the
implication on the flue gas heat distribution for
possible design modifications during upcoming
shutdowns as well as modifications to the unit’s
operating conditions (such as: increasing the
burner firing rates, upgrading the fan at the
stack, etc.).
Finite Element Analysis (FEA)
The temperature information obtained from the
CFD analysis was used as input in the Finite
Element Analysis (FEA) to determine the
critically stressed areas, which will be the life
limiting locations. FEA can determine the state
of stress in components, due to external and
internal loads and is invaluable when the
problem to be solved is statically indeterminate.
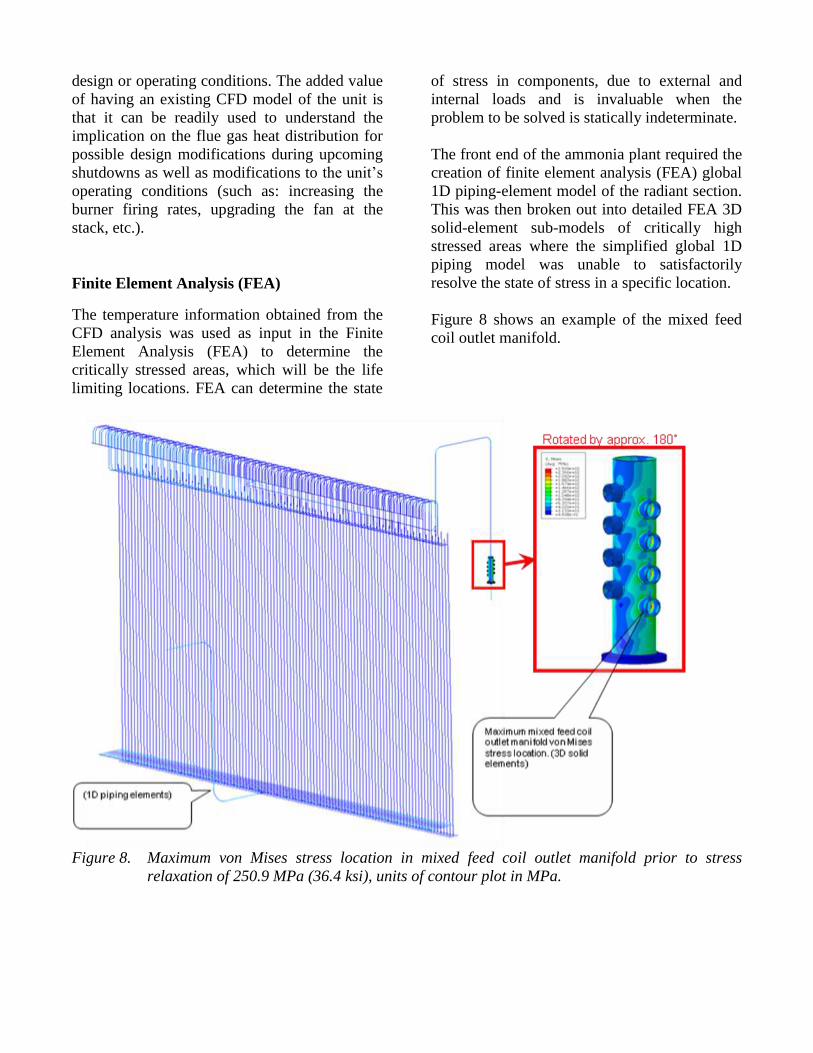
The front end of the ammonia plant required the
creation of finite element analysis (FEA) global
1D piping-element model of the radiant section.
This was then broken out into detailed FEA 3D
solid-element sub-models of critically high
stressed areas where the simplified global 1D
piping model was unable to satisfactorily
resolve the state of stress in a specific location.
Figure 8 shows an example of the mixed feed
coil outlet manifold.
Figure 8. Maximum von Mises stress location in mixed feed coil outlet manifold prior to stress
relaxation of 250.9 MPa (36.4 ksi), units of contour plot in MPa.
Fitness-For-Service (FFS) Assessments
The stress determined from the FEA was used
as input to FFS assessments which were
undertaken to the requirements of
API579/ASME FFS-1. Due to the high metal
temperatures that the radiant section and
associated pipework operates under, creep was
the predominant failure mechanism of concern.
For the example of the mixed feed coil outlet
manifold [6], the high level of stress (250.9 MPa
(36.4 ksi) von Mises stress) was mainly caused
by the system loading and throughout one year
of operation, the initial maximum stress, 250
MPa (36.3 ksi) was predicted to relax to 41 MPa
(5.9 ksi) due to creep. It is worth noting that the
stress had already relaxed below 50 MPa (7.3
ksi) after 3000 hours. The evolution of the stress
at the peak stress location from start-up has been
shown over an uninterrupted 40,000 hour time
period of operation in Figure 9 and the
evolutionary changes in the stress was used in
the remnant life calculations.
Figure 9. Maximum von Mises stress location
in mixed feed coil outlet manifold
during stress relaxation during
operation.
This component has operated for 231,108 hours
and has undergone 46 thermal cycles. Installed
in 1982, its first 18 years of life were at an
operating and design temperature of 560˚C
(1040 °F). Operating conditions changed in the
year 2000. Based on thermocouple
measurements its remaining 11 years in service
have been at an average operating temperature
of 573.6˚C (1064.5 °F) a temperature well
above the original design
temperature. These thermocouples are located in
the mixed feed coil outlet manifold and inlet
header. It was assumed that the average
operating hours between each thermal cycle as
represented by a start-up and shut-down
sequence of 5522 hours (7.5 months), with 29
thermal cycles occurring prior to the year 2000
and 17 thermal cycles occurring post the year
2000. This has been
summarized in Table 1.
Operation Temperature
(°C)
Pressure
(MPa)
Number of
Start
(thermal
cycles)
occurred
Duration
of
operating
hours
between
starts,
hours
pre 2000
(18 yrs.)
560
(1040 °F)
2.93
(0.4 ksi) 29 5522
post 2000
(11 yrs.)
573.6
(1064.5 °F)
2.93
(0.4 ksi) 17 5522
Table 1. Assumed historic use for start
frequency (thermal cycles) and time
between starts.
Analysis assuming mean creep properties
Using mean Omega creep parameters from
API579 under the historic conditions specified
in Table 1, the critical location in the mixed feed
outlet manifold was assessed to have already
reached 85% of its life. With the 15% life
remaining, various scenarios of pressure and
temperature were considered. This has been
summarized in Table 2. The future on-line time
for the unit was assumed high, close to 8760
hours of operation are obtained each year. This
means that even if the operating temperature
and pressures were reduced to design
conditions, the mixed feed coil would have a
remaining life of approximately 6 more years
(52,540/8760) before failure is predicted.
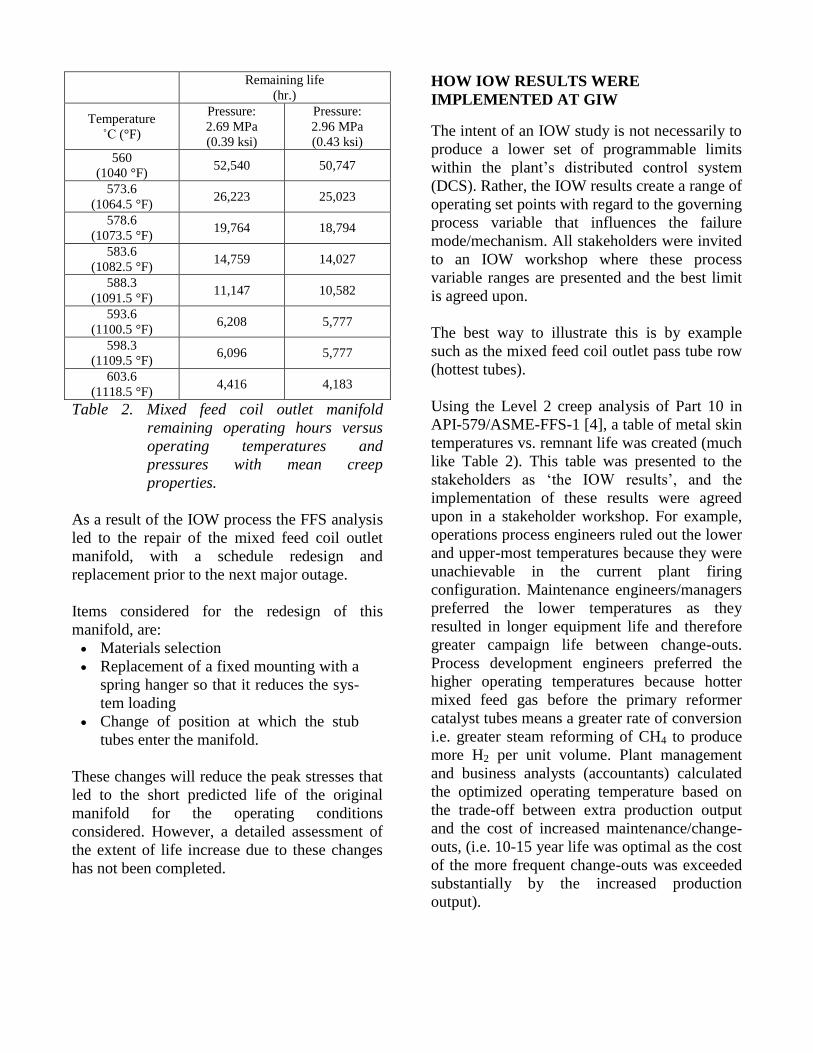
Remaining life
(hr.)
Temperature
˚C (°F)
Pressure:
2.69 MPa
(0.39 ksi)
Pressure:
2.96 MPa
(0.43 ksi)
560
(1040 °F) 52,540 50,747
573.6
(1064.5 °F) 26,223 25,023
578.6
(1073.5 °F) 19,764 18,794
583.6
(1082.5 °F) 14,759 14,027
588.3
(1091.5 °F) 11,147 10,582
593.6
(1100.5 °F) 6,208 5,777
598.3
(1109.5 °F) 6,096 5,777
603.6
(1118.5 °F) 4,416 4,183
Table 2. Mixed feed coil outlet manifold
remaining operating hours versus
operating temperatures and
pressures with mean creep
properties.
As a result of the IOW process the FFS analysis
led to the repair of the mixed feed coil outlet
manifold, with a schedule redesign and
replacement prior to the next major outage.
Items considered for the redesign of this
manifold, are:
Materials selection
Replacement of a fixed mounting with a
spring hanger so that it reduces the sys-
tem loading
Change of position at which the stub
tubes enter the manifold.
These changes will reduce the peak stresses that
led to the short predicted life of the original
manifold for the operating conditions
considered. However, a detailed assessment of
the extent of life increase due to these changes
has not been completed.
HOW IOW RESULTS WERE
IMPLEMENTED AT GIW
The intent of an IOW study is not necessarily to
produce a lower set of programmable limits
within the plant’s distributed control system
(DCS). Rather, the IOW results create a range of
operating set points with regard to the governing
process variable that influences the failure
mode/mechanism. All stakeholders were invited
to an IOW workshop where these process
variable ranges are presented and the best limit
is agreed upon.
The best way to illustrate this is by example
such as the mixed feed coil outlet pass tube row
(hottest tubes).
Using the Level 2 creep analysis of Part 10 in
API-579/ASME-FFS-1 [4], a table of metal skin
temperatures vs. remnant life was created (much
like Table 2). This table was presented to the
stakeholders as ‘the IOW results’, and the
implementation of these results were agreed
upon in a stakeholder workshop. For example,
operations process engineers ruled out the lower
and upper-most temperatures because they were
unachievable in the current plant firing
configuration. Maintenance engineers/managers
preferred the lower temperatures as they
resulted in longer equipment life and therefore
greater campaign life between change-outs.
Process development engineers preferred the
higher operating temperatures because hotter
mixed feed gas before the primary reformer
catalyst tubes means a greater rate of conversion
i.e. greater steam reforming of CH4 to produce
more H2 per unit volume. Plant management
and business analysts (accountants) calculated
the optimized operating temperature based on
the trade-off between extra production output
and the cost of increased maintenance/change-
outs, (i.e. 10-15 year life was optimal as the cost
of the more frequent change-outs was exceeded
substantially by the increased production
output).
In this instance the IOW limit as implemented
was actually a higher temperature than current
operating temperatures because the
understanding of the condition and equipment
life expectancy was enhanced and well
documented after completion of the IOW.
The other type of IOW result is capital works
required for sustained operation. The study
found on two occasions that the serviceable
lifespan of the equipment in question had either
expired or was close to failure. The intended
course of action is then further inspection,
modification or replacement. This is illustrated
by way of the three following examples:
1) Further Inspection: The inlet header tee IOW
result indicated that the stress at a particular
location would have resulted in a consumption
of creep life in order of 30% had the metal
exhibited minimum creep properties. If this was
the case the microstructure would have
contained some creep voids/fissuring on the
grain boundaries and the item would require
immediate replacement. Replication was carried
out on the area of high stress plus three other
locations for comparison and all showed
acceptable microstructure with no voids or
fissuring on the grain boundaries. Shear wave
UT was also conducted to ensure there were no
crack-like flaws. Hardness testing was
completed to restore confidence in the
material’s strength. The item was added to the
change-out list for the 2015 turn-around, with
the new design possibly using a better material
metallurgy. No further action was required,
other than limiting the operating temperature at
a nearby temperature indicator.
2) Modification: The mixed feed coil outlet
manifold was found to have an extremely high
stress relaxation magnitude that may have
exceeded yield in the one location of highest
combined stress as illustrated in Figure 8. This
area was un-inspectable due to its location on
the intrados of the branch connection. The risk
was unacceptable to the stakeholders, so a
modification plan was initiated. An FEA was
done to assess the feasibility of jacketing the
header with thick rolled plate to reduce stress by
increasing cross-sectional area; and to provide a
secondary containment in the event of a
creep/fatigue failure at the original location. The
management of change procedure was initiated
and the modification was completed. The item
was added to the change-out list for the 2015
turn-around, with the new design possibly using
a better material metallurgy
3) Replacement: The outlet header was installed
new in 2011; however the old spring support
system was reused. The IOW results indicated
that the support was inadequate at the ends and
the manifold ‘drooped’ somewhat in service.
This consequently put excess bending strain on
the end pigtails as well as the outlet manifold to
Bull Tee welds, reducing the pigtail’s
serviceable lives. The upgrade of the support
system and modification was added to the
capital list for the 2015 turn-around, with the
new design intent to take load off the pigtails
and re-establish their lives.
The IOW study revealed some points of
weakness under the current operating
conditions. When these weaknesses are
addressed and the plant is run at higher rates, the
IOW results should also show the next level of
weakness. The IOW study is therefore a useful
tool for operations and development groups who
will be making up-rate improvements overtime.
As a result operations and development groups
should fully understand the effect their changes
will have on the upstream and downstream
items of equipment.
BENEFITS OF THE IOW PROGRAM
The root cause analysis for the fire incident
highlighted a number of systemic issues relating
to the management of pressure equipment that
required attention. Although RBI and Reliability
Centered Maintenance (RCM) practices were in
place and implemented, there was opportunity
for improvement on the integration and
implementation of individual integrity
management practices within the plant
environment. In particular, processes which
drove a holistic approach to integrity
management integrating the respective plant
disciplines around operations, process
technology, maintenance and inspection were
largely missing within the procedural
framework.
Draft best practice API RP 584 IOW was
reviewed and found to provide a key procedural
driver for improving plant processes in this
respect.
Implementation of the API RP 584 IOW meant
an improved appreciation of the consequences
of operating the plant in a particular fashion. It