IMPLEMENTING BUSINESS-TO-BUSINESS ONLINE REVERSE AUCTIONS BY LOAY SEHWAIL Bachelor of Science University of Jordan Amman, Jordan 1999 Master of Science Oklahoma State University Stillwater, Oklahoma 2001 Submitted to the Faculty of the Graduate College of the Oklahoma State University in partial fulfillment of the requirements for the degree of DOCTOR OF PHILOSOPHY July, 2006
Transcript
IMPLEMENTING BUSINESS-TO-BUSINESS
ONLINE REVERSE AUCTIONS
BY
LOAY SEHWAIL
Bachelor of Science
University of Jordan
Amman, Jordan
1999
Master of Science
Oklahoma State University
Stillwater, Oklahoma
2001
Submitted to the Faculty of the Graduate College of the
Oklahoma State Universityin partial fulfillment of
the requirements forthe degree of
DOCTOR OF PHILOSOPHYJuly, 2006
ii
COPYRIGHT
BY
LOAY SEHWAIL
JULY, 2006
iii
IMPLEMENTING BUSINESS-TO-BUSINESS
ONLINE REVERSE AUCTIONS
Dissertation Approved:
Dissertation Advisor
Dean of the Graduate College
Dr. Ricki G. Ingalls
Dr. David B. Pratt
Dr. Camille DeYong
Dr. William D. Warde
Dr. Dan Tilley
Dr. A. Gordon Emslie
iv
ACKNOWLEDGEMENTS
With deep gratitude, I extend my sincere appreciation to the members of my
dissertation committee: Drs. Ricki G. Ingalls, Camille DeYong, David Pratt, William D.
Warde, and Dan Tilley, who provided me with knowledge and encouragement to help
make my dream become a reality. I really thank my committee for all the meetings,
endless intelligent conversations, and debates. You have taught me the meaning of
research.
I am particularly grateful to my chair, Dr. Ricki G. Ingalls, who has affected my
life in many positive ways, for his friendship, guidance, and support from the first day we
met. I would not have been writing this acknowledgement without his mentoring,
support, and friendship. Thank you Dr. Ingalls.
Special thanks must go to the Institute of Supply Management (ISM) for its
support in providing the contact information for the survey sample. Additionally, I would
like to recognize Dr. Rick Boyle for his help, cooperation, and fast response to any
inquiry or question.
During this journey of research, there are many people who, like lamp posts,
stood beside the road at different angles, appeared at different moments, and guided me
all the way to where I am now. Without their guidance and encouragement, I would not
have been able to make this journey. Thanks to all of you.
v
Without the support of my family, none of this would have been possible. I
dedicate this dissertation to my role model in life, my father, Munir, who taught me
integrity, honesty, and the importance of higher education, and to my mother, Sabiha,
whose spiritual support has been encouraging me since the day I was born. I also dedicate
this dissertation to my sister, Lama, and my brothers, Feras and Tareq, for their
unconditional love and support. My family contribution to my success cannot be
quantified or described.
Finally, I gratefully acknowledge my wife, Yen-Ping Leow-Sehwail, who
provided ongoing support and encouragement. To my wife Yen-Ping: without your
support, in every possible form, I would not have been able to do this. Please know that I
am truly grateful to you, and that this achievement would have been a lot more difficult
without you. I love you.
vi
TABLE OF CONTENTS
CHAPTER 1: INTRODUCTION 1
1.1 Overview 1
1.2 Problem Statement 3
1.3 Research Purpose 7
1.4 Contribution of the Research 8
1.5 Outline of Dissertation 10
CHAPTER 2: LITERATURE REVIEW 12
2.1 Introduction 12
2.2 The Impact of Electronic Commerce on Supply Chain Management 14
Develops a model for the appropriateness of acquiring products or services through online reverse auctions based on a supply positioning matrix (risk versus total relative cost).
Conceptual
Emiliani (2000b)
Describes the process for conducting online reverse auctions for direct material and related management issues (e.g. the task a buyer has to perform, the skill set required of a buyer).
Based on the author’s prior experience in the aerospace industry
Hong and Hartley (2001)
Present a model exploring satisfaction with online reverse auctions. The buyer’s competitive priorities (cost, quality, delivery, etc.), the nature of the purchase (standard versus custom, spend level, market structure) and organizational readiness (top management support, degree of centralization, etc.) are expected to impact the buyer’s satisfaction.
Conceptual prescriptive
Emiliani and Stec (2001)
Touch upon the types of terms and conditions of contracts resulting from online reverse auctions but primarily discuss the desired terms and conditions under lean vs. batch-and-queue production practices. As 70-90% of costs are determined during design, reverse auctions are advisable for “commercially available items”.
Based on several online reverse auctions conducted by companies from the durable goods industry
Lee and Corbitt (2001)
Present benefits of online reverse auctions conducted for indirect materials for the buying firm and the supplier throughout seven stages of the procurement process (“Reverse Auction Stakeholder-Benefit Grid”). The authors assert that, in general, online reverse auctions can benefit both, the buyer and the supplier.
Preliminary interviews withbuyers, from a financial institution, and suppliers who participated in a “series” of online reverse auctions.
Emiliani and Stec (2002 a)
Elaborate on potential savings and losses as results of online reverse auctions (e.g. net gross savings, switching costs, direct losses, indirect losses). Examine the use of online reverse auctions for custom-designed machine parts. Online reverse auctions support “quick hits” and local optimization of financial dimensions. Because ofdirect and indirect losses, collaborative cost reduction methods are more effective in reducing costs significantly in the long-term.
Prescriptive
42
Table 3-1 (continued)
Authors Contribution/FindingsComments on Methods
Emiliani and Stec (2002 b)
Examine the consistency of online reverse auctions with the “Caux Round Table Principles for Business”, i.e. values against which business behavior can be measured. Conclude that online reverse auctions, if used by buyers to source buyer-designed industrial components, can never comply with these principles.
Based on the involvement in “nearly a dozen” reverse auctions at a company from the durable goods industry.
Sashi and O’Leary (2002)
Describe auction types and potential benefits and drawbacks. Provide limited recommendations concerning factors to make online reverse auctions feasible. Focus on the use and roles of intermediaries in online reverse auctions, and the impact on channel relationships.
Prescriptive
Jap and Mohr (2002)
Develop and interpret a matrix which recommends how exchange types (relational versus transactional) are related to web-efficiencies (improvement of information sharing, increase of reach, dynamic pricing). Conclude that online reverse auctions can harm relational exchanges because today many auction formats focus solely on price issues.
Literature based and conceptual
Griffiths (2003)
Examines the ability to adversely affect relationships between suppliers and buyers. Buyers have to consider relationships with their own companies, existing suppliers and new suppliers, building trust and being aware of competing objectives. The author considershow an auction changes the dynamics of these relationships, outline the positives for using online reverse auctions but highlights some possible abuses of the system.
Prescriptive
Case Studies/interviews
Smeltzer and Ruzicka (2000)
Describe the integration of online reverse auctions as a tool in the sourcing process for direct material. Conclude that online reverse auctions should not be used in isolation; instead, it must be thoroughly integrated.
Single case study (company from the aerospace industry)
Mabert and Schoenherr (2001)
Describe the move of the firm from face-to-face negotiation to becoming an active online reverse auction user. Authors provide discussion of outside third-party versus in-house solutions.
Single case study (supplier to the construction industry)
43
Table 3-1 (continued)
Authors Contribution/FindingsComments on Methods
Meier et al. (2002)
Describe the change in the firm’s communication practices while moving into online reverse auctions. The firm achieved annual savings related to the volume auctioned of 34% ($2.4M).
Single case study (company from the automotive industry)
Mabert and Skeels (2002)
Describe the tasks required to conduct online reverse auctions, present the third-party help available and possible tasks and fee structures of third-party auction services. Both firms used FreeMarkets for technical support and as a “market maker”.
Two case studies (Fortune 100 industrial company and USA Navy)
Smeltzer and Carr (2002)
Discuss advantages and disadvantages of using online reverse auctions and conditions which have to be present in order to maximize the potential on online reverse auctions.
41 interviews with managers who previously participated in online reverse auction events.
Smeltzer and Carr (2003)
Besides the suppliers’ and buyers’ reasons for using online reverse auctions and conditions for success, the authors describe potential risks for both parties. Buyers were most afraid of destroying the relationship and the suppliers’ trust.
Using the Kraljic portfolio as a foundation, the researchers conclude that online reverse auctions are more suitable for strategic products than for leverage products, non-critical items and bottleneck products. Important success factors are a high number of suppliers, excess supply and changing market prices.
3 online reverse auction events
Smart and Harrison (2003)
Examine the impact of reverse auctions on buyer-supplier relationships through six case studies, analyzing primarily the supplier perspective through participant interviews. The authors identify potential benefits for both parties in a reverse auction, through tendering and transactional cost advantages.
Six case studies (5 buyers and 22 suppliers)
44
Table 3-1 (continued)
Authors Contribution/FindingsComments on Methods
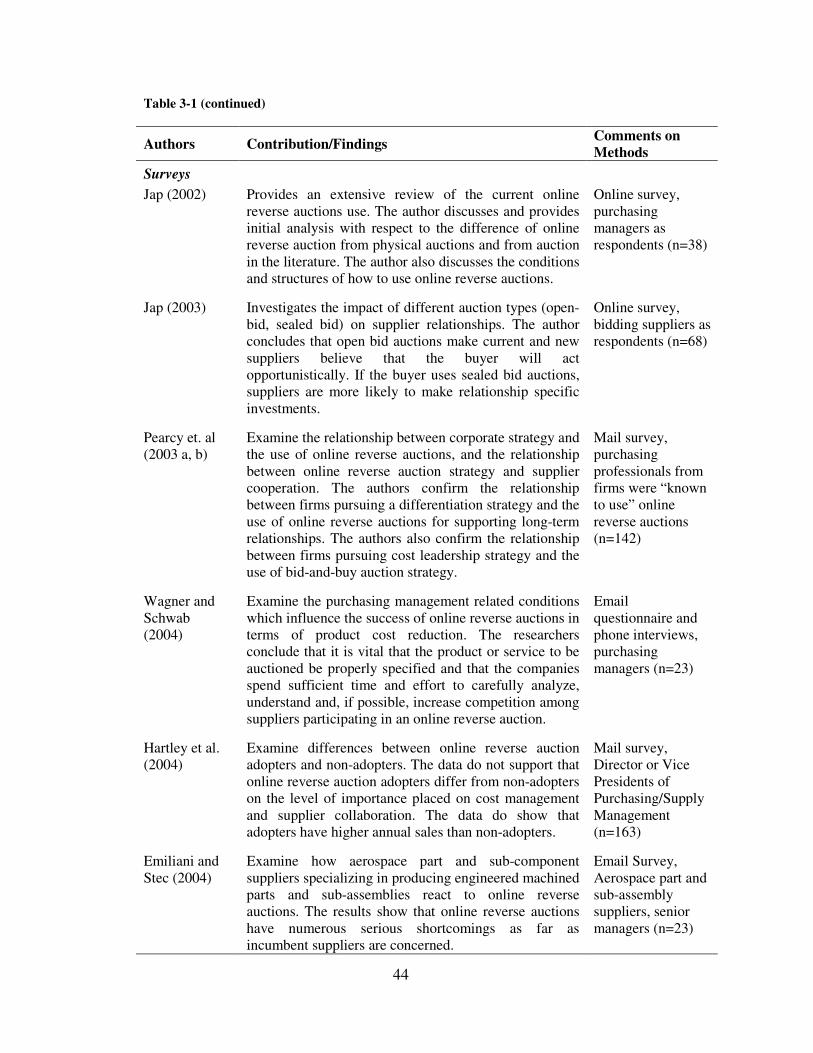
SurveysJap (2002) Provides an extensive review of the current online
reverse auctions use. The author discusses and provides initial analysis with respect to the difference of online reverse auction from physical auctions and from auction in the literature. The author also discusses the conditions and structures of how to use online reverse auctions.
Online survey, purchasing managers as respondents (n=38)
Jap (2003) Investigates the impact of different auction types (open-bid, sealed bid) on supplier relationships. The author concludes that open bid auctions make current and new suppliers believe that the buyer will act opportunistically. If the buyer uses sealed bid auctions, suppliers are more likely to make relationship specific investments.
Online survey, bidding suppliers as respondents (n=68)
Pearcy et. al(2003 a, b)
Examine the relationship between corporate strategy and the use of online reverse auctions, and the relationship between online reverse auction strategy and supplier cooperation. The authors confirm the relationship between firms pursuing a differentiation strategy and the use of online reverse auctions for supporting long-term relationships. The authors also confirm the relationship between firms pursuing cost leadership strategy and the use of bid-and-buy auction strategy.
Mail survey, purchasing professionals from firms were “known to use” online reverse auctions (n=142)
Wagner and Schwab (2004)
Examine the purchasing management related conditions which influence the success of online reverse auctions in terms of product cost reduction. The researchers conclude that it is vital that the product or service to be auctioned be properly specified and that the companies spend sufficient time and effort to carefully analyze, understand and, if possible, increase competition among suppliers participating in an online reverse auction.
Email questionnaire and phone interviews, purchasing managers (n=23)
Hartley et al. (2004)
Examine differences between online reverse auction adopters and non-adopters. The data do not support that online reverse auction adopters differ from non-adopters on the level of importance placed on cost management and supplier collaboration. The data do show that adopters have higher annual sales than non-adopters.
Mail survey, Director or Vice Presidents of Purchasing/Supply Management (n=163)
Emiliani and Stec (2004)
Examine how aerospace part and sub-component suppliers specializing in producing engineered machined parts and sub-assemblies react to online reverse auctions. The results show that online reverse auctions have numerous serious shortcomings as far as incumbent suppliers are concerned.
Email Survey, Aerospace part and sub-assembly suppliers, senior managers (n=23)
45
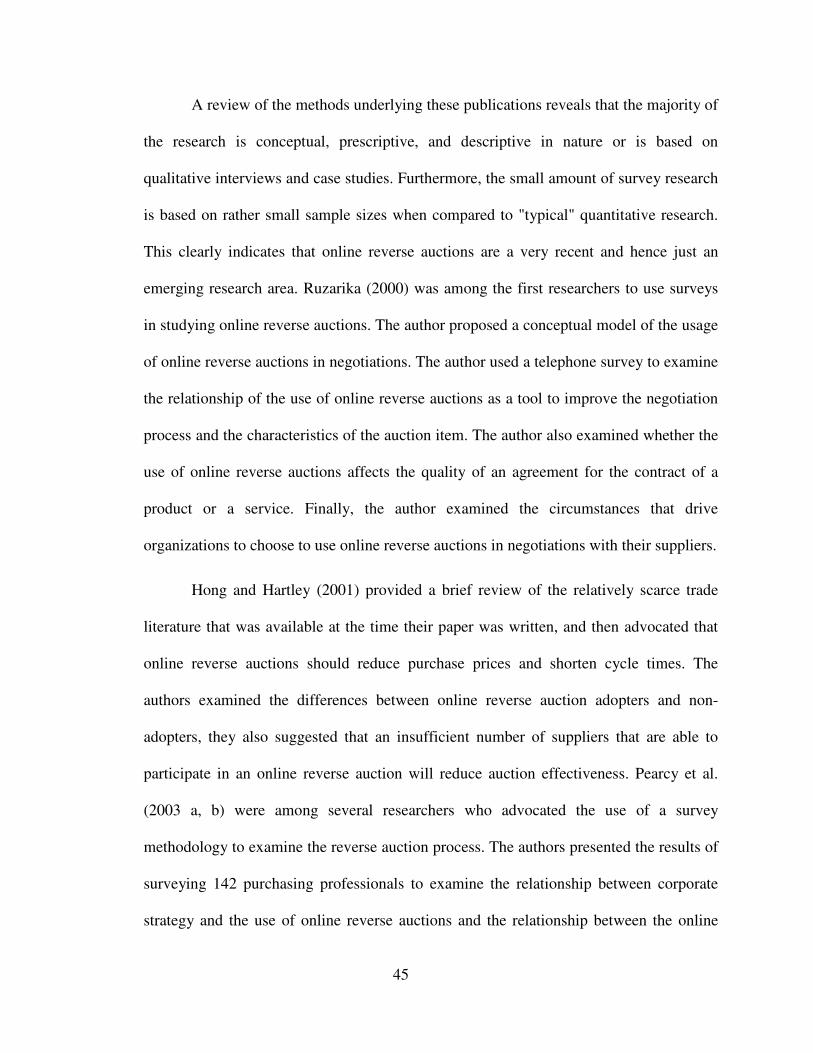
A review of the methods underlying these publications reveals that the majority of
the research is conceptual, prescriptive, and descriptive in nature or is based on
qualitative interviews and case studies. Furthermore, the small amount of survey research
is based on rather small sample sizes when compared to "typical" quantitative research.
This clearly indicates that online reverse auctions are a very recent and hence just an
emerging research area. Ruzarika (2000) was among the first researchers to use surveys
in studying online reverse auctions. The author proposed a conceptual model of the usage
of online reverse auctions in negotiations. The author used a telephone survey to examine
the relationship of the use of online reverse auctions as a tool to improve the negotiation
process and the characteristics of the auction item. The author also examined whether the
use of online reverse auctions affects the quality of an agreement for the contract of a
product or a service. Finally, the author examined the circumstances that drive
organizations to choose to use online reverse auctions in negotiations with their suppliers.
Hong and Hartley (2001) provided a brief review of the relatively scarce trade
literature that was available at the time their paper was written, and then advocated that
online reverse auctions should reduce purchase prices and shorten cycle times. The
authors examined the differences between online reverse auction adopters and non-
adopters, they also suggested that an insufficient number of suppliers that are able to
participate in an online reverse auction will reduce auction effectiveness. Pearcy et al.
(2003 a, b) were among several researchers who advocated the use of a survey
methodology to examine the reverse auction process. The authors presented the results of
surveying 142 purchasing professionals to examine the relationship between corporate
strategy and the use of online reverse auctions and the relationship between the online
46
reverse auction strategy and the supplier’s cooperation. The authors confirmed the
relationship between a firm pursuing a differentiation strategy and the use of online
reverse auctions for supporting long-term relationships. The authors also confirmed the
relationship between a firm pursuing a cost leadership strategy and the use of bid-and-
buy auction strategy. Finally, the authors discovered that a short-term ("bid-and-buy")
focus predominated when firms bought both direct materials and MRO supplies.
Jap (2002) also advocated the use of a survey methodology in the context of a
quasi-experiment involving six reverse auctions to examine the relationship between the
use of open or sealed bid reverse auction, supplier performance, and the attitude of
incumbent and new suppliers toward the buyer. Smeltzer and Carr (2002) advocated the
use of a survey methodology in the context of nondirective field interviews format. The
authors interviewed 41 purchasing professionals who had been involved in more than two
auctions to examine the promises, risks, and conditions associated with the
implementation of online reverse auctions.
Parker (2003) presented the results of a survey conducted in the United Kingdom
to examine the consequences of using online reverse auctions on buyer-supplier
relationships. According to the results of the survey, suppliers are backing online reverse
auctions as a way to improve long-term relationships with their customers. Almost two-
thirds of suppliers said auctions made purchasers more competent. The authors also
found that more than half of the suppliers felt confident that auctions gave the buyers no
more power.
Emiliani and Stec (2004) presented the results of a survey among aerospace part
and subassembly suppliers to quantitatively assess the suppliers’ reaction to online
47
reverse auctions and its impact on their business policies and practices. The authors also
compared their findings to the qualitative benefits identified for suppliers by the online
reverse auction service providers. The authors concluded that both buyers and sellers
participating in online reverse auctions will likely encounter unfavorable outcomes; thus
the authors questioned the use of online reverse auctions as a mean of reducing the unit
price of buyer-designed engineering components.
Wagner and Schwab (2004) examined the purchasing management-related
conditions which influence the success of online reverse auctions in terms of product cost
reduction. After surveying 23 purchasing professionals, the researchers concluded that it
is vital to properly specify the product or service to be auctioned, and it is equally vital
that the companies spend sufficient time and effort to carefully analyze, understand and,
if possible, increase competition among suppliers participating in an online reverse
auction.
Carter et al. (2004) used a survey methodology in the context of a field interview
format to examine the barriers to implementing online reverse auctions, as well as
consequences such as cycle time reduction and productivity. The authors also examined
the parameters that affect the savings that occur during a specific online reverse auction
event, including lotting (multiple lots as opposed to a single lot) strategies and the degree
of supplier visibility.
Recently, Hartley, Lane, and Hong (2004) used a survey methodology in the
context of mail format. The authors mailed 800 surveys to members of the National
Association of Purchasing Management (NAPM) who reported that they are Directors or
Vice Presidents for Purchasing/Supply Management. Based on the 163 usable returned
48
surveys, the authors examined the differences between buying organizations that have
adopted online reverse auctions and those that have not used online reverse auctions for
sourcing.
3.3 The Fit between Auction Design and Reduction in Purchase Price
Once the buying organization decides to organize an online reverse auction, the
buying organization must decide on the auction design. Unfortunately, research related to
the effect of the auction design on the success of the online reverse auction
implementation is very limited. This research studies the auction design from the
following two dimensions: the auction format and the event organization.
Auction Format
While there are many types of reverse auctions, the research focuses on the use of
one-sided open and multi-round sealed bid auctions. “One-sided” refers to the presence
of a single buyer and multiple sellers. The main difference between open-bid and multi-
round sealed bid is the supplier’s ability to view other competitors’ bidding prices and the
current bidding price.
Under sealed-bid auction conditions, the buyer invites the suppliers to participate
in the auction. After the bidding process starts, the suppliers are not able to view their
competitors’ price bids and only the buyer views the bids. The suppliers are only notified
that they have been outbid by a competitor, so the supplier can submit a lower bid, if
interested. In the open-bid auction condition, suppliers are able to view the price bids of
every competitor and have the opportunity to bid against their competitors in real time. In
49
the open-bid auction format, the bids are submitted for the buyer and all the suppliers to
view and the price falls successively until one bidder remains.
The rapid and dynamic nature of price competition in the open-bid format creates
a stronger emphasis on price reduction relative to the sealed-bid format. The fast-paced
bidding along with the need to respond quickly to competitors’ bids produces tension and
pressure on suppliers to cut prices vigorously, and this tension forces additional price
concessions from the suppliers (Jap 2002). Hence, the following hypothesis:
H1: Using online reverse auctions, the reduction in purchase prices is more likely
to be higher in the open-bid auction format than the sealed-bid format.
Event Organization
Companies that provide online reverse auction services are known as “market
makers.” These companies assist buyers in locating suppliers, set up the auction event,
provide the technological expertise, and create a comprehensive request for quote (RFQ)
packages. The RFQ’s are often better structured than those the buyer historically
produced, which results in a more complete description of the procurement under
consideration. Sellers thus gain a better understanding of the buyer’s total requirements
with regard to cost, delivery, and quality (Emiliani and Stec 2001a).
The leading providers of online reverse auction services include Ariba,
Commerce One, eBreviate, Trading Partners, and Frictionless Commerce. The value
delivered by online market makers is primarily in the RFQ process and joining the buyers
and the sellers in real-time reverse auctions using proprietary software (Emiliani and Stec
2002b). The market maker does not support implementation of online reverse auction
results.
50
The buyers’ decision as to whether to organize the auction in-house or with the
help of a market maker primarily depends on the buyer’s experience in using online
reverse auctions, the dollar value of the purchases made through the auctions, and the
frequency of using online reverse auctions. The cost of online auction service providers
can range from a couple of thousand to hundreds of thousands of dollars depending on
the size of the auction and the effort the market maker spends on organizing the auction.
For companies that are just starting to use online reverse auctions and companies that do
not use online reverse auctions frequently, it is more logical to use online service
providers. But for buyers who have used online reverse auctions more frequently (the
target sample for the research survey) and have the required technology infrastructure to
support the online reverse auction, it is expected that they prefer to organize online
reverse auctions in-house in order to cut the cost associated with the online reverse
auction provider fees. Hence, the following hypothesis:
H2: With the objective of using online reverse auctions to reduce purchase prices,
buyers are more likely to prefer to organize the auction event in-house than with
the help of a market maker.
3.4 The Fit between Product Type and Reduction in Purchase Price
Starting with Robinson, Faris, and Wind (1967), many researchers have examined
the theory, methods, and empirical observations in organizational buyer behavior (OBB),
including the type of purchases. The three conceptual models in OBB published in the
1960s and 1970s (Robinson, Faris, and Wind 1967; S heth 1973; Webster and Wind 1972)
51
were significantly influential in generating academic interest in organizational buying
behavior.
Since the early 1980s, research on OBB has exploded (Sheth 1996). This can be
attributed to at least three reasons. First, the shift from understanding and influencing
consumers to customers (industrial, institutional, and trade) has led to a greater focus on
OBB. Second, both the academic journals and business professional organizations,
including the National Association of Purchasing Management (NAPM), have
encouraged research and publications on inter-organizational buying behavior (Sheth
1996). Finally, as suggested in Sheth, Gardner, and Garrett (1988), the marketing
discipline is increasingly influenced by the disciplines of organizational behavior,
industrial organizations, and transaction cost theories in economics.
Most purchasers and industrial marketing researchers support the notion that
organizational buying activities vary according to the type of product bought. Davis,
Eppen, and Mattson (1974) divided purchased products into four categories (raw
materials, capital goods, components, and supplies) and found that supplier selection for
raw materials and capital goods is more centralized and is carried out more systematically
than supplier selection for components and supplies.
Bradley (1977), in his study of industrial buying concerning public sector
enterprises in Ireland, classified products as routine buying products, stock buying
products, and capital buying products. Routine buying products (e.g. raw materials,
general supplies, office supplies, repair and maintenance services) are frequently ordered
as a result of a stock control check and pose no significant application problems for the
The scale to assess the “success of online reverse auction implementation”
construct was created by the researcher, as one did not exist. The scale was developed
according to success criteria published in the online reverse auction literature (Brunelli
2000; Carbone 2004; Jap 2000; Emiliani and Stec 2002 a & b, 2004; Hartley et al. 2004;
Kwak 2002; Pearcy et al. 2003a; Porter 2000; Smart and Harrison 2003; Wagner and
Schwab 2004). Table 4.1 provides a summary of the components of each scale.
Reverse scoring was used in several sections of the survey as shown in Table 4-1.
Reverse scoring several questions forces the survey respondent to slow down and think
about each question, thus minimizing the temptation to score all questions the same
without reading them. Reverse scoring can also flag surveys that may not be useful
because all items (questions) are scored the same this suggesting that the survey taker
was not honestly and thoughtfully completing the survey. These surveys may be
considered biased and removed from the study.
72
Construct Survey Questions
Auction Design
(format)
I. The following refers to the effect of the auction price visibility on the efficiency of online reverse auctions to reduce purchase prices:1. Auctions where suppliers can see each other bids are effective in reducing purchase prices (Open-bid).
2. Auctions where suppliers can only know they have been outbid areeffective in reducing purchase prices (sealed-bid). (Reverse Scored)
3. Multi-round sealed bid auctions are more effective than multi-round open bids in reducing the purchasing prices. (Reverse Scored)
4. Multi-round open-bid auctions are more effective than multi-round sealed bids in reducing the purchasing prices.
Auction Design
(event organization)
II. The following refers to the effect of the auction event organization on the efficiency of online reverse auction to reduce purchase prices:1. In-house organized online reverse auctions are effective in reducing purchase prices.
2. Auctions organized in-house are more effective than auctions organized with the help of an online reverse auction service provider (market maker) in reducing purchasing prices.
3. Auctions organized with the help of an online auction service provider (like Trade-Partners or Freemarkets) are effective in reducing purchase prices. (Reverse Scored)
4. Auctions organized with the help of an online reverse auction service provider (market maker) are more effective than auctions organized in-house in reducing the purchasing prices than what we historically used to pay. (Reverse Scored)
Reduction in Purchase Price
III. The use of online reverse auctions has led to a decrease in the purchase price paid for purchasing:
1. Production material and components / Retail Items
2. MRO (maintenance, repair and operating supplies) / Office Supplies
3. Services
Auction Application
(power based bargaining)
IV. The following refers to the effect of different types of purchases on the application of online reverse auctions as a power-based bargaining tool (short-term contracts) or a collaborative problem solving tool (long-term relationships).1. a) Online reverse auctions are an excellent tool to reduce purchase prices on the short term.
2. We use online reverse auctions to achieve multiple sourcing.
3. We use online reverse auctions to identify new long-term partnering suppliers. (Reverse Scored)
4. We use online reverse auctions to pressure our suppliers to reduce prices.
73
Auction Application
(collaborative problem solving)
IV. The following refers to the effect of different types of purchases on the application of online reverse auctions as a power-based bargaining tool (short-term contracts) or a collaborative problem solving tool (long-term relationships).1. Online reverse auctions are an excellent tool to reduce purchase prices on the long term.
2. We use online reverse auctions to achieve multiple sourcing. (Reverse Scored)
3. We use online reverse auctions to identify new long-term partnering suppliers.
4. We use online reverse auctions to pressure our suppliers to reduce prices. (Reverse Scored)
Attribute of the Alliance
(Trust)
VI. Please rate your level of agreement about the following statements regarding your company relationship with your suppliers for the following dimensions:1. We trust that our strategic supplier alliances will be beneficial to our business.
2. We do not get an equitable (fair) deal from our suppliers in these alliances. (Reverse Scored)
3. The relationships with our suppliers are marked by a high degree of harmony.
Attribute of the Alliance
(commitment)
VI. Please rate your level of agreement about the following statements regarding your company relationship with your suppliers for the following dimensions:1. We would like to discontinue buying from our current suppliers.(Reverse Scored)
2. We are very committed to buying from our current suppliers.
3. We have minimal commitment to our suppliers. (Reverse Scored)
Attribute of the Alliance
(coordination)
VI. Please rate your level of agreement about the following statements regarding your company relationship with your suppliers for the following dimensions:1. Our activities with our suppliers are well coordinated.
2. Programs at our company are well coordinated with our suppliers.
3. We feel like we never know what we are suppose to do for our suppliers. (Reverse Scored)
Attribute of the Alliance
(interdependence)
VI. Please rate your level of agreement about the following statements regarding your company relationship with your suppliers for the following dimensions:1. It would be very easy to terminate the relationship with any supplier and establish another strategic supplier. (Reverse Scored)
2. The time to establish another new strategic supplier partnership would be extremely long.
3. The cost to establish another new strategic supplier partnership would be extremely high.
74
Communication Behavior
(information quality)
VII. To what extent do you feel that your company communication with your suppliers: a. Timely (1=Not timely at all, 7=very timely)
b. Accurate (1=Not accurate at all, 7=very accurate)
c. Adequate (1=Not adequate at all, 7=very adequate)
d. Complete (1=Not complete at all, 7=very complete)
e. Credible (1=Not credible at all, 7=very credible)
Communication Behavior
(information participation)
IX. Please rate your level of agreement about the following statements regarding your company relationship with your suppliers:1. We actively seek advice, counsel, and information from our suppliers.
2. Our strategic suppliers participate in our planning and goal setting activities.
3. We participate in our suppliers’ planning and goal setting activities that are relevant to our strategic partnership.
4. We actively encourage improvement suggestions from our suppliers.
Communication Behavior
(information sharing)
IX. Please rate your level of agreement about the following statements regarding your company relationship with your suppliers:1. We share proprietary information with our suppliers.2. Our suppliers share proprietary information with us.3. We inform our suppliers in advance of changing needs.4. In this relationship, it is expected that any information which might help the other party will be provided.5. The parties are expected to keep each other informed about events or changes that might affect the other party.6. It is expected that the parties will only provide information according to a pre-specified agreement. (Reverse Scored)7. Our Supplier keep us fully informed about issues that affect our business.
Conflict Resolution
VIII. Assuming that some conflict exists over program and policy issues and how the relationship with your supplier is executed, how frequently are the following methods used to resolve such conflict? (1=Never, 7=Occasionally)
a. Smooth over the problem
b. Outside arbitration
c. Persuasive attempts by either party
d. Joint problem solving
e. Harsh words
75
Strategic Supplier Alliance
X. Please rate your level of agreement with the following statements regarding your company’s relationship with your suppliers:1. In our strategic supplier alliances, the parties work together to solve problems.
2. Our suppliers are flexible to requests we make.
3. Our suppliers make an effort to help us during emergencies.
4. When an agreement is made, we can always rely on our suppliers to fulfill the requirements.
5. We are satisfied with our company strategic supplier alliances.
Successful Event Implementation
V. Please rate your level of agreement about the following statements regarding how your company define the success of an online reverse auction event:1. If the prices paid for purchases using reverse auction are less than the prices we used to pay, the online reverse auction event is considered successful.
2. We are satisfied with our company online reverse auctions results.
3. An online reverse auction event is considered a failure if it results in destroying our relationship with one of our suppliers
4. We are likely to reward our current loyal suppliers by continuing business with them even if they are not the lowest bidders in the online reverse auction event.
5. We are satisfied with our savings using online reverse auctions.
Table 4-1: Construct Measures before Scale Purification
76
4.3 The Sample
The sampling frame consists of members of the Institute for Supply Management
(ISM). The survey respondents are members who reported themselves to be senior
purchasing professionals, senior executives, vice-presidents, and even owners of the
supply business who handle large purchases and had the authority to determine major
investment decisions to make price concessions.
This sampling frame was chosen because of the likelihood that these purchasing
professionals would have participated in at least one online reverse auction event and
would be willing to participate in the survey.
Ideal sample size is contingent upon a number of factors including the confidence
level, the margin of error (tolerance), and the proportion of individuals in the population.
For the purpose of this research, a 95% confidence interval with ±4% margin of error is
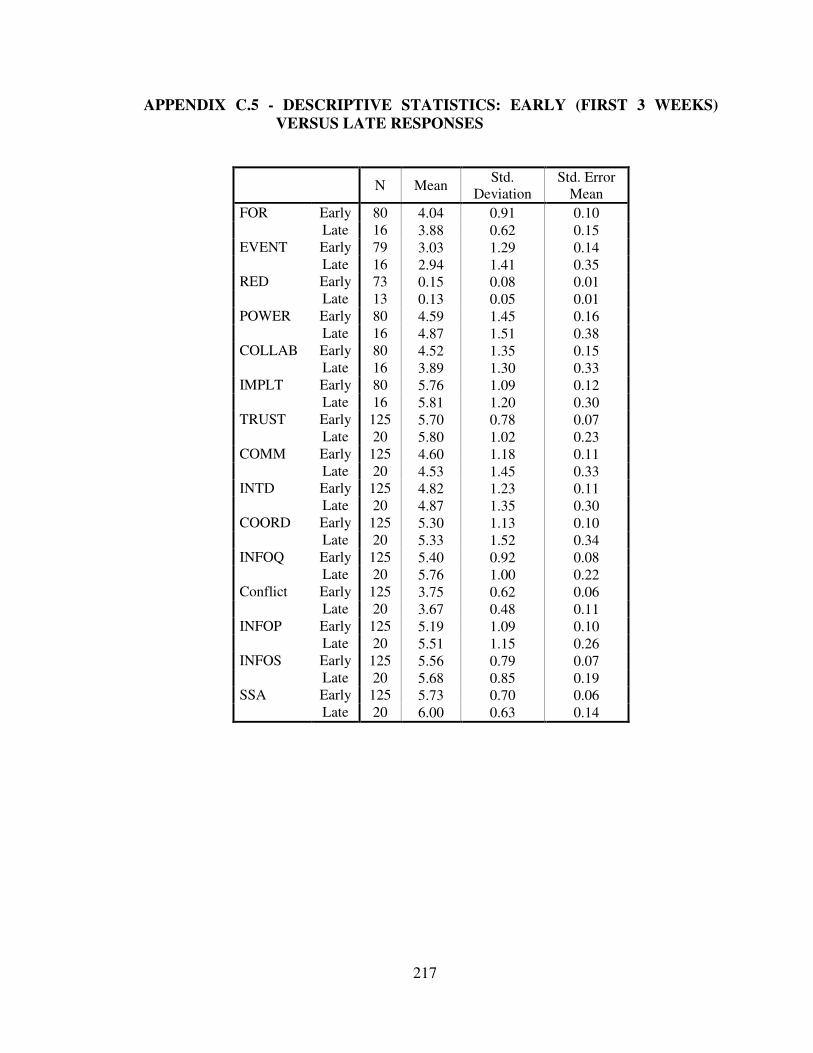
assumed to yield a sample size of 600.
Author(s) Sample Size Usable Returns Response RateJap (2002) 54 38 70%Jap (2003) 154 68 44%Pearcy et al. (2003 a, b) 1,025 142 14%Hartley et al. (2004) 800 163 20%Emiliani and Stec (2004) 43 23 53%
The research sampling frame is similar to the frame surveyed in the research done
by Pearcy et al. (2003 a, b) and Hartley et al. (2004); therefore, the researcher expects a
similar response rate of 15-20%. Pearcy et al. (2003 a, b) mailed 1,025 surveys to
members of the Institute of Supply Management (ISM) who reported to be purchasing
professionals. Hartley et al. (2004) used a survey methodology in the context of mail
77
format. The authors mailed 800 surveys to members of the National Association of
Purchasing Management (NAPM) who reported that they are Directors or Vice
Presidents for Purchasing/Supply Management.
4.4 Data Collection
Survey Preliminary Test
After the development of the survey, a detailed pretest was administered with a
group of three e-procurement professionals, three faculty members, and five graduate
students. The survey was also reviewed by two members of the English Writing Center at
Oklahoma State University. Suggestions were solicited to ensure that the survey is clear
and comprehensive. Based on the feedback, the appropriate revisions were made to
improve the research instrument. The major change was in section III in the survey,
where the suggestion was to change the questions from a Likert scale format to a
percentage format. Changes were also done on the survey style, and the paper color was
changed from white to yellow.
Survey Distribution
After modifying and finalizing the initial survey, an email was sent to all the
participants in the study to introduce the purpose of the study and the importance of their
participation. The objectives for sending these emails were to check if the participant was
still with the company in a role related to supply management and to insure a higher
response rate.
78
Six hundred and three potential participants were mailed a cover letter explaining
the purpose of the study, the importance of their participation, a questionnaire, and a
return envelop with a stamp on it.
Survey Follow-up
An email was sent to participants two weeks later as a follow-up/reminder to
return the questionnaire. Depending on the response rate, a second mailing of the survey
might have been required.
Survey Analysis
Various statistical analysis procedures were used to analyze the results of the
survey including t-test, bi-variate correlation, and multiple linear regression (see Chapter
5). Table 4-3 provides a summary of the hypotheses and the suggested statistical analysis
procedures.
79
Hypothesis Statistical Analysis Tool
H1: Using online reverse auctions, the reduction in purchase prices is more likely to be higher in the open-bid auction format than the sealed-bid format.
One tailed t-test
H2: With the objective of using online reverse auctions to reduce purchase prices, buyers are more likely to prefer to organize the auction event in-house than with the help of a market maker.
One tailed t-test
H3a-c: When purchasing X, a positive, significant relationship will exist between the type of the purchase and the purpose of using online reverse auctions to reduce purchase prices.X can be production material and components, MROs, or services.
Means analysis &one tailed t-test
H4a-c: When purchasing X, a negative, significant relationship will exist between the use of online reverse auctions for the purpose of a short-term relationship and the purpose of developing/maintaining long-term relationships.X can be production material and components, MROs, or services.
Correlation analysis
H5a-c: When purchasing X, purchasers will be more likely to use online reverse auction for the purpose of a short-term relationship than developing/maintaining long-term relationships.X can be production material and components, MRO, or services.
One tailed t-test
H6a: Using online reverse auctions as a collaborative problem solving tool is associated with high levels of trust, commitment, coordination and interdependence.
Multiple linear regression
H6b: Using online reverse auctions as a collaborative problem solving tool is associated with high levels of buyer-supplier (a) information sharing (b) information quality and (c) information participation.
Multiple linear regression
H6c: Using online reverse auctions as a collaborative problem solving tool is associated with (a) high use of constructive conflict resolution techniques, (b) low use of conflict avoidance techniques and (c) low use of destructive resolution techniques.
Multiple linear regression
H7a: Successful strategic supplier alliances are associated with high levels of commitment, trust, coordination and interdependence.
Multiple linear regression
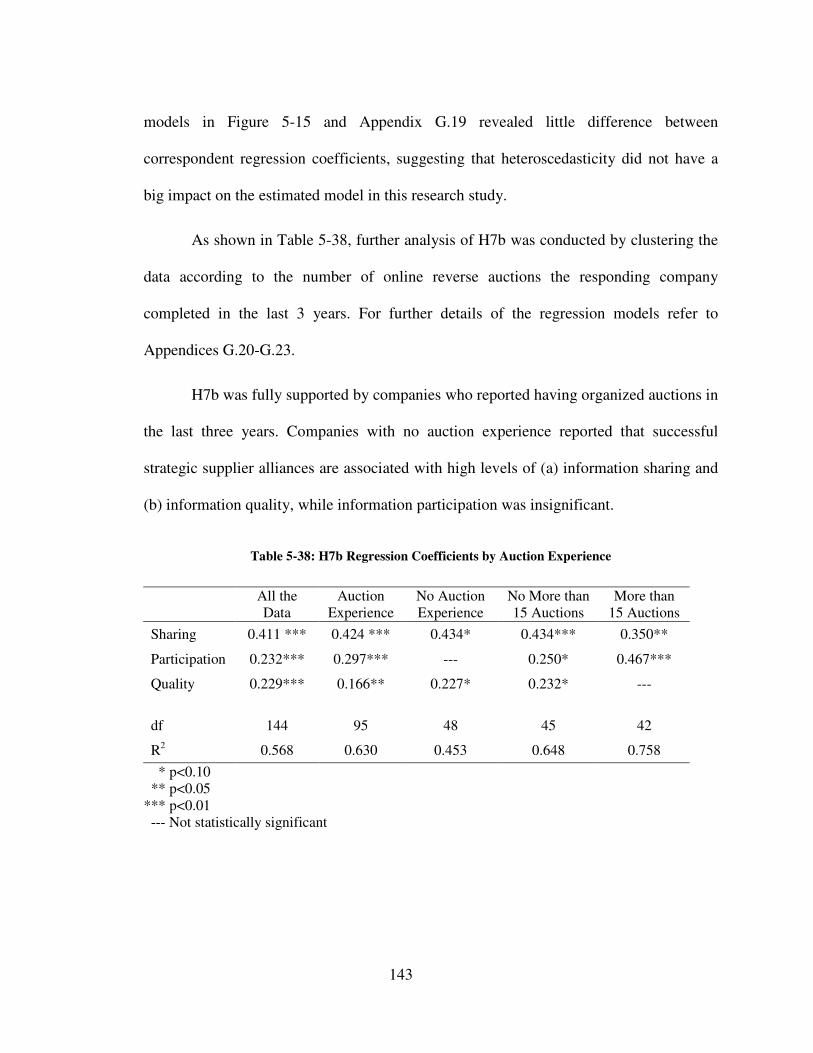
H7b: Successful strategic supplier alliances are associated with high levels of (a) information sharing and (b) information quality and (c) information participation.
Multiple linear regression
H7c: A positive, significant relationship will exist between the success of the strategic alliance and (a) high use of constructive conflict resolution techniques, (b) low use of conflict avoidance techniques and (c) low use of destructive resolution techniques
Multiple linear regression
H8: A positive, significant relation exists between reducing purchase prices and the buyer perception of a successful online reverse auction event.
Correlation analysis
H9: A positive, significant relation exists between buyer-supplier strategic alliance, and the buyer perception of a successful online reverse auction event.
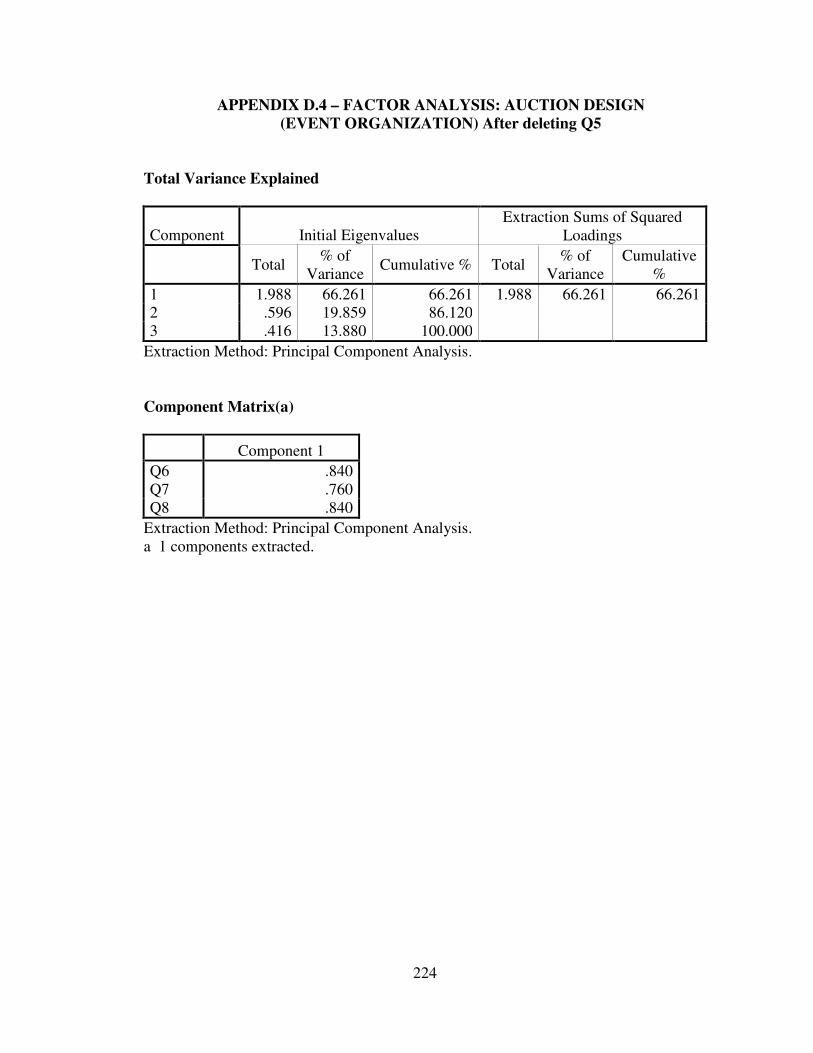
The factor analysis conducted for the auction design (event organization) scale
revealed two factors (see Appendix D.3); questions 6-8 loaded on one factor and question
92
5 loaded on another factor (the scores for Q7 and Q8 have been reversed). Tabachnick
and Fidell (2000) warned of factors consisting of one item; therefore Q5 was deleted (see
Appendix D.4). The factor analysis was followed by a reliability analysis, which
indicated the scale was indeed reliable with coefficient alpha of 0.747. Improvement in
coefficient alpha was minimal with the deletion of Q7; therefore all the items were
retained (see Appendix D.5). Table 5-4 summarizes the reliability analysis results for the
auction design (format) construct. Each of the three items exhibited high factor loading,
ranging from 0.76 to 0.84. The items explained 66.26% of the variance in the data.
FactorAuction Design (Event Organization)
Item-to-total correlation
Factor loading
Q6. Auctions organized in-house are more effective than auctions organized with the help of an online reverse auction service provider (market maker) in reducing purchasing prices.
0.648 0.840
Q7. Auctions organized with the help on an online auction service provider (like Trade-Partners or Freemarkets) are effective in reducing purchase prices. (Reverse Scored)
0.497 0.760
Q8. Auctions organized with the help on an online auction service provider (like Trade-Partners or Freemarkets) are more effective than auctions organized in-house in reducing the purchasing prices. (Reverse Scored)
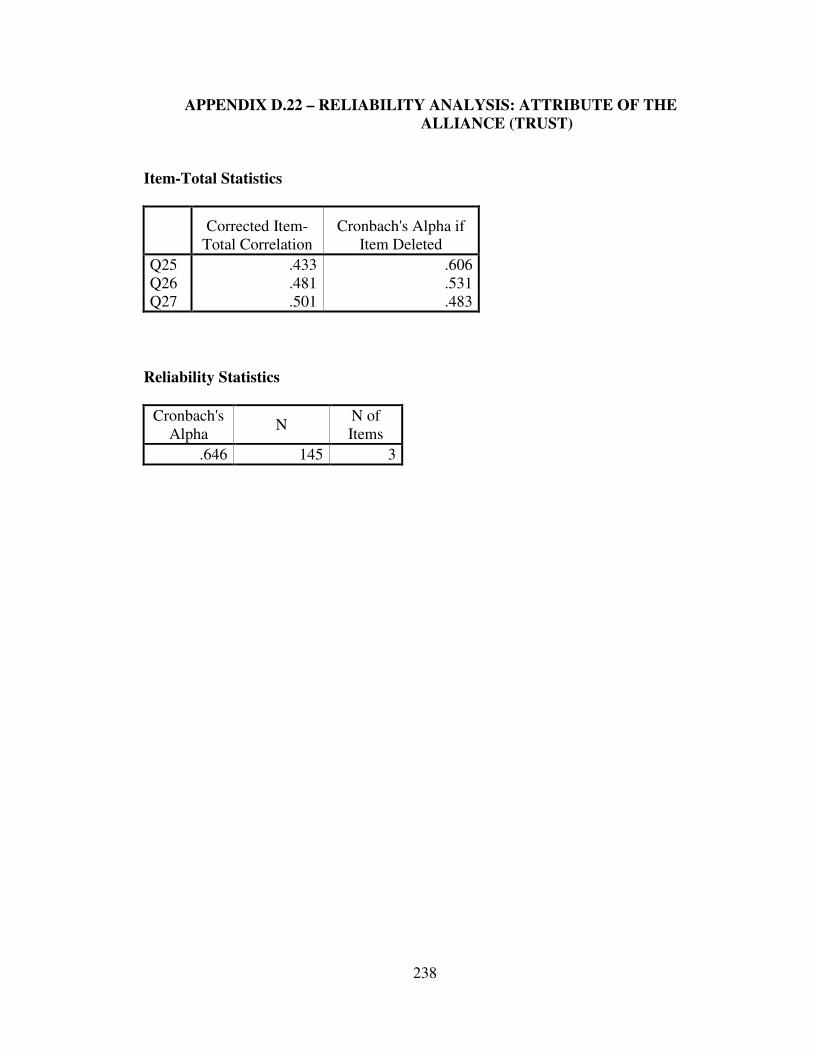
The factor analysis conducted for the attribute of the alliance (trust) scale revealed
one factor. Table 5-9 summarizes the reliability analysis results for the attribute of the
alliance (trust) construct (the scores for Q26 were reversed to assure uniformity in
positive factor loading across the construct). Each of the three items exhibited high factor
loading, ranging from 0.739 to 0.796. The items explained 59.5% of the variance in the
96
data (see Appendix D.21). The factor analysis was followed by a reliability analysis,
which indicated the scale was indeed reliable with coefficient alpha of 0.646.
Improvement in coefficient alpha was not possible with the deletion of any item;
therefore, all the items were retained (see Appendix D.22).
Factor
Attribute of the Alliance (Trust)Item-to-total correlation
Factor loading
Q25. We trust that our strategic supplier alliances will be beneficial to our business. 0.433 0.739
Q26. We do not get an equitable (fair) deal from our suppliers in these alliances. (Reverse Scored) 0.481 0.777
Q27. The relationships with our suppliers are marked by a high degree of harmony. 0.501 0.796
Cronbach’s Alpha 0.646Explained Variance 59.472%
Table 5-9: Reliability Analysis: Attribute of the Alliance (Trust)
The factor analysis conducted for the attribute of the alliance (commitment) scale
revealed one factor. Table 5-10 summarizes the reliability analysis results for the attribute
of the alliance (commitment) construct. Each of the three items exhibited high factor
loading, ranging from 0.748 to 0.801. The items explained 61% of the variance in the
data (see Appendix D.23). The factor analysis was followed by a reliability analysis,
which indicated the scale was indeed reliable with coefficient alpha of 0.656.
Improvement in coefficient alpha was not possible with the deletion of any item;
therefore, all the items were retained (see Appendix D.24).
97
FactorAttribute of the Alliance (Commitment)
Item-to-total correlation
Factor loading
Q28. We would like to discontinue buying from our current suppliers. (Reverse Scored)
0.455 0.748
Q29. We are very committed to buying from our current suppliers. 0.499 0.793Q30. We have minimal commitment to our suppliers. (Reverse Scored)
0.504 0.801
Cronbach’s Alpha 0.656Explained Variance 61.02%
Table 5-10: Reliability Analysis: Attribute of the Alliance (Commitment)
The factor analysis conducted for the attribute of the alliance (interdependence)
scale revealed one factor; Table 5-11 summarizes the reliability analysis results for the
construct. Each of the three items exhibited high factor loading, ranging from 0.696 to
0.890. The items explained 76.7% of the variance in the data (see Appendix D.25). The
factor analysis was followed by a reliability analysis, which indicated the scale was
indeed reliable with coefficient alpha of 0.754. While the deletion of Q31 would increase
the coefficient alpha, the increase was rather minimal, and since the value of alpha of
0.754 is considered respectable (DeVellis 1991); the item was retained.
Factor
Attribute of the Alliance (Interdependence)Item-to-total correlation
Factor loading
Q31. It would be very easy to terminate the relationship with any supplier and establish another strategic supplier. (Reverse Scored) 0.440 0.696
Q32. The time to establish another new strategic supplier partnership would be extremely long. 0.637 0.868
Q33. The cost to establish another new strategic supplier partnership would be extremely high. 0.689 0.890
Cronbach’s Alpha 0.754Explained Variance 76.699%
Table 5-11: Reliability Analysis: Attribute of the Alliance (Interdependence)
98
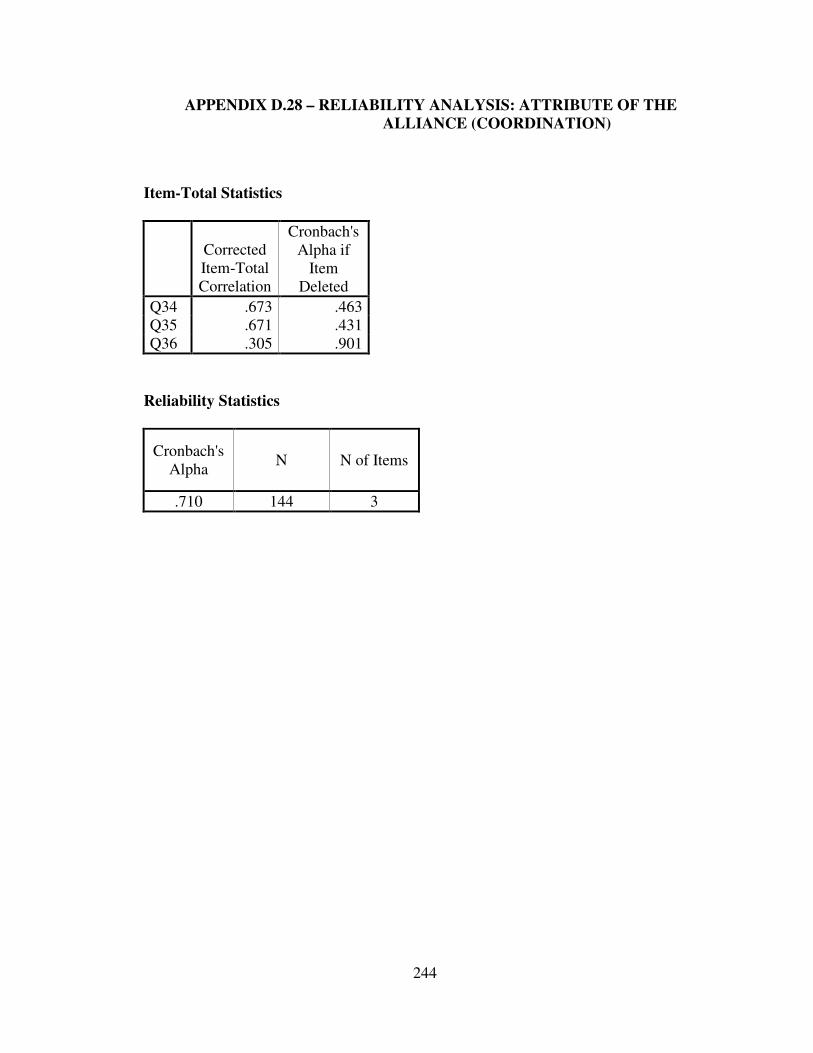
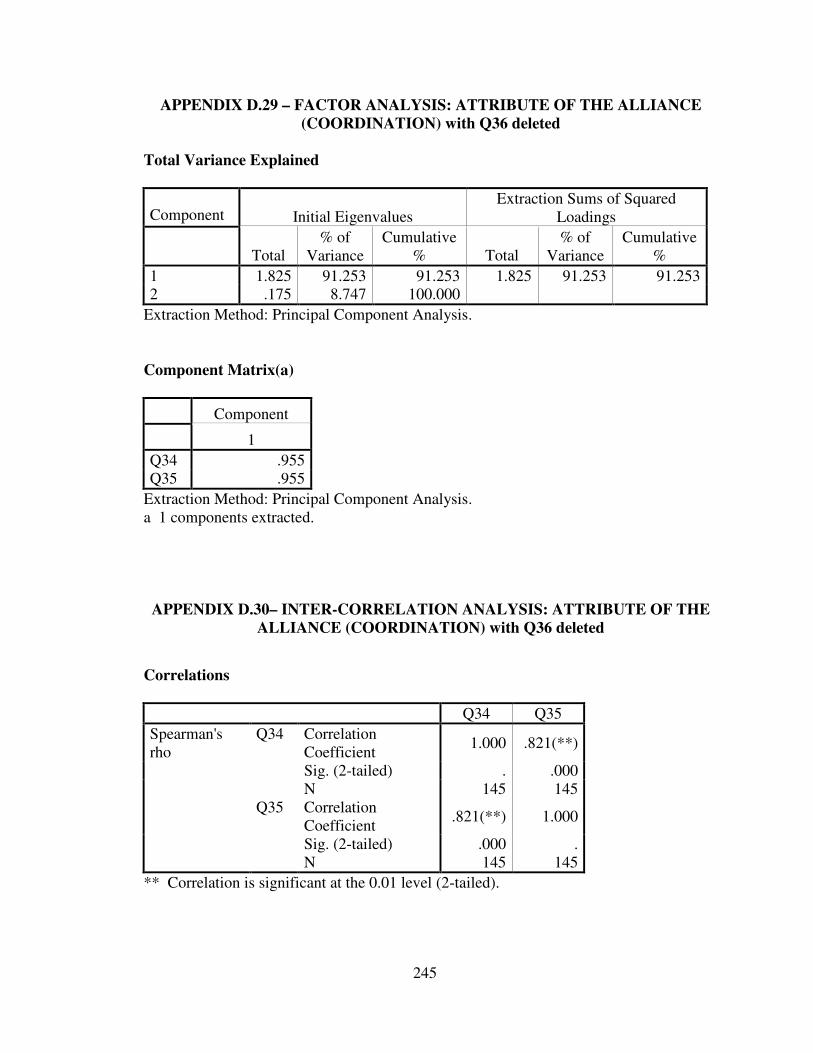
The factor analysis conducted for the attribute of the alliance (coordination) scale
revealed one factor (see Appendix D.27). The factor analysis was followed by a
reliability analysis that revealed a coefficient alpha of 0.71. Improvement in coefficient
alpha to a value of 0.901 was possible with the deletion of Q36; therefore Q36 was
deleted and the remaining two items had a high inter-correlation of r=0.821 (see
Appendix D.30). A second factor analysis was conducted where the items formed one
factor with loadings of 0.955 for both items. The factor explained 91.253% of the
variance in the data (see Appendix D.29). Table 5-12 summarizes the reliability analysis
results for the attribute of the alliance (coordination) construct.
Factor
Attribute of the Alliance (Coordination)Item-to-total correlation
Factor loading
Q34. Our activities with our suppliers are well coordinated. 0.825 0.955Q35. Programs at our company are well coordinated with our suppliers. 0.825 0.95
Cronbach’s Alpha 0.901Explained Variance 91.253%
Table 5-12: Reliability Analysis: Attribute of the Alliance (Coordination)
The factor analysis conducted for the communication behavior (information
quality) scale revealed one factor. Table 5-13 summarizes the reliability analysis results
for the communication behavior (information quality) construct. Each of the five items
exhibited high factor loading, ranging from 0.77 to 0.93. The items explained 74.3% of
the variance in the data (see Appendix D.32). The factor analysis was followed by a
reliability analysis, which indicated the scale was indeed reliable with coefficient alpha of
0.911. While the deletion of Q41 increased coefficient alpha, the increase was rather
99
minimal (0.02), and since the value of coefficient alpha of 0.911 is considered “very
good” (DeVellis, 1991); therefore, the item was retained (see Appendix D.33).
Factor
Communication behavior (Information quality)Item-to-total correlation
Factor loading
Q37. To what extent do you feel that your company communication with your suppliers is timely? 0.765 0.851
Q38. To what extent do you feel that your company communication with your suppliers is accurate?
0.811 0.887
Q39. To what extent do you feel that your company communication with your suppliers is adequate?
0.784 0.866
Q40. To what extent do you feel that your company communication with your suppliers is complete?
0.878 0.928
Q41. To what extent do you feel that your company communication with your suppliers is credible?
0.660 0.772
Cronbach’s Alpha 0.911Explained Variance 74.341%
Table 5-13: Reliability Analysis: Information Quality Scale
The factor analysis for the communication behavior (information participation)
scale revealed one factor. Table 5-14 summarizes the reliability analysis results for the
communication behavior (information participation) construct. Each of the four items
exhibited high factor loading, ranging from 0.70 to 0.905. The items explained 64.1% of
the variance in the data (see Appendix D.35). The factor analysis was followed by a
reliability analysis, which indicated the scale was indeed reliable with coefficient alpha of
0.807. While the deletion of Q47 increased the coefficient alpha, the increase was rather
minimal (0.04), and since the coefficient alpha value of 0.807 is considered “very good”
(DeVellis 1991), the item was retained (see Appendix D.36).
100
Factor
Communication behavior (Information participation)Item-to-total correlation
Factor loading
Q47. We actively seek advice, counsel, and information from our suppliers. 0.512 0.700
Q48. Our strategic suppliers participate in our planning and goal setting activities. 0.904 0.905
Q49. We participate in our suppliers’ planning and goal setting activities that are relevant to our strategic partnership.
0.690 0.833
Q50. We actively encourage improvement suggestions from our suppliers.
0.568 0.749
Cronbach’s Alpha 0.807Explained Variance 64.126%
Table 5-14: Reliability Analysis: Information Participation Scale
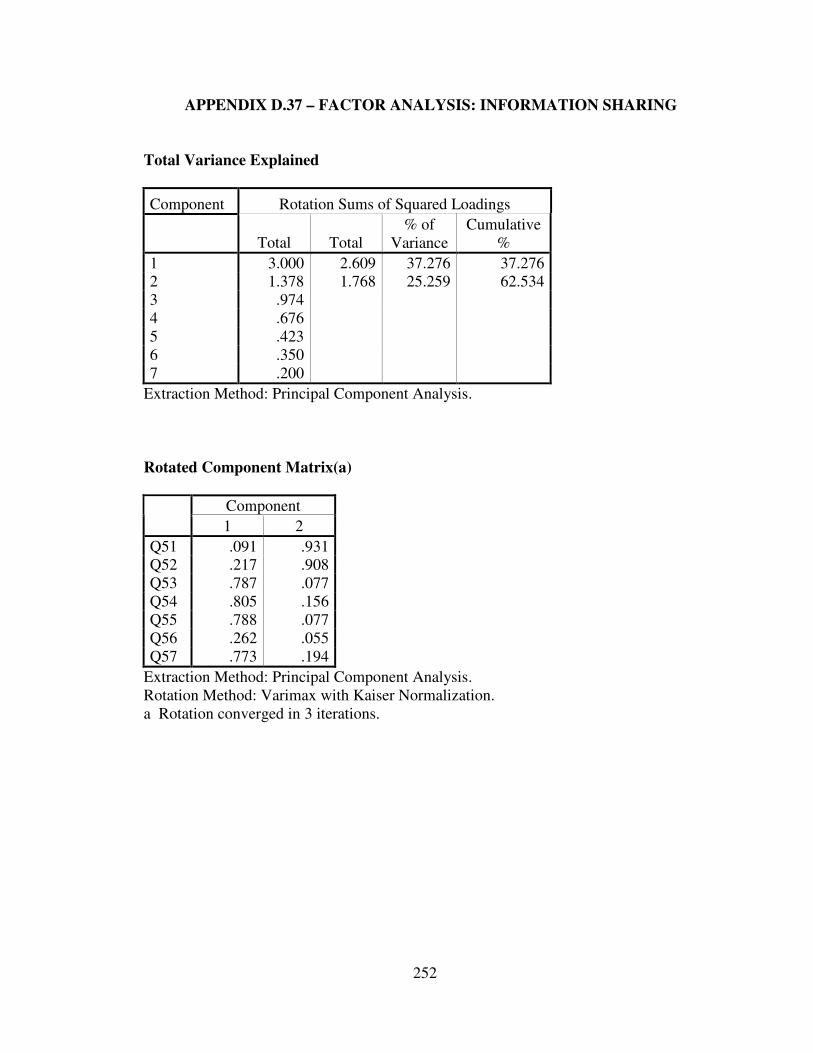
The factor analysis conducted for the communication behavior (information
sharing) scale revealed two factor s: Q51 and Q52 loaded on one factor and Q53-Q57
loaded on another factor (see Appendix D.37).
Bivariate correlation was conducted on Q51 and Q52 (See Appendix D.38). The
analysis showed that Q51 and Q52 are not highly correlated with each other (r=0.67);
therefore, the items were deleted. A second factor analysis was conducted using Q53-
Q57, which revealed that Q56 had a low factor loading (0.27); therefore, the item was
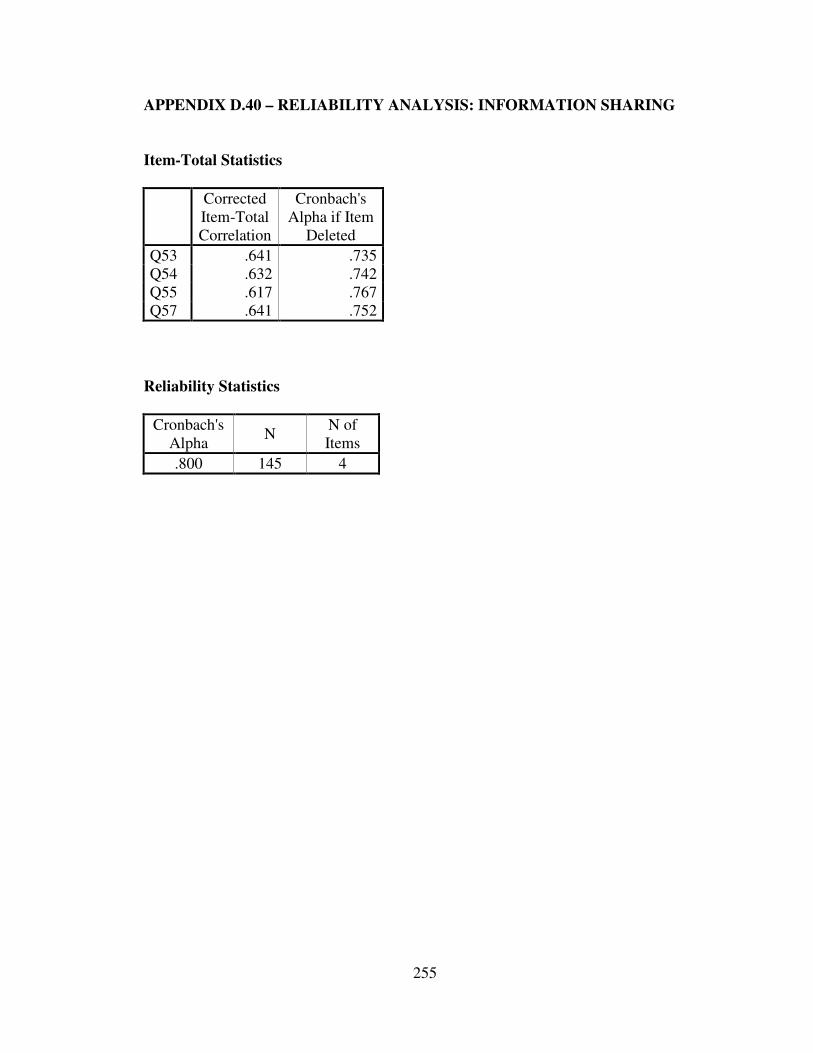
deleted. Table 5-15 summarizes the reliability analysis results for the communication
behavior (information sharing) construct. Each of the four items exhibited high factor
loading, ranging from 0.794 to 0.717. The items explained 64.4% of the variance in the
data (see Appendix D.39). The factor analysis was followed by a reliability analysis,
which indicated the scale was indeed reliable with a coefficient alpha of 0.80.
Improvement in the coefficient alpha was not possible with the deletion of any item;
therefore, all the items were retained (see Appendix D.40).
101
Factor
Communication behavior (Information Sharing)Item-to-total correlation
Factor loading
Q53. We inform our suppliers in advance of changing needs. 0.641 0.794Q54. In this relationship, it is expected that any information which might help the other party will be provided. 0.632 0.817
Q55. The parties are expected to keep each other informed about events or changes that might affect the other party. 0.617 0.797
Q57. Our Supplier keep us fully informed about issues that affect our business. 0.641 0.800
Cronbach’s Alpha 0.800Explained Variance 64.375%
Table 5-15: Reliability Scale: Information Sharing
The factor analysis for the conflict resolution scale revealed three factors as
expected: Q44 and Q45 loaded on a factor which represents the constructive conflict
resolution techniques (persuasion and joint problem solving), Q43 and Q46 loaded on a
factor that represents destructive conflict resolution techniques (outside arbitration and
harsh words), and Q42 loaded on a factor by itself that represents the conflict avoidance
techniques (see Appendix D.34). The factor analysis results of having three factors agree
with the findings of previous research (Mohr and Spekman 1994; Monczka et al. 1998).
The measures for conflict resolution included five modes by which conflict could
be resolved. These items were designed to cover a spectrum of conflict resolution modes
as described in Chapter 3. Howell (1987) refers to this type of measurement as a “check
list,” or composite scale, in which each item taps a different dimension of the construct.
Hence, traditional reliability analysis is not appropriate (Mohr and Spekman 1994).
Therefore, the five items (smooth over the problem, outside arbitration, persuasion, joint
problem solving and harsh words) are treated as unitary items with no inter-correlation
among these factors.
102
The factor analysis conducted for the strategic supplier alliance scale revealed one
factor. Table 5-16 summarizes the reliability analysis results for the strategic supplier
alliance construct. Each of the five items exhibited high factor loading, ranging from 0.70
to 0.83. The factors explained 61% of the variance in the data (see Appendix D.41).
The factor analysis was followed by a reliability analysis, which indicated the scale was
indeed reliable with coefficient alpha of 0.832. Improvement in coefficient alpha was not
possible with the deletion of any item; therefore, all the items were retained (see
Appendix D.42).
FactorStrategic Supplier Alliance
Item-to-total correlation
Factor loading
Q58. In our strategic supplier alliances, the parties work together to solve problems. 0.703 0.830
Q59. Our suppliers are flexible to requests we make. 0.639 0.793Q60. Our suppliers make an effort to help us during emergencies. 0.643 0.785Q61. When an agreement is made, we can always rely on our suppliers to fulfill the requirements. 0.547 0.696
Q62. We are satisfied with our company strategic supplier alliances. 0.668 0.796Cronbach’s Alpha 0.832
Construct validity, which is defined broadly as “the extent to which an
operationalization measures the concept it is supposed to measure” (Cook and Campbell
1979), has been singled-out by many researchers as a central issue in organizational
research (Mitchell 1985; Webb and Weick 1979). The validity test describes the
correctness of the data-gathering tool that, is if it is able to measure what it should
measure. Hayes (1997) defines validity as “the degree to which evidence supports the
inferences made from scores derived from measures, or the degree to which the scale
measures what it is designed to measure.” Although validity has a broad definition
(Jacoby 1978), for the purpose of this study, the convergent validity, the discriminate
validity, and the validity of the content will be the only ones in focus.
Bagozzi, Phillips, and Lynn (1982) define convergent validity as “the degree to
which two or more attempts to measure the same concept are in agreement”. The authors
also define the discriminate validity as “the degree to which measures of distinct concepts
differ”. Convergent and discriminate validity were assessed through correlation analyses,
and since no objective criteria exist for measuring the validity of the content, it can be
assumed based on the pre-test of the instrument. High correlations were expected to exist
between items that are intended to measure the same construct and those items were
expected to exhibit low correlations with items intended to measure different constructs
(Pearcy 2002).
The Pearson Product Moment correlations among items for each scale on the
survey are presented in Appendix E. The correlations for the “auction design-format”
104
scale were all statistically significant at α=0.01 and ranged from 0.233 to 0.529 except the
correlation between Q1 and Q3, which was significant with a value of 0.233 at α=0.05
(see Appendix E.1). The correlations for the “auction design - event organization” scale
were all statistically significant at α=0.01 and ranged from 0.45 to 0.58 (see Appendix
E.2). The correlations for the “reduction in purchase” scale were all statistically
significant at α=0.05 and ranged from 0.32 to 0.36 (see Appendix E.3). The correlations
for the “auction application-power based bargaining” scale were all statistically
significant at α=0.01 and ranged from 0.30 to 0.85 (see Appendix E.4). The correlations
for the “auction application-collaborative problem solving” scale were all statistically
significant at α=0.01 and ranged from 0.23 to 0.81 (see Appendix E.5). As illustrated in
Appendix E.6, the correlations for the “successful event implementation” two-item scale
was statistically significant with a value of 0.76 at α=0.01. The correlations for the
“attribute of the alliance-trust” scale were all statistically significant at α=0.01 and ranged
from 0.35 to 0.44 (see Appendix E.7). The correlations for the “attribute of the alliance-
commitment” scale were all statistically significant at α=0.01 and ranged from 0.38 to
0.47 (see Appendix E.8). The correlations for the “attribute of the alliance-
interdependence” scale were all statistically significant at α=0.01 and ranged from 0.38 to
0.71 (see Appendix E.9). The correlation between the “attribute of the alliance-
coordination” scale two items was statistically significant with a value of 0.83 at α=0.01
(see Appendix E.10). The correlations for the “communication behavior - information
quality” scale were all statistically significant at α=0.01 and ranged from 0.52 to 0.72 (see
Appendix E.11).
105
The correlations for the “communication behavior - information participation”
scale were all statistically significant at α=0.01 and ranged from 0.38 to 0.75 (see
Appendix E.12). The correlations for the “communication behavior – information
sharing” scale were all statistically significant at α=0.01 and ranged from 0.48 to 0.62
(see Appendix E.13). Finally, the correlations for the “strategic supplier alliance” scale
were all statistically significant at α=0.01 and ranged from 0.37 to 0.60 (see Appendix
E.14).
The inter-correlations between scales are shown in Appendix E.15. As expected,
the correlations between different scales were below 0.7 except for the correlations
between the “auction application-power based bargaining” and the “auction application-
collaborative problem solving” scales (-0.73). With respect to this high negative
correlation, it would be expected that a company would use online reverse auctions either
as a power based bargaining tool or as a collaborative problem-solving tool.
The steps to assure reliability and validity of the measures resulted in the deletion
of some items of the survey. Table 5-17 summarizes the components of each scale after
the scale purification through reliability and validity testing.
106
Table 5-17: Construct Measures after Scale Purification
Construct Survey Questions
Auction Design
(Format)
Q1. Auctions where suppliers can see others’ bids are effective in reducing purchase prices (open-bid).
Q2. Auctions where suppliers only know they have been outbid are effective in reducing purchase prices (sealed-bid). (Reverse Scored)
Q3. Multi-round sealed bid auctions are more effective than multi-round open bids in reducing the purchasing prices.
Q4. Multi-round open-bid auctions are more effective than multi-round sealed bids in reducing the purchasing prices. (Reverse Scored)
Auction Design
(Event Organization)
Q6. Auctions organized in-house are more effective than auctions organized with the help of an online reverse auction service provider (market maker) in reducing purchasing prices.
Q7. Auctions organized with the help on an online auction service provider (like Trade-Partners or Freemarkets) are effective in reducing purchase prices. (Reverse Scored)
Q8. Auctions organized with the help on an online auction service provider (like Trade-Partners or Freemarkets) are more effective than auctions organized in-house in reducing the purchasing prices. (Reverse Scored)
Reduction in Purchase Price
EPMC: The use of online reverse auctions has led to a decrease in the purchase price paid for purchasing production material and components.
EMRO: The use of online reverse auctions has led to a decrease in the purchase price paid for purchasing MRO.
ESER: The use of online reverse auctions has led to a decrease in the purchase price paid for purchasing services.
Auction Application
(Power-Based Bargaining)
Q9. Our goal is short term contract with the suppliers when we buy production material and components.
Q10. Our goal is short term contract with the suppliers when we buy MRO.
Q11. Our goal is short term contract with the suppliers when we buy services.
Q19. We use online reverse auctions to pressure our suppliers to reduce prices.
Auction Application
(CollaborativeProblem Solving)
Q12. Our goal is long term contract with the suppliers when we buy production material and components.Q13. Our goal is long term contract with the suppliers when we buy MRO.Q14. Our goal is long term contract with the suppliers when we buy services.Q18. We use online reverse auctions to identify new long-term partnering suppliers.
107
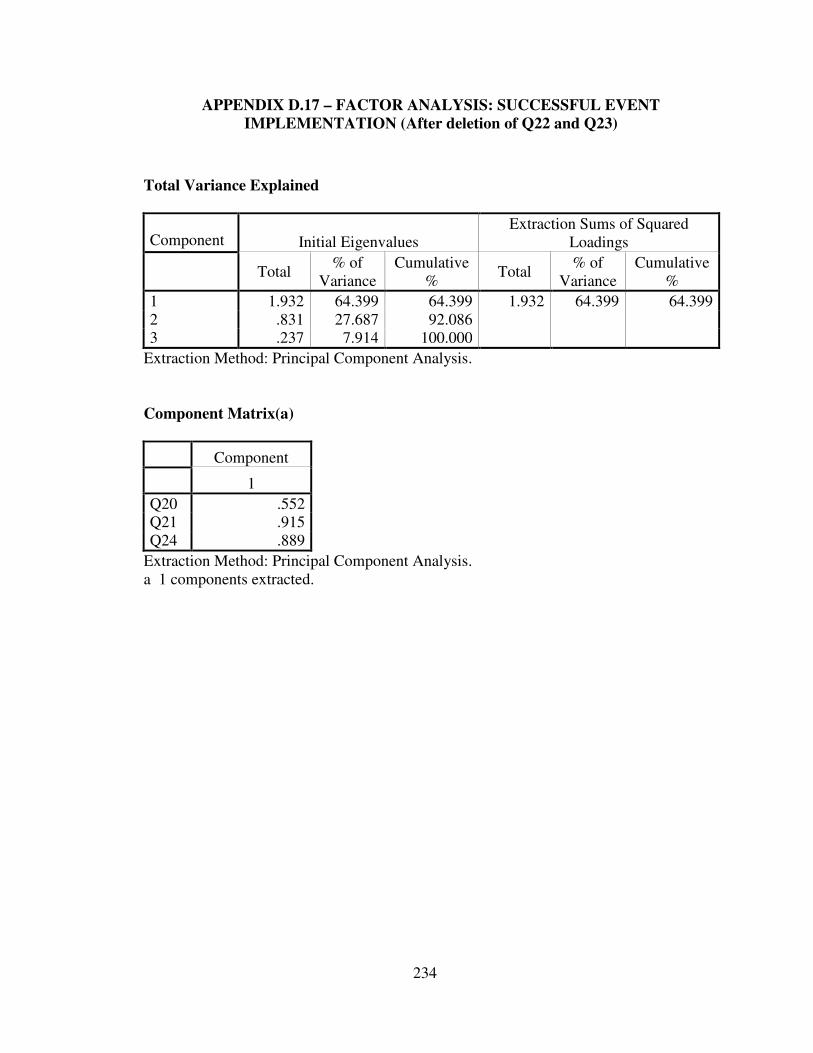
Successful Event Implementation
Q21. We are satisfied with our savings using online reverse auctions.
Q24. We are satisfied with our company online reverse auctions results.
Attribute of the Alliance
(Trust)
Q25. We trust that our strategic supplier alliances will be beneficial to our business.
Q26. We do not get an equitable (fair) deal from our suppliers in these alliances. (Reverse Scored)
Q27. The relationships with our suppliers are marked by a high degree of harmony.
Attribute of the Alliance
(Commitment)
Q28. We would like to discontinue buying from our current suppliers. (Reverse Scored)
Q29. We are very committed to buying from our current suppliers.
Q30. We have minimal commitment to our suppliers. (Reverse Scored)
Attribute of the Alliance
(Interdependence)
Q31. It would be very easy to terminate the relationship with any supplier and establish another strategic supplier. (Reverse Scored)
Q32. The time to establish another new strategic supplier partnership would be extremely long.
Q33. The cost to establish another new strategic supplier partnership would be extremely high.
Attribute of the Alliance
(Coordination)
Q34. Our activities with our suppliers are well coordinated.
Q35. Programs at our company are well coordinated with our suppliers.
Communication Behavior
(Information Quality)
Q37. To what extent do you feel that your company communication with your suppliers is timely?
Q38. To what extent do you feel that your company communication with your suppliers is accurate?
Q39. To what extent do you feel that your company communication with your suppliers is adequate?
Q40. To what extent do you feel that your company communication with your suppliers is complete?
Q41. To what extent do you feel that your company communication with your suppliers is credible?
108
Conflict Resolution
VIII. Assuming that some conflict exists over program and policy issues and how the relationship with your supplier is executed, how frequently are the following methods used to resolve such conflict? (1=Never, 7=Occasionally)
Q42. Smooth over the problem
Q43. Outside arbitration
Q44. Persuasive attempts by either party
Q45. Joint problem solving
Q46. Harsh words
Communication Behavior
(Information Participation)
Q47. We actively seek advice, counsel, and information from our suppliers.
Q48. Our strategic suppliers participate in our planning and goal setting activities.
Q49. We participate in our suppliers’ planning and goal setting activities that are relevant to our strategic partnership.
Q50. We actively encourage improvement suggestions from our suppliers.
Communication Behavior
(Information Sharing)
Q53. We inform our suppliers in advance of changing needs.
Q54. In this relationship, it is expected that any information which might help the other party will be provided.
Q55. The parties are expected to keep each other informed about events or changes that might affect the other party.
Q57. Our Supplier keep us fully informed about issues that affect our business.
Strategic Supplier Alliance
Q58. In our strategic supplier alliances, the parties work together to solve problems.
Q59. Our suppliers are flexible to requests we make.
Q60. Our suppliers make an effort to help us during emergencies.
Q61. When an agreement is made, we can always rely on our suppliers to fulfill the requirements.
Q62. We are satisfied with our company strategic supplier alliances.
109
5.6 Hypotheses Testing
5.6.1 Scale Descriptive Analyses
Descriptive statistics for each scale were obtained before hypotheses testing;
Appendix F summarizes the minimums/maximums, means, standard deviations, and
variances for each scale.
The respondents’ companies appeared to prefer to use open-bid auctions more
than sealed bid-auctions. The means for the open-bid auction format items were 6.07 and
5.41, while the means for the items intended to measure the preference of the sealed-bid
format auction were 2.92 and 4.41. Similarly the respondents seemed to prefer to
organize auctions with the help of online auction service providers (like TradingPartners
or Freemarkets). The mean for the item measuring the preference to use online auction
service providers was 5.78 while those for the items that measure the preference to
organize auctions in-house were 3.56 and 4.51.
The data provided clear support for the published literature that online reverse
auctions result in price reduction. The average of savings range was 12.9%-16.9% with a
minimum of 0% and maximum of 71%.
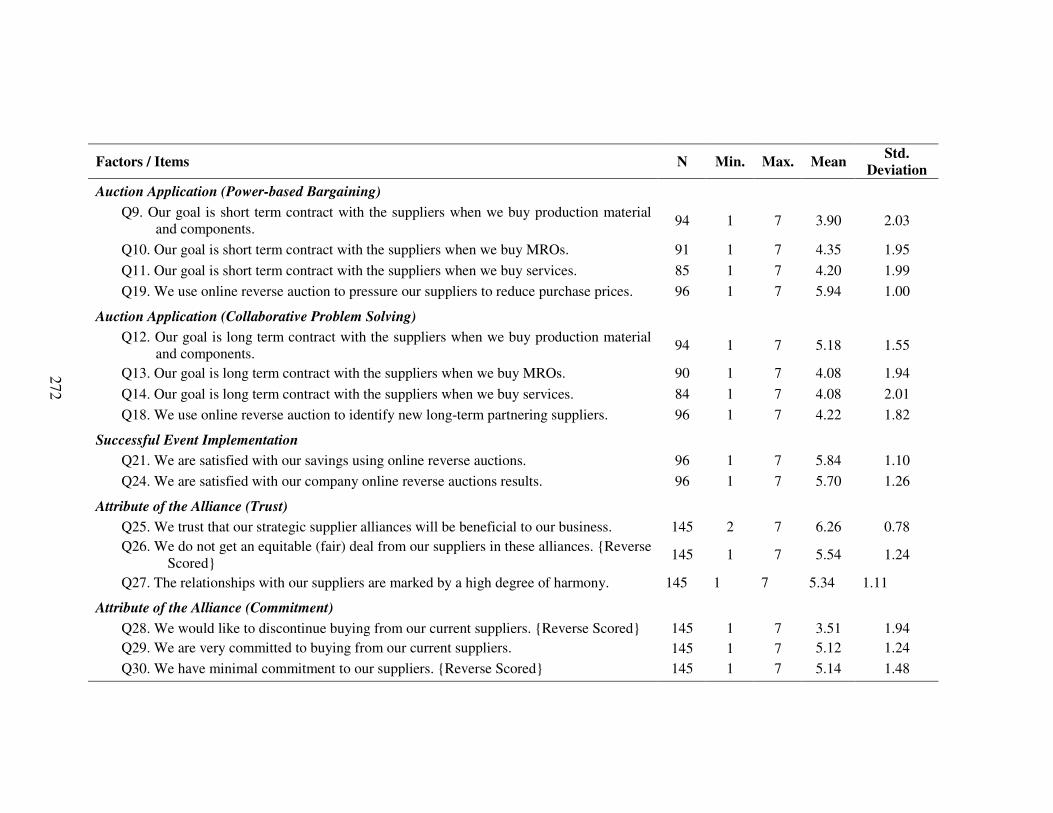
The respondents gave mixed responses about the use of the online reverse auction
as a power-based bargaining tool or a collaborative problem solving tool. With respect to
production material and components, respondents obviously preferred to use the auctions
as a collaborative tool. The mean of the item measuring using auction as a collaborative
problem solving tool was 5.18, while it was 3.90 for the item measuring the auction as a
110
power based bargaining tool. With respect to MROs and services, respondents did not
seem to have a preference on the use of online reverse auctions application. The means of
the items measuring the use of auctions as a power based bargaining tool were (4.35 and
4.2) for MROs and services while those for the items measuring the use of auctions as a
collaborative problem solving tool were (4.1 and 4.1) for MROs and services. But
respondents gave clear support (mean of 5.94) to the notion that companies use online
reverse auctions to pressure their suppliers to reduce purchase prices (an indication of the
auction’s use as a power based bargaining tool).
The data provided clear satisfaction with respect to the savings from using online
reverse auctions. The mean for the items measuring the successful event implementation
ranged between 5.70 and 5.84.
The data provided positive support for the importance of the attributes of the
relationship. The means for items which comprised the trust scale ranged from 5.34-6.26.
The means for items which comprised the commitment scale ranged from 4.49-5.14. The
means for items which comprised the interdependence scale ranged from 4.46-5.30. The
means for items which comprised the coordination scale ranged from 5.18-5.43.
The data provided positive support for the importance of the communication
behavior (information quality, participation, and sharing) in the strategic alliance. The
means for items which comprised the information quality scale ranged from 5.23-5.77.
The means for items which comprised the information participation scale ranged from
4.57-5.89. The means for items which comprised the information sharing scale ranged
from 5.07-6.03.
111
The data also provided positive support for the importance of using constructive
conflict resolution techniques and clear support for not using destructive and avoidance
conflict resolution techniques. The means for the items measuring constructive conflict
resolution techniques ranged from 4.74-6.03. The means for the items measuring
destructive conflict resolution techniques ranged from 1.54-2.23. The respondents’ were
indifferent about the use of avoidance conflict resolution techniques (mean of 4.16).
Finally, respondents appeared to be satisfied with their strategic supplier alliances. The
means of the items measuring strategic supplier alliance scale ranged from 5.51-6.25.
5.6.2 Hypotheses Tests
Eleven of the nineteen hypotheses were supported by the data. A summary of the
results of the hypotheses tests appears in Tables 5-18 and 5-19.
Various statistical procedures were used to analyze the results of the survey,
including t-test, bi-variate correlations, and multiple linear regressions. Bi-variate
correlation allows the researcher to determine the size and direction of the association
between two variables (Tabachnick and Fidell 1996). A t-test assesses the statistical
significance of the difference between two sample means for a single dependent variable
(Hair et al. 1998). Multiple linear regression assesses the relationship between one
dependent variable and the independent variables. The objective is to predict the changes
in the dependent variable in response to changes in the independent variables. More
details of the various statistical techniques that were used to analyze each hypothesis are
provided with each test.
112
Table 5-18: Summary of Hypotheses Tests Supported by the Data
H1: Using online reverse auctions, the reduction in purchase prices is more likely to be higher in the open-bid auction format than the sealed-bid format.
H3a: When purchasing production material and components, a positive, significant relationship will exist between the type of the purchase and the purpose of using online reverse auctions to reduce purchase prices.
H3b: When purchasing MROs, a positive, significant relationship will exist between the type of the purchase and the purpose of using online reverse auctions to reduce purchase prices.
H3c: When purchasing services, a positive, significant relationship will exist between the type of the purchase and the purpose of using online reverse auctions to reduce purchase prices.
H4a: When purchasing production material and components, a negative, significant relationship will exist between the use of online reverse auctions for the purpose of a short-term relationship and the purpose of developing/maintaining long-term relationships.
H4b: When purchasing MROs, a negative, significant relationship will exist between the use of online reverse auctions for the purpose of a short-term relationship and the purpose of developing/maintaining long-term relationships.
H4c: When purchasing services, a negative, significant relationship will exist between the use of online reverse auctions for the purpose of a short-term relationship and the purpose of developing/maintaining long-term relationships.
H7a: Successful strategic supplier alliances are associated with high levels of commitment, trust, coordination andinterdependence.
H7b: Successful strategic supplier alliances are associated with high levelsof (a) information sharing and (b) information quality and (c) information participation.
H7c: A positive, significant relationship will exist between the success of the strategic alliance and (a) high use of constructive conflict resolution techniques, (b) low use of conflict avoidance techniques and (c) low use of destructive resolution techniques
H9: A positive, significant relation exists between buyer-supplier strategic alliance, and the buyer perception of a successful online reverse auction event.
113
Table 5-19: Summary of Hypotheses Tests not Supported by the Data
H2: With the objective of using online reverse auctions to reduce purchase prices, buyers are more likely to prefer to organize the auction eventin-house than with the help of a market maker.
H5a: When purchasing production material and components, purchasers will be more likely to use online reverse auction for the purpose of a short-term relationship than developing/maintaining long-term relationships.
H5b: When purchasing MROs, purchasers will be more likely to use online reverse auction for the purpose of a short-term relationship than developing/maintaining long-term relationships.
H5c: When purchasing services, purchasers will be more likely to use online reverse auction for the purpose of a short-term relationship than developing/maintaining long-term relationships.
H6a: Using online reverse auctions as a collaborative problem solving tool is associated with high levels of trust, commitment, coordination and interdependence.
H6b: Using online reverse auctions as a collaborative problem solving tool is associated with high levels of buyer-supplier (a) information sharing (b) information quality and (c) information participation.
H6c: Using online reverse auctions as a collaborative problem solving tool is associated with (a) high use of constructive conflict resolution techniques, (b) low use of conflict avoidance techniques and (c) low use of destructive resolution techniques.
H8: A positive, significant relation exists between reducing purchase prices and the buyer perception of a successful online reverse auction event.
114
The Fit between Auction Design and Reduction in Purchase Price
H1 was supported by the data; the hypothesis stated that “using online reverse
auctions, the reduction in purchase prices is more likely to be higher in the open-bid
auction format than in the sealed-bid format.” For statistical analysis, the null hypothesis
stated that “using online reverse auctions, there is no difference in the reduction in
purchase prices between the open-bid auction format and the sealed-bid format,” while
the alternative hypothesis is the hypothesis stated earlier. The data rejected the null
hypothesis (P<0.05) and therefore the data claim support for the alternative hypothesis.
As illustrated in Table 5-20, a one-tailed t-test revealed significant mean
difference between the reduction in purchase prices in the open-bid auction format and
the sealed-bid format through evaluating the difference (QTEST) between the sum of Q1
proportions and the correlation between the predictors. A rule of thumb is that the
correlation between the independent variables should not exceed 0.7.
Tolerance is 1 - R2 for the regression of that independent variable on all the other
independents, ignoring the dependent. There will be as many tolerance coefficients as
there are independents. The higher the intercorrelation of the independents, the closer the
tolerance will be to zero. As a rule of thumb, if a tolerance is less than 0.20, a problem
with multicollinearity is indicated. When tolerance is close to 0, there is high
multicollinearity of that variable with other independents and the regression coefficients
will be unstable. The more the multicollinearity, the lower the tolerance, which leads to
an increase in the standard error of the regression coefficients.
129
Variance Inflation Factor, VIF is simply the reciprocal of tolerance: when VIF
is high there is high multicollinearity. VIF >= 4 is an arbitrary but common cut-off
criterion for deciding when a given independent variable displays "too much"
multicollinearity: values above 4 suggest a multicollinearity problem. Some researchers
use the more lenient cutoff of 5.0 or even 10.0 to signal when multicollinearity is a
problem. It might be necessary to drop the variable with the highest VIF if
multicollinearity is indicated and theory warrants.
Eigenvalue is a measure of the amount of variance contained in the correlation
matrix so that the sum of the Eigenvalues is equal to the number of variables. Multiple
Eigenvalues close to 0 indicate there may be a problem with multicollinearity and the
condition indices should be examined as described below.
Condition indices and variance proportions: condition indices are used to flag
excessive collinearity in the data. A condition index over 30 suggests serious collinearity
problems and an index over 15 indicates possible collinearity problems. If a factor
(component) has a high condition index, one looks in the variance proportions column.
Criteria for "sizable proportion" vary among researchers, but the most common criterion
is whether two or more variables have a variance partition of 0.50 or higher on a factor
with a high condition index. If this is the case, these variables have high linear
dependence and multicollinearity is a problem, with the effect that small data changes or
arithmetic errors may translate into very large changes or errors in the regression
analysis. It is possible for the rule of thumb for condition indices (no index over 30) to
indicate multicollinearity, even when the rules of thumb for tolerance >0.20 or VIF < 4
suggest no multicollinearity. Computationally, a "singular value" is the square root of an
130
Eigenvalue, and "condition indices" are the ratio of the largest singular values to each
other singular value. Table 5-31 provides a summary of the visual and statistical tools
used to test the regression model assumptions.
Table 5-31: Tests to Validate Regression Assumptions
Regression Assumption Testing Tool Comments (No problems)
Outliers Plot of residuals against fitted valuesCook’s Distance Below 1.0Leverage statistic Below 0.2Standard score value Below ±3.0
Normality of the Residuals
Histogram of the residuals
Normal probability plotsKolmogorov-Smimov normality test
Independence of the error term
A plot of residuals versus order
Pearson correlation between the predictor(s) and the residuals
Should have no correlation
Multicollinearity Tolerance Greater than 0.2Variance Inflation Factor (VIF) Less than 4.0Eigenvalue Greater than 0.1Condition Index Less than 30Variance proportions Less than 0.5 for factors that
has high condition indexCorrelation between IVs Below 0.7
Linearity Plot residuals against predictor variables
Model will display a cloud of dots, whereas lack of linearity will be characterized by a pattern
Homoscedasticity Plot of residuals against fitted values Plot of absolute residuals against fitted values
Homoscedastic model will display a cloud of dots, whereas lack of homoscedasticity will be characterized by a pattern
Absolute residuals against each of the predictor variables
If nonconstancy is detected
Statistical test like White’s test, Barlett’s test or Levene’s test
If nonconstancy is detected
131
Hypothesis 7a is used to illustrate the detailed investigation of the assumption of
the regression model. Hypothesis 7a stated that “successful strategic supplier alliances are
associated with high levels of commitment, trust, coordination, and interdependence.”
There are four independent variables (trust, commitment, interdependence and
coordination) and one dependent variable (supplier strategic alliance). The outliers’
analysis revealed two data points with a standard score beyond ±3, as shown in Figure 5-
7 and Table 5-32.
7.006.506.005.505.004.50
Unstandardized Predicted Value
2.00
1.00
0.00
-1.00
-2.00
Un
stan
dar
diz
ed R
esid
ual
130
61
Figure 5-7: Plot of Residuals against Predicted Values for H7a
Table 5-32: H7a Outliers
Case Number Std. Residual SSA Predicted Value Residual
Further analysis of H9, through grouping the survey responses based on the
criteria listed in Table 5-21, supported the hypothesis for every group. As shown in
Appendix G.29, regardless of the sales volume, purchasing volume, number of
employees, number of purchasing employees, and job title, all groups supported the
hypothesis that “a positive, significant relation exists between buyer-supplier strategic
alliance and the buyer’s perception of a successful online reverse auction event”. Also,
filtering the data based on the number of auctions completed within the last 3 years
supported the hypothesis for the two groups shown in Table 5-43.
Table 5-43: Test of H9 Based on Auction Experience
Successful Online Reverse Auction EventLess than 15 auctions in
the last 3 yearsMore than 15 auctions in
the last 3 yearsReduction in Purchase Prices
Pearson Correlation
0.428** 0.396**
Sig. (2-tailed) 0.002 0.010N 51 41
** Correlation is significant at the 0.01 level
155
CHAPTER 6: SUMMARY, CONCLUSIONS & FUTURE
RESEARCH
6.1 Introduction
Previous chapters have addressed the relevance of the research problem, the focus
of this research study, the supporting literature, the conceptual model, the research design
methodology, and the data analysis.
This chapter summarizes the research outcomes of this study. The chapter
contains a discussion based on the data supplied by 145 respondents. In Section 6.2, the
chapter summarizes the research conclusions and managerial implications based on the
test results of nineteen hypotheses presented in Chapter Three. The findings of the
research are divided into six general groups, and conclusions related to each group are
presented.
Section 6.3 summarizes the hypotheses and their test results. The objective of this
section is to interpret the data, explain how the data related to the hypothesized model,
explain how the findings relate to previous research and/or provide suggestions for
application of the research findings in practice. Finally, in Section 6.4, the chapter
concludes with the limitations of the study and addresses guideline for future research.
156
6.2 Research Conclusions
The goal of this research is to address the gap in the academic literature by
developing and testing a model to successfully implement online reverse auctions with
respect to (1) reducing purchase prices, and (2) developing/maintaining buyer-supplier
strategic alliance relationships in the business-to-business online reverse auction
environment.
The managerial implications to be drawn from this research relate to the manner
in which the buyers (1) design auctions to reduction purchase prices, (2) use online
reverse auctions for the short-term and/or the long term according to the purchase type,
(3) define successful online reverse auction events, and (4) attempt to manage the future
scope and tone of their buyer-supplier relationships.
The research study goals were systematically addressed and successfully achieved
through the testing of nineteen hypotheses, defined in Chapter Three, and the
accomplishment of the six research objectives, defined in Chapter One, through
analyzing the responses of 145 companies. Table 6.1 summarizes the results of the
hypotheses tests.
A model to successfully implement business-to-business online reverse auctions
(from the buyer’s perspective) can be divided into two parts: strategic and operational.
From the strategic dimension, a successful model focuses on the importance of the
strategic buyer-supplier alliance more than the promised reduction in purchase prices.
Companies should use online reverse auctions as a procurement negotiation tool within
their effort to develop/maintain the strategic alliance.
157
Hypothesis Data Support
H1: Using online reverse auctions, the reduction in purchase prices is more likely to be higher in the open-bid auction format than the sealed-bid format.
Yes
H2: With the objective of using online reverse auctions to reduce purchase prices, buyers are more likely to prefer to organize the auction event in-house than with the help of a market maker.
No
H3a-c: When purchasing X, a positive, significant relationship will exist between the type of the purchase and the purpose of using online reverse auctions to reduce purchase prices (X can be production material and components, MROs, or services).
Yes
H4a-c: When purchasing X, a negative, significant relationship will exist between the use of online reverse auctions for the purpose of a short-term relationship and the purpose of developing/maintaining long-term relationships (X can be production material and components, MROs, or services).
Yes
H5a-c: When purchasing X, purchasers will be more likely to use online reverse auction for the purpose of a short-term relationship than developing/maintaining long-term relationships (X can be production material and components, MRO, or services).
No
H6a: Using online reverse auctions as a collaborative problem solving tool is associated with high levels of trust, commitment, coordination and interdependence.
No
H6b: Using online reverse auctions as a collaborative problem solving tool is associated with high levels of buyer-supplier (a) information sharing (b) information quality and (c) information participation.
No
H6c: Using online reverse auctions as a collaborative problem solving tool is associated with (a) high use of constructive conflict resolution techniques, (b) low use of conflict avoidance techniques and (c) low use of destructive resolution techniques.
No
H7a: Successful strategic supplier alliances are associated with high levels of commitment, trust, coordination and interdependence.
Yes
H7b: Successful strategic supplier alliances are associated with high levels of (a) information sharing and (b) information quality and (c) information participation.
Yes
H7c: A positive, significant relationship will exist between the success of the strategic alliance and (a) high use of constructive conflict resolution techniques, (b) low use of conflict avoidance techniques and (c) low use of destructive resolution techniques
Yes
H8: A positive, significant relationship exists between reducing purchase prices and the buyer perception of a successful online reverse auction event.
No
H9: A positive, significant relationship exists between buyer-supplier strategic alliance, and the buyer perception of a successful online reverse auction event.
Yes
Table 6-1: Hypothesis Testing Results
Firms who have established long-term relationships with key suppliers are still
required to check on market prices from time to time, or to invite new or alternative
sources of supply to bid. The model to be a successful buyer in implementing online
reverse auctions uses reverse auctions as the mechanism for such activity because of their
158
ability to reduce time, cost, and resources. From this perspective, the model states that the
buyer should use online reverse auctions as a process improvement tool.
A model of successful implementation of online reverse auctions emphasizes the
importance that the buyer company should not lose sight of the importance of trust,
coordination, commitment, information participation, information quality, information
sharing, and joint problem solving to achieve a win-win buyer-supplier strategic alliance.
Buyers should not let the use of online reverse auctions drive the buyer-supplier
partnership, but reverse auctions should be used as a tool to improve the negotiation
process.
With respect to the model’s operational details of successful online reverse
auctions, buyers should use an open-bid format rather than sealed-bid format to achieve a
higher reduction in purchase prices. Also, buyers should organize online reverse auctions
with the help of an online reverse auction service provider. The reduction in purchase
prices is likely to be higher when organizing auctions with the help of a market maker
than when organizing the event in-house because of the market maker’s expertise in
conducting thousands of auctions.
Online reverse auctions will help reduce purchase prices regardless of the
purchase type (production material and components, MROs, or services). An average of
14.4% is the reduction in purchase prices when using online reverse auctions to outsource
products, as reported by the survey respondents. With respect to the model’s operational
details of successful online reverse auctions, buyers should focus on the long-term
objective when outsourcing production material and components.
159
The model (research findings) has led the researcher to believe that the way
companies are using online reverse auctions is changing. Published research in the early
use of online reverse auctions reported the abuses and the negative effects of reverse
auctions on the buyer-supplier relationships. With maturity and experience in the use of
online reverse auctions, and buyers’ realization of the importance of their supplier
strategic alliances, buyers have changed the way they are implementing and viewing
online reverse auctions.
Finally, the model to successfully implement online reverse auctions (based on
survey respondents) emphasizes the need for companies to understand the use of
business-to-business online reverse auctions as a process improvement tool in their
negotiation process (price audit) with the suppliers within the effort to develop/maintain
the buyer-supplier alliance.
6.3 Summary of the Research Study
The increasing pressure on companies to reduce the expense of products and
services has caused the procurement organizations to seek out and experiment with new
electronic procurement tools. Procurement professionals’ desire to reduce the total cost of
their companies’ purchases has led them to use online reverse auctions without fully
understanding the effect on their buyer-supplier relationships and without fully
understanding whether online reverse auctions have helped other companies reduce
purchase prices and if so, what is the reduction percentage of the overall price.
This section summarizes the hypotheses and their test results. The objective of
this section is to interpret the data, explain how the data relate to the hypothesized model,
160
explain how the findings relate to previous research and/or provide suggestion for
application of the research findings in practice.
Auction Design-Format
The data provided support for the hypothesized relationship between reduction in
purchase price and the open-bid auction format. While there are several different bidding
formats of online reverse auctions, the research focused on the use of one-sided multi-
round open and sealed-bid auctions. Respondents were asked to evaluate and compare the
reduction in purchase prices between the open-bid format and the sealed-bid format. The
buying companies (respondents) clearly supported the open-bid format. This finding is
similar to Jap (2002); the fast-paced bidding nature of the open-bid format and the need
to respond quickly to competitors’ bids yields tense and pressure on suppliers to cut
prices vigorously and thus force additional price concessions from the suppliers, and that
in turn will result in higher price reductions for the buyers.
The data also provided support for the hypothesized relationship between
reduction in purchase price and the open-bid auction format for all companies regardless
of the sales volume, purchasing volume, or number of employees. The hypothesis was
also supported by all different management levels.
Auction Design-Event Organization
The data did not provide support for the hypothesized relationship between
reduction in purchase price and the buyers’ preference to organize the auction event in-
house rather than with the help of a market maker. On the contrary, the data clearly
supported the opposite hypothesis: “with the objective of using online reverse auctions to
161
reduce purchase prices, buyers are more likely to prefer to organize the auction event
with the help of a market maker than in-house.”
The hypothesis was initially constructed based on the logic that the target sample
for this research was companies who have used online reverse auctions frequently, and
these companies have the required technology infrastructure to support and organize
online reverse auctions; therefore, it was expected that these buyers would prefer to
organize online reverse auctions in-house in order to avoid the cost associated with the
fees of the online reverse auction service provider. But because the survey respondents
reported a median of only fifteen auctions completed by their company in the last 3 years,
the online reverse auction experience of the companies participating in the survey was
below expectations. Therefore, the assumption that the target sample of the research was
companies who have used online reverse auctions frequently was no longer valid.
Because the survey responding companies are not using online reverse auctions, as
frequently as initially thought, it makes perfect sense that these companies would prefer
to use online reverse auction service providers like Tradingpartners rather than
organizing the events in-house.
Another possibility is that buyers did not want to get involved in the online
reverse auction business since auctions are outside their core competencies. The finding
also implies that the companies appreciate the value that the market makers bring to the
auction event organization process. Through the market maker’s experiences in
conducting thousands of auctions, market makers are more efficient than buyers in
organizing the event, locating new suppliers, providing the technological expertise, and
creating comprehensive RFQ packages. Online reverse auction providers usually are
162
better in structuring the RFQ than what the buyer historically produced, which results in a
more complete description of the procurement under consideration. Sellers thus gain a
better understanding of the buyer’s total requirements with regard to cost, delivery, and
quality.
The data also provided support for the hypothesized relationship between
reduction in purchase price and the event organization by a market maker for all
companies regardless of the sales volume, purchasing volume, or number of employees.
The hypothesis was also supported by all different management levels. While the data
was analyzed based on categorizing the respondents into three levels within the
purchasing organization (senior management, middle management, and buyers), all
different categories supported the alternative hypothesis that “with the objective of using
online reverse auctions to reduce purchase prices, buyers are more likely to prefer to
organize the auction event with the help of a market maker than in-house.”
Reduction in Purchase Price
The data provided support for the hypothesized positive relationship between the
type of purchase (production items and components, MROs, and services) and the
purpose of using online reverse auctions to reduce purchase prices. Companies reported
that online reverse auctions helped in reducing the purchase prices by an average of
12.9% when purchasing production material and components, 16.9% when purchasing
MROs, and 13.5% when purchasing services.
The data also provided support for the hypothesized relationship between
reduction in purchase prices and the type of the purchase (production items and
163
components, MROs, and services) for all companies regardless of the sales volume,
purchasing volume or number of employees. The hypothesis was also supported by all
different management levels. The data were analyzed based on the position (job title) of
the respondent and all the different categories supported the hypothesis.
The findings agree with the majority of the articles published in the business press
that online reverse auctions will lead to reduction in purchase prices. This finding is
similar to the conclusion of previous research that senior managers of many Fortune 2000
companies continue to believe in the efficiency of online reverse auctions to reduce
purchase prices (e.g. Judge 2001; Grant 2003; Emiliani and Stec 2005). The findings are
also similar to Pearcy (2002), who stated that companies will be more likely to reduce the
purchase prices of direct material and MRO supplies through the use of online reverse
auctions.
Auction Application
The data suggest that the type of purchase (production materials and components,
MROs, or services) is an important factor when deciding the manner is which the reverse
auction will be used for short-term or long-term objectives.
Production material and components
The data supported the hypothesized model that “when purchasing production
material and components, a negative significant relationship will exist between the
purpose of short-term relationships and the purpose of developing/maintaining long-term
relationships.” At the same time, the data failed to support the hypothesized relationship
that “when purchasing production material and components, purchasers will be more
164
likely to use online reverse auctions for the purpose of short-term relationships rather
than developing/maintaining long-term relationships.”
But the data supported the opposite hypothesis of the model: “when purchasing
production material and components, purchasers will be more likely to use online reverse
auctions for the purpose of developing/maintaining long-term relationships rather than
short-term relationships.”
Further analysis of the data showed that larger companies (sales volume greater
than one billion dollars, purchasing volume greater than $500 million, total number of
employees greater than 1000, and more than 20 purchasing employees) support the
model’s opposite hypothesis at a 95% confidence interval and all the smaller companies
categories supported that hypothesis at the 95% confidence interval except companies
with less than 1000 employees supported the model’s opposite hypothesis at 90%
confidence interval. Grouping the data also showed that all different levels of employees
within the purchasing organization (buyers, managers, and directors) advocate the
importance of using online reverse auctions to outsource production material and
components for the purpose of developing/maintaining long-term relationships rather
than short-term relationships.
This finding that companies are using online reverse auctions to outsource production
material and components for the purpose of developing/maintaining long-term
relationships is unexpected and counter to the hypothesized model. One possibility for
explaining this finding is that companies believe the purchasing price of production
material and components is not the only determinant factor in outsourcing these items.
165
Other factors (such as quality, on-time delivery, and reliability) are more important and
achieving the acceptable desired level requires time. Taking that into consideration,
buyers view online reverse auctions as any other procurement negotiation tool to identify
and negotiate with the supplier for the purpose of purchasing/outsourcing to this supplier
for a long time and not a one-time shot.
Another possibility is based on the nature of production items and components.
Such products require a high level of collaboration and coordination between the buyer
and the supplier in terms of engineering design, quality, replenishment, and delivery and
this is usually a time consuming process (usually years). Therefore, switching suppliers
frequently is not an option.
This finding is counter to previous research conclusions (e.g. Emiliani and Stec
2004; Jap 2002; Pearcy et al. 2002). Pearcy et al. (2002) stated that buying companies
will be more likely to use online reverse auctions to buy direct material and MRO
supplies for short-term contracts. On the other hand, Emiliani and Stec (2004) questioned
the effectiveness of using online reverse auction as a tool to outsource components for the
short-term and the long-term.
Maintenance materials and supplies (MROs)
The data supported the hypothesized model that “when purchasing MROs, a
negative significant relationship will exist between the purpose of short-term
relationships and the purpose of developing/maintaining long-term relationships.” At the
same time, the data failed to support the hypothesized relationship that “when purchasing
166
MROs, purchasers will be more likely to use online reverse auctions for the purpose of
short-term relationships rather than developing/maintaining long-term relationships.”
Further analysis of the data showed that smaller size companies (sales volume less
than one billion, purchasing volume less than $500 million, total number of employees
less than 1000, and/or less than 20 purchasing employees) support the model hypothesis.
Respondents’ who reported to work for smaller size companies appear to subscribe to the
premise that online reverse auctions are used to outsource MROs for the purpose of short-
term relationships rather than developing/maintaining long-term relationships. This
finding is similar to Pearcy (2002), who stated that buying companies will be more likely
to use online reverse auctions to buy MRO supplies for short-term contracts.
Respondents who reported to work for larger size companies (sales volume greater than
1000, purchasing volume greater than $500 million, total number of employees greater
than 1000, and more than 20 purchasing employees) reported no difference in using
online reverse auctions for the short-term or long-term objective when buying MRO
supplies. When grouping the data based on the employment level within the purchasing
organization (buyers, middle management, and upper senior management), respondents
reported no difference in using online reverse auctions for the short-term or long-term
objective when buying MRO supplies.
The finding that a negative relationship exists between the purpose of short-term
relationship and the purpose of developing/maintaining long-term relationship was
expected and according to the hypothesized model. The finding that the data failed to
completely support the hypothesized relationship, “when purchasing MROs, purchasers
167
will be more likely to use online reverse auctions for the purpose of short-term
relationships rather than developing/maintaining long-term relationships,” is unexpected
and counters to the hypothesized model. The hypothesis was supported for smaller size
companies but larger size companies reported no difference in using online reverse
auctions for the short-term or long-term objective when buying MRO items.
One possible explanation is that larger size companies have more experience in
using online reverse auctions (median of 20 auctions in the last 3 years) while smaller
size companies have less experience (median of 6 auctions in the last 3 years). When a
smaller size company organizes an auction to outsource MROs, a hit-and-run scenario is
the motive behind using online reverse auctions. Smaller size companies, due to their
lack of experience in using online reverse auctions, believe reducing purchase prices in
the short-term can be achieved through the use of online reverse auctions to switch
suppliers or force their current suppliers to reduce their prices. On the other hand, larger
size companies use online reverse auctions as a procurement negotiation tool or as an
audit tool of their current supplier to assure competitive purchasing prices. In either
scenario, larger size companies assume that online reverse auctions will help reduce
purchase prices regardless of the short-term or long-term objectives.
Services
With respect to the services product category, the data supported the hypothesized
model that when purchasing services, a negative significant relationship will exist
between the purpose of short-term relationships and the purpose of
developing/maintaining long-term relationships. At the same time, the data failed to
168
support the hypothesized relationship that “when purchasing services, purchasers will be
more likely to use online reverse auctions for the purpose of short-term relationships
rather than developing/maintaining long-term relationships.”
Further analysis of the data showed that smaller size companies (sales volume less
than one billion, purchasing volume less than $500 million, total number of employees
less than 1000, and/or less than 20 purchasing employees) support the model hypothesis.
Respondents’ who reported to work for smaller size companies appear to subscribe to the
premise that online reverse auctions are used to outsource services for the purpose of
short-term relationships rather than developing/maintaining long-term relationships.
Comparison of this finding to previous research is not possible due to the lack of the
research in the area of the outsourcing services using online reverse auctions.
Respondents who reported working for larger size companies (sales volume
greater than 1000, purchasing volume greater than $500 million, total number of
employees greater than 1000, and more than 20 purchasing employees) reported no
difference in using online reverse auctions for the short-term or long-term objective when
buying services. When grouping the data based on the employment level within the
purchasing organization (buyers, middle management, and upper senior management),
respondents reported no difference in using online reverse auctions for the short-term or
long-term objective when buying services.
The finding that a negative relationship exists between the purpose of short-term
relationship and the purpose of developing/maintaining long-term relationship was
expected and according to the hypothesized model. The finding that the data failed to
169
support the hypothesized relationship, “when purchasing services, purchasers will be
more likely to use online reverse auctions for the purpose of short-term relationships
rather than for developing/maintaining long-term relationships”, is unexpected and
counter to the hypothesized model. The hypothesis was supported for smaller size
companies but larger size companies reported no difference in using auctions for the
short-term or long-term objective when buying services.
The same explanation that was used for MROs also applies for services. Due to
the experience in using auctions, the objective and the expected outcome between
different sizes of companies vary. Smaller size companies use online reverse auctions to
reduce purchase prices on the short-term and assume to use reverse auctions to outsource
the service(s) whenever required. Simply, smaller size companies use online reverse
auctions due to their ability to provide immediate cost savings in the short-term. On the
other hand, larger size organizations use auctions to either audit their current suppliers to
assure competitive prices or as a negotiation tool that will help reduce purchase prices
regardless of the short-term or long-term objectives. Larger size companies believe that
online reverse auctions will yield immediate savings in the short-term and/or can be used
as a screening device for long-term relationships.
Successful Strategic Supplier Alliances
For more than two decades, the formation of partnerships became an increasingly
common way for companies to find and maintain a competitive advantage. The following
summarizes the results of testing the hypotheses related to the success of the buyer-
170
supplier strategic alliances from the following three dimensions (discussed earlier in
Chapter Three):
Attribute of the Relationship
The data provided support for the hypothesized positive relationship between
successful strategic supplier alliances and the attribute of the relationship (commitment,
trust, and coordination were significant while interdependence was insignificant).
Further analyses of the hypothesized relationship between successful strategic
supplier alliances and attributes of the relationship (commitment, trust, coordination, and
interdependence) were conducted by filtering the data according to the number of online
reverse auctions the respondent’s company completed in the last 3 years. The data was
initially clustered into two groups: companies without any online reverse auction
experience as a buyer and companies with experience in using online reverse auctions to
purchase products and/or services. The two groups had similar results where trust,
commitment, and coordination emerged as significant predictors of the success of the
supplier strategic alliance, while interdependence was insignificant.
For further analysis, the survey responses were clustered into three groups:
companies with no auction experience, companies with experience of no more than 15
auctions in the last 3 years, and companies who completed more than 15 auctions in the
last 3 years. Companies that had completed no more than 15 auctions in the last 3 years
reported that successful strategic supplier alliances are associated with high levels of
commitment and coordination while trust and interdependence were insignificant. On the
other hand, companies that had completed more than 15 auctions in the last 3 years
171
reported that successful strategic supplier alliances are associated with high levels of trust
and commitment, while coordination and interdependence were insignificant.
Interestingly, interdependence was insignificant across the three groups. But
further examination of the other three predictor variables (trust, commitment, and
coordination) across the maturity of companies’ experiences in using reverse auctions,
revealed that the value of the commitment predictor increases with auction experience
while the value of the coordination variable decreases until it becomes insignificant.
An examination of Table 5-37 shows that commitment emerged as a significant
predictor of the success of the supplier strategic alliance for all three groups.
Commitment had the lowest significance value with respect to the other predictors for
companies with no auction experience, but the value of commitment kept increasing with
the auction experience until it became the most significant predictor of the success of the
supplier strategic alliance.
On the other hand, coordination emerged as a significant predictor of the success
of the supplier strategic alliance for all the three groups. Coordination was the most
significant predictor variable, with its value decreasing until it became insignificant for
companies with experience of more than 15 auctions.
Trust emerged as a significant predictor of the success of the supplier strategic
alliance for 2 of the 3 groups: companies with no auction experience and companies that
had completed more than 15 auctions in the last 3 years.
One possible explanation of the behavior of trust, commitment, and coordination
as predictor variables of the success of the supplier strategic alliance is that companies
172
are using online reverse auctions as an audit tool for their current suppliers and/or a
procurement negotiation tool. When companies start to use auctions, the buyer and the
suppliers are in a learning process. Commitment and coordination are the significant
predictors of the success of the strategic alliance while trust is insignificant due to its
nonexistence.
In the initial experiences of using online reverse auctions, the buyers do not
believe they are getting a fair deal from their suppliers (might be the buyers’ main reason
for using online reverse auctions). The buyer is still committed to buying from the current
supplier (commitment is a significant predictor with a moderate weight) if provided with
good prices, but coordination is the significant predictor of the success of the supplier
strategic alliance (coordination has more weight than commitment).
Trust has been established with the buyer’s current suppliers as a significant
predictor of their relationship, but when the buyer companies start to use reverse auctions
it might be due to a lack of trust that their suppliers are giving them fair/good deals. With
time and experience in using online reverse auctions, the trust in the relationship between
the buyer and the supplier increases to be one of the most important predictors of the
success of the relationship. Buyers, due to the continuous participation of their strategic
suppliers in the online reverse auctions, trust that (a) the strategic supplier alliances are
beneficial to their business; (b) they are getting an equitable deal from their suppliers in
these alliances; and (c) the strategic supplier alliance/partnership is marked by a high
degree of harmony.
173
Commitment has a moderate weight in the strategic alliance for companies with
no auction experience. While gaining more experience in using online reverse auctions,
the buyers become more committed to buying from their current suppliers and online
reverse auctions become similar to any other price negotiation tool/methodology.
On the other hand, coordination has a moderate weight in the strategic alliance for
companies with no auction experience. While gaining more experience in using online
reverse auctions, coordinating activities with the supplier does not become a significant
element in determining the success of the alliance while the trust and commitment are the
most important elements. The experience in organizing auctions helped the buyers in
coordinating their activities with their suppliers.
The general findings of this hypothesis, before filtering the data based on auction
experience, are consistent with those of Monczka et al. (1998) and Mohr and Spekman
(1994) with some minor exceptions. Monczka et al. (1998) defined trust and coordination
as one single predictor while this study and the study by Mohr and Spekman (1994)
defined trust and coordination as two separate predictors.
Commitment emerged as a significant predictor of the success of the strategic
supplier alliances for this study and for the study by Mohr and Spekman (1994) but had
little effect on industrial purchasing alliance success according to the study by Monczka
et al. (1998).
Interdependence emerged as an insignificant predictor of the success of strategic
supplier alliances in this study and the market channel relationships study by Mohr and
Spekman (1994). Interdependence emerged as a significant predictor in the Monczka et
174
al. (1998) study but not as a critical antecedent due to the small β value of 0.107, while
trust and coordination β value was 0.751.
Communication Behavior
The data provided support for the hypothesized positive relationship between
successful strategic supplier alliances and high levels of information sharing, information
quality, and information participation.
Further analyses of the hypothesized relationship between successful strategic
supplier alliances and communication behavior (information sharing, information quality,
and information participation) were conducted by filtering the data according to the
number of online reverse auctions the responding company had completed in the last 3
years. The data was initially clustered into two groups: companies without any online
reverse auction experience (as buyers) and companies with experience in using online
reverse auctions to purchase products and/or services.
The two groups had similar results with one exception. Information sharing,
information quality, and information participation emerged as positive significant
predictors of the success of the supplier strategic alliance for companies with auction
experience. Companies without any experience in using online reverse auctions to
outsource products and/or services revealed information sharing and information quality
as positive significant predictors of the success of the supplier strategic alliance while
information participation was insignificant (an explanation is discussed later).
For further analysis, the data was clustered into three groups (see Table 5-38):
companies with no auction experience, companies with experience of no more than 15
175
auctions in the last 3 years, and companies who had completed more than 15 auctions in
the last 3 years. Companies that had completed no more than 15 auctions in the last three
years reported that successful strategic supplier alliances were associated with high levels
of information sharing, information quality and information participation. On the other
hand, companies that had completed more than 15 auctions in the last 3 years reported
that successful strategic supplier alliances were associated with high levels of information
sharing and information participation, while information quality was insignificant.
The insignificance of the predictor “information quality” is difficult to explain.
One possibility is that, with the maturity in using online reverse auctions, companies are
assuring the quality of the communication with the suppliers (timely, accurate, adequate,
complete, and credible) through the auction process. Companies that have wide
experience in using online reverse auctions, are using auctions as any other purchasing
negotiation tool/methodology. Through the auction process and with the help of the
market maker, who is usually better than the buyers in organizing RFQs, the buyer’s
communication with the supplier is assured to be timely, accurate, adequate, complete,
and credible. Therefore, information quality can be an insignificant predictor of the
success of the strategic supplier alliance.
On the other hand, information participation (seeking advice and counsel from
suppliers, having the supplier participate in the buyer’s planning activities, having the
buyer participate in the supplier’s planning activities, and soliciting improvement
suggestions from the suppliers) started as an insignificant predictor of the supplier
strategic alliance. With time and experience in using online reverse auctions, the
176
information participation between the buyer and the suppliers becomes the most
significant predictor of success.
The results of this research study, without filtering the data according to the
auction experience, are consistent with those of Monczka et al. (1998) and Mohr and
Spekman (1994), with some minor exceptions. Monczka et al. (1998) defined information
quality and participation as one single predictor while this research study and the study
by Mohr and Spekman (1994) defined Information quality and information participation
as two separate predictors. Information sharing was negatively related to the success of
the strategic supplier alliances according to the Mohr and Spekman study (although
predicted to be positively related). This research study and the study by Monczka et al.
(1998) found that information sharing was positively related to the success of the
strategic supplier alliance.
Conflict Resolution
The data provided support for the hypothesized positive relationship between
successful strategic supplier alliances and (a) high use of constructive conflict resolution
techniques, (b) low use of conflict avoidance techniques, and (c) low use of destructive
resolution techniques.
Further analyses of the hypothesized relationship between successful strategic
supplier and conflict resolution were done in two steps as in the previous two sections.
Companies with online reverse auction experience revealed positive significant
relationships between successful strategic supplier alliances and (a) high use of
constructive conflict resolution techniques, (b) low use of conflict avoidance techniques,
177
and (c) low use of destructive resolution techniques. The research study was unable to
give any conclusions for companies with no auction experience due to the low proportion
of variation in the dependent variable (success of strategic supplier alliance) explained by
the regression model (R2=0.06).
Companies with experience of no more than 15 auctions in the last 3 years had
reported avoidance resolution techniques to be insignificant. Companies with experience
of more than 15 auctions in the last 3 years have reported constructive conflict resolution
techniques to be insignificant. The research failed to provide any logical explanation for
these results.
The results of this research study, without filtering the data according to reverse
auction experience, are consistent with those of Monczka et al. (1998) and Mohr and
Spekman (1994) with some minor exceptions. The study by Monczka et al. (1998) found
a negative relationship between one of the two items measuring constructive conflict
resolution techniques and successful strategic supplier alliances (although hypothesized
to be positive). The study by Monczka et al. (1998) also reported the use of conflict
avoidance techniques to be insignificant. The study by Mohr and Spekman (1994)
reported a positive relationship between one of the two items measuring destructive
conflict resolution techniques and successful strategic supplier alliances (although
hypothesized to be negative).
Successful Online Reverse Auction Event
The research evaluated the success of online reverse auction events from two
perspectives: ability to reduce purchase prices and the success of the strategic buyer-
178
supplier alliance. Two hypotheses were developed that linked the reduction in purchase
prices and the success of the supplier alliance to the perceived success of the online
reverse auction event.
Interestingly, no significant relationship was found between reduction in purchase
prices and the buyer’s perception of a successful online reverse auction event. On the
other hand, the data strongly supported the hypothesized positive relationship between
the success of supplier strategic alliances and the buyer’s perception of successful online
reverse auction events. This finding emphasizes the buying companies’ appreciation of
the importance of the value of the strategic supplier alliance success. This finding is
encouraging, considering the emphasis that has been (and should be) placed on the
importance of cooperative strategic alliances with the suppliers to achieve prosperity for
all the supply chain members.
The relationship between the success of an auction event and the reduction in
purchase price was not significant for any group of data even after grouping the data
based on the annual purchasing volume, number of employees, number of purchasing
employees, and/or respondent’s job position. Similar results were obtained when
clustering the data based on the number of auctions the respondents had completed in the
last three years. On the other hand, the relationship between the success of an auction
event and the success of the strategic alliance was significant for all the different groups.
The insignificant relationship between reduction in purchase prices and the
buyer’s perception of a successful online reverse auction event could be simply explained
by the companies’ belief that the importance of the successful strategic alliances
179
overshadows the importance of a short-term reduction in purchase prices. One possibility
is that companies use auctions as audit tools for their current suppliers to assure the best
prices and/or as a procurement negotiation tool with the intention to work collaboratively
with the suppliers to establish and/or develop the relationship. Under this possibility,
buyers know that with time and cooperation, reduction in purchase prices will be achieve
sooner or later.
The finding of no significant relationship between reduction in purchase prices
and the buyer’s perception of a successful online reverse auction event is unexpected and
counter to the hypothesized model. The hypothesized relationship was based on previous
research which reported a strong positive relationship between successful implementation
and the reduction in purchase price (e.g. Carter et al. 2004; Hartley et al. 2004; Wagner
and Schwab 2004), especially the fact that many researchers reported that organizations
adopt online reverse auctions to lower purchase prices and reduce transaction costs
(Brunelli 2000; Hong and Hartley 2001; Moser 2002; and Ruzarika 2000).
One possibility for the contradiction between this research study and the previous
research is the age of online reverse auctions. Freemarkets was the first online reverse
auction service provider that introduced online reverse auctions less than a decade ago,
and most other companies started introducing and using reverse auctions less than five
years ago. It is possible that companies started to use reverse auctions with the sole
purpose of reducing purchase prices, and that explains the findings of the previous
research that was based on surveys and case studies in the early use of online reverse
auctions (years 2000-2002).
180
With maturity and experience in the use of online reverse auctions, and buyers’
realization of the importance of their supplier strategic alliances, buyers changed the way
they are implementing and viewing online reverse auctions. From the buyers’ experiences
in using online reverse auctions, they figured out that the importance of the strategic
alliances overshadows the expected quick reduction in purchase prices that will be
achieved eventually.
The finding of the positive significant relationship between perceived successful
implementation of an online reverse auction event and the success of strategic buyer-
supplier alliances was expected and agrees with previous research, which emphasized
that destroying buyer-supplier relationships was the main disadvantage of online reverse
auctions (Emiliani and Stec 2002; Jap 2002). The finding also agrees with previous
researchers (e.g. Hartley et al. 2004; Smart and Harrision 2003) who saw an opportunity
in using online reverse auctions to enhance the strategic alliance and pursue a
collaborative strategy as a way to reduce costs.
6.4 Limitations of the Study and Future Research Guidelines
The research has extended previous research in the area of online reverse auctions
in several ways, by building on past theoretical and empirical research. This research
study also opens a window for further research in this new emerging area. Each of the
limitations of this study is an opening to an area of new research for future studies.
Therefore, in this section, the researcher discusses some of the limitations of this research
and recommendations for future research. The research was limited by:
181
(1) The type of companies surveyed: This research study focused mainly on
manufacturing companies, with less than 25% of the respondents representing
companies from retail and services companies.
(2) The size of the companies surveyed and the sample size: Due to the small sample
size it was only viable to cluster the responses into two groups that represented
smaller size companies and larger size companies. With a bigger sample size, the
researcher recommends clustering the data into three groups and adding another
group called medium-sized companies.
(3) The type of purchases made by the respondents companies: This study has
classified purchased items into three categories. Other purchase types like capital
equipment and resale items were not considered.
(4) The online reverse auction design elements: This study has only looked at the
effects of two auction design elements (event organization and bidding format)
on the reduction in purchase prices. Other possible online reverse auction design
criteria include the opening price, bid decrement, closing rule (soft versus hard),
and reserve price policy (with or without).
(5) The way buyers view online reverse auctions: The researcher assumed that online
reverse auctions are used as a power-based bargaining tool or as a collaborative
problem solving tool. The research revealed that the relationship between the
auction application and the predictors of the success of the strategic alliances was
insignificant. One future research possibility is investigating how companies
182
view auction applications when considering the online reverse auction effect on
the predictors of the success of the strategic alliances.
(6) The geographic location: This research study focused on companies within the
United States only. Other possibilities are to extend the research concept,
methodology, and survey tool to companies in Western Europe and Japan.
(7) The buyer perspective: This research study has surveyed companies from the
buyer’s perspective only. An interesting possibility is to survey these companies
from the suppliers’ perspective.
(8) The elements of a successful online reverse auction event. This research study
has defined a successful reverse auction event in terms of reduction in purchase
price and supplier partnership. An interesting research possibility is to consider
other criteria like service, quality, and delivery time.
(9) The filtering (grouping) criteria: For hypotheses 1-5 and 8-9, the data was
clustered based on the annual sales volume, the annual purchasing volume,
number of purchasing employees, total number of employees, and respondents’
position. Similarly, for hypotheses 6-9 the data were grouped based on the
auction experience. Further analysis can be done by grouping H1-H5 based on
the auction experience, H6-H9 based on the company size, and/or H1-H9 based
on the SIC codes in two categories (manufacturing companies versus retail and
service companies).
Klemperer (1999) concluded his guide to auction theory literature by stating that
“auction theory has been among the most successful branches of economics in recent
183
years. The theory has developed rapidly, and is increasingly being looked at for
assistance in practical applications. Testing auction-theoretic models is seen as one of the
brightest spots in applied economics.” The following are some other suggestions for
future online reverse auction related research studies. It should be noted that several of
these suggestions are a continuation of this research study:
1. A research study to determine why respondents prefer to organize online reverse
auctions with the help of a market maker. An important question is whether, when
a company is using auctions as a tool to reduce prices, should the company not
also eliminate the fees of the market maker by organizing the reverse auction in-
house? The real question is how market makers are adding value to the auction
process.
2. A research study that tailors this study toward a specific industry like the
petroleum industry.
3. A research study that compares the auction theory literature to the behavior and
economics of online reverse auctions.
4. A research study on investigating when buyers are willing to switch suppliers.
What is the expected percentage in the reduction in purchase prices in order to
switch suppliers by purchase type using an online reverse auction? When should
the company switch to a new supplier and when should it not?
5. This research study provides an interesting set of results worthy of future studies.
There is a need to understand how online reverse auctions have affected the
184
evolution of trust in strategic alliances, and how this process can be managed
through information sharing and participation.
6. There are several issues related to the buyer-supplier relationship dimension such
as understanding the nature of conflict between collaborative supply chain
management practices and online reverse auctions. Suppliers participate with the
expectation that if they win business, they are awarded a long-term agreement that
places them in a favorable position for renewal of the agreement when it expires.
But will buyers that rely on cost reduction to meet financial goals stop seeking
cost reduction at the end of the long-term agreement? Will the product/service be
put up for bid again? Will it be re-bid during the term of the contract, thus
effectively breaking the contract? Then what good is a contract? And what will be
the impact upon trust, either implicit or explicit, in the buyer-supplier
relationship? Does trust in business relationships matter anymore? If it does, then
does re-bidding the work make sense? Will buyers and sellers ever revert to
traditional, off-line, human negotiation processes?
185
BIBLIOGRAPHY
Altman, B. 2003. Reverse auctions destroy relationships. Manufacturing Engineering 130
(6): 112-113.
Anderson, J.C. and J. A. Narus. 1990. A model of distributor firm and manufacturer firm
working relationships. Journal of Marketing 54 (1): 42-58.
Anthony, T. 2000. Supply chain collaboration: success in the new Internet economy:
Achieving supply chain excellence through technology. Montgomery Research Inc. 2:
41-44.
Arbin, K., J. Hultman. 2003. Reversed electronic auctions B2B successful for which
products. Proceedings of the 12th International Annual IPSERA Conference.
Budapest, Hungary: 405–414.
Atkinson, W. 2000. Automotive firm likes e-Procurement but sees limits. Purchasing 29
(5): S62-64.
Avery, S. 2000. E-procurement: A wealth of information for buyers. Purchasing 29 (5):
111-112.
Bagozzi, R., P. Phillips, and W. Lynn. 1982. Representing and testing organizational
theories: A holistic construal. Administrative Science Quarterly 27 (3): 459-490.
Bakos, Y. 1991. A strategic analysis of EM. MIS Quarterly 15 (4): 295 -310.
Bakos, Y. 1997. Reducing buyer search costs: Implications for electronic marketplaces.
Management Science 43 (12): 1676-1692.
186
Bakos, Y. 1998. The emerging role of electronic marketplaces on the Internet.
Communications of the ACM 41: 35–42.
Barratt, M. and K. Rosdahl. 2002. Exploring business-to-business marketsites. European
Journal of Purchasing and Supply Management 8 (2): 111-122.
Beam, C., A. Segev, M. Bichler, and R. Krishnana. 1999. On negotiations and deal
making in electronic markets. Information Systems Frontiers 1 (3): 241-259.
Blackwell, R. D. and K. Blackwell. 1999. The century of the consumer: Converting
supply chains into demand chains. Supply Chain Management Review web exclusive
3 (3): Available online [[last accessed Nov, 11, 2004]
Tsou, J. and J. Chen. 2004. Covisint-reputation regarding online auction in the
automotive industry. Journal of Information and Optimization Sciences 25 (2): 361-
368.
Tully, S. 2000. The B2B tool that really is changing the world. Fortune 146 (5): 132-145.
Van Tulder, R. and M. Mol. 2002. Reverse auctions or auctions reversed: First
experiments by Philips. European Management Journal 20 (5): 447-456.
Venkatraman, N. 1989. Strategic orientation of business enterprise: The constructs,
dimensionality, and measurement. Management Science 35 (8): 942-962.
Verespej, M. 2002. E-procurement explosions. Industry Week 251 (2): 24-28.
Vickrey, W. 1961. Counter speculation, auctions, and competitive sealed tenders. Journal
of Finance 16 (l): 8 -37.
Wagner, S. and A. Schwab. 2004. Setting the stage for successful electronic reverse
auctions. Journal of Purchasing and Supply Management 10 (1): 11-26.
Webb, E. and K. Weick. 1979. Unobtrusive measures in organization theory: A reminder.
Administrative Science Quarterly 24: 650-659.
Webster, F. Jr. and Y. Wind. 1972. A general model for understanding organizational
buying behavior. Journal of Marketing 36: 12-19.
203
Westland, J. and T. Clark. 2000. Global electronic commerce: Theory and case studies.
Cambridge, MA: The MIT Press.
White, H. 1980. A heteroscedasticity-consistent covariance estimator and direct test for
heteroscedasticity. Econometrica 48 (4): 817-838.
Womack, J., D. Jones, and D. Roos. 1990. The machine that changed the world. New
York, NY: Rawson Associates.
Womack, J. and D. Jones. 1996. Leant thinking. New York, NY: Simon & Schuster.
Wyld, D. 2000. The auction mode. The PriceWaterhouseCoopers Endowment for the
Business of Government.
Yoshino, M., and S. Rangan. 1995. Strategic alliances: An entrepreneurial approach to
globalization. Boston, MA: Harvard Business School Press.
204
APPENDIX A
SURVEY INSTRUMENT
205
206
A Survey on Business-to-Business Online Reverse Auctions Implementation
by Oklahoma State University - School of Industrial Eng. & Mgmt in collaboration with the Institute of Supply Management (ISM)
Business-to-business online reverse auctions are the electronic procurement auctions hosted by a buying company to buy goods and/or services, in which multiple pre-qualified suppliers bid prices downward. Under the direction of Dr. Ricki Ingalls of Oklahoma State University-School of Industrial Engineering and Management, I am conducting my doctoral dissertation research using this questionnaire to examine how to use and implement online reverse auctions (procurement auctions) to achieve the buying organizations’ simultaneous goals of cost management and cooperative buyer-supplier strategic alliances.
Electronic reverse auctions have been getting more attention in the areas of purchasing and supply management due to their controversy. All participants will receive a copy of the research findings, upon completion, if desired. You will get a chance to know the “best in-class” criteria for assuring successful auction events, how the “best-in-class” companies implement reverse auctions in order to reduce purchase prices while maintaining/developing the buyer-supplier relationships. The completion of this survey would typically take 15 minutes and your response is vital. All information regarding participants is confidential. If you have any questions or concerns about the study, please contact Louie Sehwail at [email protected] or (405) 269-1010 or Dr. Ricki Ingalls at [email protected] or (405) 744-9129.
Please return the survey before August 15, 2005 in the enclosed-paid envelop. Thank you for your participation. If you personally have not been involved in an online reverse auction event, please forward this questionnaire to the person in your organization with experience in online reverse auction. Even if your company did not use online reverse auctions, you can provide valuable information about the nature of the buyer-supplier relationships by answering the survey (please skip pages 3 & 4). Thank you for your assistance and cooperation. Sincerely, Sincerely,
Louie Sehwail Ricki G. Ingalls, Ph.D. PhD Candidate Associate Professor
207
207
208
208
209
209
210
APPENDIX B
IRB APPROVAL
211
212
APPENDIX C
GENERAL DESCRIPTIVE STATISTICS
213
APPENDIX C.1 - DESCRIPTIVE STATISTICS: EXPERIENCE AND NUMBER OF AUCTION COMPLETED
State Sent Rec'd % State Sent Rec'd % State Sent Rec'd %AL 18 2 11% LA 1 0 0% OH 56 16 29%
AR 3 0 0% MA 32 3 9% OK 3 2 67%
AZ 3 1 33% MD 11 3 27% PA 54 15 28%
CA 11 6 55% ME 2 1 50% RI 3 0 0%
CT 22 2 9% MI 22 5 23% SC 10 1 10%
DE 5 1 20% MN 18 5 28% SD 2 0 0%
FL 32 2 6% MO 2 2 100% TN 18 6 33%
GA 28 6 21% MS 7 1 14% TX 25 10 40%
IA 8 5 63% NC 26 10 38% VA 13 2 15%
IL 11 4 36% NE 3 0 0% VT 2 0 0%
IN 18 3 17% NH 4 1 25% WA 7 2 29%
KS 5 2 40% NJ 31 9 29% WI 26 5 19%
KY 15 4 27% NY 45 9 20% WV 1 0 0%
APPENDIX C.2 - DESCRIPTIVE STATISTICS: EXPERIENCE AND NUMBER OF AUCTION COMPLETED
Item N Min. Max. Mean Median Standard Deviation
Years of experience with the company
143 0.5 42 10.3 7 9.295
Number of online reverse auctions your company completed in the last 3 years
92 1 5000 145.9 14.5 569
Number of online reverse auctions completed in-house in 2004
93 0 1800 56.45 5 221.9
Number of online reverseauctions completed with the help of an online auction provider in 2004
93 0 500 13.56 2 54.86
214
APPENDIX C.3 - DESCRIPTIVE STATISTICS: EARLY (FIRST 2 WEEKS) VERSUS LATE RESPONSES
N MeanStd.
DeviationStd. Error
MeanFOR Early 61 4.07 0.95 0.12
Late 35 3.91 0.70 0.12EVENT Early 60 3.13 1.26 0.16
Late 35 2.82 1.36 0.23RED Early 58 0.15 0.08 0.01
Late 28 0.14 0.05 0.01POWER Early 61 4.46 1.43 0.18
Late 35 4.94 1.48 0.25COLLAB Early 61 4.63 1.35 0.17
Late 35 4.05 1.31 0.22IMPLT Early 61 5.71 1.13 0.14
Late 35 5.87 1.07 0.18TRUST Early 102 5.70 0.75 0.07
Late 43 5.75 0.95 0.15COMM Early 102 4.61 1.13 0.11
Late 43 4.54 1.41 0.22INTD Early 102 4.83 1.21 0.12
Late 43 4.81 1.32 0.20COORD Early 102 5.24 1.14 0.11
Late 43 5.47 1.29 0.20INFOQ Early 102 5.39 0.90 0.09
Late 43 5.59 1.00 0.15Conflict Early 102 3.70 0.65 0.06
Late 43 3.83 0.47 0.07INFOP Early 102 5.17 1.08 0.11
Late 43 5.39 1.14 0.17INFOS Early 102 5.53 0.81 0.08
Late 43 5.69 0.75 0.12SSA Early 102 5.70 0.69 0.07
Late 43 5.91 0.68 0.10
215
APPENDIX C.4 – T-TEST FOR EQUALITY OF MEANS: EARLY (FIRST 2 WEEKS) VERSUS LATE RESPONSES
* Correlation is significant at the 0.05 level (2-tailed). ** Correlation is significant at the 0.01 level (2-tailed).
FOR: Auction Design (Format) TRUST: Attribute of the Alliance (Trust) PERS: Persuasive Attempts by Either PartyEVENT: Auction Design (Event Organization) COMM: Attribute of the Alliance (Commitment) JOINT: Joint Problem SolvingRED: Reduction in Purchase Price INTD: Attribute of the Alliance (Interdependence) HARSH: Harsh WordsPOWER: Auction Application (Power based Bargaining) COORD: Attribute of the Alliance (Coordination) INFOQ: Information QualityCOLLAB: Auction Application (Collaborative Problem Solving) SMOOTH: Smooth over the Problem INFOP/INFOS: Information Participation / Information QualityIMPLT: Successful Event Implementation ARBT: Outside Arbitration SSA: Strategic Supplier Alliance
269
270
APPENDIX F
SCALE DESCRIPTIVE STATISTICAL ANALYSIS
271
Factors / Items N Min. Max. Mean Std. Deviation
Auction Design (Format) Q1. Auctions where suppliers can see others’ bids are effective in reducing purchase
prices (open-bid). 95 2 7 6.07 1.15
Q2. Auctions where suppliers only know they have been outbid are effective in reducing purchase prices (sealed-bid).{Reverse Scored}
94 1 7 4.41 2.03
Q3. Multi-round sealed bid auctions are more effective than multi-round open bids in reducing the purchasing prices. {Reverse Scored}
85 1 7 2.92 1.56
Q4. Multi-round open-bid auctions are more effective than multi-round sealed bids in reducing the purchasing prices.
85 2 7 5.41 1.35
Auction Design (Event Organization) Q6. Auctions organized in-house are more effective than auctions organized with the
help of an online reverse auction service provider (market maker) in reducing purchasing prices.
85 1 7 3.56 1.70
Q7. Auctions organized with the help on an online auction service provider (like Trade-Partners or Freemarkets) are effective in reducing purchase prices.{Reverse Scored}
94 2 7 5.78 1.05
Q8. Auctions organized with the help on an online auction service provider (like Trade-Partners or Freemarkets) are more effective than auctions organized in-house in reducing the purchasing prices.{Reverse Scored}
87 1 7 4.51 1.73
Reduction in Purchase PriceOPMC: The use of online reverse auctions has led to a decrease in the purchase price
paid for purchasing production material and components.81 0% 30% 12.9% 0.065
OMRO: The use of online reverse auctions has led to a decrease in the purchase price paid for purchasing MROs.
66 3% 71% 16.7% 0.106
OSER: The use of online reverse auctions has led to a decrease in the purchase price paid for purchasing services.
62 0% 40% 13.5% 0.082
271
272
Factors / Items N Min. Max. Mean Std. Deviation
Auction Application (Power-based Bargaining) Q9. Our goal is short term contract with the suppliers when we buy production material
and components.94 1 7 3.90 2.03
Q10. Our goal is short term contract with the suppliers when we buy MROs. 91 1 7 4.35 1.95
Q11. Our goal is short term contract with the suppliers when we buy services. 85 1 7 4.20 1.99
Q19. We use online reverse auction to pressure our suppliers to reduce purchase prices. 96 1 7 5.94 1.00
Auction Application (Collaborative Problem Solving) Q12. Our goal is long term contract with the suppliers when we buy production material
and components.94 1 7 5.18 1.55
Q13. Our goal is long term contract with the suppliers when we buy MROs. 90 1 7 4.08 1.94
Q14. Our goal is long term contract with the suppliers when we buy services. 84 1 7 4.08 2.01
Q18. We use online reverse auction to identify new long-term partnering suppliers. 96 1 7 4.22 1.82
Successful Event Implementation Q21. We are satisfied with our savings using online reverse auctions. 96 1 7 5.84 1.10
Q24. We are satisfied with our company online reverse auctions results. 96 1 7 5.70 1.26
Attribute of the Alliance (Trust) Q25. We trust that our strategic supplier alliances will be beneficial to our business. 145 2 7 6.26 0.78 Q26. We do not get an equitable (fair) deal from our suppliers in these alliances. {Reverse
Scored}145 1 7 5.54 1.24
Q27. The relationships with our suppliers are marked by a high degree of harmony. 145 1 7 5.34 1.11
Attribute of the Alliance (Commitment) Q28. We would like to discontinue buying from our current suppliers. {Reverse Scored} 145 1 7 3.51 1.94 Q29. We are very committed to buying from our current suppliers. 145 1 7 5.12 1.24
Q30. We have minimal commitment to our suppliers. {Reverse Scored} 145 1 7 5.14 1.48
272
273
Factors / Items N Min. Max. Mean Std. Deviation
Attribute of the Alliance (Interdependence) Q31. It would be very easy to terminate the relationship with any supplier and establish
another strategic supplier. {Reverse Scored}145 1 7 5.30 1.54
Q32. The time to establish another new strategic supplier partnership would be extremely long.
145 1 7 4.70 1.55
Q33. The cost to establish another new strategic supplier partnership would be extremely high.
145 1 7 4.46 1.46
Attribute of the Alliance (Coordination) Q34. Our activities with our suppliers are well coordinated. 145 1 7 5.43 1.17
Q35. Programs at our company are well coordinated with our suppliers. 145 1 7 5.18 1.32
Communication Behavior (Information Quality) Q37. To what extent do you feel that your company communication with your suppliers
is timely?145 2 7 5.51 1.01
Q38. To what extent do you feel that your company communication with your suppliers is accurate?
145 2 7 5.48 0.99
Q39. To what extent do you feel that your company communication with your suppliers is adequate?
145 1 7 5.23 1.28
Q40. To what extent do you feel that your company communication with your suppliers is complete?
145 2 7 5.26 1.15
Q41. To what extent do you feel that your company communication with your suppliers is credible?
145 3 7 5.77 0.99
Conflict Resolution Q42. Smooth over the problem 145 1 7 4.16 1.69 Q43. Outside arbitration 145 1 4 1.54 0.76 Q44. Persuasive attempts by either party 145 1 7 4.74 1.41 Q45. Joint problem solving 145 3 7 6.03 0.81 Q46. Harsh words 145 1 7 2.23 1.43
273
274
Factors / Items N Min. Max. Mean Std. Deviation
Communication Behavior (Information Participation) Q47. We actively seek advice, counsel, and information from our suppliers. 145 2 7 5.78 1.02
Q48. Our strategic suppliers participate in our planning and goal setting activities. 145 1 7 4.69 1.63 Q49. We participate in our suppliers’ planning and goal setting activities that are
relevant to our strategic partnership.145 1 7 4.57 1.65
Q50. We actively encourage improvement suggestions from our suppliers. 145 2 7 5.89 1.11
Communication Behavior (Information Sharing) Q53. We inform our suppliers in advance of changing needs. 145 1 7 5.43 1.05
Q54. In this relationship, it is expected that any information which might help the other party will be provided.
145 3 7 5.76 0.93
Q55. The parties are expected to keep each other informed about events or changes that might affect the other party.
145 3 7 6.03 0.71
Q57. Our Supplier keep us fully informed about issues that affect our business. 145 2 7 5.07 1.25
Strategic Supplier Alliance Q58. In our strategic supplier alliances, the parties work together to solve problems. 145 3 7 5.86 0.87 Q59. Our suppliers are flexible to requests we make. 145 3 7 5.68 0.91 Q60. Our suppliers make an effort to help us during emergencies. 145 4 7 6.25 0.68 Q61. When an agreement is made, we can always rely on our suppliers to fulfill the
requirements.145 2 7 5.53 1.01
Q62. We are satisfied with our company strategic supplier alliances. 145 3 7 5.51 0.96
274
275
APPENDIX G
HYPOTHESES ANALYSIS
276
APPENDIX G.1 – HYPOTHESIS 1 ANALYSIS FOR DIFFERENT GROUPS
Test Value = 0 versus > 0
By Annual Sales
Sales Volume N Mean StDevSE
Mean95% Lower
Boundt P
Less than One Billion 29 5.79 4.74 0.88 4.29 6.57 0.000More than One Billion 55 3.55 .47 0.60 2.53 5.89 0.000
By Annual Purchasing Volume
Purchasing Volume N Mean StDevSE
Mean95% Lower
Bound t P
Less than 500 Million 33 5.42 4.99 0.87 3.95 6.25 0.000More than 500 Million 51 3.61 4.34 0.61 2.59 5.94 0.000
By Number of Employees
Total Employees N Mean StDevSE
Mean95% Lower
Bound t P
Less than 1000 Employees 30 5.37 5.37 0.98 3.70 5.47 0.000More than 1000 Employees 54 3.74 4.16 0.57 2.79 6.61 0.000
By Number of Purchasing Employees
Purchasing Employees N Mean StDevSE
Mean95% Lower
Bound t P
Less than 20 Employees 30 5.73 5.04 0.92 4.17 6.23 0.000More than 20 Employees 54 3.53 4.29 0.58 2.56 6.06 0.000
By Job Title
Job Title N Mean StDevSE
Mean95% Lower
Bound t P
VP or Director 25 4.88 4.17 0.84 3.45 5.84 0.000Sr. Manager or Manager 50 4.38 4.79 0.68 3.24 6.47 0.000Sr. Buyer or Buyer 9 2.44 5.27 1.76 -0.82 5.39 0.000
277
APPENDIX G.2 – HYPOTHESIS 2 ANALYSIS BY DIFFERENT GROUPS
Test Value = 0 versus > 0
By Annual Sales
Sales Volume N Mean StDevSE
Mean
95% Lower Bound
t P
Less than One Billion 27 -2.56 3.13 0.60 -3.58 -4.24 1.000More than One Billion 57 -1.17 2.49 0.33 -1.73 -3.56 1.000
By Annual Purchasing Volume
Purchasing Volume N Mean StDevSE
Mean
95% Lower Bound
t P
Less than 500 Million 32 -2.63 2.96 0.52 -3.51 -5.02 1.000More than 500 Million 52 -1.00 2.48 0.34 -1.57 -2.91 0.997
By Number of Employees
Total Employees N Mean StDev SE Mean
95% Lower Bound
t P
Less than 1000 Employees 28 -2.57 3.25 0.61 -3.62 -4.19 1.000More than 1000 Employees 56 -1.14 2.39 0.32 -1.68 -3.57 1.000
By Number of Purchasing Employees
Purchasing Employees N Mean StDev SE Mean
95% Lower Bound
t P
Less than 20 Employees 31 -2.55 2.95 0.53 -3.45 -4.80 1.000More than 20 Employees 53 -1.08 2.53 0.35 -1.66 -3.09 0.998
By Job Title
Job Title N Mean StDev SE Mean
95% Lower Bound
t P
VP or Director 26 -1.31 2.74 0.53 -2.22 -2.43 0.989Sr. Manager or Manager 49 -1.92 2.94 0.42 -2.52 -4.32 1.000Sr. Buyer or Buyer 9 -1.44 1.94 0.65 -2.65 -2.23 0.972
278
APPENDIX G.3 – HYPOTHESIS 2 ANALYSIS BY DIFFERENT GROUPS – IN THE OPPOSITE DIRECTION
Test Value = 0 versus < 0
By Annual Sales
Sales Volume N Mean StDevSE
Mean
95% Lower Bound
t P
Less than One Billion 27 -2.56 3.13 0.60 -1.53 -4.24 0.000More than One Billion 57 -1.17 2.49 0.33 -0.62 -3.56 0.000
By Annual Purchasing Volume
Purchasing Volume N Mean StDevSE
Mean
95% Lower Bound
t P
Less than 500 Million 32 -2.63 2.96 0.52 -1.74 -5.02 0.000More than 500 Million 52 -1.00 2.48 0.34 -0.42 -2.91 0.003
By Number of Employees
Total Employees N Mean StDev SE Mean
95% Lower Bound
t P
Less than 1000 Employees 28 -2.57 3.25 0.61 -1.52 -4.19 0.000More than 1000 Employees 56 -1.14 2.39 0.32 -0.61 -3.57 0.000
By Number of Purchasing Employees
Purchasing Employees N Mean StDev SE Mean
95% Lower Bound
t P
Less than 20 Employees 31 -2.55 2.95 0.53 -1.50 -4.80 0.000More than 20 Employees 53 -1.08 2.53 0.35 -0.49 -3.09 0.002
By Job Title
Job Title N Mean StDev SE Mean
95% Lower Bound
t P
VP or Director 26 -1.31 2.74 0.53 -0.39 -2.43 0.011Sr. Manager or Manager 49 -1.92 2.94 0.42 -1.11 -4.32 0.000Sr. Buyer or Buyer 9 -1.44 1.94 0.65 -0.24 -2.23 0.028
279
APPENDIX G.4 – HYPOTHESIS 3A ANALYSIS BY DIFFERENT GROUPS
Test Value = 0 versus > 0
By Annual Sales
Sales Volume N Mean StDevSE
Mean
95% Lower Bound
t P
Less than One Billion 26 0.12 0.08 0.015 0.096 7.85 0.000More than One Billion 54 0.13 0.06 0.007 0.12 16.87 0.000
By Annual Purchasing Volume
Purchasing Volume N Mean StDevSE
Mean
95% Lower Bound
t P
Less than 500 Million 33 0.127 0.077 0.1013 0.10 9.53 0.000More than 500 Million 47 0.13 0.06 0.008 0.12 15.73 0.000
By Number of Employees
Total Employees N Mean StDev SE Mean
95% Lower Bound
t P
Less than 1000 Employees 28 0.11 0.06 0.012 0.09 9.53 0.000More than 1000 Employees 52 0.14 0.066 0.009 0.12 15.16 0.000
By Number of Purchasing Employees
Purchasing Employees N Mean StDev SE Mean
95% Lower Bound
t P
Less than 20 Employees 26 0.011 0.066 0.013 0.09 8.66 0.000More than 20 Employees 54 0.14 0.06 0.008 0.123 15.81 0.000
By Job Title
Job Title N Mean StDev SE Mean
95% Lower Bound
t P
VP or Director 23 0.12 0.06 0.0129 0.097 9.14 0.000Sr. Manager or Manager 50 0.13 0.07 0.009 0.12 14.03 0.000Sr. Buyer or Buyer 7 0.14 0.069 0.026 0.089 5.36 0.001
280
APPENDIX G.5 – HYPOTHESIS 3B ANALYSIS BY DIFFERENT GROUPS
Test Value = 0 versus > 0
By Annual Sales
Sales Volume N Mean StDevSE
Mean
95% Lower Bound
t P
Less than One Billion 20 0.14 0.10 0.022 0.104 6.43 0.000More than One Billion 44 0.18 0.11 0.016 0.15 10.96 0.000
By Annual Purchasing Volume
Purchasing Volume N Mean StDevSE
Mean
95% Lower Bound
t P
Less than 500 Million 25 0.15 0.092 0.018 0.12 8.15 0.000More than 500 Million 39 0.18 0.11 0.018 0.15 9.79 0.000
By Number of Employees
Total Employees N Mean StDev SE Mean
95% Lower Bound
t P
Less than 1000 Employees 18 0.13 0.079 0.018 0.095 6.86 0.000More than 1000 Employees 46 0.18 0.11 0.016 0.16 11.10 0.000
By Number of Purchasing Employees
Purchasing Employees N Mean StDev SE Mean
95% Lower Bound
t P
Less than 20 Employees 18 0.14 0.09 0.02 0.103 6.37 0.000More than 20 Employees 46 0.18 0.11 0.016 0.15 10.99 0.000
By Job Title
Job Title N Mean StDev SE Mean
95% Lower Bound
t P
VP or Director 19 0.14 0.063 0.014 0.112 9.56 0.000Sr. Manager or Manager 38 0.18 0.13 0.02 0.14 8.76 0.000Sr. Buyer or Buyer 7 0.19 0.07 0.025 0.138 7.39 0.000
281
APPENDIX G.6 – HYPOTHESIS 3C ANALYSIS BY DIFFERENT GROUPS
Test Value = 0 versus > 0
By Annual Sales
Sales Volume N Mean StDevSE
Mean
95% Lower Bound
t P
Less than One Billion 18 0.13 0.08 0.018 0.092 6.65 0.000More than One Billion 42 0.13 0.08 0.012 0.112 10.56 0.000
By Annual Purchasing Volume
Purchasing Volume N Mean StDevSE
Mean
95% Lower Bound
t P
Less than 500 Million 22 0.12 0.08 0.017 0.094 7.30 0.000More than 500 Million 38 0.14 0.08 0.013 0.113 10.15 0.000
By Number of Employees
Total Employees N Mean StDev SE Mean
95% Lower Bound
t P
Less than 1000 Employees 19 0.14 0.08 0.019 0.11 7.46 0.000More than 1000 Employees 41 0.13 0.08 0.012 0.11 10.04 0.000
By Number of Purchasing Employees
Purchasing Employees N Mean StDev SE Mean
95% Lower Bound
t P
Less than 20 Employees 17 0.14 0.08 0.02 0.103 6.74 0.000More than 20 Employees 43 0.13 0.08 0.012 0.011 10.51 0.000
By Job Title
Job Title N Mean StDev SEMean
95% Lower Bound
t P
VP or Director 19 0.12 0.062 0.014 0.09 8.23 0.000Sr. Manager or Manager 35 0.14 0.09 0.015 0.11 9.06 0.000Sr. Buyer or Buyer 6 0.14 0.08 0.03 0.068 4.09 0.005
282
APPENDIX G.7 – HYPOTHESIS 4A ANALYSIS BY DIFFERENT GROUPS
By Annual SalesSales Volume N Pearson correlation P-Value
Less than One Billion 31 -0.409** 0.022
More than One Billion 64 -0.581** 0.000
By Annual Purchasing VolumePurchasing Volume N Pearson correlation P-Value
Less than 500 Million 37 -0.412** 0.011
More than 500 Million 58 -0.584** 0.000
By Number of EmployeesTotal Employees N Pearson correlation P-Value
Less than 1000 Employees 33 -0.445** 0.009
More than 1000 Employees 62 -0.554** 0.000
By Number of Purchasing EmployeesTotal Employees N Pearson correlation P-Value
Less than 20 Employees 35 -0.449** 0.007
More than 20 Employees 60 -0.557** 0.000
By Job TitleJob Title N Pearson correlation P-Value
VP or Director 27 -0.406** 0.035
Sr. Manager or Manager 57 -0.613** 0.000
Sr. Buyer or Buyer 9 -0.129 0.741
** Correlation is significant
283
APPENDIX G.8 – HYPOTHESIS 4B ANALYSIS BY DIFFERENT GROUPS
By Annual SalesSales Volume N Pearson correlation P-Value
Less than One Billion 31 -0.796** 0.000
More than One Billion 64 -0.800** 0.000
By Annual Purchasing VolumePurchasing Volume N Pearson correlation P-Value
Less than 500 Million 36 -0.766** 0.000
More than 500 Million 53 -0.816** 0.000
By Number of EmployeesTotal Employees N Pearson correlation P-Value
Less than 1000 Employees 33 -0.833** 0.000
More than 1000 Employees 62 -0.784** 0.000
By Number of Purchasing EmployeesTotal Employees N Pearson correlation P-Value
Less than 20 Employees 34 -0.823** 0.000
More than 20 Employees 55 -0.796** 0.000
By Job TitleJob Title N Pearson correlation P-Value
VP or Director 25 -0.822* 0.000
Sr. Manager or Manager 55 -0.778** 0.000
Sr. Buyer or Buyer 9 -0.773** 0.015
** Correlation is significant
284
APPENDIX G.9 – HYPOTHESIS 4C ANALYSIS BY DIFFERENT GROUPS
By Annual SalesSales Volume N Pearson correlation P-Value
Less than One Billion 27 -0.940** 0.000
More than One Billion 56 -0.860** 0.000
By Annual SalesSales Volume N Pearson correlation P-Value
Less than 500 Million 21 -0.943** 0.000
More than 500 Million 61 -0.865** 0.000
By Annual Purchasing VolumePurchasing Volume N Pearson correlation P-Value
Less than 500 Million 31 -0.927** 0.000
More than 500 Million 50 -0.856** 0.000
By Number of EmployeesTotal Employees N Pearson correlation P-Value
Less than 1000 Employees 30 -0.946** 0.000
More than 1000 Employees 57 -0.851** 0.000
By Number of Purchasing EmployeesTotal Employees N Pearson correlation P-Value
Less than 20 Employees 33 -0.914** 0.000
More than 20 Employees 49 -0.863** 0.000
By Job TitleJob Title N Pearson correlation P-Value
VP or Director 23 -0.859** 0.000
Sr. Manager or Manager 51 -0.910** 0.000
Sr. Buyer or Buyer 8 -0.813** 0.014
** Correlation is significant
285
APPENDIX G.10 – HYPOTHESIS 5A ANALYSIS BY DIFFERENT GROUPS
Test Value = 0 versus > 0
By Annual Sales
Sales Volume N Mean StDevSE
Mean
95% Lower Bound
t P
Less than One Billion 31 -1.13 3.27 0.59 -2.13 -1.92 0.968More than One Billion 62 -1.42 3.05 0.39 -2.07 -3.66 1.000
By Annual Purchasing Volume
Purchasing Volume N Mean StDevSE
Mean
95% Lower Bound
t P
Less than 500 Million 37 -1.03 3.13 0.52 -1.90 -2.00 0.973More than 500 Million 56 -1.52 3.12 0.42 -2.21 -3.65 1.000
By Number of Employees
Total Employees N Mean StDev SE Mean
95% Lower Bound
t P
Less than 1000 Employees 33 -0.88 3.36 0.59 -1.87 -1.50 0.929More than 1000 Employees 60 -1.57 2.97 0.38 -2.21 -4.08 1.000
By Number of Purchasing Employees
Purchasing Employees N Mean StDev SE Mean
95% Lower Bound
t P
Less than 20 Employees 35 -0.97 3.34 0.56 -1.93 -1.72 0.953More than 20 Employees 58 -1.53 2.98 0.39 -2.19 -3.92 1.000
By Job Title
Job Title N Mean StDev SE Mean
95% Lower Bound
t P
VP or Director 27 -1.11 3.20 0.62 -2.16 -1.80 0.958Sr. Manager or Manager 57 -1.35 3.20 0.42 -2.06 -3.19 0.999Sr. Buyer or Buyer 9 -1.78 2.49 0.83 -3.32 -2.14 0.968
286
APPENDIX G.11 – OPPOSITE OF HYPOTHESIS 5A ANALYSIS BY DIFFERENT GROUPS
Test Value = 0 versus < 0
By Annual Sales
Sales Volume N Mean StDevSE
Mean
95% Lower Bound
t P
Less than One Billion 31 -1.13 3.27 0.59 -0.13 -1.92 0.032More than One Billion 62 -1.42 3.05 0.39 -0.77 -3.66 0.000
By Annual Purchasing Volume
Purchasing Volume N Mean StDev SE Mean
95% Lower Bound
t P
Less than 500 Million 37 -1.03 3.13 0.52 -1.158 -2.00 0.027More than 500 Million 56 -1.52 3.12 0.42 -0.821 -3.65 0.000
By Number of Employees
Total Employees N Mean StDev SE Mean
95% Lower Bound
t P
Less than 1000 Employees 33 -0.88 3.36 0.59 0.11 -1.50 0.071More than 1000 Employees 60 -1.57 2.97 0.38 -0.93 -4.08 0.000
By Number of Purchasing Employees
Purchasing Employees N Mean StDev SE Mean
95% Lower Bound
t P
Less than 20 Employees 35 -0.97 3.34 0.56 -0.017 -1.72 0.047More than 20 Employees 58 -1.53 2.98 0.39 -0.880 -3.92 0.000
By Job Title
Job Title N Mean StDev SE Mean
95% Lower Bound
t P
VP or Director 27 -1.11 3.20 0.62 -0.060 -1.80 0.042Sr. Manager or Manager 57 -1.35 3.20 0.42 -0.642 -3.19 0.001Sr. Buyer or Buyer 9 -1.78 2.49 0.83 -0.235 -2.14 0.032
287
APPENDIX G.12 – HYPOTHESIS 5B ANALYSIS BY DIFFERENT GROUPS
Test Value = 0 versus > 0
By Annual Sales
Sales Volume N Mean StDevSE
Mean
95% Lower Bound
t P
Less than One Billion 30 1.16 3.62 0.66 0.043 1.76 0.044More than One Billion 59 -0.17 3.69 0.48 -0.972 -0.35 0.637
By Annual Purchasing Volume
Purchasing Volume N Mean StDevSE
Mean
95% Lower Bound
t P
Less than 500 Million 36 1.00 3.57 0.59 -0.005 1.68 0.051More than 500 Million 53 -0.21 3.74 0.51 -1.07 -0.40 0.656
By Number of Employees
Total Employees N Mean StDev SE Mean
95% Lower Bound
t P
Less than 1000 Employees 31 1.52 3.54 0.64 0.44 2.39 0.012More than 1000 Employees 58 -0.38 3.64 0.48 -1.18 -0.79 0.785
By Number of Purchasing Employees
Purchasing Employees N Mean StDev SE Mean
95% Lower Bound
t P
Less than 20 Employees 34 1.03 3.67 0.63 -0.04 1.63 0.056More than 20 Employees 55 -0.18 3.67 0.41 -1.01 -0.37 0.643
By Job Title
Job Title N Mean StDev SE Mean
95% Lower Bound
t P
VP or Director 25 0.36 4.01 0.80 -1.01 0.45 0.329Sr. Manager or Manager 51 0.63 3.67 0.51 -0.23 1.22 0.114Sr. Buyer or Buyer 9 -1.89 3.44 1.15 -4.02 -1.65 0.931
288
APPENDIX G.13 – HYPOTHESIS 5B OPPOSITE - ANALYSIS BY DIFFERENT GROUPS
Test Value = 0 versus < 0
By Annual Sales
Sales Volume N Mean StDevSE
Mean
95% Lower Bound
t P
Less than One Billion 30 1.16 3.62 0.66 2.29 1.76 0.956More than One Billion 59 -0.17 3.69 0.48 0.63 -0.35 0.363
By Annual Purchasing Volume
Purchasing Volume N Mean StDev SE Mean
95% Lower Bound
t P
Less than 500 Million 36 1.00 3.57 0.59 2.01 1.68 0.949More than 500 Million 53 -0.21 3.74 0.51 0.65 -0.40 0.344
By Number of Employees
Total Employees N Mean StDev SE Mean
95% Lower Bound
t P
Less than 1000 Employees 31 1.52 3.54 0.64 2.59 2.39 0.988More than 1000 Employees 58 -0.38 3.64 0.48 0.42 -0.79 0.215
By Number of Purchasing Employees
Purchasing Employees N Mean StDev SE Mean
95% Lower Bound
t P
Less than 20 Employees 34 1.03 3.67 0.63 2.10 1.63 0.944More than 20 Employees 55 -0.18 3.67 0.41 0.65 -0.37 0.357
By Job Title
Job Title N Mean StDev SE Mean
95% Lower Bound
t P
VP or Director 25 0.36 4.01 0.80 1.73 0.45 0.671Sr. Manager or Manager 51 0.63 3.67 0.51 1.40 1.22 0.893Sr. Buyer or Buyer 9 -1.89 3.44 1.15 0.25 -1.65 0.069
289
APPENDIX G.14 – HYPOTHESIS 5C ANALYSIS BY DIFFERENT GROUPS
Test Value = 0 versus > 0
By Annual Sales
Sales Volume N Mean StDevSE
Mean
95% Lower Bound
t P
Less than One Billion 27 1.67 3.63 0.70 0.47 2.38 0.012More than One Billion 55 -0.60 3.80 0.51 -1.46 -1.17 0.876
By Annual Purchasing Volume
Purchasing Volume N Mean StDevSE
Mean
95% Lower Bound
t P
Less than 500 Million 32 1.44 3.83 0.78 0.29 2.12 0.021More than 500 Million 50 -0.68 3.72 0.53 -1.56 -1.29 0.899
By Number of Employees
Total Employees N Mean StDev SE Mean
95% Lower Bound
t P
Less than 1000 Employees 30 1.70 3.64 0.66 0.57 2.56 0.008More than 1000 Employees 52 -0.75 3.76 0.52 -1.62 -1.44 0.922
By Number of Purchasing Employees
Purchasing Employees N Mean StDev SEMean
95% Lower Bound
t P
Less than 20 Employees 33 1.39 3.71 0.65 0.30 2.16 0.019More than 20 Employees 49 -0.69 3.80 0.54 -1.61 -1.28 0.896
By Job Title
Job Title N Mean StDev SE Mean
95% Lower Bound
t P
VP or Director 23 -0.04 4.20 0.88 -1.55 -0.05 0.520Sr. Manager or Manager 51 0.63 3.67 0.51 -0.23 1.22 0.114Sr. Buyer or Buyer 8 -2.37 3.70 1.31 -4.85 -1.82 0.944
290
APPENDIX G.15 – HYPOTHESIS 7A ANALYSIS FOR COMPANIES WITH AUCTION EXPERIENCE
291
APPENDIX G.16 – HYPOTHESIS 7A ANALYSIS FOR COMPANIES WITH NO AUCTION EXPERIENCE
292
APPENDIX G.17 – HYPOTHESIS 7A ANALYSIS FOR COMPANIES WITH LESS THAN 15 AUCTIONS IN THE LAST 3 YEARS
293
APPENDIX G.18 – HYPOTHESIS 7A ANALYSIS FOR COMPANIES WITH MORE THAN 15 AUCTIONS IN THE LAST 3 YEARS
294
APPENDIX G.19 – HYPOTHESIS 7B REGRESSION MODEL BEFORE TRANSFORMATION OF THE DEPENDENT VARIABLE
295
APPENDIX G.20– HYPOTHESIS 7B ANALYSIS FOR COMPANIES WITH AUCTION EXPERIENCE
296
APPENDIX G.21 – HYPOTHESIS 7B ANALYSIS FOR COMPANIES WITH NO AUCTION EXPERIENCE
297
APPENDIX G.22 – HYPOTHESIS 7B ANALYSIS FOR COMPANIES WITH LESS THAN 15 AUCTIONS IN THE LAST 3 YEARS
298
APPENDIX G.23 – HYPOTHESIS 7B ANALYSIS FOR COMPANIES WITH MORE THAN 15 AUCTIONS IN THE LAST 3 YEARS
299
APPENDIX G.24– HYPOTHESIS 7C ANALYSIS FOR COMPANIES WITH AUCTION EXPERIENCE
300
APPENDIX G.25 – HYPOTHESIS 7C ANALYSIS FOR COMPANIES WITH NO AUCTION EXPERIENCE
301
APPENDIX G.26 – HYPOTHESIS 7C ANALYSIS FOR COMPANIES WITH LESS THAN 15 AUCTIONS IN THE LAST 3 YEARS
302
APPENDIX G.27 – HYPOTHESIS 7C ANALYSIS FOR COMPANIES WITH MORE THAN 15 AUCTIONS IN THE LAST 3 YEARS
303
APPENDIX G.28 – HYPOTHESIS 8 ANALYSIS BY DIFFERENT GROUPS
By Annual SalesSales Volume N Pearson correlation P-Value
Less than One Billion 29 0.066 0.732
More than One Billion 56 0.315** 0.018
By Annual Purchasing VolumePurchasing Volume N Pearson correlation P-Value
Less than 500 Million 36 0.139 0.419
More than 500 Million 49 0.275 0.056
By Number of EmployeesTotal Employees N Pearson correlation P-Value
Less than 1000 Employees 30 0.326 0.078
More than 1000 Employees 55 0.197 0.150
By Number of Purchasing EmployeesTotal Employees N Pearson correlation P-Value
Less than 20 Employees 29 0.257 0.178
More than 20 Employees 56 0.189 0.163
By Job TitleJob Title N Pearson correlation P-Value
VP or Director 24 0.014 0.948
Sr. Manager or Manager 53 0.263 0.057
Sr. Buyer or Buyer 9 0.566 0.144
** Correlation is significant at 0.05 level
304
APPENDIX G.29 – HYPOTHESIS 9 ANALYSIS BY DIFFERENT GROUPS
By Annual SalesSales Volume N Pearson correlation P-Value
Less than One Billion 29 0.598** 0.000
More than One Billion 66 0.239** 0.048
By Annual SalesSales Volume N Pearson correlation P-Value
Less than 500 Million 23 0.619** 0.002
More than 500 Million 72 0.263** 0.026
By Annual Purchasing VolumePurchasing Volume N Pearson correlation P-Value
Less than 500 Million 37 0.510** 0.001
More than 500 Million 58 0.272** 0.039
By Number of EmployeesTotal Employees N Pearson correlation P-Value
Less than 1000 Employees 33 0.454** 0.008
More than 1000 Employees 62 0.305** 0.016
By Number of Purchasing EmployeesTotal Employees N Pearson correlation P-Value
Less than 20 Employees 35 0.527** 0.001
More than 20 Employees 60 0.264** 0.021
By Job TitleJob Title N Pearson correlation P-Value
Major Field: Industrial Engineering and Management
Biographical:
Personal Data: Born in Kuwait on May 4, 1977, the son of Munir Sehwail and Sabiha Al-Saber.
Education: Graduate from Al-Itehad High School in Amman-Jordan in May 1994; received Bachelor of Science degree in Industrial Engineering and Management from the University of Jordan in May 1999. Received Master of Science Degree in Industrial Engineering and Management in May 2001. Completed the requirements for the Doctor of Philosophy degree with a major in Industrial Engineering and Management at Oklahoma State University, Stillwater, Oklahoma in July, 2006.
Experience: Worked for Hikma Pharmaceuticals in Jordan in 1999; employed as a half-time graduate assistant for the School of Industrial Engineering and Management from 2000 to 2001; employed as an Industrial Engineer for Gulf Stream Aerospace from 2001-2002; worked as a consultant for Kwikset Corporation in summer of 2002 and 2003; employed as a half-time lecturer and graduate associate for the School of Industrial Engineering and Management at Oklahoma State University from 2002 till now.
Professional Memberships: Phi Kappa Phi (academic achievement national honor society), Alpha Pi Mu (Industrial Engineering honor society), Institute of Industrial Engineers (IIE), Institute for Operations Research and Management Science (INFORMS), Production and Operation Management Society (POMS), American Society for Quality (ASQ) and Institute of Supply Management (ISM).
Name: Loay Sehwail Date of Degree: July, 2006
Institution: Oklahoma State University Location: Stillwater, Oklahoma
Title of Study: IMPLEMENTING BUSINESS-TO-BUSINESS ONLINE REVERSE AUCTIONS
Pages in Study: 304 Candidate for the Degree of Doctor of Philosophy
Major Field: Industrial Engineering and Management
Scope and Method of the Study: The purpose of this study was to address the gap in the academic literature by developing and testing a model to successfully implement online reverse auctions with respect to: (1) reducing purchase prices, and (2) developing/maintaining buyer-supplier strategic alliance relationships in the business-to-business online reverse auctions environment. A survey questionnaire was sent to 603 members of the Institute of Supply Management who reported to be in purchasing or supply management role. Companies were surveyed to determine the effect of auction design and purchase type on the “successful” implementation of online reverse auctions, in terms of the reduction in purchase price and the success of buyer-supplier strategic alliance. The measures developed by Mohr and Spekman (1994) and Monczka et al. (1998) were used to assess the “successful strategic alliance” and its critical antecedents including attributes of the relationship (trust, commitment, coordination and interdependence), communication behavior (information quality, participation and sharing) and conflict resolution techniques.
Findings and Conclusions: The research concluded that for the purpose of reducing purchase prices (1) companies prefer to use open-bid rather than sealed bid auctions, (2) companies prefer to organize auctions with the help of a market maker than in-house, (3) an average of 14.4% is the reduction in purchase prices when using online reverse auctions to outsource products. The research study also concluded that online reverse auctions are used for: (1) either the short-term or long the term and not for both when purchasing any type of product, (2) the long-term when larger size companies outsource production items and material, and (3) the short-term when smaller size companies outsource MROs and/or services. The research study found that from the perspective of the buying company in the alliance, the following were found to be significantly related to partnership success: trust, coordination, communication, information quality, information participation, information sharing, joint problem solving, persuasive attempts, and low use of avoidance and destructive conflict resolution tactics. The research found that buyers did not find any significant relationship between the auction application and the predictors of the success of the supplier strategic alliances. Finally, the study concluded that buyers value the importance of the strategic relationships with their suppliers more than the promised reduction of purchase prices when outsourcing products and/or services using an online reverse auction.
Advisor’s Approval: _______________________________________________________Dr. Ricki G. Ingalls