I.J. Information Technology and Computer Science, 2013, 03, 29-39
Published Online February 2013 in MECS (http://www.mecs-press.org/)
DOI: 10.5815/ijitcs.2013.03.04
Copyright © 2013 MECS I.J. Information Technology and Computer Science, 2013, 03, 29-39
Implementing Delaunay Triangles and Bezier
Curves to Identify Suitable Business Locations in
the Presence of Obstacles
Tejas Pattabhi
PESIT South Campus, Bangalore, India
[email protected]
Arti Arya
PESIT South Campus, Bangalore, India
[email protected]
Pradyumna N
PESIT South Campus, Bangalore, India
[email protected]
Swati Singh
PESIT South Campus, Bangalore, India
[email protected]
Sukanya D
PESIT South Campus, Bangalore, India
[email protected]
Abstract— Data min ing plays an important role in
collecting informat ion to make businesses more
competitive in present business world. It is seen that the
location of any business outlet is a major factor of its
success. Establishing different business enterprises
include a detail study of localit ies, people's income
status liv ing in those areas, and many other non-spatial
factors. This paper is one such idea to suggest those
locations for entrepreneurs, based on which they can
decide on the where they can setup their business outlet.
The proposed algorithm makes use of Delaunay
triangulation for capturing spatial proximity and Bezier
curves are used to model obstacles. The algorithm is
implemented as Web application, which accepts the
name of a place and collects data, form clusters and
show the feasible locations of the service specified,
considering the geographic irregularit ies and man-made
obstructions. In this algorithm, spatial and non-spatial
data related to a location are collected and the spatial
clustering algorithm is in itiated which works based on
the obtained data. Clusters are formed based on the
unique characteristics of each location. The
experimental results are conducted on many different
locations of India and in this paper results are shown for
three places namely, Mysuru, Patna and Mumbai. The
results have shown expected and exciting results.
Index Terms— Bezier Curves, Computational
Geometry, Delaunay Triangulation, Spatial Data
Attributes, Non-Spatial Data Attributes
I. Introduction
In today‘s rapidly changing, highly competitive
business world to make maximum profit, data mining
plays an important role. Profit made by any business
sector depends to a very large extent on its location.
Selecting the location for any business enterprise
depends on a number of spatial and non-spatial
attributes. Relevant data are paramount to an
application‘s capability to provide accurate and
actionable informat ion. Various data min ing techniques
can be useful in providing the solution.
Considering the business point of view, it is seen that
the location of any business outlet is one of the essential
and crit ical factors of its success. Any outlet put up in
an inappropriate location may lead to financial and
economic losses. Analyzing the need of any service at a
location is very important. In such scenarios, this
algorithm‘s applicat ion can be a guide. It locates the
areas where an essential business sector can be
established based on spatial and non-spatial attributes.
30 Implementing Delaunay Triangles and Bezier Curves to
Identify Suitable Business Locations in the Presence of Obstacles
Copyright © 2013 MECS I.J. Information Technology and Computer Science, 2013, 03, 29-39
This in turn is profitable to the entrepreneur and can
earn a good profit out of his service.
The scope of application is in various fields of
business. An entrepreneur can select the places most
suitable for his/her business without actually visiting the
places. A person using this application can narrow
down his search to a limited number of places.
Initially, during the setup phase of a business, an
entrepreneur can save his time in decid ing upon a
location. A person new to a place can rely on this
application to find locations that are highly profitable
for his business. It is also applicable to established
enterprises in order to relocate or open more number of
outlets within a city. For example, a school, established
in one area, can open its branches further in various
localities of the same city. This application helps in
business widening also.
Many marketing firms, business retail outlets,
services exist in the market that is not successfully
established. Though, there is a need for those products
and services, it is not reaching the people demanding
for it. Th is is mainly due to the inappropriate location of
those business outlets. This can be avoided if these
outlets are in the locations where there is a demand.
This problem can be addressed by locating the places of
demand. If a solution is found, it is helpful to the
businessmen, for earning good profits.
This application that takes in the name of a particu lar
city that the user specifies as input and gives the map
marked with the best suitable places as the output. For
this application, the spatial and non-spatial data of the
city specified, is collected and clustered those places
which the user can further survey and setup his business.
Before continuing further, a few basic concepts used for
developing the proposed algorithm:
1.1 Spatial Clustering
Spatial clustering [14] is the technique which groups
the spatial objects into groups and is an important
component of spatial data mining. In spatial clustering
the intra-cluster distance between the objects must be
less and inter-cluster distance must be more so as to
have well defined clusters.
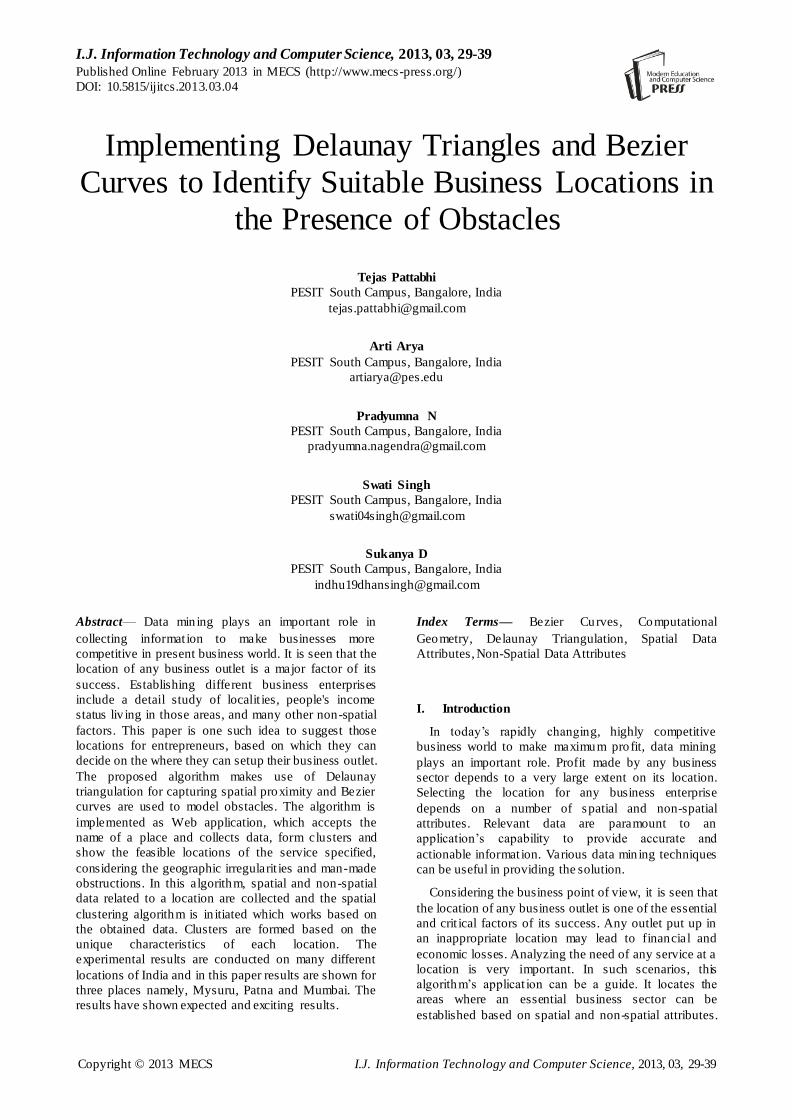
1.2 Delaunay Triangles
Delaunay triangle [6, 15] is a geometric structure
from computational geometry, which is used for
capturing the spatial proximity between the objects as
shown in figure 1. For a set of points in a p lane,
Delaunay Structure is a triangulation such that no point
or object is inside the circumcircle of any triangle. It
maximizes the minimum angle of all the t riangles in the
triangulation. If a set of points is on the same line then
Delaunay Triangulation does not exist for such points.
If more than three points lie on the same circle then
Delaunay Triangulation for such points is not unique. It
is highly useful for capturing the spatial proximity
between two points.
Fig. 1: A Delaunay triangulation
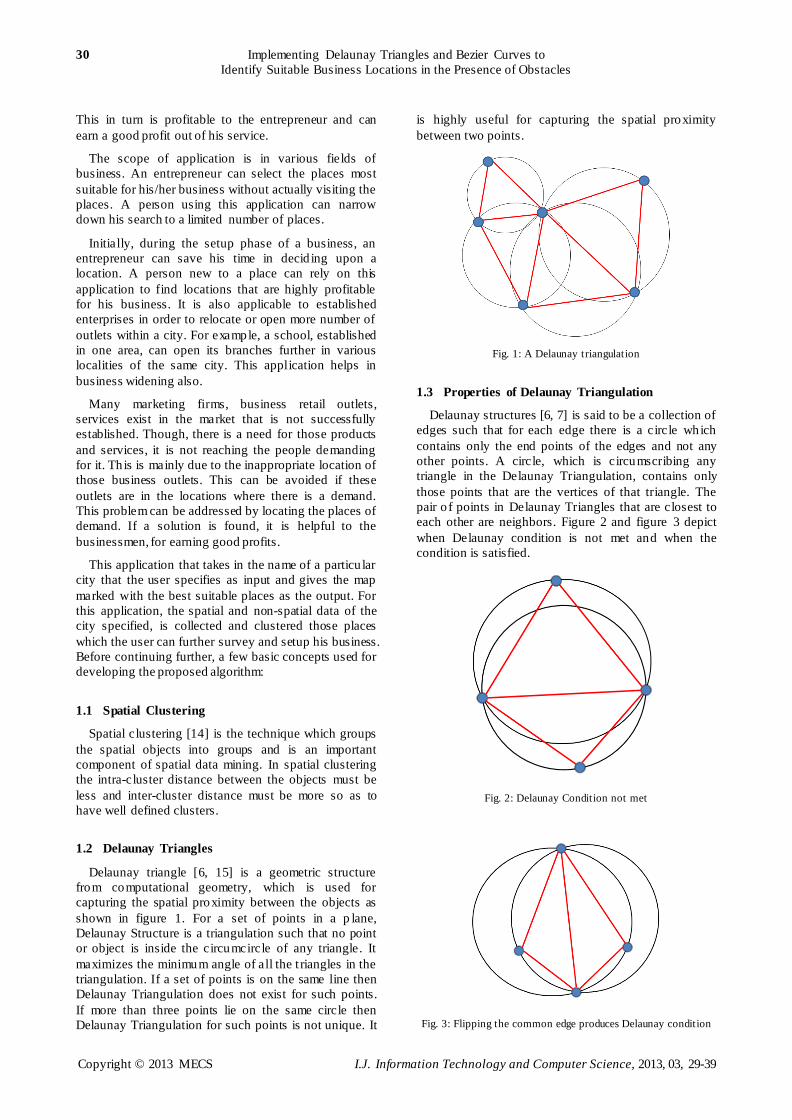
1.3 Properties of Delaunay Triangulation
Delaunay structures [6, 7] is said to be a collection of
edges such that for each edge there is a circle which
contains only the end points of the edges and not any
other points. A circle, which is circumscribing any
triangle in the Delaunay Triangulation, contains only
those points that are the vertices of that triangle. The
pair o f points in Delaunay Triangles that are closest to
each other are neighbors. Figure 2 and figure 3 depict
when Delaunay condition is not met and when the
condition is satisfied.
Fig. 2: Delaunay Condition not met
Fig. 3: Flipping the common edge produces Delaunay condition
Implement ing Delaunay Triangles and Bezier Curves to 31
Identify Suitable Business Locations in the Presence of Obstacles
Copyright © 2013 MECS I.J. Information Technology and Computer Science, 2013, 03, 29-39
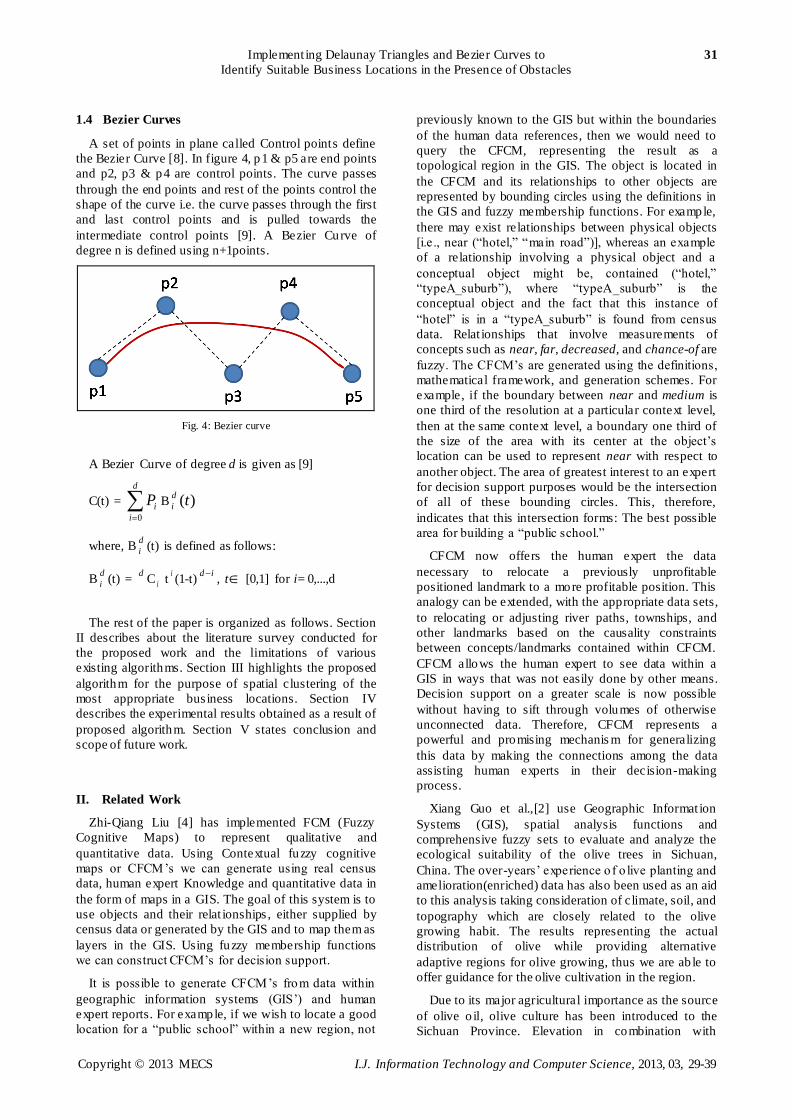
1.4 Bezier Curves
A set of points in plane called Control points define
the Bezier Curve [8]. In figure 4, p1 & p5 are end points
and p2, p3 & p4 are control points. The curve passes
through the end points and rest of the points control the
shape of the curve i.e. the curve passes through the first
and last control points and is pulled towards the
intermediate control points [9]. A Bezier Curve of
degree n is defined using n+1points.
Fig. 4: Bezier curve
A Bezier Curve of degree d is given as [9]
C(t) =
d
i
iP0
B )(td
i
where, Bd
i (t) is defined as follows:
Bd
i (t) = d
C i ti(1-t)
id, t [0,1] for i= 0,...,d
The rest of the paper is organized as follows. Section
II describes about the literature survey conducted for
the proposed work and the limitations of various
existing algorithms. Section III highlights the proposed
algorithm for the purpose of spatial clustering of the
most appropriate business locations. Section IV
describes the experimental results obtained as a result of
proposed algorithm. Section V states conclusion and
scope of future work.
II. Related Work
Zhi-Qiang Liu [4] has implemented FCM (Fuzzy
Cognitive Maps) to represent qualitative and
quantitative data. Using Contextual fuzzy cognitive
maps or CFCM‘s we can generate using real census
data, human expert Knowledge and quantitative data in
the form of maps in a GIS. The goal of this system is to
use objects and their relat ionships , either supplied by
census data or generated by the GIS and to map them as
layers in the GIS. Using fuzzy membership functions
we can construct CFCM‘s for decision support.
It is possible to generate CFCM‘s from data within
geographic information systems (GIS‘) and human
expert reports. For example, if we wish to locate a good
location for a ―public school‖ within a new region, not
previously known to the GIS but within the boundaries
of the human data references, then we would need to
query the CFCM, representing the result as a
topological region in the GIS. The object is located in
the CFCM and its relationships to other objects are
represented by bounding circles using the definitions in
the GIS and fuzzy membership functions. For example,
there may exist relationships between physical objects
[i.e ., near (―hotel,‖ ―main road‖)], whereas an example
of a relationship involving a physical object and a
conceptual object might be, contained (―hotel,‖
―typeA_suburb‖), where ―typeA_suburb‖ is the
conceptual object and the fact that this instance of
―hotel‖ is in a ―typeA_suburb‖ is found from census
data. Relat ionships that involve measurements of
concepts such as near, far, decreased, and chance-of are
fuzzy. The CFCM‘s are generated using the definitions,
mathematical framework, and generation schemes. For
example, if the boundary between near and medium is
one third of the resolution at a particular context level,
then at the same context level, a boundary one third of
the size of the area with its center at the object‘s
location can be used to represent near with respect to
another object. The area of greatest interest to an expert
for decision support purposes would be the intersection
of all of these bounding circles. This, therefore,
indicates that this intersection forms: The best possible
area for building a ―public school.‖
CFCM now offers the human expert the data
necessary to relocate a previously unprofitable
positioned landmark to a more profitable position. This
analogy can be extended, with the appropriate data sets,
to relocating or adjusting river paths, townships, and
other landmarks based on the causality constraints
between concepts/landmarks contained within CFCM.
CFCM allows the human expert to see data within a
GIS in ways that was not easily done by other means.
Decision support on a greater scale is now possible
without having to sift through volumes of otherwise
unconnected data. Therefore, CFCM represents a
powerful and promising mechanis m for generalizing
this data by making the connections among the data
assisting human experts in their decision-making
process.
Xiang Guo et al.,[2] use Geographic Informat ion
Systems (GIS), spatial analysis functions and
comprehensive fuzzy sets to evaluate and analyze the
ecological suitability of the olive trees in Sichuan,
China. The over-years‘ experience o f o live planting and
amelioration(enriched) data has also been used as an aid
to this analysis taking consideration of climate, soil, and
topography which are closely related to the olive
growing habit. The results representing the actual
distribution of olive while providing alternative
adaptive regions for olive growing, thus we are ab le to
offer guidance for the olive cultivation in the region.
Due to its major agricultural importance as the source
of olive o il, olive culture has been introduced to the
Sichuan Province. Elevation in combination with
32 Implement ing Delaunay Triangles and Bezier Curves to
Identify Suitable Business Locations in the Presence of Obstacles
Copyright © 2013 MECS I.J. Information Technology and Computer Science, 2013, 03, 29-39
topography leads to vertical differentiat ion, forming
complicated spatial distribution patterns of climate
types and soils. GIS and fuzzy comprehensive judgment
are employed to analyze and evaluate the ecological
suitability for the olive trees. The fuzzy comprehensive
judgment is main ly based on fuzzy inference combining
qualitative and non-accurate analysis. The standards of
evaluation are divided into four ranks, the adaptable,
sub-adaptable, minimum-adaptable and non-adaptable.
The analytic hierarchy process is used to determine the
weight factors in the secondary evaluation model. The
judgment matrix is established based on suggestion
from experts and the hierarchy structure model. If all
the judgment matrices pass the consistency test, the
Analytic Hierarchy Process (AHP) levels will be sorted.
The membership function is established to evaluate the
suitability degree of each basic unit by calculating
membership degree of each factor to a certain suitability
rank. A zoning map of the ecological suitability of
Sichuan Olive is obtained through the GIS-based fuzzy
comprehensive evaluation. The map obtained through
GIS-based fuzzy comprehensive evaluation is able to
give very detailed evaluation results.
In this paper, GIS and fuzzy comprehensive
evaluation is employed to evaluate the ecological
suitability of olive cultivation in Sichuan. In order to
ensure an objective and precise evaluation result,
analytic hierarchy process is used to obtain the weight
of index according to the suggestions of experts while
properly selecting the membership function. The results
should be adjusted when additional factors such as
landslide and debris flow are taken into consideration in
practical planning work. The result of this evaluation is
able to direct the industry of olive cu ltivation in Sichuan
and helps to generate more economic profits.
H. M. Khodr et al.[3] present a probabilistic
methodology; conceived to assist the electric system
planning engineers in the selection of the distribution
substation locations, taking into account the hourly load
changes or the daily load cycle. The hourly load centers,
for each of the different hourly load scenarios, are
calculated deterministically. This distribution is used to
determine the maximum likelihood perimeter o f the
area where the substation should preferably be located
by the planning engineers, taking into account, for
example, the availability and the cost of the land lots,
which are factors of special relevance in urban areas, as
well as other obstacles that may be present in the final
selection of the substation site. Results are presented
and discussed for the application of the methodology to
a real case, assuming three different bivariate
probability distributions: the Gaussian distribution, a
bivariate version of Freund‘s exponential distribution,
and the Weibull probability distribution.
The location of a substation site depends upon
several factors, such as the voltage levels, voltage
regulation, substation costs, primary feeders,
distribution transformers, and sub-transmission costs,
etc. methodologies have been proposed in the literature
for the solution of the electric distribution substation. In
general, d ifferent mathematical programming
formulat ions and techniques have been proposed and
applied to the location problem of electrical distribution
substations location problem. However, most of these
deterministic methodologies are based on the analysis
of a constant load level, normally assumed as the
maximum load level. This assumption of a constant
load level may deviate the solution from a better
location, since the maximum load normally takes place
only during a short time period, the load cycles of the
consumers are different, and therefore, the best
substation location changes for each hourly load
scenario, and will d isplace continuously in the plane
describing a closed trajectory. On the other hand, the
deterministic calculation of an equivalent load center
may find obstacles for the final selection of the
substation site due to a number of constraints that are
present in a real situation. In this article, a probabilistic
methodology is presented to calculate the perimeter of
the area where the load center has maximum likelihood
to be found, taking into account in the planning process
the hourly load changes or load cycle. With this
perimeter calculated, the final decision of locating the
substation site should be made within the calculated
area, considering the availability of the land lots, the
market prices, and several other factors.
A probabilistic methodology is presented to assist the
planning engineers in the selection of the distribution
substation location. The methodology considers the
hourly load changes and calculates an estimate
probability distribution in order to determine a
recommended perimeter for the selection of the
substation location associated to the high-probability
area for a given probability level. Three different
probability distribution types were successfully tested
on a realistic case, and results are presented showing the
potential of the proposed approach. The resultant
perimeter represents valuable information for the for the
location of the distribution substation, where the
availability and the cost of the land lots as well as other
relevant constraints that may be present in the selection
of the substation site must be considered, especially in
urban areas.
S. Subramaniam et al.[1] have developed a new
knowledge-based algorithm using mult i-temporal
spectral information available in four bands of
Advanced Wide Field Sensor (AWiFS) on board
ResourceSat-1 (with spatial resolution of 56 m) namely
Green (G), Red (R), Near Infrared (NIR) and Short
Wave Infrared (SWIR) for inventorying and monitoring
of various types water bodies. The algorithm has been
applied for the data obtained from other space-borne
sensors with similar spectral bands such as Landsat
ETM, IRS LISS III and ASTER and found to be
working satisfactorily. Results were validated by
comparing the results reported from other popular
methods. The study provides a quick method for
generation of spatio-temporal water body‘s informat ion.
Implement ing Delaunay Triangles and Bezier Curves to 33
Identify Suitable Business Locations in the Presence of Obstacles
Copyright © 2013 MECS I.J. Information Technology and Computer Science, 2013, 03, 29-39
This will be helpful for development of Water bodies
Information System (WIS) on national/global scales.
This is almost similar to our project; here the spatial
data is analyzed and clustered to find the water bodies
in a given area. Here they have used the clustering
algorithms to not only to cluster the data, but also to
eliminate noises like clouds and so on.
In literature many clustering algorithms are available
like DBRS+ [5], COD_CLARANS[10], AutoClust+
[11], DBCluC[12], DBRS_O[13] etc. Xin Wang,
Camilo Rostoker, and Howard J. Hamilton [5] propose
a new spatial clustering method, called DBRS+, which
aims to cluster spatial data in the presence of both
obstacles and facilitators. It can handle datasets with
intersected obstacles and facilitators. Without pre-
processing, DBRS+ processes constraints during
clustering. It can find clusters with arbitrary shapes and
varying densities. DBRS+ has been empirically
evaluated using synthetic and real data sets and its
performance has been compared to DBRS,
AUTOCLUST+ [11], and DBCLuC [12]. This paper
talks about a new density based clustering algorithm,
which clusters the data in the presence of obstacles
(such as, mountains, rivers, h ighways and so on). It also
provides a new feature called facilitators that are used to
connect data objects across obstacles. These improve
the efficiency of and provides a better clustered data
output.
The review of literature in the field has spotlighted
some limitations in the existing work that are as follows:
1. The existing systems use polygons for modeling
obstacles. Polygons are highly intensive in
computation and space.
2. The spatial proximity is not very clear due to the
usage of Polygons for its identification.
3. The modeling of obstacles is weak when polygons
are considered.
4. Most of the existing systems use density based
clustering algorithms and graph based clustering in
the presence of obstacles has not been explored
much.
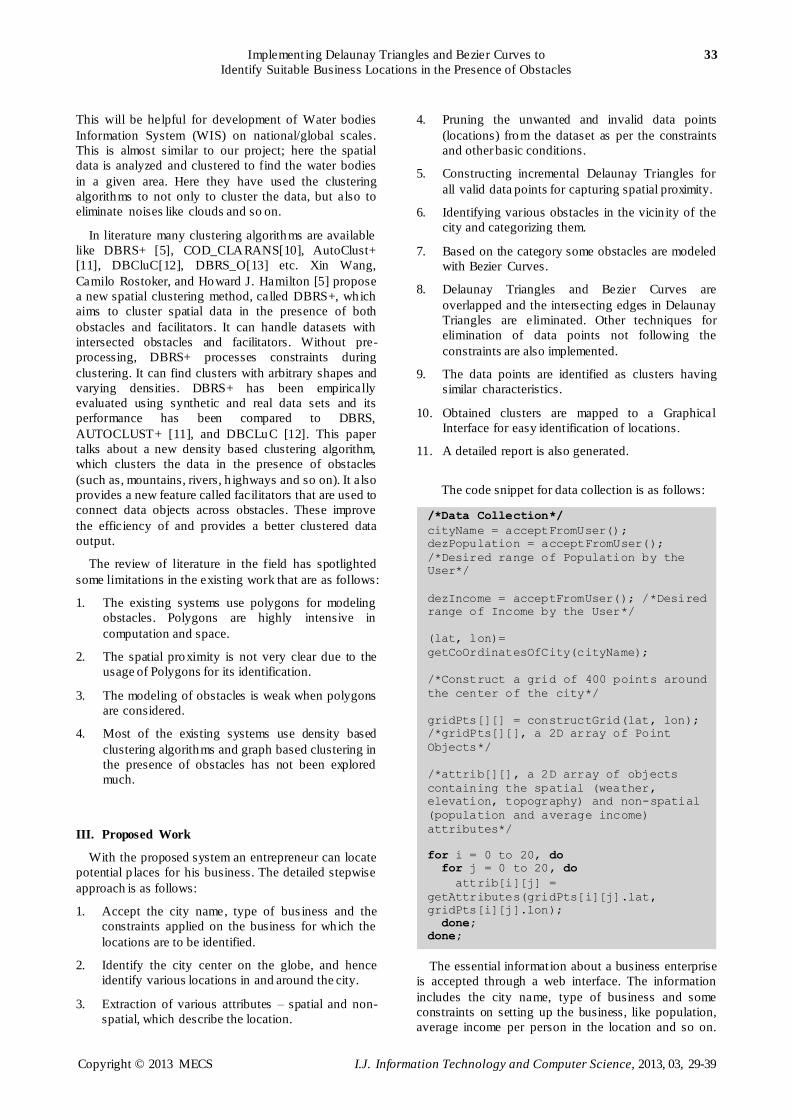
III. Proposed Work
With the proposed system an entrepreneur can locate
potential p laces for his business. The detailed stepwise
approach is as follows:
1. Accept the city name, type of bus iness and the
constraints applied on the business for which the
locations are to be identified.
2. Identify the city center on the globe, and hence
identify various locations in and around the city.
3. Extraction of various attributes – spatial and non-
spatial, which describe the location.
4. Pruning the unwanted and invalid data points
(locations) from the dataset as per the constraints
and other basic conditions.
5. Constructing incremental Delaunay Triangles for
all valid data points for capturing spatial proximity.
6. Identifying various obstacles in the vicin ity of the
city and categorizing them.
7. Based on the category some obstacles are modeled
with Bezier Curves.
8. Delaunay Triangles and Bezier Curves are
overlapped and the intersecting edges in Delaunay
Triangles are eliminated. Other techniques for
elimination of data points not following the
constraints are also implemented.
9. The data points are identified as clusters having
similar characteristics.
10. Obtained clusters are mapped to a Graphical
Interface for easy identification of locations.
11. A detailed report is also generated.
The code snippet for data collection is as follows:
The essential informat ion about a business enterprise
is accepted through a web interface. The information
includes the city name, type of business and some
constraints on setting up the business, like population,
average income per person in the location and so on.
/*Data Collection*/
cityName = acceptFromUser();
dezPopulation = acceptFromUser();
/*Desired range of Population by the
User*/
dezIncome = acceptFromUser(); /*Desired
range of Income by the User*/
(lat, lon)=
getCoOrdinatesOfCity(cityName);
/*Construct a grid of 400 points around
the center of the city*/
gridPts[][] = constructGrid(lat, lon);
/*gridPts[][], a 2D array of Point
Objects*/
/*attrib[][], a 2D array of objects
containing the spatial (weather,
elevation, topography) and non-spatial
(population and average income)
attributes*/
for i = 0 to 20, do
for j = 0 to 20, do
attrib[i][j] =
getAttributes(gridPts[i][j].lat,
gridPts[i][j].lon);
done;
done;
34 Implement ing Delaunay Triangles and Bezier Curves to
Identify Suitable Business Locations in the Presence of Obstacles
Copyright © 2013 MECS I.J. Information Technology and Computer Science, 2013, 03, 29-39
Based on the city name specified, the location of the
central point of the city is identified. The locations
within the rad ius of 19 to 20 km from the center of the
city are determined. For all the determined locations,
the spatial in formation like elevation from sea level and
weather details, and non-spatial information like
population and average income per person for each
location are extracted from Google XML pages.
Thus, the collected informat ion for each location is
pre-processed to remove unwanted and invalid data
points. Following is the code for data pre-processing:
The extracted information may contain redundant
entries and some data points may v iolate the constraints
specified. The pseudo code to remove these data points
is as shown below.
The unwanted, unnamed, redundant and constraint
violated data are removed. Some data points may lay
out of the specified city (termed as unwanted points)
and some data points may fall under the same locality
of the city (termed as redundant points). Some data
points may not satisfy some basic conditions or may not
satisfy the constraints specified by the user. Such points
are also eliminated.
The obtained valid data points are subjected to
―Incremental Delaunay Triangulation‖ [6, 7]. Delaunay
triangles are used to find the spatial proximity between
data points (locations) efficiently. Init ially, an edge is
drawn between the closest two points and the third point
of the triangle should lie on the circumcircle,
circumscrib ing these three points. Similarly, the
triangles are constructed for all the data points in an
incremental fashion.
Obstacles are data points that are not suitable for
establishing business enterprises as they do not satisfy
certain constraints or fail to meet some basic conditions.
The characteristics of an obstacle point are d ifferent
from the surrounding valid data points. At this phase,
the data points can be obstacle points based on the
irregularity in spatial attributes describing them.
Obstacle points can either be a single data point (lake or
pond or a mountain) or a sequence of data points( like
river, highway, mountain range or border of a state or
country) that can be modeled as a curve. Thus, these
obstacles should be identified and categorized
appropriately. The pseudo code for identify ing obstacles
is given below:
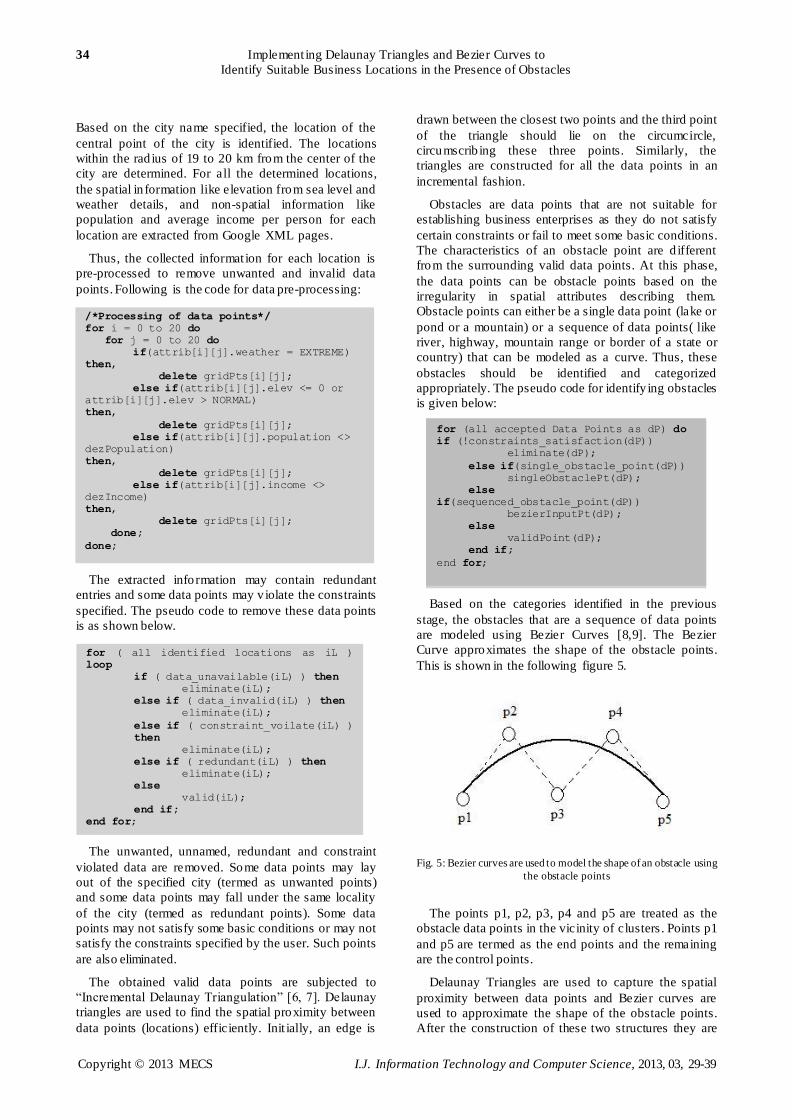
Based on the categories identified in the previous
stage, the obstacles that are a sequence of data points
are modeled using Bezier Curves [8,9]. The Bezier
Curve approximates the shape of the obstacle points.
This is shown in the following figure 5.
Fig. 5: Bezier curves are used to model the shape of an obstacle using
the obstacle points
The points p1, p2, p3, p4 and p5 are treated as the
obstacle data points in the vicinity of clusters . Points p1
and p5 are termed as the end points and the remaining
are the control points.
Delaunay Triangles are used to capture the spatial
proximity between data points and Bezier curves are
used to approximate the shape of the obstacle points.
After the construction of these two structures they are
for (all accepted Data Points as dP) do
if (!constraints_satisfaction(dP))
eliminate(dP);
else if(single_obstacle_point(dP))
singleObstaclePt(dP);
else
if(sequenced_obstacle_point(dP))
bezierInputPt(dP);
else
validPoint(dP);
end if;
end for;
/*Processing of data points*/
for i = 0 to 20 do
for j = 0 to 20 do
if(attrib[i][j].weather = EXTREME)
then,
delete gridPts[i][j];
else if(attrib[i][j].elev <= 0 or
attrib[i][j].elev > NORMAL)
then,
delete gridPts[i][j];
else if(attrib[i][j].population <>
dezPopulation)
then,
delete gridPts[i][j];
else if(attrib[i][j].income <>
dezIncome)
then,
delete gridPts[i][j];
done;
done;
for ( all identified locations as iL )
loop
if ( data_unavailable(iL) ) then
eliminate(iL);
else if ( data_invalid(iL) ) then
eliminate(iL);
else if ( constraint_voilate(iL) )
then
eliminate(iL);
else if ( redundant(iL) ) then
eliminate(iL);
else
valid(iL);
end if;
end for;
Implement ing Delaunay Triangles and Bezier Curves to 35
Identify Suitable Business Locations in the Presence of Obstacles
Copyright © 2013 MECS I.J. Information Technology and Computer Science, 2013, 03, 29-39
overlapped such that the edges of the Delaunay
triangles that are intersected by the Bezier curves are
rejected. The characteristics of the overlapped edges fall
under the category of obstacles. This divides a big
group of points into smaller sets of them, forming
smaller Delaunay Triangles. Some of the data points
that do not satisfy the given constraints are also
eliminated by checking if any of those points overlap
with the considered set of Delaunay Triangle‘s edges or
points.
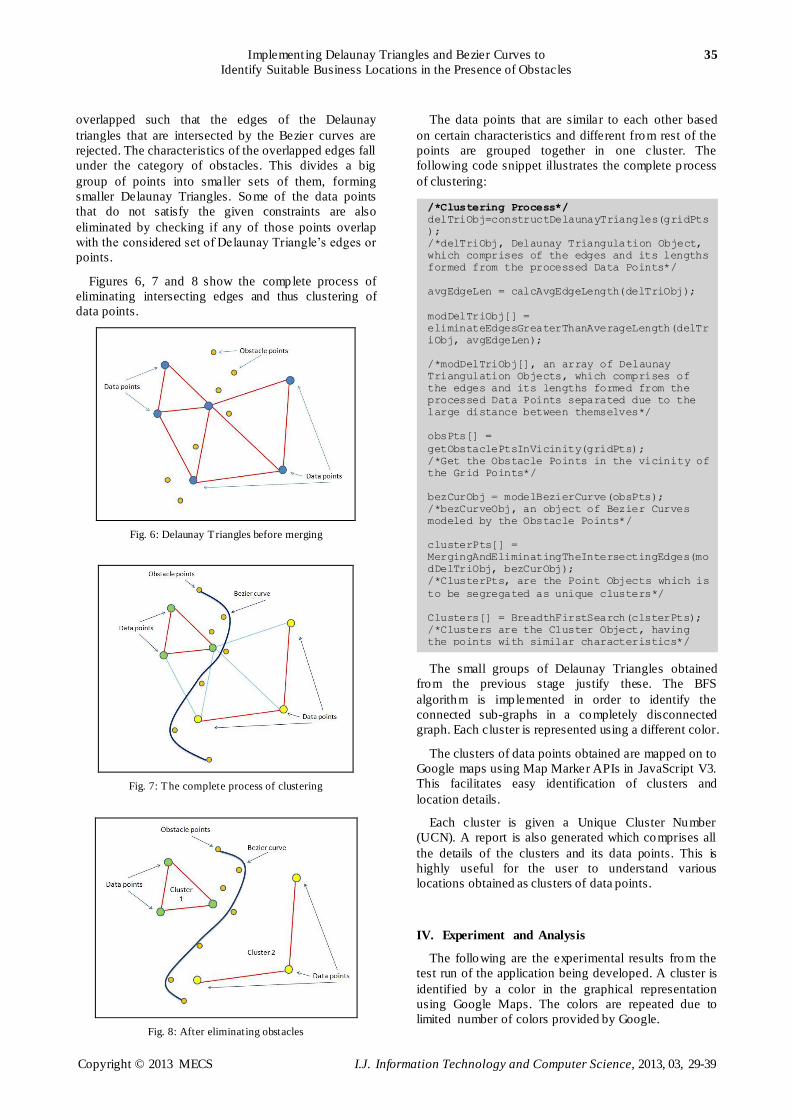
Figures 6, 7 and 8 show the complete process of
eliminating intersecting edges and thus clustering of
data points.
Fig. 6: Delaunay Triangles before merging
Fig. 7: The complete process of clustering
Fig. 8: After eliminating obstacles
The data points that are similar to each other based
on certain characteristics and different from rest of the
points are grouped together in one cluster. The
following code snippet illustrates the complete p rocess
of clustering:
The small groups of Delaunay Triangles obtained
from the previous stage justify these. The BFS
algorithm is implemented in order to identify the
connected sub-graphs in a completely disconnected
graph. Each cluster is represented using a different color.
The clusters of data points obtained are mapped on to
Google maps using Map Marker APIs in JavaScript V3.
This facilitates easy identification of clusters and
location details.
Each cluster is given a Unique Cluster Number
(UCN). A report is also generated which comprises all
the details of the clusters and its data points. This is
highly useful for the user to understand various
locations obtained as clusters of data points.
IV. Experiment and Analysis
The following are the experimental results from the
test run of the application being developed. A cluster is
identified by a color in the graphical representation
using Google Maps. The colors are repeated due to
limited number of colors provided by Google.
/*Clustering Process*/
delTriObj=constructDelaunayTriangles(gridPts
);
/*delTriObj, Delaunay Triangulation Object,
which comprises of the edges and its lengths
formed from the processed Data Points*/
avgEdgeLen = calcAvgEdgeLength(delTriObj);
modDelTriObj[] =
eliminateEdgesGreaterThanAverageLength(delTr
iObj, avgEdgeLen);
/*modDelTriObj[], an array of Delaunay
Triangulation Objects, which comprises of
the edges and its lengths formed from the
processed Data Points separated due to the
large distance between themselves*/
obsPts[] =
getObstaclePtsInVicinity(gridPts);
/*Get the Obstacle Points in the vicinity of
the Grid Points*/
bezCurObj = modelBezierCurve(obsPts);
/*bezCurveObj, an object of Bezier Curves
modeled by the Obstacle Points*/
clusterPts[] =
MergingAndEliminatingTheIntersectingEdges(mo
dDelTriObj, bezCurObj);
/*ClusterPts, are the Point Objects which is
to be segregated as unique clusters*/
Clusters[] = BreadthFirstSearch(clsterPts);
/*Clusters are the Cluster Object, having
the points with similar characteristics*/
36 Implement ing Delaunay Triangles and Bezier Curves to
Identify Suitable Business Locations in the Presence of Obstacles
Copyright © 2013 MECS I.J. Information Technology and Computer Science, 2013, 03, 29-39
Hence, similar color points far from each other
belong to different clusters. To avoid ambiguity, a
detailed PDF report is generated by the application. The
experiments are explained in three cases:
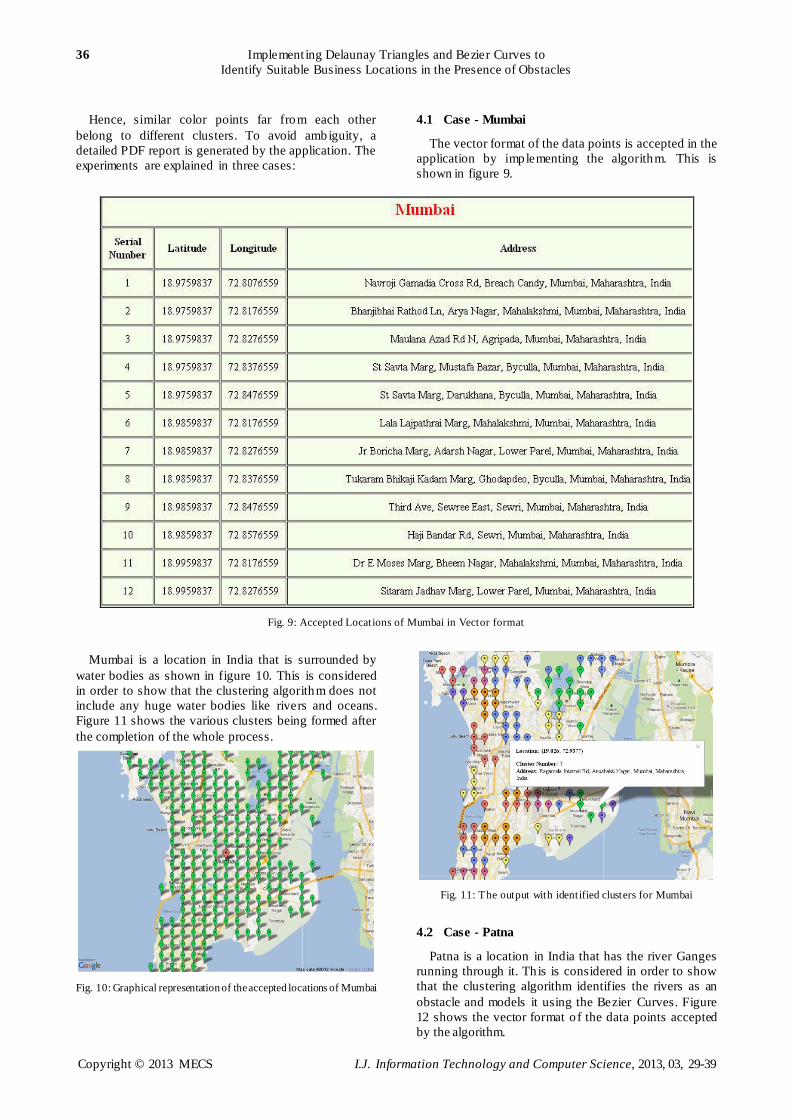
4.1 Case - Mumbai
The vector format of the data points is accepted in the
application by implementing the algorithm. This is
shown in figure 9.
Fig. 9: Accepted Locations of Mumbai in Vector format
Mumbai is a location in India that is surrounded by
water bodies as shown in figure 10. This is considered
in order to show that the clustering algorithm does not
include any huge water bodies like rivers and oceans.
Figure 11 shows the various clusters being formed after
the completion of the whole process.
Fig. 10: Graphical representation of the accepted locations of Mumbai
Fig. 11: The output with identified clusters for Mumbai
4.2 Case - Patna
Patna is a location in India that has the river Ganges
running through it. Th is is considered in order to show
that the clustering algorithm identifies the rivers as an
obstacle and models it using the Bezier Curves. Figure
12 shows the vector format o f the data points accepted
by the algorithm.
Implement ing Delaunay Triangles and Bezier Curves to 37
Identify Suitable Business Locations in the Presence of Obstacles
Copyright © 2013 MECS I.J. Information Technology and Computer Science, 2013, 03, 29-39
Fig. 12: Accepted Locations of Patna in Vector format
Figure 13 represents all the locations accepted by the
algorithm and Figure 14 show the clusters being
obtained.
Fig. 13: Graphical representation of the accepted locations of Patna
Fig. 14: The output with identified clusters for Patna
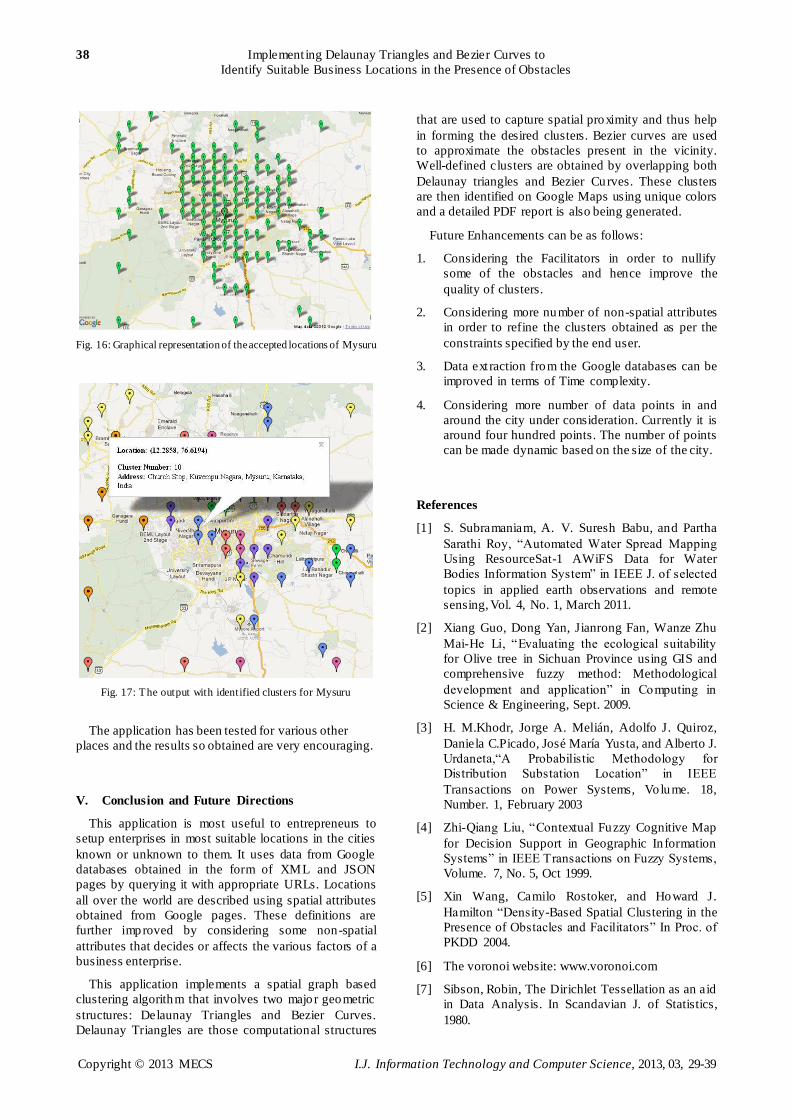
4.3 Case - Mysuru
Mysuru is a location in India that has the landmasses
surrounding it. This is considered to demonstrate the
algorithms action in complete landmasses. Here in case
3 also, figure 15 shows the vector format o f the data
points extracted, figure 16 represents these data points
on Google map and figure 17 represents the clusters so
obtained after eliminating all unnecessary and unwanted
data points.
Fig. 15: Accepted Locations of Mysuru in Vector format
38 Implement ing Delaunay Triangles and Bezier Curves to
Identify Suitable Business Locations in the Presence of Obstacles
Copyright © 2013 MECS I.J. Information Technology and Computer Science, 2013, 03, 29-39
Fig. 16: Graphical representation of the accepted locations of Mysuru
Fig. 17: The output with identified clusters for Mysuru
The application has been tested for various other
places and the results so obtained are very encouraging.
V. Conclusion and Future Directions
This application is most useful to entrepreneurs to
setup enterprises in most suitable locations in the cities
known or unknown to them. It uses data from Google
databases obtained in the form of XML and JSON
pages by querying it with appropriate URLs. Locations
all over the world are described using spatial attributes
obtained from Google pages. These definitions are
further improved by considering some non-spatial
attributes that decides or affects the various factors of a
business enterprise.
This application implements a spatial graph based
clustering algorithm that involves two major geometric
structures: Delaunay Triangles and Bezier Curves.
Delaunay Triangles are those computational structures
that are used to capture spatial proximity and thus help
in forming the desired clusters. Bezier curves are used
to approximate the obstacles present in the vicinity.
Well-defined clusters are obtained by overlapping both
Delaunay triangles and Bezier Curves. These clusters
are then identified on Google Maps using unique colors
and a detailed PDF report is also being generated.
Future Enhancements can be as follows:
1. Considering the Facilitators in order to nullify
some of the obstacles and hence improve the
quality of clusters.
2. Considering more number of non-spatial attributes
in order to refine the clusters obtained as per the
constraints specified by the end user.
3. Data ext raction from the Google databases can be
improved in terms of Time complexity.
4. Considering more number of data points in and
around the city under consideration. Currently it is
around four hundred points. The number of points
can be made dynamic based on the size of the city.
References
[1] S. Subramaniam, A. V. Suresh Babu, and Partha
Sarathi Roy, ―Automated Water Spread Mapping
Using ResourceSat-1 AWiFS Data for Water
Bodies Information System‖ in IEEE J. of selected
topics in applied earth observations and remote
sensing, Vol. 4, No. 1, March 2011.
[2] Xiang Guo, Dong Yan, Jianrong Fan, Wanze Zhu
Mai-He Li, ―Evaluating the ecological suitability
for Olive tree in Sichuan Province using GIS and
comprehensive fuzzy method: Methodological
development and application‖ in Computing in
Science & Engineering, Sept. 2009.
[3] H. M.Khodr, Jorge A. Melián, Adolfo J. Quiroz,
Daniela C.Picado, José María Yusta, and Alberto J.
Urdaneta,―A Probabilistic Methodology for
Distribution Substation Location‖ in IEEE
Transactions on Power Systems, Volume. 18,
Number. 1, February 2003
[4] Zhi-Qiang Liu, ―Contextual Fuzzy Cognitive Map
for Decision Support in Geographic In formation
Systems‖ in IEEE Transactions on Fuzzy Systems,
Volume. 7, No. 5, Oct 1999.
[5] Xin Wang, Camilo Rostoker, and Howard J.
Hamilton ―Density-Based Spatial Clustering in the
Presence of Obstacles and Facilitators‖ In Proc. of
PKDD 2004.
[6] The voronoi website: www.voronoi.com
[7] Sibson, Robin, The Dirichlet Tessellation as an aid
in Data Analysis. In Scandavian J. of Statistics,
1980.
Implement ing Delaunay Triangles and Bezier Curves to 39
Identify Suitable Business Locations in the Presence of Obstacles
Copyright © 2013 MECS I.J. Information Technology and Computer Science, 2013, 03, 29-39
[8] Pu S ‗Managing Freform Curves & Surfaces in a
spatial DBMS. Master Thesis, July 2005.
[9] www.tdplines.com/resources/class
notes/BezierCurve.html
[10] Tung A.K.H., Hou J., and Han J.: Spatial
Clustering in the Presence of Obstacles. In Proc. of
Intl. Conf. on Data Engineering (ICDE'01),
Heidelberg, Germany,2001, pp. 359-367.
[11] Estivill-Castro V. and. Lee I.J.: AUTOCLUST+:
Automatic Clustering of Point-Data Sets in the
Presence of Obstacles. In Proc. of the Intl.
Workshop on Temporal, Spatial and Spatial-
Temporal Data Mining, Lyon, France, 2000, pp.
133-146.
[12] Zaïane O. R., and Lee C. H.: Clustering Spatial
Data When Facing Physical Constraints. In Proc.
of the IEEE International Conf. on Data Mining,
Maebashi City, Japan, 2002, pp.737-740
[13] Wang X. and Hamilton H.J.: Density-based spatial
clustering in the presence of obstacles. In Proc. of
17th
Intl. Flo rida Artificila Intelligence Research
Society Conference (FLAIRS 2004), pp.312-317,
Miami.
[14] Han, J. and Kamber, M. Data Mining: Concepts
and Techniques, Morgan Kaufmann Publishers,
2006.
[15] Atsuyuki O., Barry B., Kokich i S, Sungnok C:
Spatial Tessellations: Concepts & Applications of
Voronoi Diagrams, 2nd
Ed., 2000.
Authors’ Profiles
Tejas Pattabhi has completed his Bachelor of
Engineering in Informat ion Science from PESIT
Bangalore South Campus in July 2012. Currently, he is
working as Junior System Administrator in Societe
Generale-Global Solution Center. His research interests
include Spatial Data Mining, Geographical Information
Systems, Internet technologies.
Arti Arya has completed BSc(Mathematics Hons) in
1994 and MSc(Mathematics) in 1996 from Delhi
University. She has completed her Doctorate of
Philosophy in Computer Science Engineering from
Faculty of Technology and Engineering from Maharishi
Dayanand University, Rohtak, in 2008. Her areas of
interest include spatial data mining, knowledge based
systems, text min ing, unstructured data management,
applied numerical methods and biostatistics. She is a
life member of CSI and member IEEE. She is on the
reviewer board of many reputed International Journals.
She is currently serving as Professor and Head of the
Department (MCA), PES Institute of Technology,
Bangalore South Campus. She has more than twelve
years of teaching and six years of research experience.
Pradyumna N has completed his Bachelor of
Engineering in Informat ion Science from PESIT
Bangalore South Campus in Ju ly 2012. He is currently
working as Software Engineer in HCL-BOPT ETS,
Bangalore. His research interests include Knowledge
based systems, spatial clustering techniques,
unstructured database management.
Swati Singh has completed her Bachelor of
Engineering in Informat ion Science from PESIT
Bangalore South Campus in July 2012. Her interest
areas are unsupervised learning techniques and
Geographical Information Systems.
Sukanya Dhansingh has completed her Bachelor of
Engineering in Informat ion Science from PESIT
Bangalore South Campus in July 2012. Her areas of
interest include spatial data mining & spatial clustering
techniques.
How to cite this paper: Tejas Pattabhi, Arti Arya, Pradyumna
N, Swati Singh, Sukanya D,"Implementing Delaunay Triangles and Bezier Curves to Identify Suitable Business
Locations in the Presence of Obstacles", International Journal
of Information Technology and Computer Science(IJITCS),
vol.5, no.3, pp.29-39, 2013.DOI: 10.5815/ijitcs.2013.03.04