45
Implementing Increased Use of Reclaimed Asphalt Pavement (RAP) RAP Management Practice 9 May 2018
Implementing
Increased Use of
Reclaimed Asphalt
Pavement (RAP)
RAP Management
Practice
9 May 2018
Content
• Welcome
• Project scope
• Austroads
• Current RAP management process in WA
• Monthly data
• Variability during processing
• RAP management practice
• Discussion of trial process
• Summary of discussion
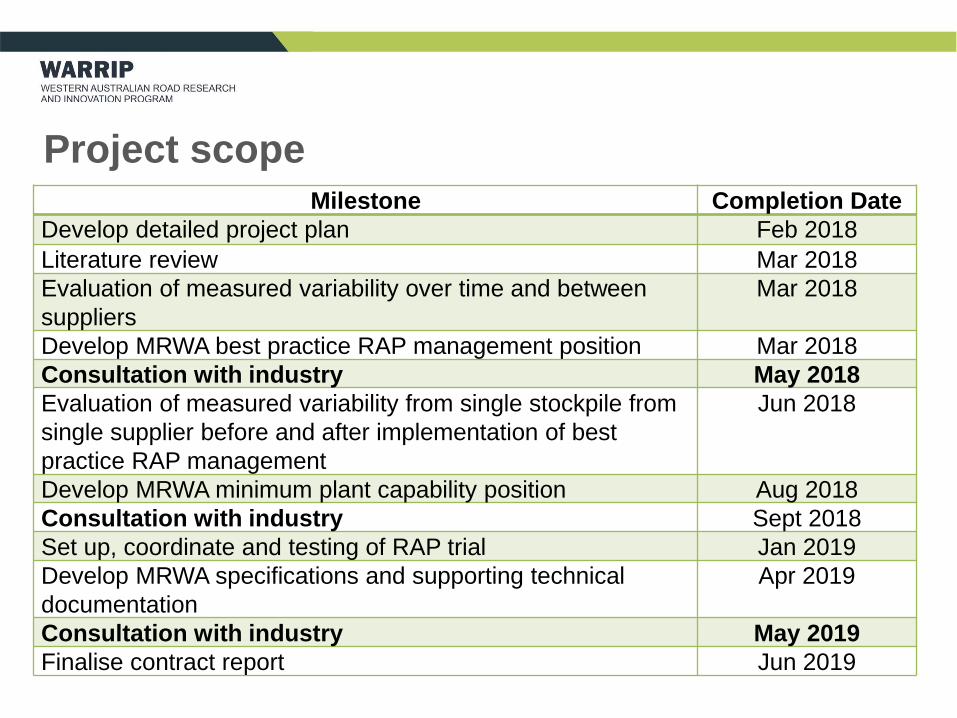
Project scopeMilestone Completion Date
Develop detailed project plan Feb 2018
Literature review Mar 2018
Evaluation of measured variability over time and between
suppliers
Mar 2018
Develop MRWA best practice RAP management position Mar 2018
Consultation with industry May 2018
Evaluation of measured variability from single stockpile from
single supplier before and after implementation of best
practice RAP management
Jun 2018
Develop MRWA minimum plant capability position Aug 2018
Consultation with industry Sept 2018
Set up, coordinate and testing of RAP trial Jan 2019
Develop MRWA specifications and supporting technical
documentation
Apr 2019
Consultation with industry May 2019
Finalise contract report Jun 2019
Austroads Process
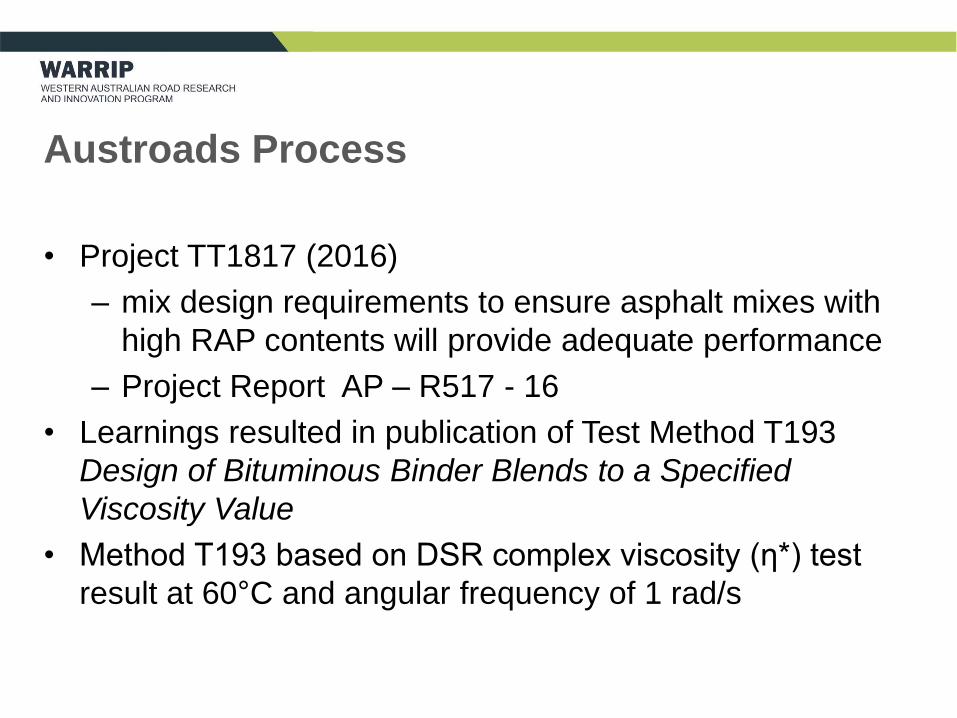
• Project TT1817 (2016)
– mix design requirements to ensure asphalt mixes with
high RAP contents will provide adequate performance
– Project Report AP – R517 - 16
• Learnings resulted in publication of Test Method T193
Design of Bituminous Binder Blends to a Specified
Viscosity Value
• Method T193 based on DSR complex viscosity (ƞ*) test
result at 60°C and angular frequency of 1 rad/s
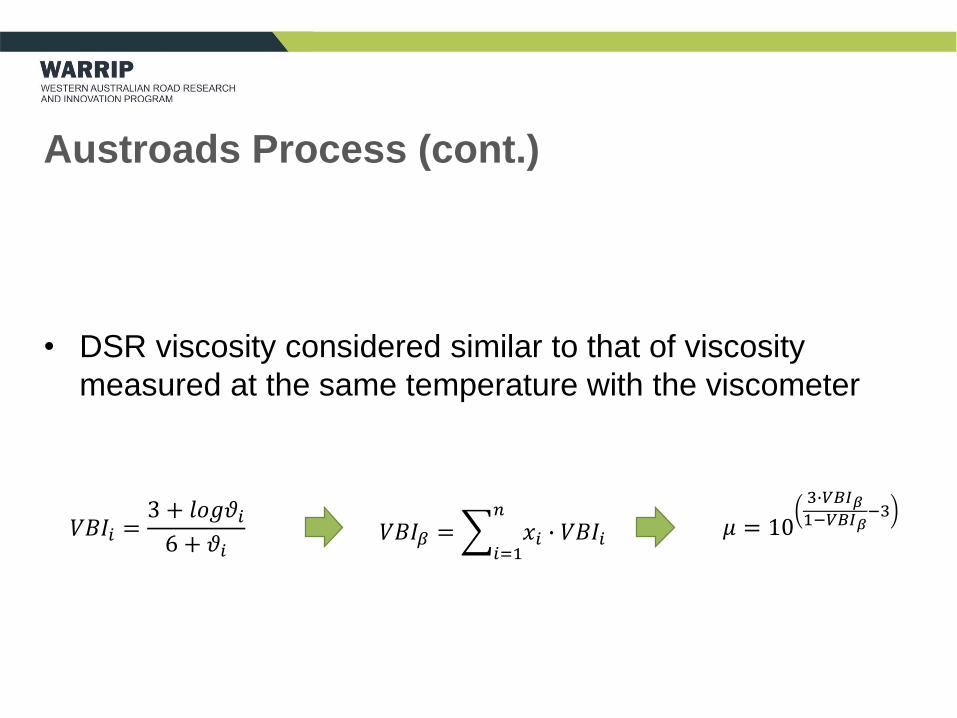
Austroads Process (cont.)
• DSR viscosity considered similar to that of viscosity
measured at the same temperature with the viscometer
𝑉𝐵𝐼𝑖 =3 + 𝑙𝑜𝑔𝜗𝑖6 + 𝜗𝑖
𝑉𝐵𝐼𝛽 =𝑖=1
𝑛
𝑥𝑖 ∙ 𝑉𝐵𝐼𝑖 𝜇 = 10
3∙𝑉𝐵𝐼𝛽1−𝑉𝐵𝐼𝛽
−3
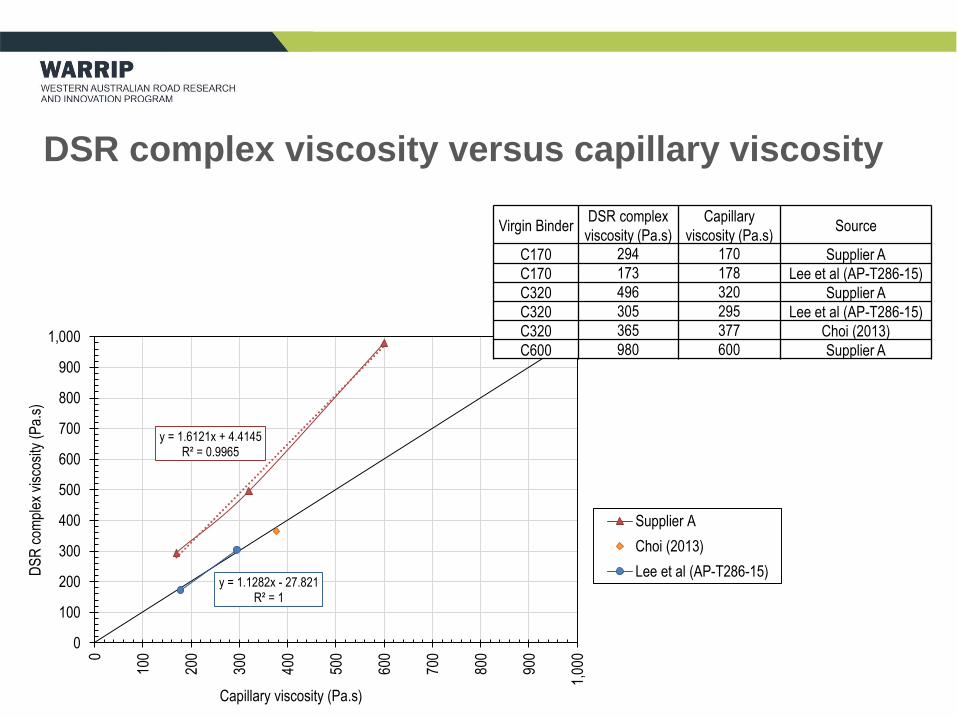
DSR complex viscosity versus capillary viscosity
y = 1.6121x + 4.4145R² = 0.9965
y = 1.1282x - 27.821R² = 1
0
100
200
300
400
500
600
700
800
900
1,000
0
100
200
300
400
500
600
700
800
900
1,00
0
DS
R c
ompl
ex v
isco
sity
(P
a.s)
Capillary viscosity (Pa.s)
Supplier A
Choi (2013)
Lee et al (AP-T286-15)
Virgin BinderDSR complex
viscosity (Pa.s)
Capillary
viscosity (Pa.s)Source
C170 294 170 Supplier A
C170 173 178 Lee et al (AP-T286-15)
C320 496 320 Supplier A
C320 305 295 Lee et al (AP-T286-15)
C320 365 377 Choi (2013)
C600 980 600 Supplier A
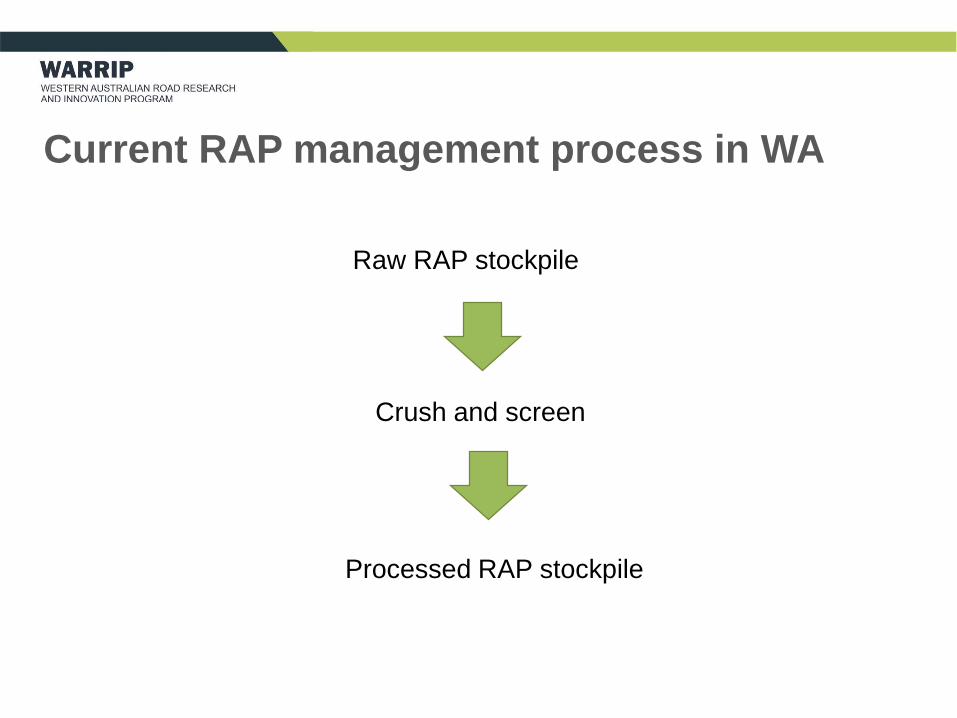
Current RAP management process in WA
Raw RAP stockpile
Crush and screen
Processed RAP stockpile
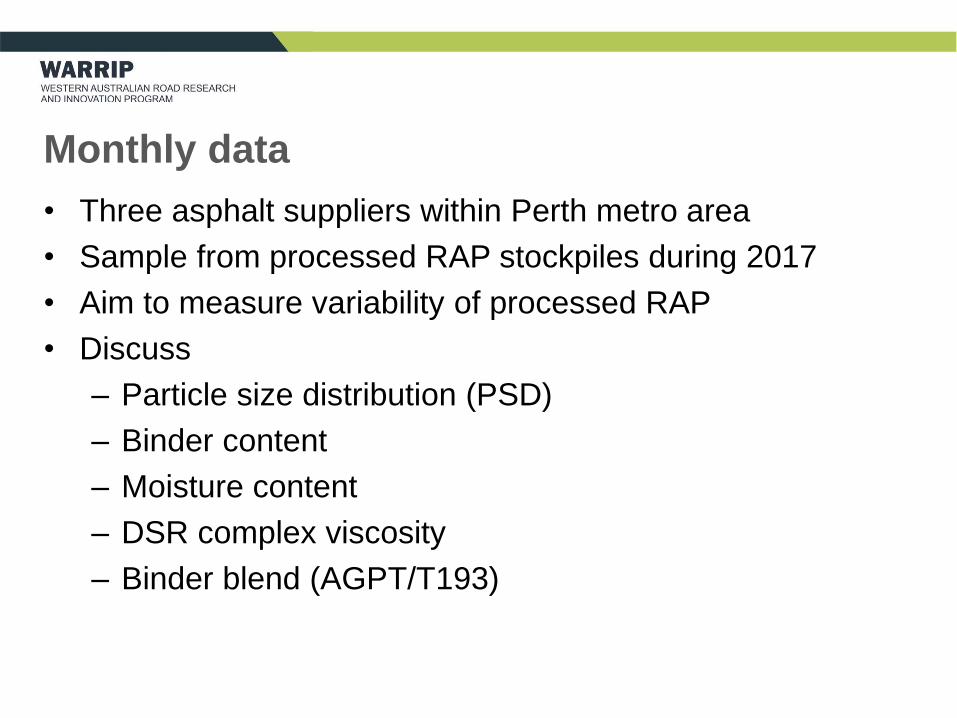
Monthly data
• Three asphalt suppliers within Perth metro area
• Sample from processed RAP stockpiles during 2017
• Aim to measure variability of processed RAP
• Discuss
– Particle size distribution (PSD)
– Binder content
– Moisture content
– DSR complex viscosity
– Binder blend (AGPT/T193)
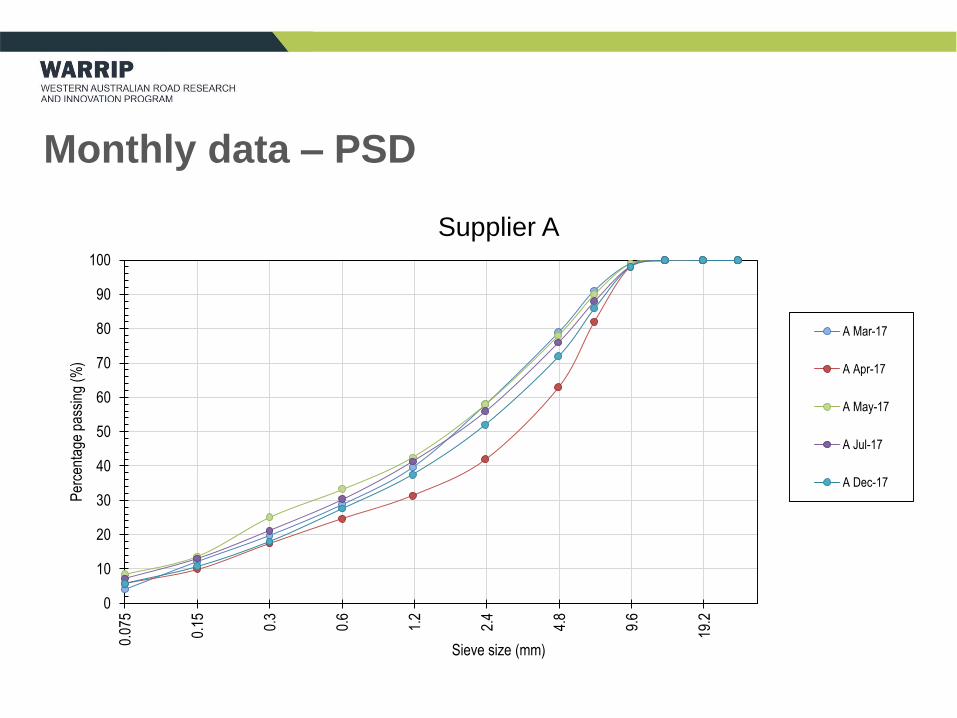
Monthly data – PSD
0
10
20
30
40
50
60
70
80
90
100
0.07
5
0.15 0.3
0.6
1.2
2.4
4.8
9.6
19.2
Per
cent
age
pass
ing
(%)
Sieve size (mm)
Supplier A
A Mar-17
A Apr-17
A May-17
A Jul-17
A Dec-17
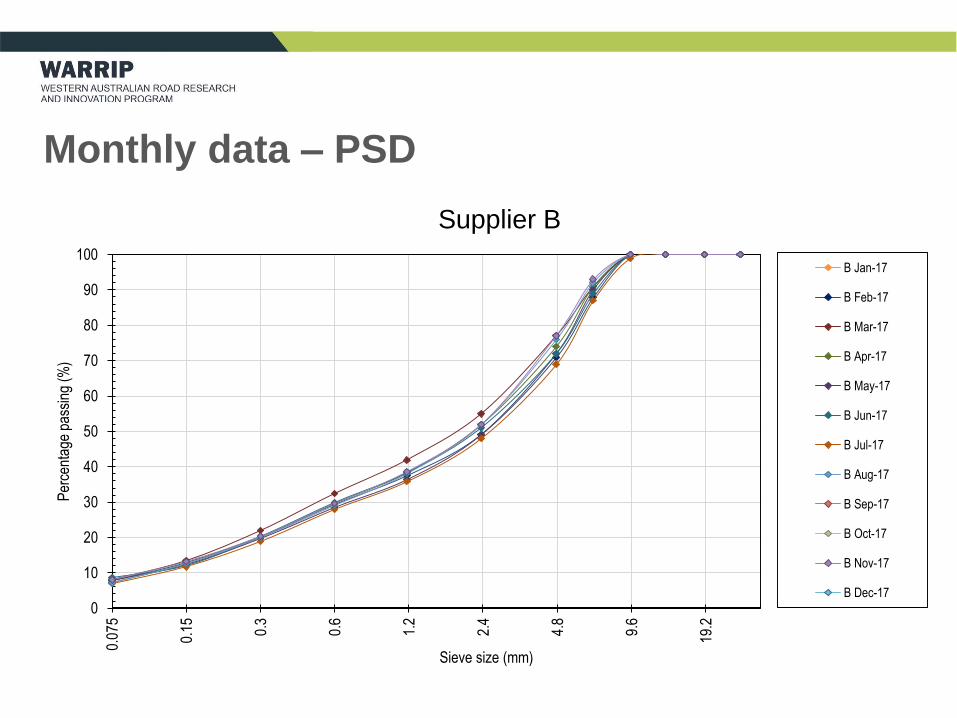
Monthly data – PSD
0
10
20
30
40
50
60
70
80
90
100
0.07
5
0.15 0.3
0.6
1.2
2.4
4.8
9.6
19.2
Per
cent
age
pass
ing
(%)
Sieve size (mm)
Supplier B
B Jan-17
B Feb-17
B Mar-17
B Apr-17
B May-17
B Jun-17
B Jul-17
B Aug-17
B Sep-17
B Oct-17
B Nov-17
B Dec-17
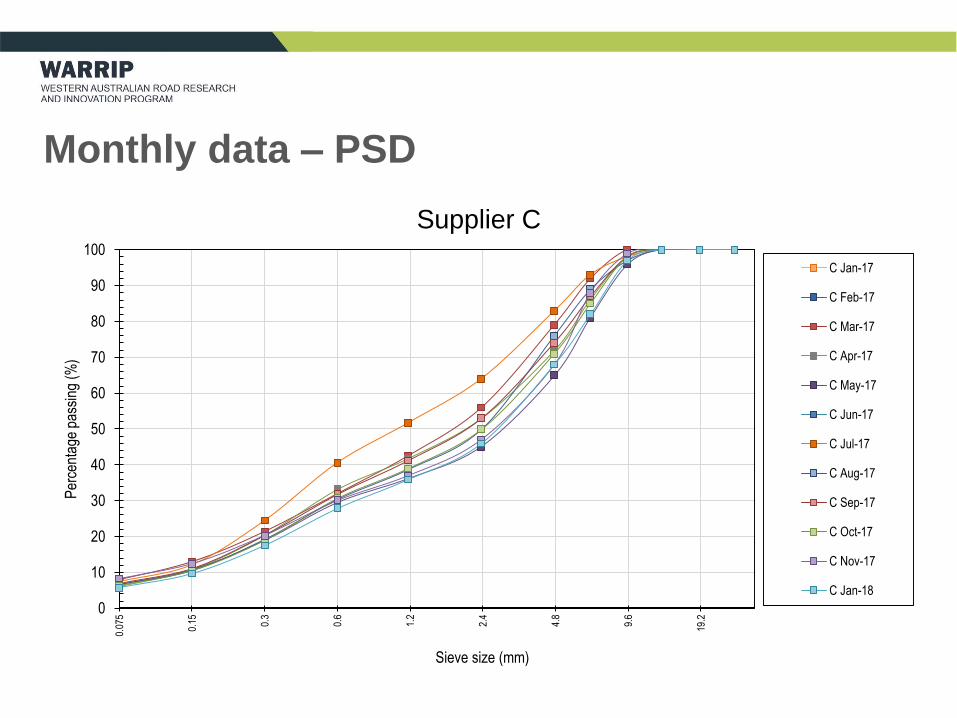
Monthly data – PSD
0
10
20
30
40
50
60
70
80
90
100
0.07
5
0.15 0.3
0.6
1.2
2.4
4.8
9.6
19.2
Per
cent
age
pass
ing
(%)
Sieve size (mm)
Supplier C
C Jan-17
C Feb-17
C Mar-17
C Apr-17
C May-17
C Jun-17
C Jul-17
C Aug-17
C Sep-17
C Oct-17
C Nov-17
C Jan-18
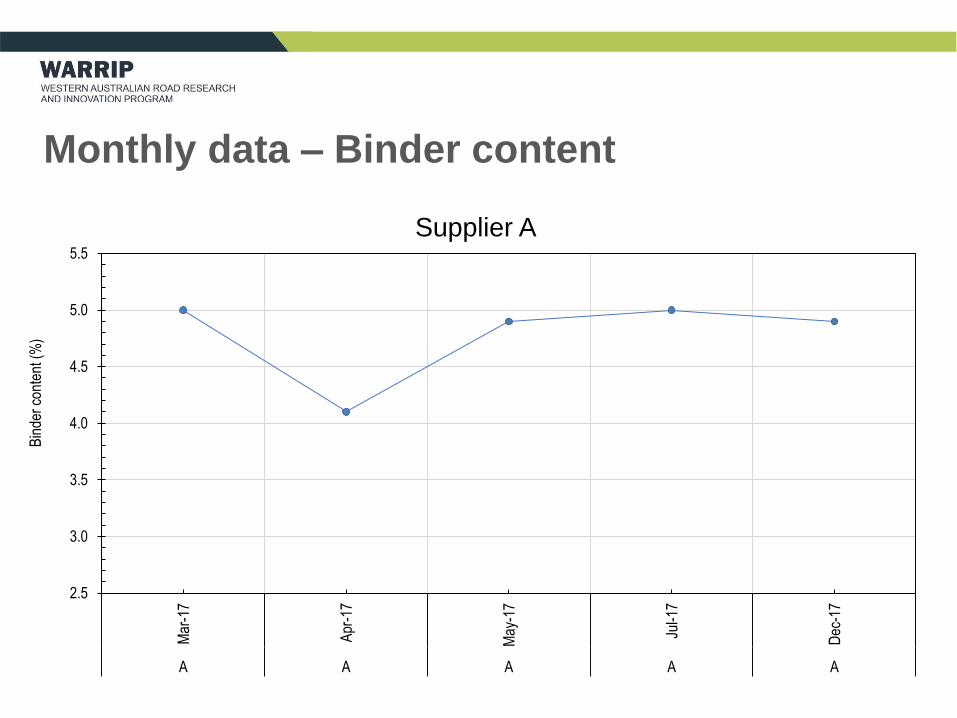
Monthly data – Binder content
2.5
3.0
3.5
4.0
4.5
5.0
5.5
Mar
-17
Apr
-17
May
-17
Jul-1
7
Dec
-17
A A A A A
Bin
der
cont
ent (
%)
Supplier A
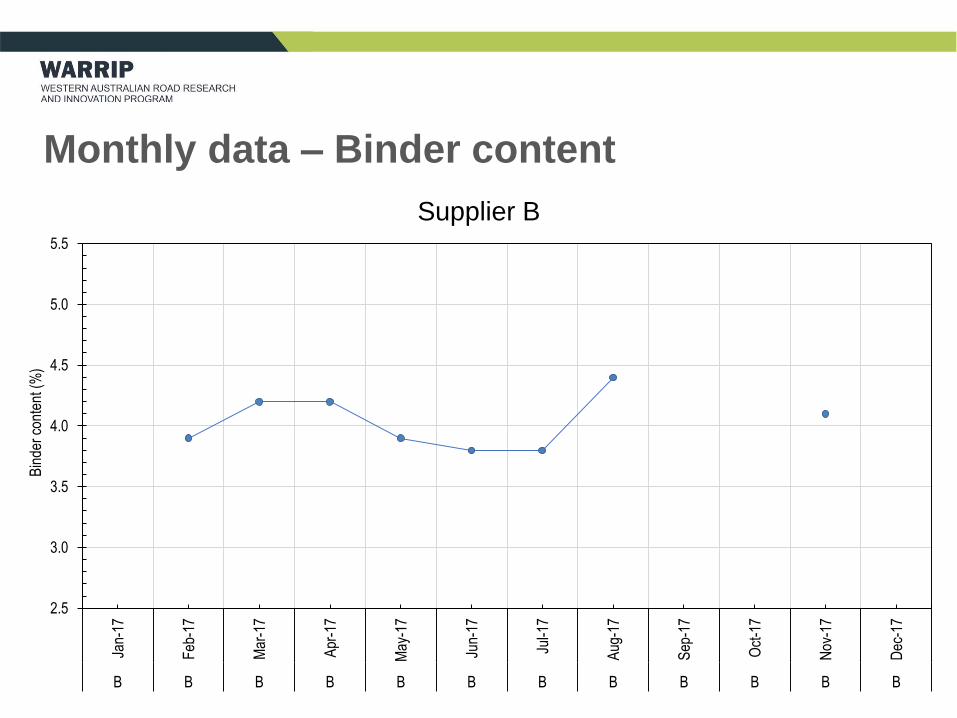
Monthly data – Binder content
2.5
3.0
3.5
4.0
4.5
5.0
5.5
Jan-
17
Feb
-17
Mar
-17
Apr
-17
May
-17
Jun-
17
Jul-1
7
Aug
-17
Sep
-17
Oct
-17
Nov
-17
Dec
-17
B B B B B B B B B B B B
Bin
der
cont
ent (
%)
Supplier B
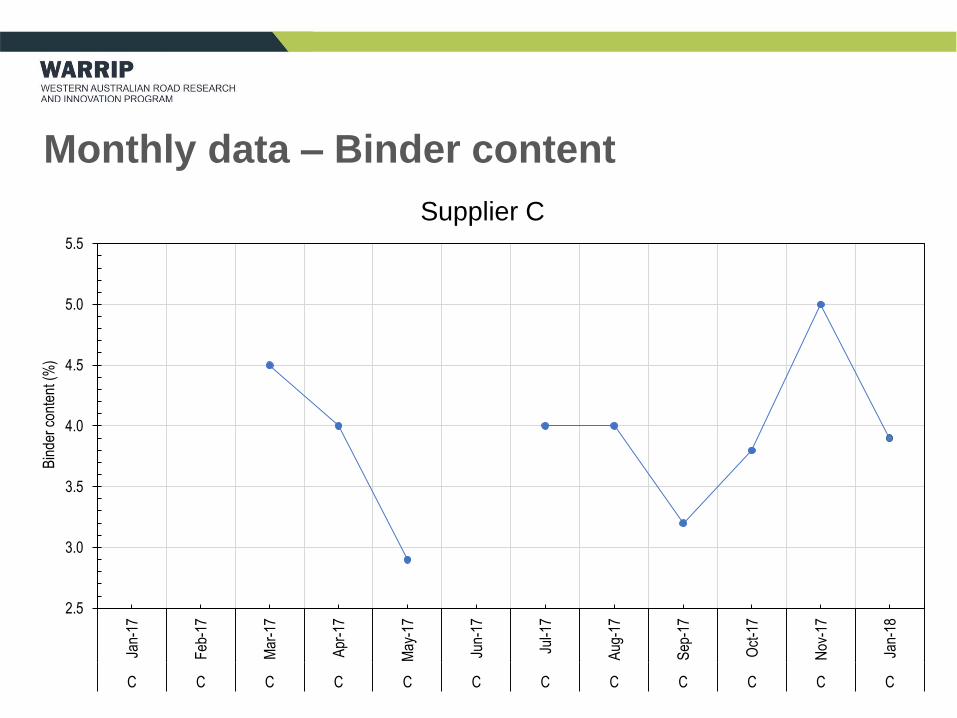
Monthly data – Binder content
2.5
3.0
3.5
4.0
4.5
5.0
5.5
Jan-
17
Feb
-17
Mar
-17
Apr
-17
May
-17
Jun-
17
Jul-1
7
Aug
-17
Sep
-17
Oct
-17
Nov
-17
Jan-
18
C C C C C C C C C C C C
Bin
der
cont
ent (
%)
Supplier C
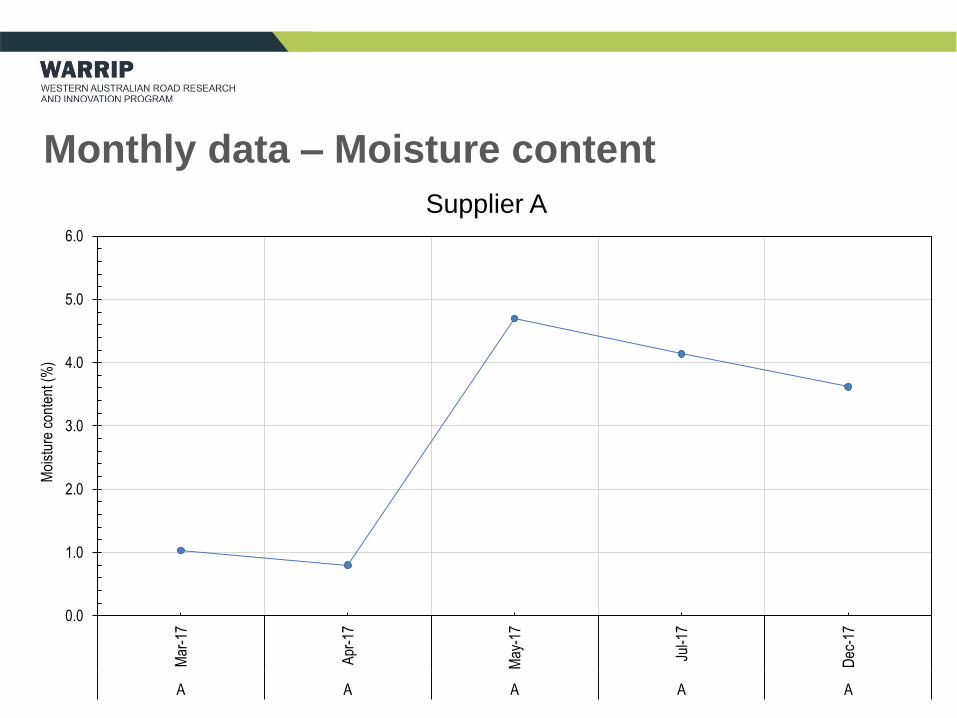
Monthly data – Moisture content
0.0
1.0
2.0
3.0
4.0
5.0
6.0
Mar
-17
Apr
-17
May
-17
Jul-1
7
Dec
-17
A A A A A
Moi
stur
e co
nten
t (%
)
Supplier A
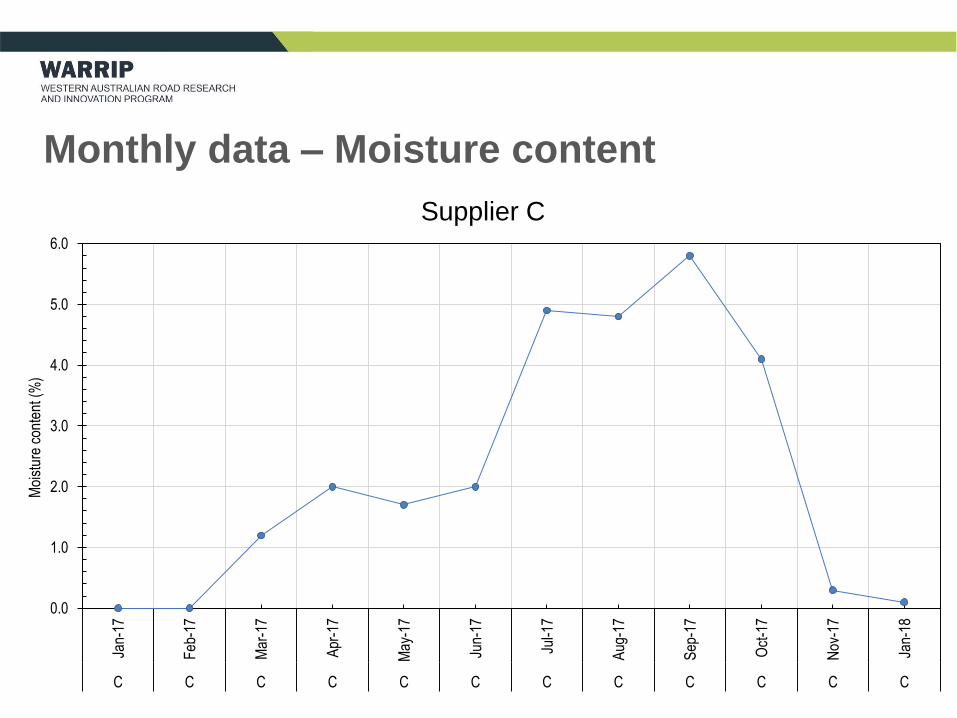
Monthly data – Moisture content
0.0
1.0
2.0
3.0
4.0
5.0
6.0
Jan-
17
Feb
-17
Mar
-17
Apr
-17
May
-17
Jun-
17
Jul-1
7
Aug
-17
Sep
-17
Oct
-17
Nov
-17
Jan-
18
C C C C C C C C C C C C
Moi
stur
e co
nten
t (%
)
Supplier C
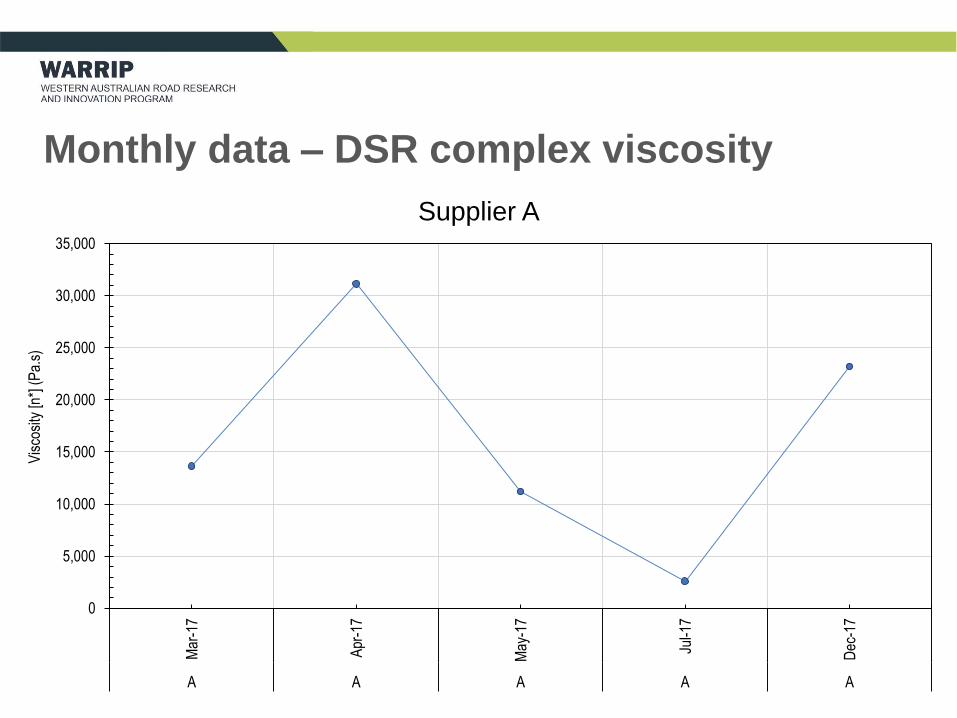
Monthly data – DSR complex viscosity
0
5,000
10,000
15,000
20,000
25,000
30,000
35,000
Mar
-17
Apr
-17
May
-17
Jul-1
7
Dec
-17
A A A A A
Vis
cosi
ty [n
*] (
Pa.
s)
Supplier A
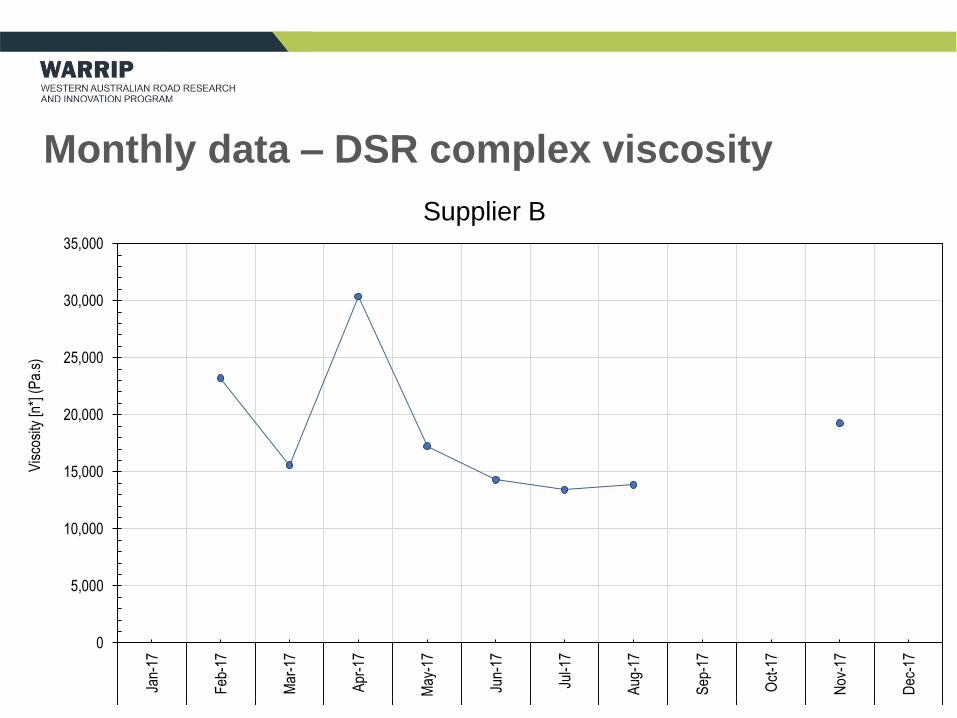
Monthly data – DSR complex viscosity
0
5,000
10,000
15,000
20,000
25,000
30,000
35,000
Jan-
17
Feb
-17
Mar
-17
Apr
-17
May
-17
Jun-
17
Jul-1
7
Aug
-17
Sep
-17
Oct
-17
Nov
-17
Dec
-17
B B B B B B B B B B B B
Vis
cosi
ty [n
*] (
Pa.
s)
Supplier B
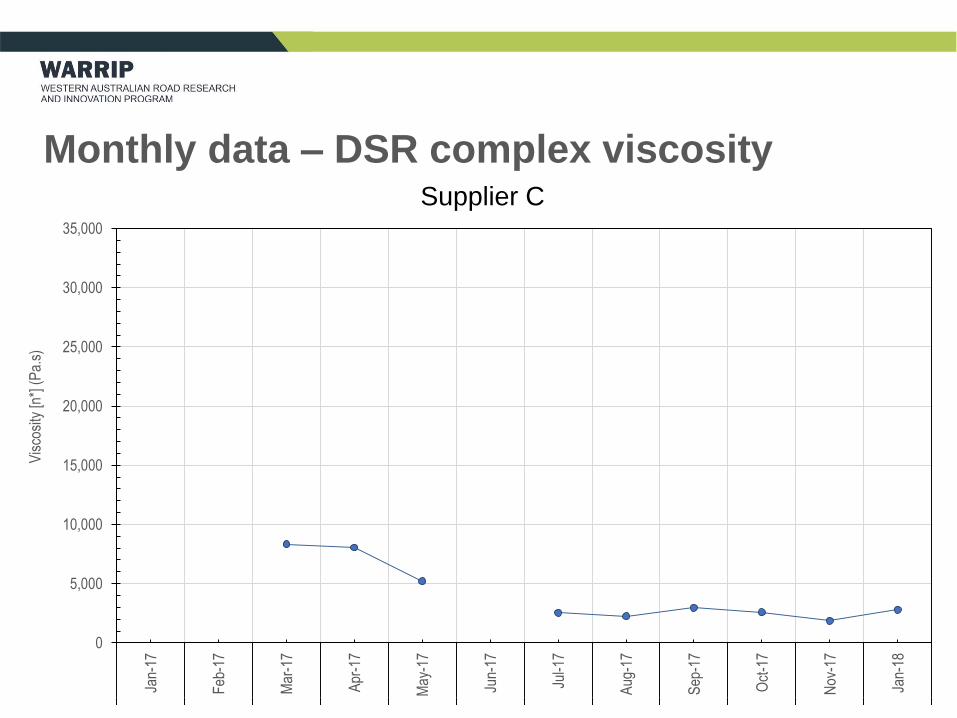
Monthly data – DSR complex viscosity
0
5,000
10,000
15,000
20,000
25,000
30,000
35,000
Jan-
17
Feb
-17
Mar
-17
Apr
-17
May
-17
Jun-
17
Jul-1
7
Aug
-17
Sep
-17
Oct
-17
Nov
-17
Jan-
18
C C C C C C C C C C C C
Vis
cosi
ty [n
*] (
Pa.
s)
Supplier C
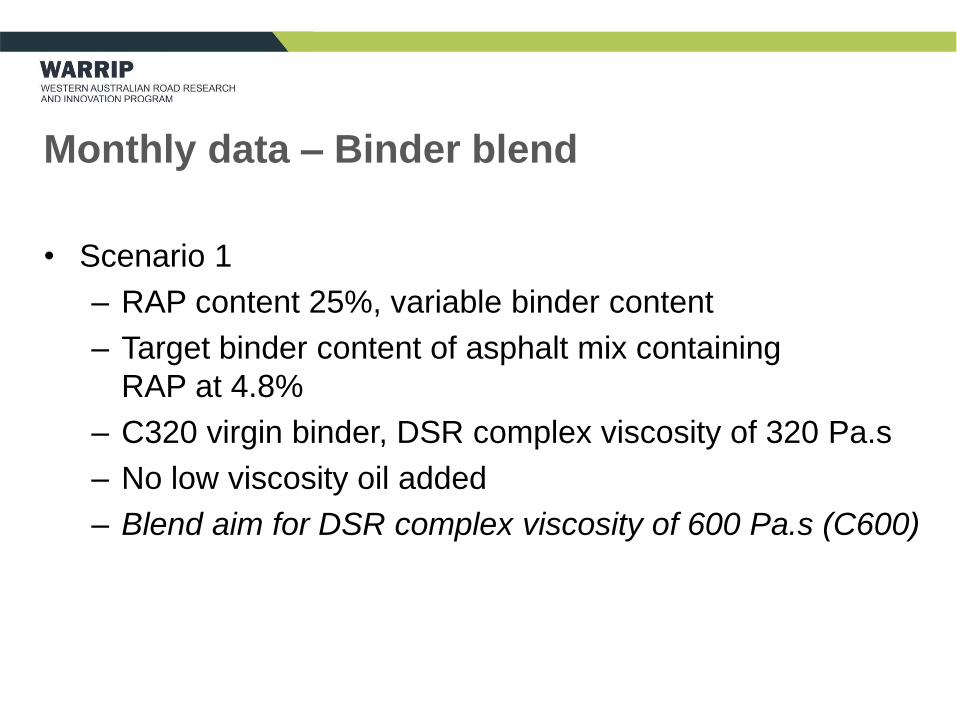
Monthly data – Binder blend
• Scenario 1
– RAP content 25%, variable binder content
– Target binder content of asphalt mix containing
RAP at 4.8%
– C320 virgin binder, DSR complex viscosity of 320 Pa.s
– No low viscosity oil added
– Blend aim for DSR complex viscosity of 600 Pa.s (C600)
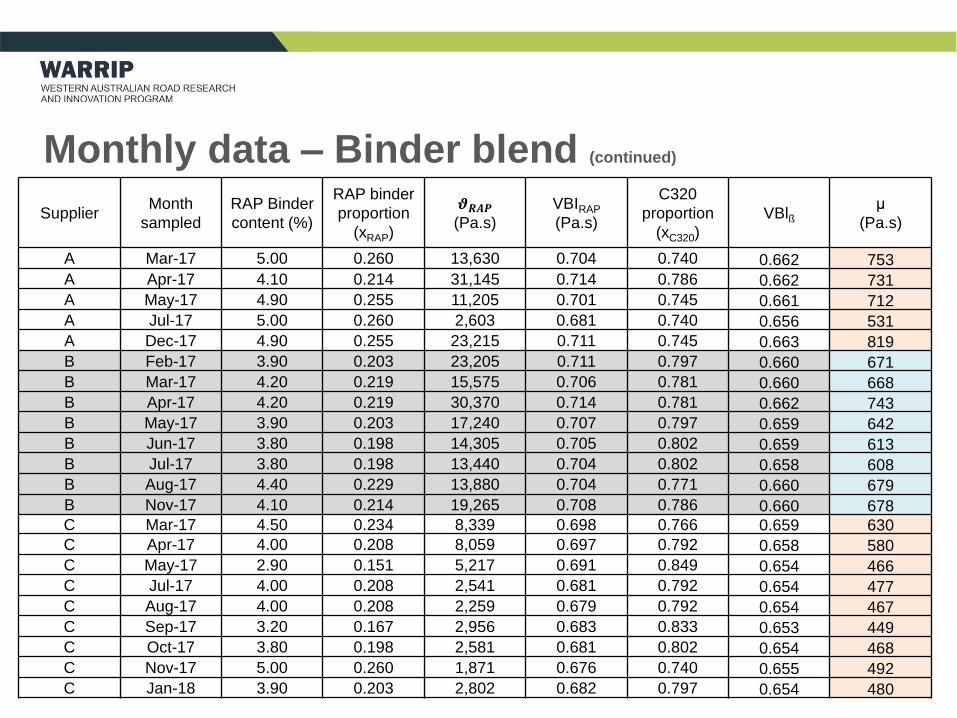
Monthly data – Binder blend (continued)
SupplierMonth
sampled
RAP Binder
content (%)
RAP binder
proportion
(xRAP)
𝝑𝑹𝑨𝑷(Pa.s)
VBIRAP
(Pa.s)
C320
proportion
(xC320)
VBlßμ
(Pa.s)
A Mar-17 5.00 0.260 13,630 0.704 0.740 0.662 753
A Apr-17 4.10 0.214 31,145 0.714 0.786 0.662 731
A May-17 4.90 0.255 11,205 0.701 0.745 0.661 712
A Jul-17 5.00 0.260 2,603 0.681 0.740 0.656 531
A Dec-17 4.90 0.255 23,215 0.711 0.745 0.663 819
B Feb-17 3.90 0.203 23,205 0.711 0.797 0.660 671
B Mar-17 4.20 0.219 15,575 0.706 0.781 0.660 668
B Apr-17 4.20 0.219 30,370 0.714 0.781 0.662 743
B May-17 3.90 0.203 17,240 0.707 0.797 0.659 642
B Jun-17 3.80 0.198 14,305 0.705 0.802 0.659 613
B Jul-17 3.80 0.198 13,440 0.704 0.802 0.658 608
B Aug-17 4.40 0.229 13,880 0.704 0.771 0.660 679
B Nov-17 4.10 0.214 19,265 0.708 0.786 0.660 678
C Mar-17 4.50 0.234 8,339 0.698 0.766 0.659 630
C Apr-17 4.00 0.208 8,059 0.697 0.792 0.658 580
C May-17 2.90 0.151 5,217 0.691 0.849 0.654 466
C Jul-17 4.00 0.208 2,541 0.681 0.792 0.654 477
C Aug-17 4.00 0.208 2,259 0.679 0.792 0.654 467
C Sep-17 3.20 0.167 2,956 0.683 0.833 0.653 449
C Oct-17 3.80 0.198 2,581 0.681 0.802 0.654 468
C Nov-17 5.00 0.260 1,871 0.676 0.740 0.655 492
C Jan-18 3.90 0.203 2,802 0.682 0.797 0.654 480
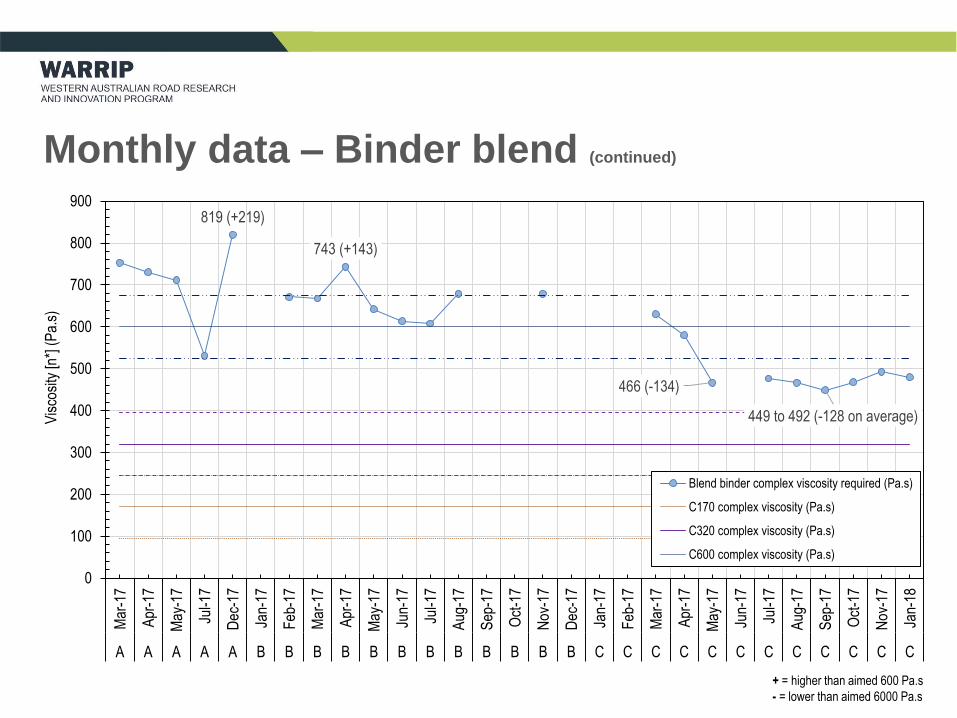
Monthly data – Binder blend (continued)
+ = higher than aimed 600 Pa.s
- = lower than aimed 6000 Pa.s
819 (+219)
743 (+143)
466 (-134)
449 to 492 (-128 on average)
0
100
200
300
400
500
600
700
800
900
Mar
-17
Apr
-17
May
-17
Jul-1
7
Dec
-17
Jan-
17
Feb
-17
Mar
-17
Apr
-17
May
-17
Jun-
17
Jul-1
7
Aug
-17
Sep
-17
Oct
-17
Nov
-17
Dec
-17
Jan-
17
Feb
-17
Mar
-17
Apr
-17
May
-17
Jun-
17
Jul-1
7
Aug
-17
Sep
-17
Oct
-17
Nov
-17
Jan-
18
A A A A A B B B B B B B B B B B B C C C C C C C C C C C C
Vis
cosi
ty [n
*] (
Pa.
s)
Blend binder complex viscosity required (Pa.s)
C170 complex viscosity (Pa.s)
C320 complex viscosity (Pa.s)
C600 complex viscosity (Pa.s)
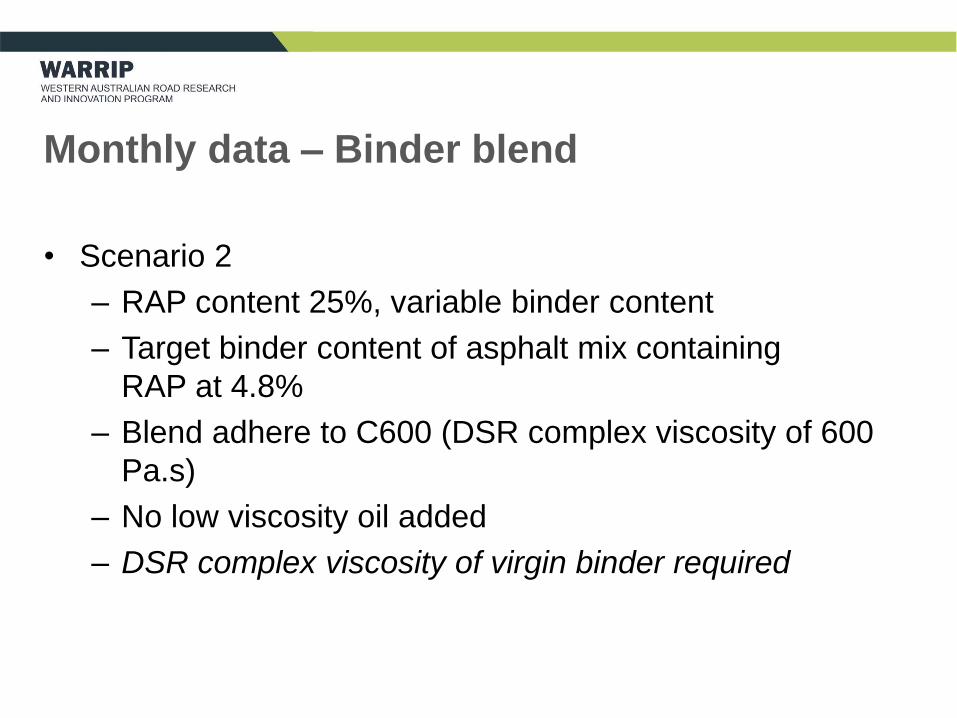
Monthly data – Binder blend
• Scenario 2
– RAP content 25%, variable binder content
– Target binder content of asphalt mix containing
RAP at 4.8%
– Blend adhere to C600 (DSR complex viscosity of 600
Pa.s)
– No low viscosity oil added
– DSR complex viscosity of virgin binder required
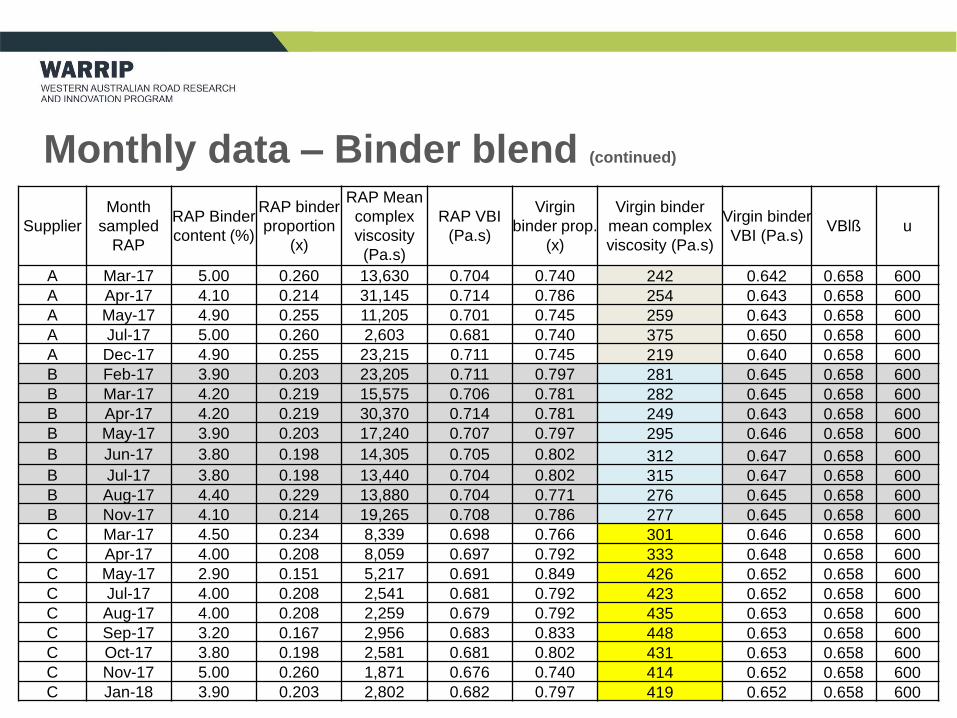
Monthly data – Binder blend (continued)
Supplier
Month
sampled
RAP
RAP Binder
content (%)
RAP binder
proportion
(x)
RAP Mean
complex
viscosity
(Pa.s)
RAP VBI
(Pa.s)
Virgin
binder prop.
(x)
Virgin binder
mean complex
viscosity (Pa.s)
Virgin binder
VBI (Pa.s)VBlß u
A Mar-17 5.00 0.260 13,630 0.704 0.740 242 0.642 0.658 600
A Apr-17 4.10 0.214 31,145 0.714 0.786 254 0.643 0.658 600
A May-17 4.90 0.255 11,205 0.701 0.745 259 0.643 0.658 600
A Jul-17 5.00 0.260 2,603 0.681 0.740 375 0.650 0.658 600
A Dec-17 4.90 0.255 23,215 0.711 0.745 219 0.640 0.658 600
B Feb-17 3.90 0.203 23,205 0.711 0.797 281 0.645 0.658 600
B Mar-17 4.20 0.219 15,575 0.706 0.781 282 0.645 0.658 600
B Apr-17 4.20 0.219 30,370 0.714 0.781 249 0.643 0.658 600
B May-17 3.90 0.203 17,240 0.707 0.797 295 0.646 0.658 600
B Jun-17 3.80 0.198 14,305 0.705 0.802 312 0.647 0.658 600
B Jul-17 3.80 0.198 13,440 0.704 0.802 315 0.647 0.658 600
B Aug-17 4.40 0.229 13,880 0.704 0.771 276 0.645 0.658 600
B Nov-17 4.10 0.214 19,265 0.708 0.786 277 0.645 0.658 600
C Mar-17 4.50 0.234 8,339 0.698 0.766 301 0.646 0.658 600
C Apr-17 4.00 0.208 8,059 0.697 0.792 333 0.648 0.658 600
C May-17 2.90 0.151 5,217 0.691 0.849 426 0.652 0.658 600
C Jul-17 4.00 0.208 2,541 0.681 0.792 423 0.652 0.658 600
C Aug-17 4.00 0.208 2,259 0.679 0.792 435 0.653 0.658 600
C Sep-17 3.20 0.167 2,956 0.683 0.833 448 0.653 0.658 600
C Oct-17 3.80 0.198 2,581 0.681 0.802 431 0.653 0.658 600
C Nov-17 5.00 0.260 1,871 0.676 0.740 414 0.652 0.658 600
C Jan-18 3.90 0.203 2,802 0.682 0.797 419 0.652 0.658 600
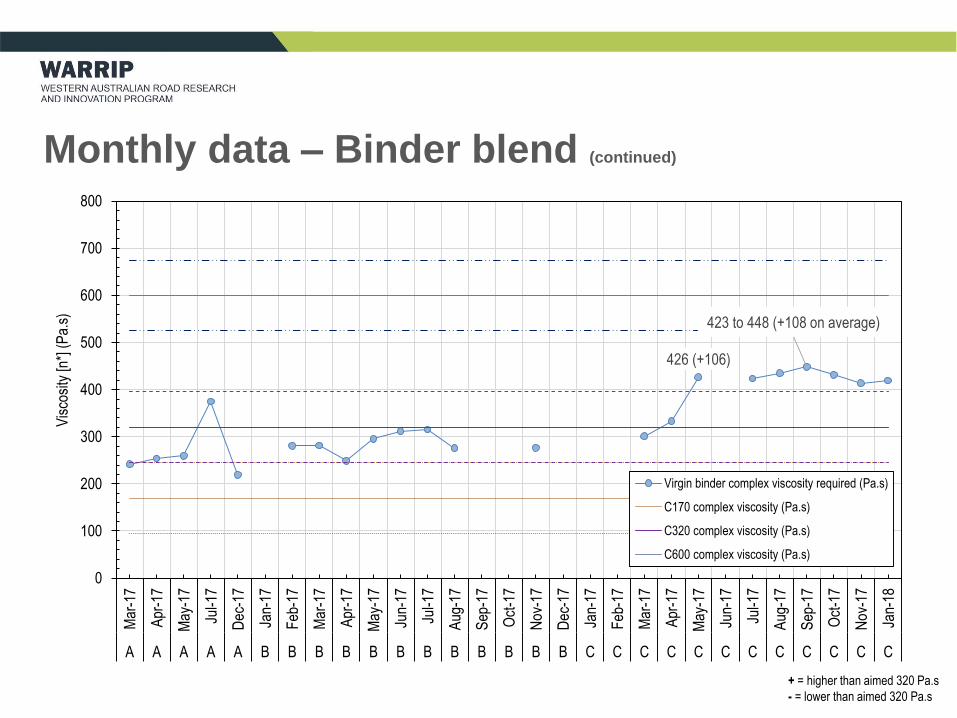
Monthly data – Binder blend (continued)
+ = higher than aimed 320 Pa.s
- = lower than aimed 320 Pa.s
426 (+106)
423 to 448 (+108 on average)
0
100
200
300
400
500
600
700
800
Mar
-17
Apr
-17
May
-17
Jul-1
7
Dec
-17
Jan-
17
Feb
-17
Mar
-17
Apr
-17
May
-17
Jun-
17
Jul-1
7
Aug
-17
Sep
-17
Oct
-17
Nov
-17
Dec
-17
Jan-
17
Feb
-17
Mar
-17
Apr
-17
May
-17
Jun-
17
Jul-1
7
Aug
-17
Sep
-17
Oct
-17
Nov
-17
Jan-
18
A A A A A B B B B B B B B B B B B C C C C C C C C C C C C
Vis
cosi
ty [n
*] (
Pa.
s)
Virgin binder complex viscosity required (Pa.s)
C170 complex viscosity (Pa.s)
C320 complex viscosity (Pa.s)
C600 complex viscosity (Pa.s)
Variability during processing
• One asphalt supplier within Perth metro area
• RAP material sampled immediately after going through
the crushing and screening process
• Over four days, 4 April to 7 April 2017, in the morning
and afternoon
• Aim to measure variability of raw RAP
• Discuss
– Particle size distribution (PSD)
– Binder content
– DSR complex viscosity
– Binder blend (AGPT/T193)
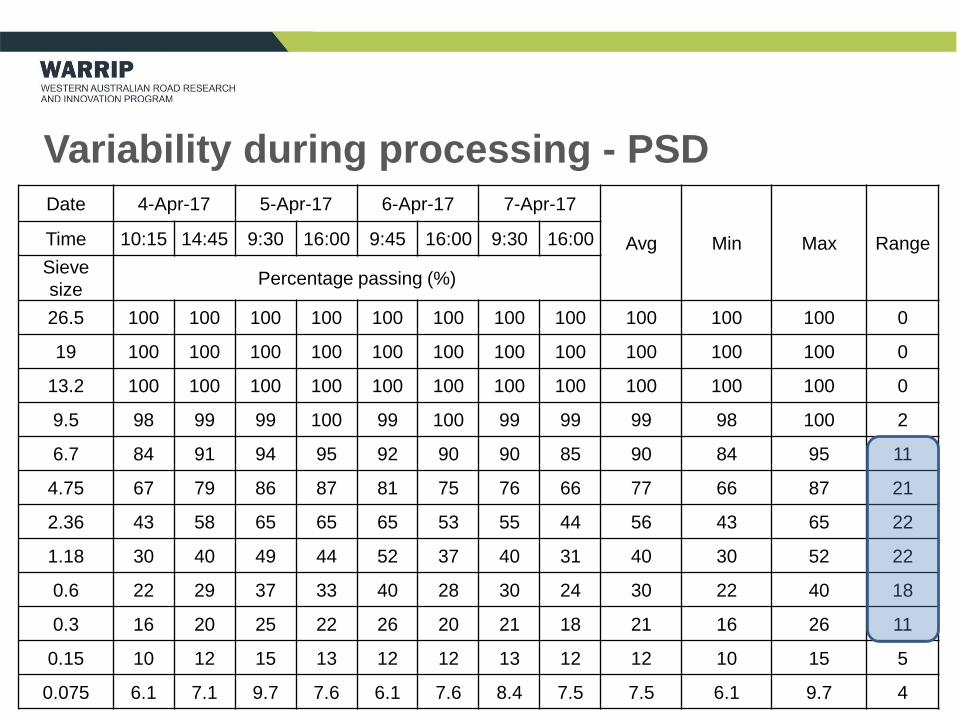
Variability during processing - PSD
Date 4-Apr-17 5-Apr-17 6-Apr-17 7-Apr-17
Avg Min Max RangeTime 10:15 14:45 9:30 16:00 9:45 16:00 9:30 16:00
Sieve
sizePercentage passing (%)
26.5 100 100 100 100 100 100 100 100 100 100 100 0
19 100 100 100 100 100 100 100 100 100 100 100 0
13.2 100 100 100 100 100 100 100 100 100 100 100 0
9.5 98 99 99 100 99 100 99 99 99 98 100 2
6.7 84 91 94 95 92 90 90 85 90 84 95 11
4.75 67 79 86 87 81 75 76 66 77 66 87 21
2.36 43 58 65 65 65 53 55 44 56 43 65 22
1.18 30 40 49 44 52 37 40 31 40 30 52 22
0.6 22 29 37 33 40 28 30 24 30 22 40 18
0.3 16 20 25 22 26 20 21 18 21 16 26 11
0.15 10 12 15 13 12 12 13 12 12 10 15 5
0.075 6.1 7.1 9.7 7.6 6.1 7.6 8.4 7.5 7.5 6.1 9.7 4
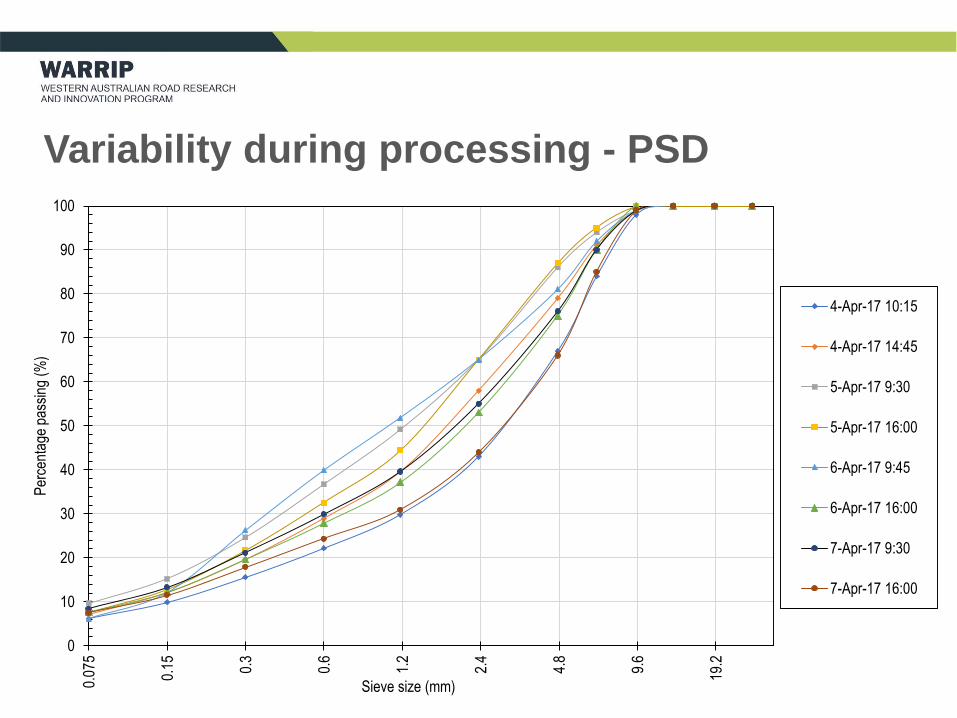
Variability during processing - PSD
0
10
20
30
40
50
60
70
80
90
100
0.07
5
0.15 0.3
0.6
1.2
2.4
4.8
9.6
19.2
Per
cent
age
pass
ing
(%)
Sieve size (mm)
4-Apr-17 10:15
4-Apr-17 14:45
5-Apr-17 9:30
5-Apr-17 16:00
6-Apr-17 9:45
6-Apr-17 16:00
7-Apr-17 9:30
7-Apr-17 16:00
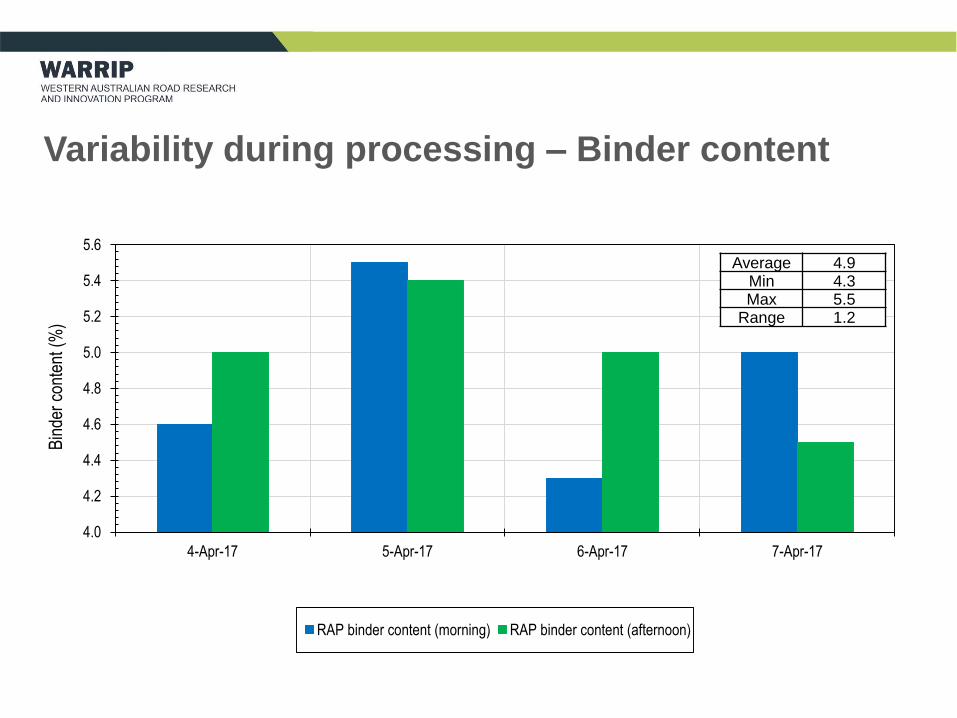
Variability during processing – Binder content
4.0
4.2
4.4
4.6
4.8
5.0
5.2
5.4
5.6
4-Apr-17 5-Apr-17 6-Apr-17 7-Apr-17
Bin
der
cont
ent (
%)
RAP binder content (morning) RAP binder content (afternoon)
Average 4.9Min 4.3Max 5.5
Range 1.2
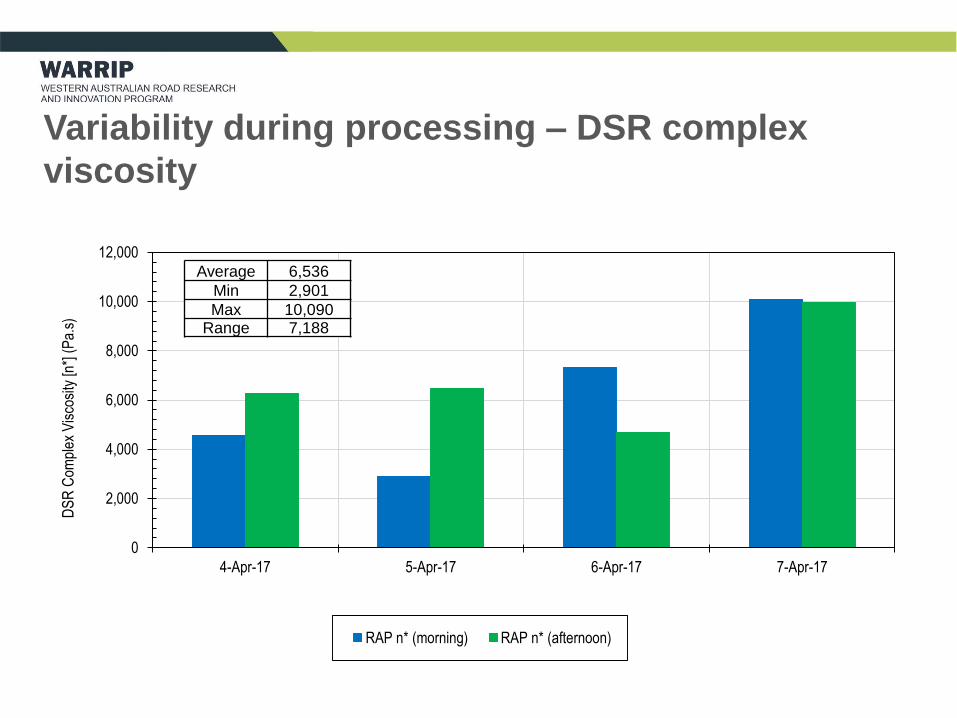
Variability during processing – DSR complex
viscosity
0
2,000
4,000
6,000
8,000
10,000
12,000
4-Apr-17 5-Apr-17 6-Apr-17 7-Apr-17
DS
R C
ompl
ex V
isco
sity
[n*]
(P
a.s)
RAP n* (morning) RAP n* (afternoon)
Average 6,536
Min 2,901
Max 10,090Range 7,188
Variability during processing – Binder blend
• Assumptions
– RAP content 24.1%, with average binder content of
4.9% and average DSR complex viscosity of 6537 Pa.s
– Target binder content of the asphalt mix containing
RAP at 4.6%
– C320 virgin binder with DSR complex viscosity of
490 Pa.s
– C600 target DSR complex viscosity of 980 Pa.s
– No low viscosity oil added
– Aggregate fraction proportions as per the mix design.
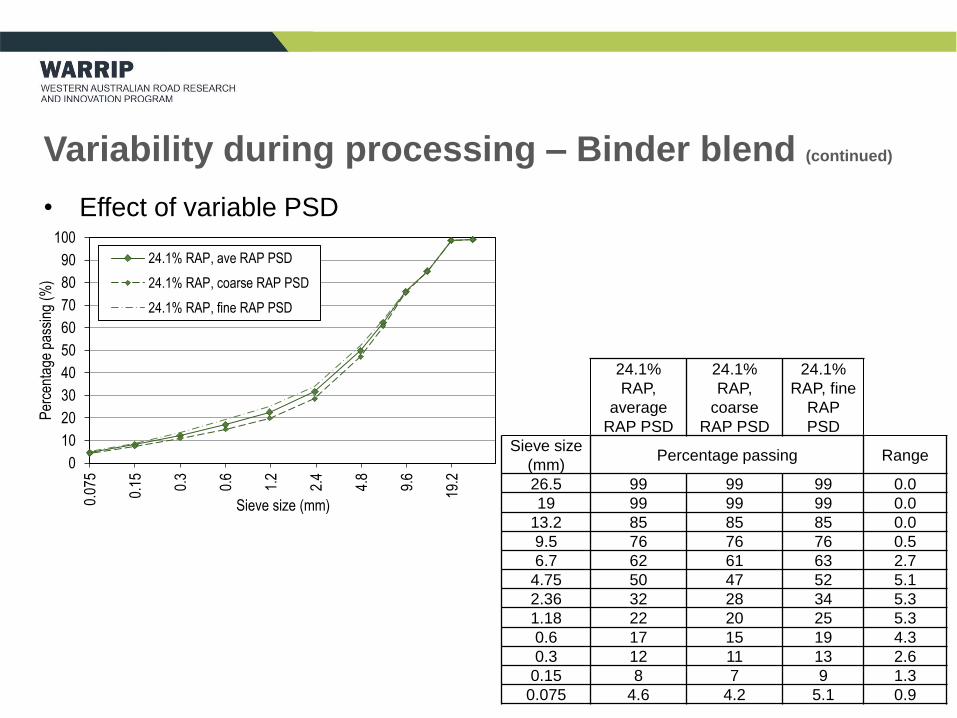
Variability during processing – Binder blend (continued)
• Effect of variable PSD
0
10
20
30
40
50
60
70
80
90
100
0.07
5
0.15 0.3
0.6
1.2
2.4
4.8
9.6
19.2
Per
cent
age
pass
ing
(%)
Sieve size (mm)
24.1% RAP, ave RAP PSD
24.1% RAP, coarse RAP PSD
24.1% RAP, fine RAP PSD
24.1%
RAP,
average
RAP PSD
24.1%
RAP,
coarse
RAP PSD
24.1%
RAP, fine
RAP
PSD
Sieve size
(mm)Percentage passing Range
26.5 99 99 99 0.0
19 99 99 99 0.0
13.2 85 85 85 0.0
9.5 76 76 76 0.5
6.7 62 61 63 2.7
4.75 50 47 52 5.1
2.36 32 28 34 5.3
1.18 22 20 25 5.3
0.6 17 15 19 4.3
0.3 12 11 13 2.6
0.15 8 7 9 1.3
0.075 4.6 4.2 5.1 0.9
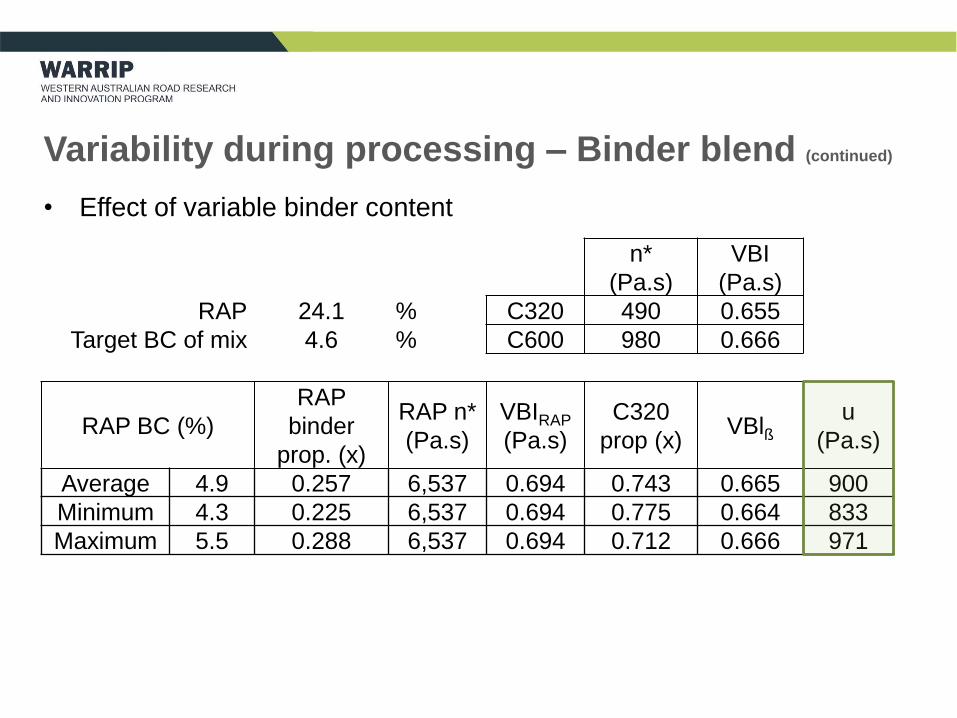
Variability during processing – Binder blend (continued)
• Effect of variable binder content
n*
(Pa.s)
VBI
(Pa.s)
RAP 24.1 % C320 490 0.655
Target BC of mix 4.6 % C600 980 0.666
RAP BC (%)
RAP
binder
prop. (x)
RAP n*
(Pa.s)
VBIRAP
(Pa.s)
C320
prop (x)VBlß
u
(Pa.s)
Average 4.9 0.257 6,537 0.694 0.743 0.665 900
Minimum 4.3 0.225 6,537 0.694 0.775 0.664 833
Maximum 5.5 0.288 6,537 0.694 0.712 0.666 971
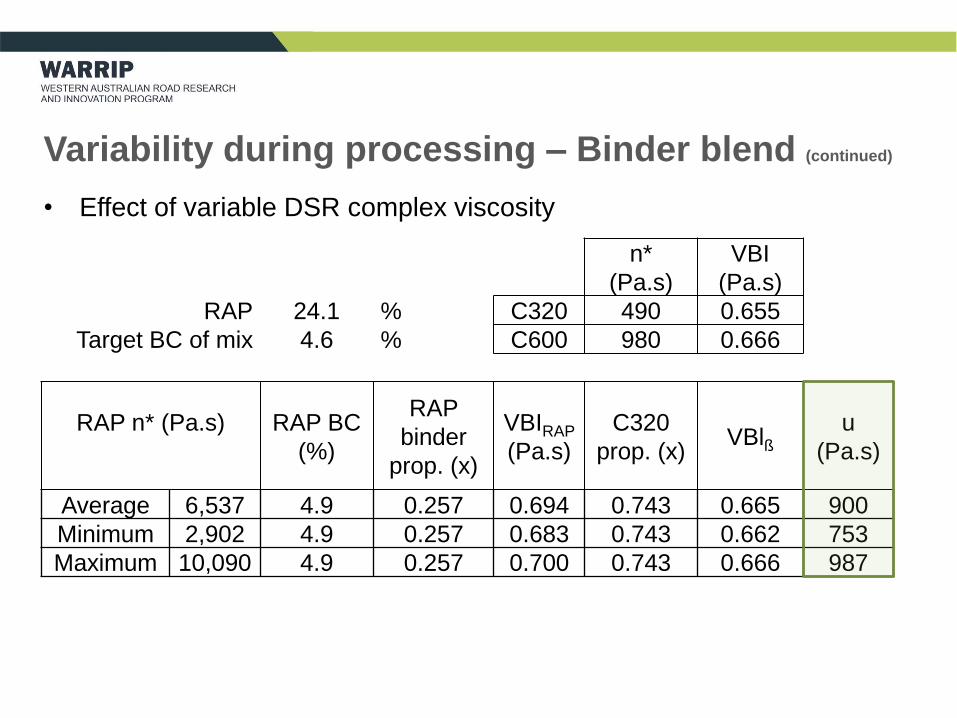
Variability during processing – Binder blend (continued)
• Effect of variable DSR complex viscosity
n*
(Pa.s)
VBI
(Pa.s)
RAP 24.1 % C320 490 0.655
Target BC of mix 4.6 % C600 980 0.666
RAP n* (Pa.s) RAP BC
(%)
RAP
binder
prop. (x)
VBIRAP
(Pa.s)
C320
prop. (x)VBlß
u
(Pa.s)
Average 6,537 4.9 0.257 0.694 0.743 0.665 900
Minimum 2,902 4.9 0.257 0.683 0.743 0.662 753
Maximum 10,090 4.9 0.257 0.700 0.743 0.666 987
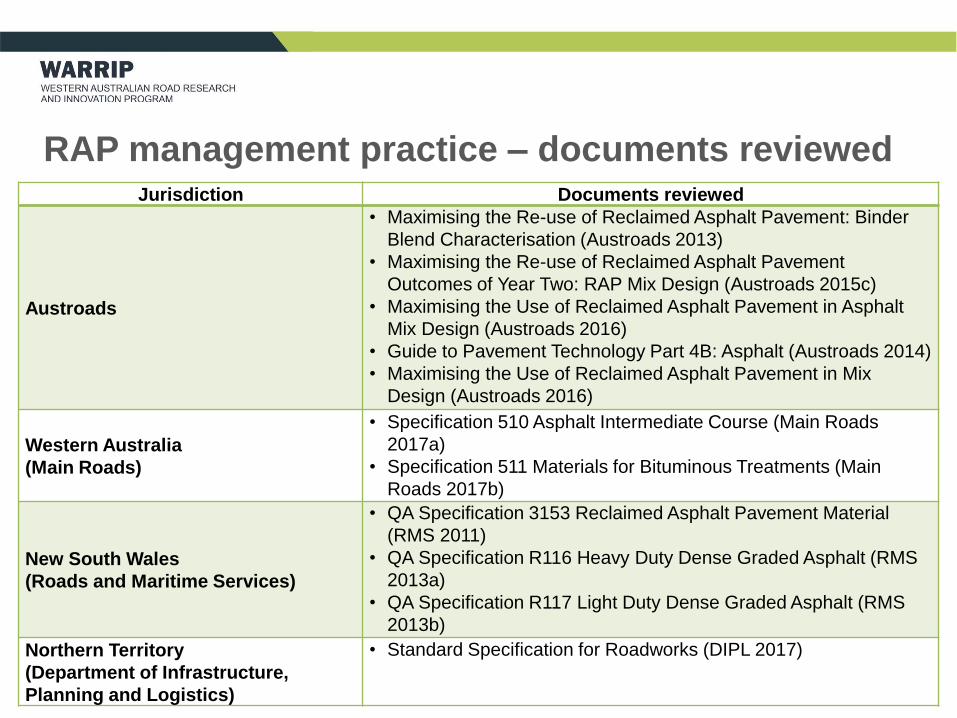
RAP management practice – documents reviewedJurisdiction Documents reviewed
Austroads
• Maximising the Re-use of Reclaimed Asphalt Pavement: Binder
Blend Characterisation (Austroads 2013)
• Maximising the Re-use of Reclaimed Asphalt Pavement
Outcomes of Year Two: RAP Mix Design (Austroads 2015c)
• Maximising the Use of Reclaimed Asphalt Pavement in Asphalt
Mix Design (Austroads 2016)
• Guide to Pavement Technology Part 4B: Asphalt (Austroads 2014)
• Maximising the Use of Reclaimed Asphalt Pavement in Mix
Design (Austroads 2016)
Western Australia
(Main Roads)
• Specification 510 Asphalt Intermediate Course (Main Roads
2017a)
• Specification 511 Materials for Bituminous Treatments (Main
Roads 2017b)
New South Wales
(Roads and Maritime Services)
• QA Specification 3153 Reclaimed Asphalt Pavement Material
(RMS 2011)
• QA Specification R116 Heavy Duty Dense Graded Asphalt (RMS
2013a)
• QA Specification R117 Light Duty Dense Graded Asphalt (RMS
2013b)
Northern Territory
(Department of Infrastructure,
Planning and Logistics)
• Standard Specification for Roadworks (DIPL 2017)
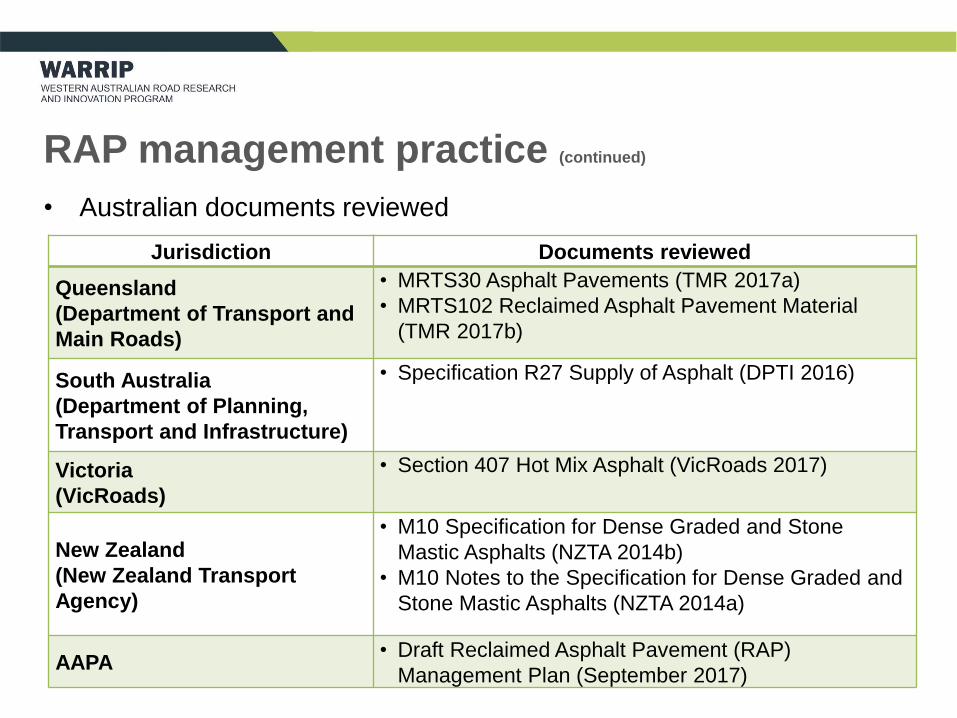
RAP management practice (continued)
• Australian documents reviewed
Jurisdiction Documents reviewed
Queensland
(Department of Transport and
Main Roads)
• MRTS30 Asphalt Pavements (TMR 2017a)
• MRTS102 Reclaimed Asphalt Pavement Material
(TMR 2017b)
South Australia
(Department of Planning,
Transport and Infrastructure)
• Specification R27 Supply of Asphalt (DPTI 2016)
Victoria
(VicRoads)
• Section 407 Hot Mix Asphalt (VicRoads 2017)
New Zealand
(New Zealand Transport
Agency)
• M10 Specification for Dense Graded and Stone
Mastic Asphalts (NZTA 2014b)
• M10 Notes to the Specification for Dense Graded and
Stone Mastic Asphalts (NZTA 2014a)
AAPA• Draft Reclaimed Asphalt Pavement (RAP)
Management Plan (September 2017)
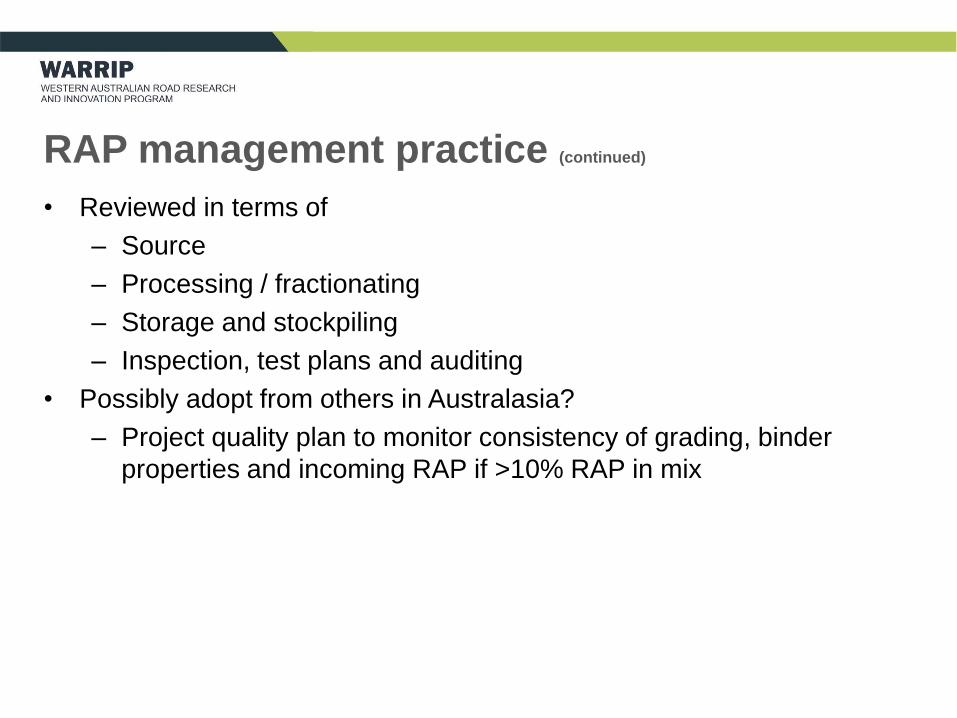
RAP management practice (continued)
• Reviewed in terms of
– Source
– Processing / fractionating
– Storage and stockpiling
– Inspection, test plans and auditing
• Possibly adopt from others in Australasia?
– Project quality plan to monitor consistency of grading, binder
properties and incoming RAP if >10% RAP in mix
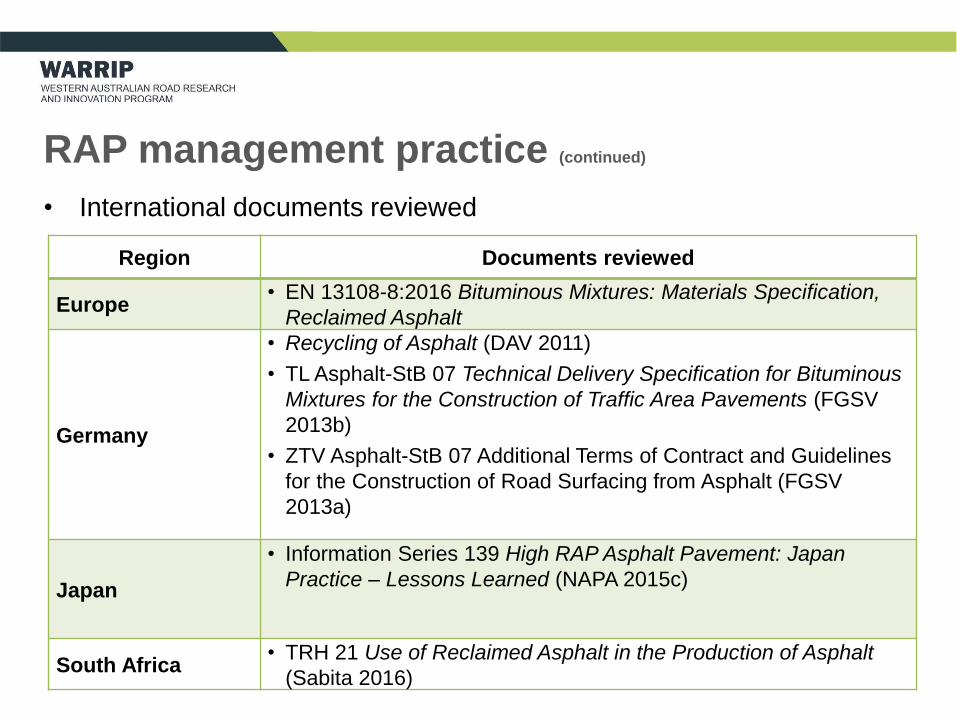
RAP management practice (continued)
• International documents reviewed
Region Documents reviewed
Europe• EN 13108-8:2016 Bituminous Mixtures: Materials Specification,
Reclaimed Asphalt
Germany
• Recycling of Asphalt (DAV 2011)
• TL Asphalt-StB 07 Technical Delivery Specification for Bituminous
Mixtures for the Construction of Traffic Area Pavements (FGSV
2013b)
• ZTV Asphalt-StB 07 Additional Terms of Contract and Guidelines
for the Construction of Road Surfacing from Asphalt (FGSV
2013a)
Japan
• Information Series 139 High RAP Asphalt Pavement: Japan
Practice – Lessons Learned (NAPA 2015c)
South Africa• TRH 21 Use of Reclaimed Asphalt in the Production of Asphalt
(Sabita 2016)
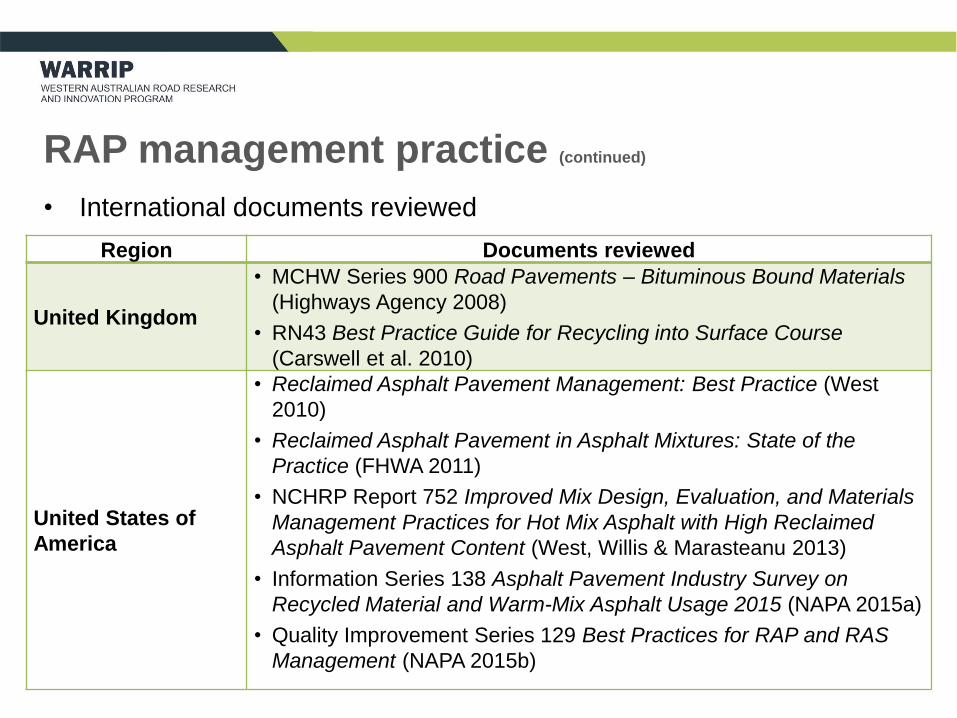
RAP management practice (continued)
• International documents reviewed
Region Documents reviewed
United Kingdom
• MCHW Series 900 Road Pavements – Bituminous Bound Materials
(Highways Agency 2008)
• RN43 Best Practice Guide for Recycling into Surface Course
(Carswell et al. 2010)
United States of
America
• Reclaimed Asphalt Pavement Management: Best Practice (West
2010)
• Reclaimed Asphalt Pavement in Asphalt Mixtures: State of the
Practice (FHWA 2011)
• NCHRP Report 752 Improved Mix Design, Evaluation, and Materials
Management Practices for Hot Mix Asphalt with High Reclaimed
Asphalt Pavement Content (West, Willis & Marasteanu 2013)
• Information Series 138 Asphalt Pavement Industry Survey on
Recycled Material and Warm-Mix Asphalt Usage 2015 (NAPA 2015a)
• Quality Improvement Series 129 Best Practices for RAP and RAS
Management (NAPA 2015b)
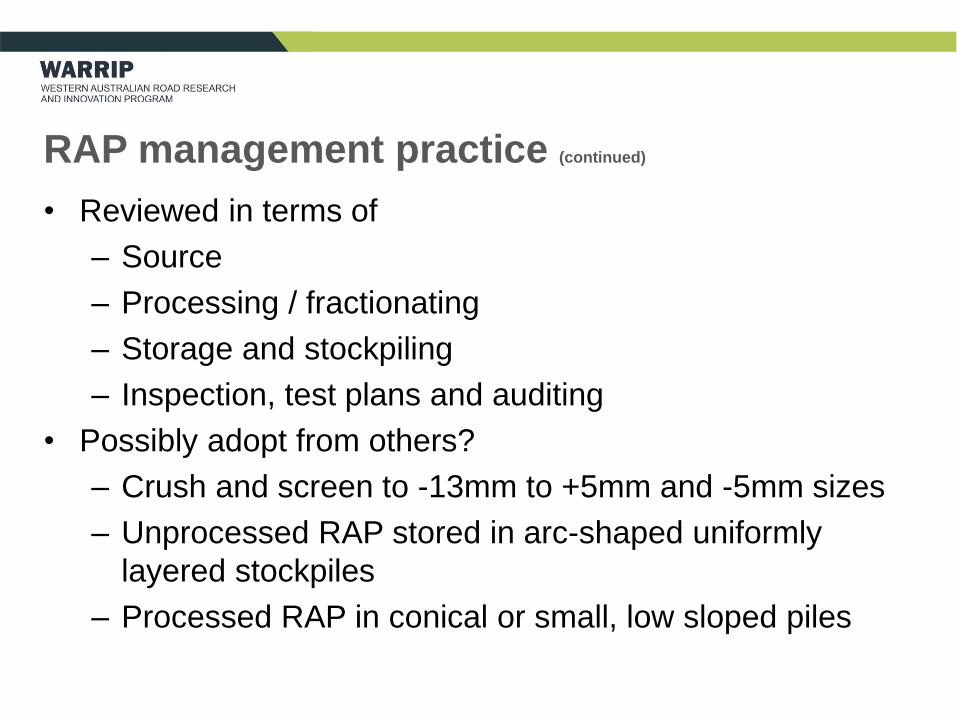
RAP management practice (continued)
• Reviewed in terms of
– Source
– Processing / fractionating
– Storage and stockpiling
– Inspection, test plans and auditing
• Possibly adopt from others?
– Crush and screen to -13mm to +5mm and -5mm sizes
– Unprocessed RAP stored in arc-shaped uniformly
layered stockpiles
– Processed RAP in conical or small, low sloped piles
RAP management practice (continued)
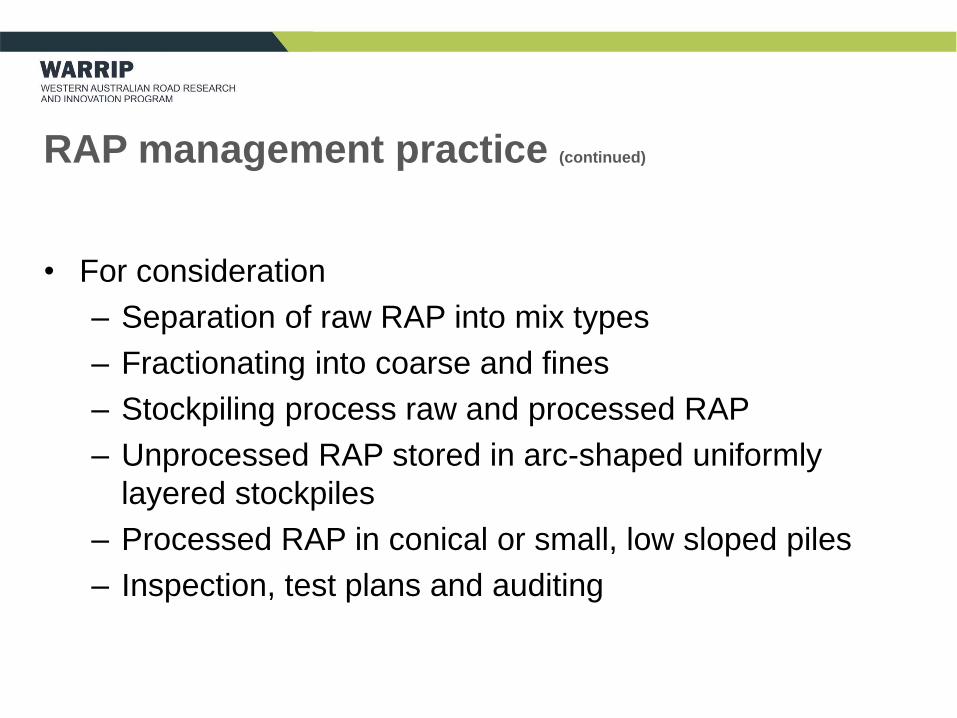
• For consideration
– Separation of raw RAP into mix types
– Fractionating into coarse and fines
– Stockpiling process raw and processed RAP
– Unprocessed RAP stored in arc-shaped uniformly
layered stockpiles
– Processed RAP in conical or small, low sloped piles
– Inspection, test plans and auditing
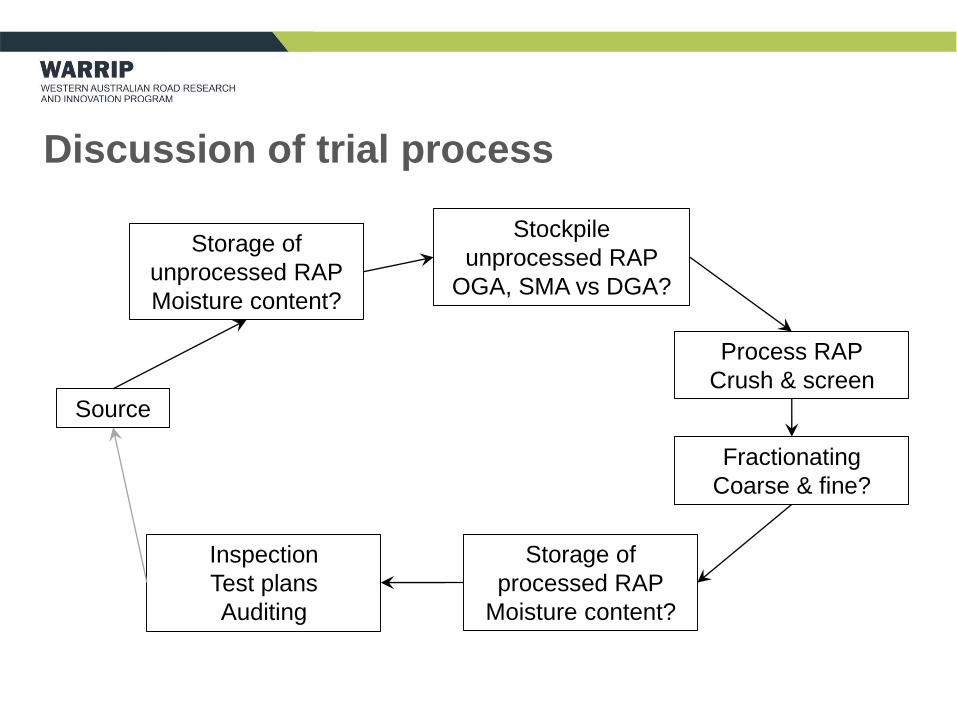
Discussion of trial process
Source
Stockpile
unprocessed RAP
OGA, SMA vs DGA?
Process RAP
Crush & screen
Fractionating
Coarse & fine?
Storage of
processed RAP
Moisture content?
Storage of
unprocessed RAP
Moisture content?
Inspection
Test plans
Auditing
Discussion (2nd screen)
• Possibly adopt from others in Australasia?
– Project quality plan to monitor consistency of grading, binder
properties and incoming RAP if >10% RAP in mix
• Possibly adopt from others?
– Crush and screen to -13mm to +5mm and -5mm sizes
– Unprocessed RAP stored in arc-shaped uniformly layered
stockpiles
– Processed RAP in conical or small, low sloped piles

Summary of discussion
• Action items:

Thank you for your time and participation


