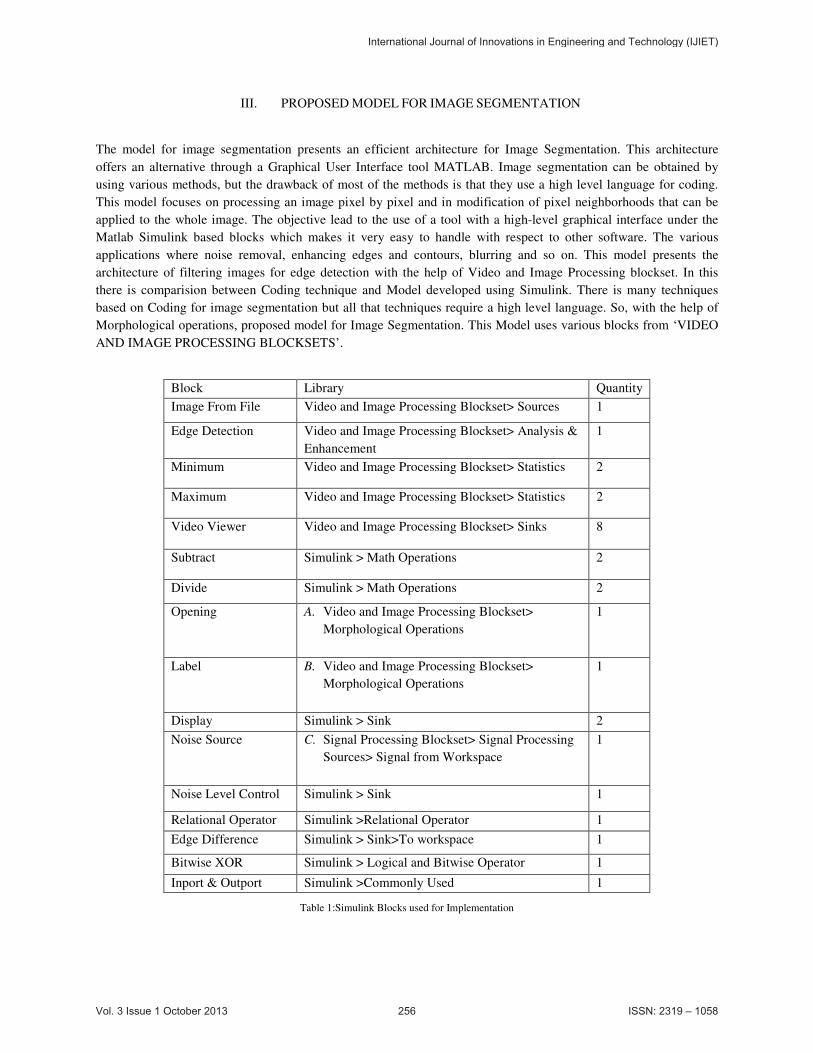
IMPLEMNTATION OF SIMULINK BASED MODEL USING SOBEL EDGE DETECTOR FOR DENTAL PROBLEMS Deepika Nagpal MTech Scholar from JCDVP,Sirsa Lekha bhambhu Assistant Prof. JCDVP Sirsa Abstract- Image Segmentation is the process of partitioning a digital image into multiple regions or sets of pixels.Edge Detection is one of the main Technique used in Segmentation.In this paper we used Sobel edge detector for segmenting the dental X-ray image.Using MATLAB,Image is segmented.Sysytem Test tool is used for the verification of the Simulink Model. The Simulink Model based Image Segmentation is a new function in image processing and offers a model based design for processing. Dental Caries is the main problem occurred in the teeths.Segmentation help to identify the places where the problems of dental caries are present. Keywords:Segmentation,Simulink,MATLAB,System Test,Dental Caries. I. INTRODUCTION Segmentation of an image entails the division or separation of the image into regions of similar attribute. The basic attribute for segmentation is image amplitude-luminance for a monochrome image and color components for a color image. Image edges and textures are also useful attributes for segmentation. The result of image segmentation is a set of regions that collectively cover the entire image, or a set of contours extracted from the image. Segmentation does not involve classifying each segment. The segmentation only subdivides an image; it does not attempt to recognize the individual segments or their relationships to one another. A major goal of image segmentation is to identify structures in the image that are likely to correspond to scene objects. Current approaches to segmentation mainly rely on image-based criteria, such as the grey level or texture uniformity of image regions, as well as the smoothness and continuity of bounding contours. In this work we describe a segmentation method that is guided primarily by high-level information and the use of class-specific criteria. The motivation for using such class-based criteria to supplement the traditional use of image-based criteria in segmentation has two parts. First, it stems from the fact that although recent image-based segmentation algorithms provide impressive results, they still often fail to capture meaningful and at times crucial parts. Second, evidence from human vision indicates that high-level, class- based criteria play a crucial role in the ability to segment images in a meaningful manner, suggesting that the incorporation of such methods will help improve the results of computer vision segmentation algorithms. II. VARIOUS CRITERIA FOR IMAGE SEGMENTATION Segmentation subdivides an Image into its constituent regions or objects. The level to which the subdivisions are carried depends on the problem being solved. That is, segmentation should stop when the objects of interest have been isolated. For example, in the automated inspection of electronic assemblies, interest lies in analyzing images of the products with the objective of determining the presence or absence of specific anomalies, such as missing components or broken connection paths. International Journal of Innovations in Engineering and Technology (IJIET) Vol. 3 Issue 1 October 2013 254 ISSN: 2319 – 1058
Transcript
IMPLEMNTATION OF SIMULINK BASED
MODEL USING SOBEL EDGE DETECTOR
FOR DENTAL PROBLEMS
Deepika Nagpal
MTech Scholar from JCDVP,Sirsa
Lekha bhambhu
Assistant Prof. JCDVP Sirsa
Abstract- Image Segmentation is the process of partitioning a digital image into multiple regions or sets of pixels.Edge
Detection is one of the main Technique used in Segmentation.In this paper we used Sobel edge detector for segmenting the
dental X-ray image.Using MATLAB,Image is segmented.Sysytem Test tool is used for the verification of the Simulink
Model. The Simulink Model based Image Segmentation is a new function in image processing and offers a model based
design for processing. Dental Caries is the main problem occurred in the teeths.Segmentation help to identify the places
Bitwise XOR Simulink > Logical and Bitwise Operator 1
Inport & Outport Simulink >Commonly Used 1
International Journal of Innovations in Engineering and Technology (IJIET)
Vol. 3 Issue 1 October 2013 256 ISSN: 2319 – 1058
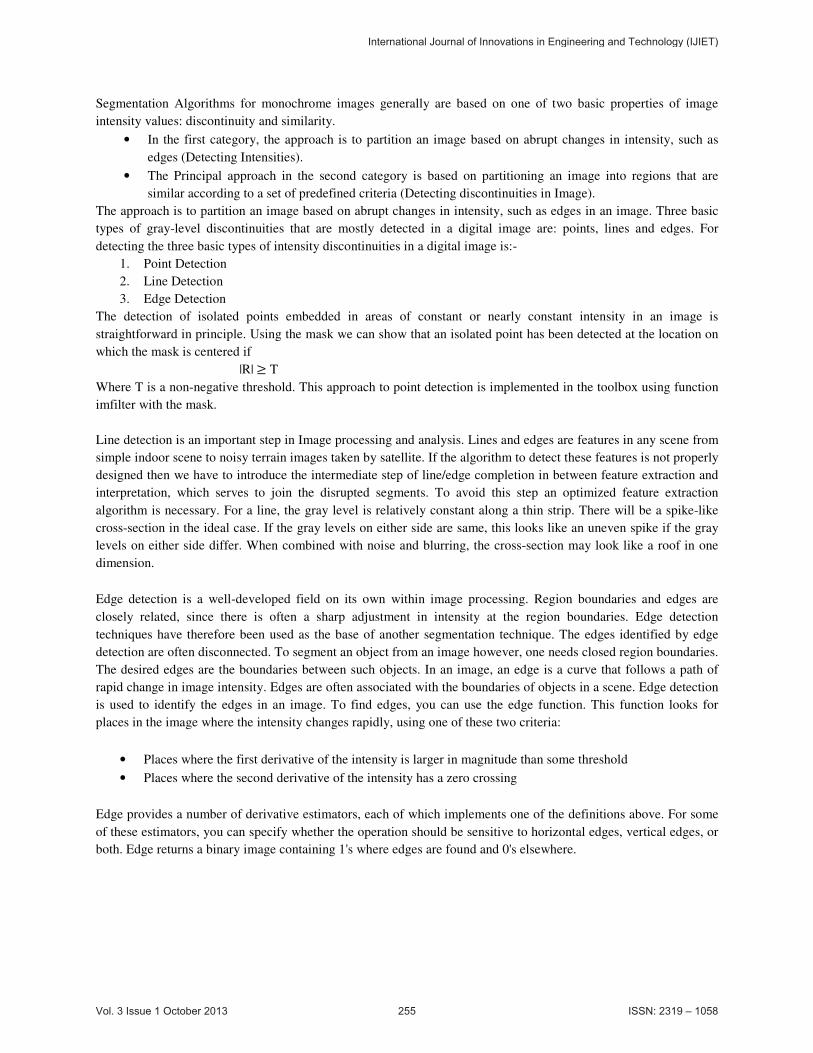
IV. IMPLEMENTATION
Fig. 1 shows simulink model for sobel edge detection
A.Simulation
The simulation results of the propoosed work are presented in this paper. The image metrics like partition
coefficient, partition entropy and the percentage of misclassified pixels are used in the chapter to compare between
the various existing and proposed algorithms. Extensive qualitative and quantitative analysis is done for comparing
the clustering and segmentation results obtained using the different algorithms, under increasing noise condition.
The algorithms are tested on synthetic image, real world image and biomedical image. We discuss coding
technique,the results and simulation for that technique (Sobel Edge Detector) are discussed below. Coding technique
such as:
In an image, an edge is a curve that follows a path of rapid change in image intensity. Edges are often associated
with the boundaries of objects in a scene. Edge provides a number of derivative estimators, each of which
implements one of the definitions above. For some of these estimators, you can specify whether the operation should
be sensitive to horizontal edges, vertical edges, or both. Edge returns a binary image containing 1's where edges are
found and 0's elsewhere. The most powerful edge-detection method that edge provides is the Sobel method. The
Sobel method differs from the other edge-detection methods in that it uses two different thresholds (to detect strong
and weak edges), and includes the weak edges in the output only if they are connected to strong edges. This method
is therefore less likely than the others to be fooled by noise, and more likely to detect true weak edges.
B.Creation of Histogram
Histogram is used for showing the comparision between the simulink based model and the coding based model. The
no of pixels defines that the proposed model gives better result in segmentation.
C.Testing the algorithm using SystemTest tool
International Journal of Innovations in Engineering and Technology (IJIET)
Vol. 3 Issue 1 October 2013 257 ISSN: 2319 – 1058
System Test tool is used for the verification of the Simulink model. The System Test software provides MATLAB
and Simulink users with a framework that integrates software, hardware, simulation, and other types of testing in
one environment. It uses predefined elements to build test sections that simplify the development and maintenance
of standard test routines. The System Test software provides MATLAB and Simulink users with a framework that
integrates software, hardware, simulation, and other types of testing in one environment. It uses predefined elements
to build test sections that simplify the development and maintenance of standard test routines. There are four
primary stages of testing: Planning, Building, Running the test, Viewing test results.
In order to perform the test we use some Golden reference values. The model must match the results produced by
the golden reference within an absolute tolerance level of 10%. The test cases for which this condition must be met
are:
• Threshold values ranging from 365 to 535
• Noise levels ranging from 0 to 100
Using System Test, test vectors are created representing this range of threshold and noise level values. The elements
are used to perform the testing are:Simulink Element,Limit Check Element,General Plot Element.
For each main test iteration, the following information is saved as a result for post-processing by specifying them
under Save Results:
• Measured difference between both algorithm implementations
• The pass/fail value determined by the Limit Check element
The Results of system Test are displayed on the Run Status. A test Report and Test Results file gives the Output
generated by the System test Tool. Test Report Contains the information about running iterations with various Test
Variables. By clicking on the Test Results File the output is displayed on the Command window of MATLAB.
stresults gives the Test Results Object Summary for the running model.Whareas stresults.ResultsDataSet is used to
display test results data. Using this information Graph are Plotted between various test Parameters.
V. RESULTS
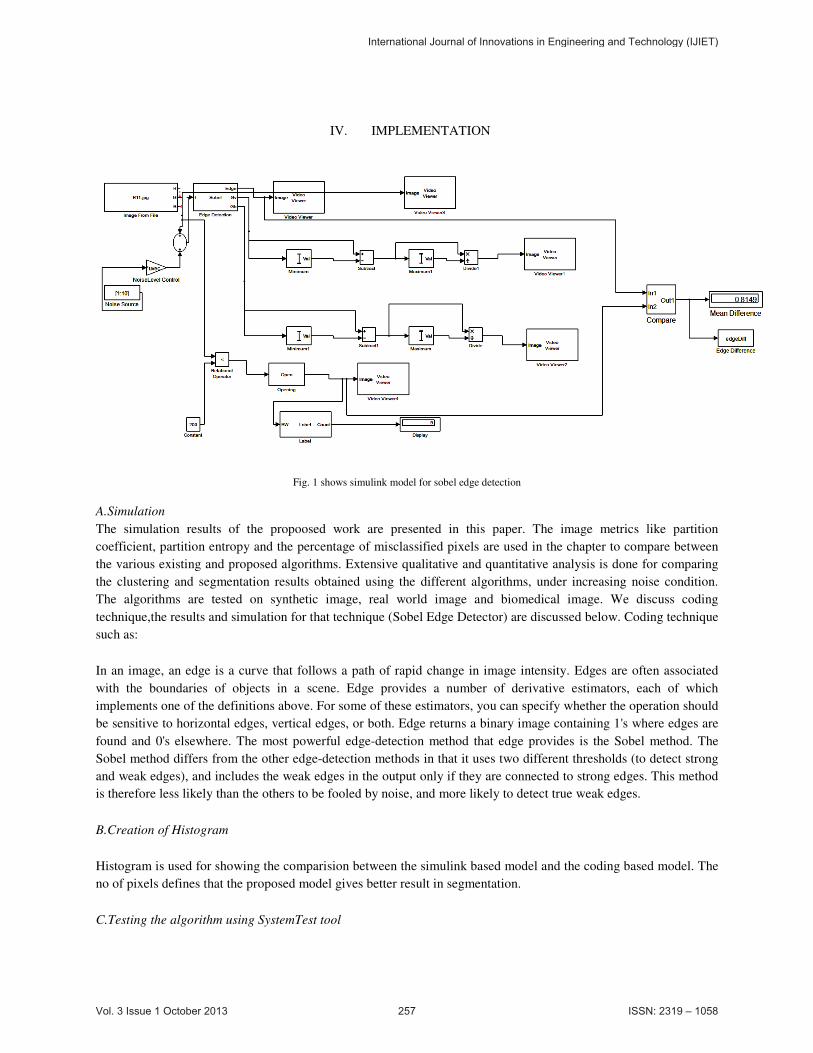
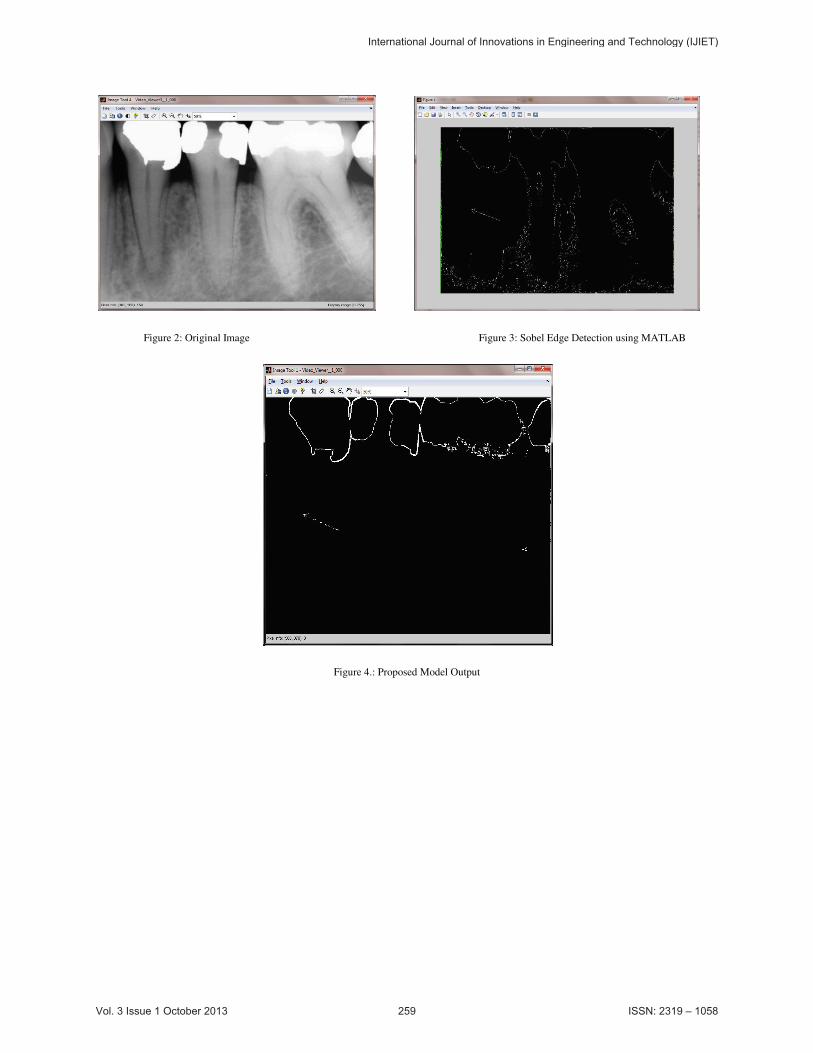
Figure 2 shows original image used for segmentation. Figure 3 and figure 4 shows output of coding based model and
simulink model. Figure 5, 6 and 7 shows the histogram of the above three figures which helps for the comparision
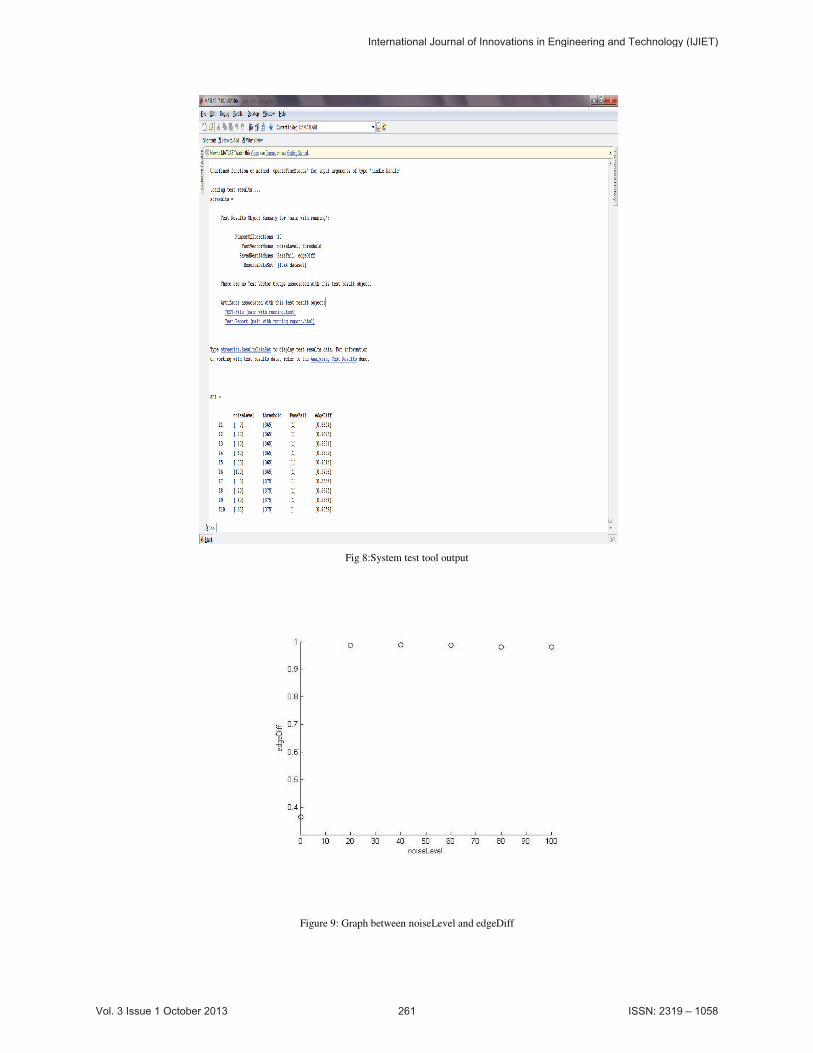
between the various images. Figure 8 shows the output of the System test tool. The graph is plotted between edge
difference and noiselevel which was obtained by running the system test tool.
International Journal of Innovations in Engineering and Technology (IJIET)
Vol. 3 Issue 1 October 2013 258 ISSN: 2319 – 1058
Figure 2: Original Image Figure 3: Sobel Edge Detection using MATLAB
Figure 4.: Proposed Model Output
International Journal of Innovations in Engineering and Technology (IJIET)
Vol. 3 Issue 1 October 2013 259 ISSN: 2319 – 1058
Fig 5: Histogram of Original Image Fig 6: Histogram of Sobel Edge Detector Image using MATLAB
Fig 7: Histogram of Output image for Proposed Model
International Journal of Innovations in Engineering and Technology (IJIET)
Vol. 3 Issue 1 October 2013 260 ISSN: 2319 – 1058
Fig 8:System test tool output
Figure 9: Graph between noiseLevel and edgeDiff
International Journal of Innovations in Engineering and Technology (IJIET)
Vol. 3 Issue 1 October 2013 261 ISSN: 2319 – 1058
VI. CONCLUSION
This Simulink model focuses on processing an image pixel by pixel and in modification of pixel neighborhoods that
can be applied to the whole image. This result gives comparision between Coding techniques and Simulink Model
based technique and gives the conclusion that Simulink Based techniques are easy to understand and
Implement.Comparisions are done with the help of Histogram. System test tool is used for the verification of the
proposed simulink model.
VII. REFERENCES
[1]. G.T. Shrivakshan,Dr.C. Chandrasekar,“A Comparison of various Edge detectionTechniques used in Image Processing”,IJCSI International Journal of Computer Science Issues, Vol. 9, Issue 5, No 1, pp. 269-276,September 2012.
[2]. Zolqernine Othman,Habibollah Haron, Mohammed Rafiq ,Abdul Kadir, “Comparison of Canny and Sobel Edge Detection in MRI Images”, Computer Science, Biomechanics & Tissue Engineering Group, and Information System,.133-136
[3]. Law Todd, ItohHidenori, “Image filtering, edge detection, and edge tracing”, IEEE transactions on pattern analysis and machine intelligence, vol. 18, no. 5, May(1996), pp. 481-491.
[4]. Orlando J. Tobias and Rui Seara, ”Image Segmentation by Histogram Thresholding Using Fuzzy Sets”, IEEE Transactions on Image Processing, Vol.11, No.12, 2002, pp. 1457-1465.
[5]. N. Senthilkumaran and R. Rajesh, “Edge Detection Techniques for Image Segmentation - A Survey”, Proceedings of the International Conference on Managing Next Generation Software Applications (MNGSA-08), 2008, pp.749-760.
[6]. Salem Saleh Al-amri and N.V. Kalyankar,” Image Segmentation By Using Edge Detection”, International Journal on Computer Science and Engineering(IJCSE),Vol. 02, No. 03, 2010,pp. 804-807.
[7]. Rezai-Rad, G. and M. Aghababaie (2006).Comparison of SUSAN and Sobel Edge Detection in MRI Images for Feature Extraction. In Information and Communication Technologies ICTTA '06. 2nd. pp 1103 - 1106.
[8]. Samir Shah, Ayman Abaza, Arun Ross ,Hany Ammar, “Automatic Tooth Segmentation Using Active Contourwithout Edges”, IEEE 2006 Biometrics Symposium
[9]. Pedro H. M. Lira, Gilson A. Giraldi, “Panoramic Dental X-Ray Image Segmentation and Feature Extraction”.
[10]. Russo F., “Edge detection in noisy images using reasoning”, IEEE transactions on instrumentation and measurement, vol.47, no.5 1998, pp. 1102-1105.
[11]. Nassir Salman,” Image Segmentation Based on Watershed and Edge Detection Techniques”, The International Arab Journal of Information Technology, Vol. 3, No. 2, April 2006.