Page 1
i
IMPLICATIONS OF CORPORATE SOCIAL RESPONSIBILITY ON FINANCIAL AND
NON-FINANCIAL PERFORMANCE OF BANKING SECTOR OF PAKISTAN:
MODERATING ROLE OF STAKEHOLDER PRESSURE AND MEDIATING ROLE OF
INNOVATION AND CORPORATE REPUTATION
BY
MUZAMMAL ILYAS SINDHU
ENROLMENT: 01-280152-007
A DISSERTATION SUBMITTED IN PARTIAL FULFILLMENT OF
THE REQUIREMENTS FOR THE DEGREE OF
DOCTOR OF PHILOSOPHY
IN MANAGEMENT SCIENCES
To
DEPARTMENT OF MANAGEMENT STUDIES
BAHRIA UNIVERSITY, ISLAMABAD, PAKISTAN
2020
Page 2
ii
SUBMISSION FORM OF THESIS FOR HIGHER RESEARCH DEGREE
BAHRIA UNIVERSITTY, ISLAMABAD
Candidate Name: Muzammal Ilyas Sindhu
Thesis Titled:
“Implications of Corporate Social Responsibility on Financial and Non-Financial Performance
of Banking Sector of Pakistan: Moderating Role of Stakeholder Pressure and Mediating Role of
Innovation and Corporate Reputation”
Candidate Signature: ____________________
Certificate of Principal Supervisor
I Dr Muhammad Arif being the principal Supervisor for the above scholar, certifies that thesis is
in a form suitable for examination and that the candidate has pursued his course in accordance
with the Rules of the University.
Signature: _______________________ Date: ______________________
Recommendation for Examination
I recommend that the thesis be examined.
Principal Supervisor: _______ Dr Muhammad Arif __________ Date: _____________________
Co-Supervisor:_________________ Date: _____________________
Not Recommended for Examination
I recommend that the thesis be examined.
Principal Supervisor: ____________________________________ Date: ___________________
Co-Supervisor:______________________ Date: __________________
Statement by the Head Faculty/Department
I support the submission of the thesis of the above named student for examination under the
University Rules for higher degrees.
Signature: ______________________________________________ Date: _________________
Page 3
iii
BAHRIA UNIVERSITY, ISLAMABAD
APPROVAL SHEET
SUBMISSION OF HIGHER RESEARCH DEGREE THESIS
Candidate’s Name: Muzammal Ilyas Sindhu
Discipline: Management Sciences
Faculty/ Department: Management Studies
I hereby certify that the above candidate’s work, including the thesis, has completed to my
satisfaction and that the thesis is in a format and of an editorial standard recognized by the
faculty/ department as appropriate for examination.
Signature(s) Principal Supervisor: Dr Muhammad Arif
Dated: -----------------------------------
The undersigned certify that:
The candidate presented at a pre-completion seminar, and overview and synthesis of
major findings of the thesis, and that the research is of a standard and extent appropriate for
submission as a thesis.
I have checked the candidate’s thesis and its scope, format; editorial standards are
recognized by the faculty/department as appropriate.
Signature(s) Dean/Head of Faculty/ Department:
Dated: ------------------
Page 4
iv
COPYRIGHT
Copyright © [2019] by Muzammal Ilyas Sindhu
All Rights Reserved
The thesis and its content including the proposed title “Implications of Corporate Social
Responsibility on Financial and Non-Financial Performance of Banking Sector of Pakistan:
Moderating role of Stakeholder pressure and mediating role of innovation and corporate
reputation” are the copyright of in the undersigned PhD scholar’s name as author.
Sign(s) PhD scholar: Muzammal Ilyas Sindhu
Page 5
v
AUTHOR’S DECLARATION
I, Muzammal Ilyas Sindhu, PhD Scholar in the Department of Management Studies, Bahria
University, Islamabad, certify that the research work presented in this thesis is to the best of my
knowledge my own. All sources used and any help received in the preparation of this dissertation
have been acknowledged. I hereby declare that I have not submitted this material, either in
whole or in part, for any other degree at this or other institution. At any time if my statement is
found to be incorrect even after my graduation, the University has the right to withdraw/cancel
my PhD Degree.
Signature: ___________________
Name: Muzammal Ilyas Sindhu
Page 6
vi
Dedication
I dedicate this thesis to “Allah Almighty” my eternal rock and source of refuge,
Who gave me the passion to work hard and struggle to comply with my destiny
and to “Hazrat Muhammad (PBUH)” the one who enlightened my heart with the
rules to follow.
This thesis is also dedicated to
My beloved parents, siblings, my wife and daughters (Manahil Bahu, Mahnoor
Muzammal, Malaika Muzammal) as their love, care and support for my studies
without which I could not be able to reach at this level.
(May Allah Bless Me, My Family and Well Wishers)
Page 7
vii
ACKNOWLEDGEMENTS
All praises to “Allah Almighty” Who enabled me to complete this task successfully and my
utmost respect to His last Prophet Muhammad (PBUH).
I would like to express the deepest appreciation of my respected supervisor Prof Dr Muhammad
Arif for his patience, motivation, enthusiasm, immense knowledge and continuous support in
completion of my PhD thesis. His guidance helped me all the time in research and writing of
thesis. I could not have imagined having a better advisor and mentor for my PhD thesis.
Besides my supervisor, I would like to thank the rest of my Final defense committee: respected
Dr. Muhammad Khalid Sohail, Dr. Muhammad Razzaq Athar and Dr. Shehzad Anjum, for their
encouragement, insightful comments, and hard questions. I want to gratefully acknowledge my
respected teachers Prof. Dr Hafiz Mushtaq Ahmed, Prof. Dr. Muhammad Ismail Ramay, Prof. Dr
Nadia Tahir, Prof. Dr. Faisal Aftab, Dr Muhammad Hanif, Dr. Riaz Ahmed, Dr Abdul Sattar, Dr
Taqaddas Bashir Chaudhry, and Dr Abdul Qazi Subhan; all of them revolutionized my life in a
very real sense by planting the seeds of research and logic, what I learnt in their classes and from
their professionalism has not only add up to my knowledge but, I feel to be a better person. I am
grateful to Dr. Anwar Fazal Chishti for enlightening me the first glance of research.
I thank my beloved friends Dr Hafiz Muhammad Waqar, Muhammad Irfan Khadim, Saif ul
Rehman, Syeda Urooj Babar, Aqil Waqar Khan, Kamran Iqbal, Faisal Mehmood, Syed Usman
Lutfi, Sarina Shrizai, and Tanveer Taj who guide me in initiation of this research thesis. I also
thanks to my fellows Ehtasham Ul Haq and Muhammad Iftikhar Ali for the stimulating
discussions, for the sleepless nights we were working together before deadlines, and for all the
fun we have had in the couple of months. Also I thank my well-wisher’s Sana Ullah Khan,
Akhter, Shakeel Abbas, Ali Hassan, Abid Hussain, and Muhammad Ifraheem. In particular, last
but not the least; I would like to thank my parents for giving birth to me at the first place and to
my wife, siblings for always being encouraging and supporting me spiritually.
Muzammal Ilyas Sindhu
Page 8
viii
PLAGIARISM UNDERTAKING
I, solemnly declare that research work presented in the thesis titled
“Implications of Corporate Social Responsibility on Financial and Non-Financial
Performance of Banking Sector of Pakistan: Moderating role of Stakeholder
pressure and mediating role of innovation and corporate reputation” is solely my
research work with no significant contribution from any other person. Small
contribution / help wherever taken has been duly acknowledged and that complete
thesis has been written by me.
I understand the zero tolerance policy of the HEC and Bahria University towards
plagiarism. Therefore I as an Author of the above titled thesis declare that no portion
of my thesis has been plagiarized and any material used as reference is properly
referred / cited.
I undertake that if I am found guilty of any formal plagiarism in the above titled
thesis even after award of PhD degree, the university reserves the right to withdraw /
revoke my PhD degree and that HEC and the University has the right to publish my
name on the HEC / University website on which names of scholars are placed who
submitted plagiarized thesis.
Scholar / Author’s Sign: ____________
Name of the Scholar: Muzammal Ilyas Sindhu
Page 9
ix
ABSTRACT
In the banking sector, besides the short-term internal business interests of financial companies,
social, environmental and human rights objectives are gaining a dominant and interesting role. In
this perspective, engagement in socially responsible activities can serve as a strategic tool for a
firm’s to avail competitive edge. This evident that corporate social responsibility plays important
role in determining bank performance and it convinced to examine the relationship between CSR
and performance in the banking industry of Pakistan. Furthermore, this study examined the
moderating impact of stakeholder pressure and mediating influence of innovation and corporate
reputation in between the relationship of CSR and performance. There were total 405 responses
analyzed for examining aforementioned relationships. Structural equation modeling was applied
and the direct relationship indicated that there is a significant and positive relationship between
corporate social responsibility and financial performance. These findings were supported by
multiple studies, as they already tested the significant and positive relationship between these
two factors. The direct relationship indicated that there is a significant and positive relationship
between corporate social responsibility and non-financial performance. Corporate social
responsibility directly influenced financial and non-financial performance. In other direct
relationships, corporate social responsibility also influenced innovation and corporate reputation.
The innovation influenced corporate reputation, financial and non-financial performance.
Corporate reputation showed no significant influence on financial and non-financial
performance. In research analysis, simple mediations indicated that innovation played significant
mediation role in relationship between CSR, financial and non-financial performance. Moreover,
corporate reputation also mediated among CSR, financial and non-financial performance. In case
of sequential mediation, innovation and corporate reputation have strongly played role as
mediating variable among CSR, financial and non-financial performance. Last but not least,
stakeholder pressure moderated and established relation of CSR, financial and non-financial
performance. This study contributes to existing knowledge, and beneficial to policy makers,
corporate managers, and executives in establishing corporate strategies. As proposed that if the
banking industry improves their socially responsible activities, it tends toward establishing trust
among stakeholders and enhances their performance.
Keywords:
Corporate Social Responsibility; Financial Performance; Non-Financial Performance;
Innovation; Corporate Reputation; Stakeholder Pressure; Structural Equation Modeling
Page 10
x
TABLE OF CONTENTS
Title Page i
Submission Form ii
Approval Sheet iii
Copy Right iv
Author’s Declaration v
Dedication vi
Acknowledgements vii
Plagiarism undertaking viii
Abstract ix
Table of Contents x
List of Tables xiv
List of Abbreviations xvi
HEC Publication Requirement xvii
CHAPTER 1
INTRODUCTION
1.1 Background of the Study 01
1.2 Contextual Analysis 07
1.3 Rationale of the Study 11
1.4 Problem Statement 13
1.5 Research Questions 15
1.6 Research Objectives 15
1.7 Significance of the study 16
CHAPTER 2
LITERATURE REVIEW
2.1 Introduction 17
2.2 Literature Search Strategy 17
2.3 Corporate Social Responsibility 17
2.4 Dimensions of CSR 24
2.5 Stakeholder Pressure 28
2.6 Corporate Reputation 32
2.7 Innovation 33
2.8 Corporate social responsibility and Financial Performance 35
2.9 Corporate social responsibility, Stakeholder Pressure and Performance 39
2.10 Corporate social responsibility, Corporate Reputation and Performance 42
2.11 Corporate social responsibility, Innovation and Performance 47
2.12 Theoretical Background 52
2.13 Conceptual Framework 54
2.15 Hypothesis 55
Page 11
xi
CHAPTER 3
THE DATA AND RESEARCH METHODOLOGY
3.1 Introduction 56
3.2 Target Population 57
3.3 Sampling Design 57
3.4 Data Collection 58
3.5 Measurement Scale 58
3.6 Data Analysis Techniques 59
3.6.1 Normality Tests 60
3.6.2 Descriptive Statistics 60
3.6.3 Correlation 61
3.6.4 Structural Equation Modeling 61
3.7 Pilot Testing 63
3.8 Ethical Consideration 64
CHAPTER 4
EMPIRICAL STUDY
4.1 Introduction 65
4.2 Assessment of Measurement Models 65
4.2.1 Measurement Models of Corporate Social Responsibility 65
4.2.1.1 Descriptive Statistics 65
4.2.1.2 Assessment of Overall Fitness 67
4.2.1.3 Assessment of Inter Item Correlation and Reliability 73
4.2.2 Measurement Models of Corporate Reputation 74
4.2.2.1 Descriptive Statistics 74
4.2.2.2 Assessment of Overall Fitness 75
4.2.2.3 Assessment of Inter Item Correlation and Reliability 79
4.2.3 Measurement Models of Innovation 81
4.2.3.1 Descriptive Statistics 81
4.2.3.2 Assessment of Overall Fitness 82
4.2.3.3 Assessment of Inter Item Correlation and Reliability 86
4.2.4 Measurement Models of Financial Performance 87
4.2.4.1 Descriptive Statistics 87
4.2.4.2 Assessment of Overall Fitness 88
4.2.4.3 Assessment of Inter Item Correlation and Reliability 91
4.2.5 Measurement Models of Non-Financial Performance 93
4.2.5.1 Descriptive Statistics 93
4.2.5.2 Assessment of Overall Fitness 94
Page 12
xii
4.2.5.3 Assessment of Inter Item Correlation and Reliability 98
4.2.6 Measurement Models of Stakeholder Pressure 100
4.2.6.1 Descriptive Statistics 100
4.2.6.2 Assessment of Overall Fitness 101
4.2.6.3 Assessment of Inter Item Correlation and Reliability 104
4.3 Assessment of Structural Model 106
4.3.1. Normality 106
4.3.1.1. Descriptive Statistics of Overall Selected Variables 106
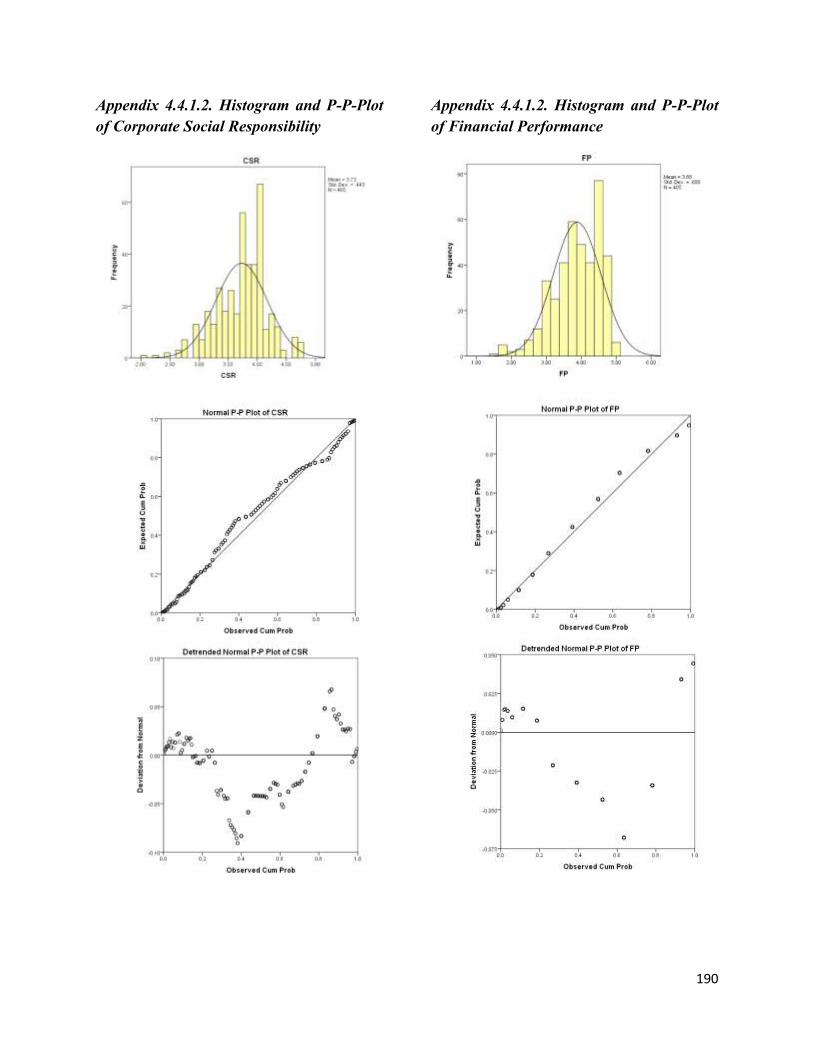
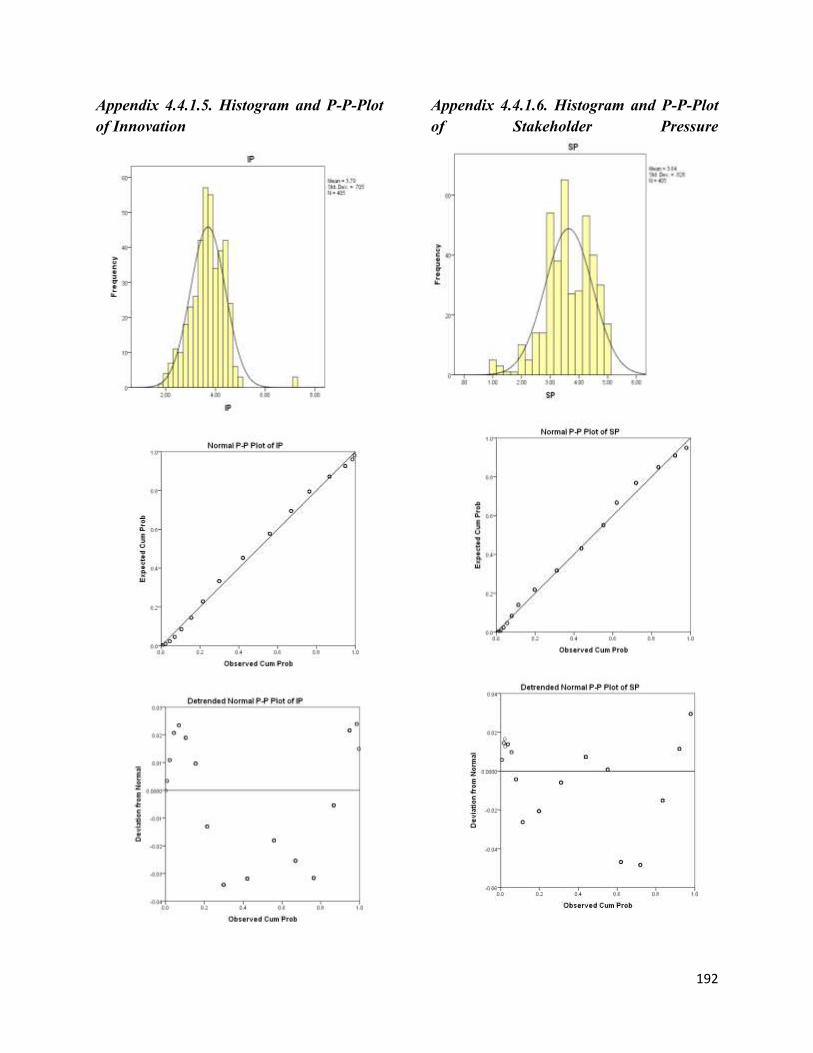
4.3.1.2. Histogram and P-P Plot 107
4.3.2. Linearity 108
4.3.3. Multicollinearity 108
4.3.4. Demographics 110
4.3.5. Reliability and Validity Analysis 111
4.3.6. Goodness and Fitness 112
4.3.7. Correlation Matrix 114
4.4 Hypothesis Testing 115
4.4.1 Direct Relationship 115
4.4.1.1 Corporate Social Responsibility and Financial Performance 115
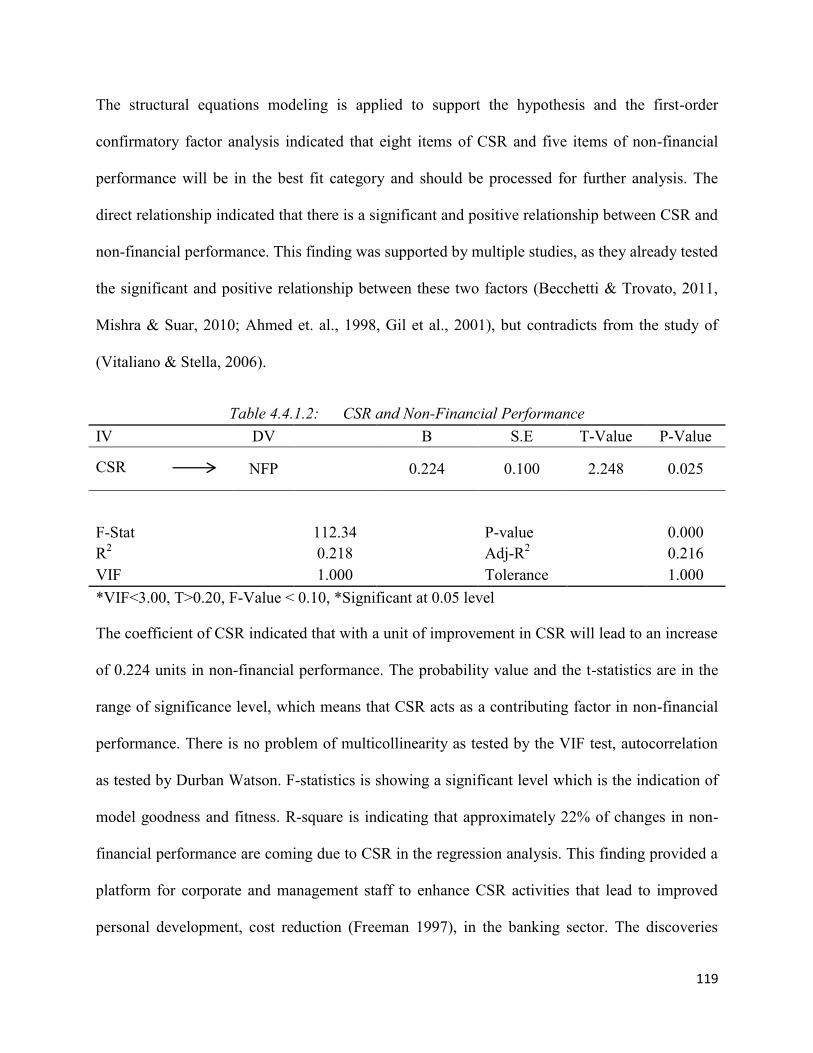
4.4.1.2 Corporate Social Responsibility and Non-Financial Performance 118
4.4.1.3 Remaining Direct Relationships 120
4.4.2 Simple Mediation 122
4.4.2.1 Innovation mediating the relationship of Corporate Social Responsibility
and Financial Performance 122
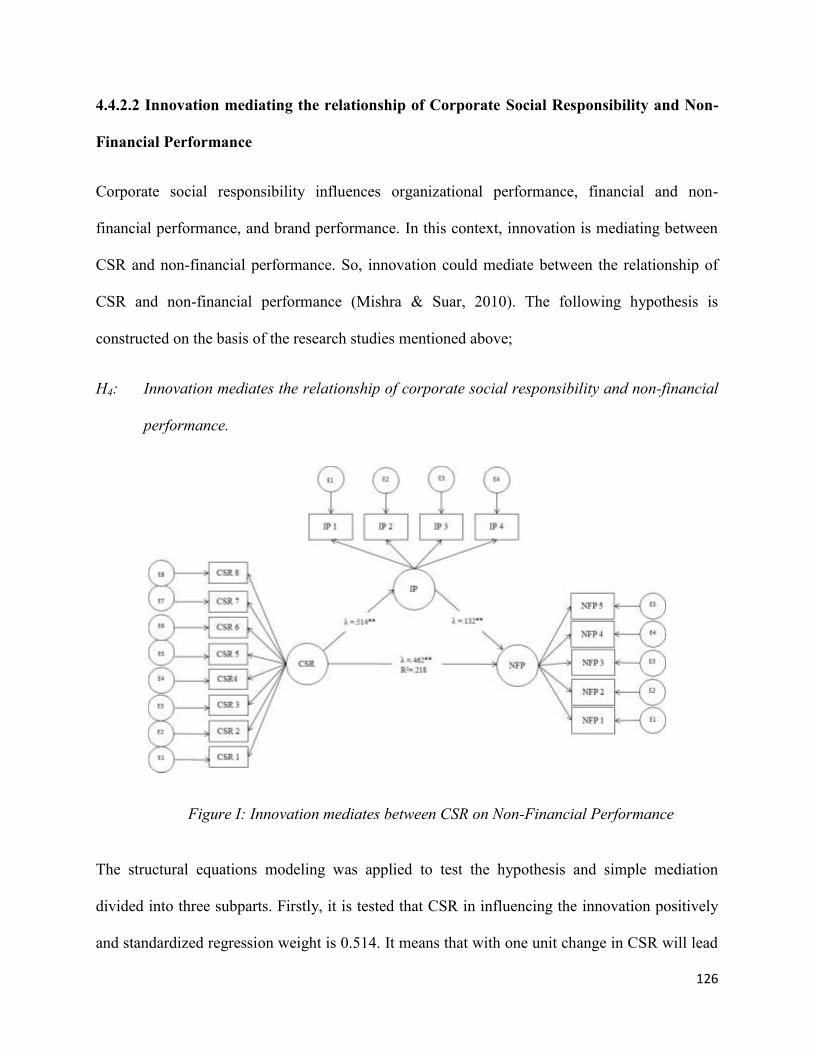
4.4.2.2 Innovation mediating the relationship of Corporate Social Responsibility
and Non-Financial Performance 126
4.4.2.3 Corporate Reputation mediating the relationship of Corporate Social
Responsibility and Financial Performance 129
4.4.2.4 Corporate Reputation mediating the relationship of Corporate Social
Responsibility and Non-Financial Performance 132
4.4.3 Sequential Mediation 135
4.4.4 Moderation 140
4.4.4.1 Moderation I 140
4.4.4.2 Moderation II 142
CHAPTER 5
DISCUSSION AND CONCLUSION REMARKS
5.1 Introduction 144
5.2 Discussion 144
5.3 Conclusion 148
5.4 Contribution to knowledge 150
5.5 Implications 151
Page 13
xiii
5.6 Limitations 152
5.7 Delimitations 153
5.8 Recommendations and Future direction 154
References 156
Appendixes 190
Questionnaire 195
Sample selection 199
Page 14
xiv
LIST OF TABLES
Table 2.1: Evolving definitions of CSR 20
Table 4.2.1.1 Descriptive Statistics of CSR 66
Table 4.2.1.2: Fit levels of Original CSR Measurement Model 68
Table 4.2.1.3: Comparative Fitness levels of CSR Measurement Model 72
Table 4.2.1.4: Inter Item Correlation of CSR Measurement Model 73
Table 4.2.2.1 Descriptive Statistics of Corporate Reputation 74
Table 4.2.2.2: Fit levels of Original CR Measurement Model 76
Table 4.2.2.3: Comparative Fitness levels of CR Measurement Model 78
Table 4.2.2.4: Inter-item Correlation of CR Measurement Model 79
Table 4.2.3.1 Descriptive Statistics of Innovation 81
Table 4.2.3.2: Fit levels of Original IP Measurement Model 83
Table 4.2.3.3: Comparative Fitness levels of IP Measurement Model 85
Table 4.2.3.4: Inter-Item Correlation of IP Measurement Model 86
Table 4.2.4.1 Descriptive Statistics of Financial Performance 87
Table 4.2.4.2: Fit levels of Original FP Measurement Model 89
Table 4.2.4.3: Comparative Fitness levels of FP Measurement Model 91
Table 4.2.4.4: Inter-item Correlation of Financial Performance Measurement Model 92
Table 4.2.5.1 Descriptive Statistics of Non-financial performance 93
Table 4.2.5.2: Fit levels of Original NFP Measurement Model 95
Table 4.2.5.3: Comparative Fitness levels of NFP Measurement Model 97
Table 4.2.5.4: Inter-item Correlation of NFP Measurement Model 98
Table 4.2.6.1 Descriptive Statistics of Stakeholder Pressure 100
Table 4.2.6.2: Fit levels of Original SP Measurement Model 102
Table 4.2.6.3: Comparative Fitness levels of SP Measurement Model 104
Table 4.2.6.4: Inter-item Correlation of SP Measurement Model 105
Table 4.3.1.1 Descriptive Statistics Overall 107
Table 4.3.3.1: Tolerance Level for Multicollinearity 109
Table 4.3.3.2: VIF Level for Multicollinearity 109
Table 4.3.4.1: Demographics 110
Table 4.3.5.1 Reliability and Validity Analysis 111
Table 4.3.6.1: Good and Fitness levels of Final Structural Model 112
Table 4.3.7: Correlation Matrix 114
Table 4.4.1.1: CSR and Financial Performance 117
Table 4.4.1.2: CSR and Non-Financial Performance 119
Table 4.4.1.3: Direct Relationships 120
Table 4.4.1.1: Mediation I 124
Table 4.4.2.2: Mediation II 127
Table 4.4.2.3: Mediation III 130
Table 4.4.2.4: Mediation IV 133
Page 15
xv
Table 4.4.3.1: Mediation V 136
Table 4.4.3.2: Mediation VI 139
Table 4.4.4.1: Moderation I 140
Table 4.4.4.2: Moderation II 142
Appendixes 190
Page 16
xvi
LIST OF ABBREVIATIONS
Sr No. Detailed Word Abbreviation
1 Analysis of Moment Structures AMOS
2 China Pakistan economic corridor CPEC
3 Chi-square χ²
4 Comparative fit index CFI
5 Confirmatory factor analysis CFA
6 Corporate reputation CR
7 Corporate social responsibility CSR
8 Exploratory factor analysis EFA
9 Financial performance FP
10 Goodness of fit index GFI
11 Gross domestic product GDP
12 Human resource Management HRM
13 Innovation IP
14 Karachi stock exchange KSE
15 Kurtosis Kurt
16 Non-governmental organization NGO
17 Non-financial performance NFP
18 Normed chi-square χ²/df
19 Normed fit index NFI
20 Return on Asset ROA
21 Root Mean Square Error of Approximation RMSEA
22 Root mean square residual RMR
23 Skewness Skew
24 Stakeholder pressure SP
25 Standard error SE
26 State Bank of Pakistan SBP
27 Statistical Package for the Social Sciences SPSS
28 Structural equation modeling SEM
29 United States of America US/USA
30 Variance inflation factor VIF
Page 17
xvii
HEC REQUIREMENT OF PUBLICATION
Paper Title:
1. Sindhu, M. I., & Arif, M. (2017). The inter linkage of corporate reputation between
corporate social responsibility and financial performance. Pakistan Journal of Commerce
and Social Sciences, 11(3), 898-910.
2. Sindhu, M. I., & Arif, M. (2017). Corporate social responsibility and loyalty: Intervening
influence of customer satisfaction and trust. Cogent Business & Management, 4(1), 1-10.
Authors Name:
Muzammal Ilyas Sindhu
Dr Muhammad Arif
Journal Name:
1. Pakistan Journal of Commerce and Social Sciences (Y Category)
2. Cogent Business & Management (ISI Indexed – ESCI)
Page 18
1
CHAPTER 1
INTRODUCTION
1.1 Background of the Study
Classical theories of finance are based on the notion that the main objective of any organization
is to maximize the shareholder‟s wealth. In the context of capitalistic economy, the sole
organizational concern should be to enhance their operating performance. Financial firms are
particularly more concerned about their performance because they have to contribute toward the
financial well-being of a society. So, organization does not concern only with financial goals but
they have to respond the non-financial interests of stakeholders. However, last few years
enlightened the stakeholder‟s activism and long term sustainability context. So, the main thrust
of my study is to examine the impact of corporate social responsibility on financial performance
(Robin, Salim & Bloch, 2018; Abusharbeh, 2017; Evans et al., 2014).
Financial performance considered a key indicator of financial firms specially banks. It indicates
whether the firms work efficiently, fulfill its goals, enhanced returns and maximized
shareholder‟s wealth. It leads toward the development of human resource, business prosperity,
and more profit distribution among shareholders. The strong financial position of the business is
an important aspect for everyone like workers, stakeholders, financial institutions and
government organizations and it indicate the effectiveness and efficiency of a business entity
(Robin, Salim & Bloch, 2018; Abusharbeh, 2017; Evans et al., 2014; Mohanty, 2006; Duncan &
Elliott., 2004; Reddy, 2004; Lin & Piesse, 2004; Beck & Levine, 2004; Waddock & Graves,
1997; Griffin & Mahon, 1997).
Page 19
2
In the modern era, the financial performance of banks is measured through asset evaluation,
efficient risk management, offering the innovative financial product. Moreover, issuance of
secured loan, return on asset, return on investment, earning per share, dividend yield, sales, and
profitability, orientation on wealth maximization, return on capital employed, wealth creation for
shareholders, and market value of shares are also considered important yardstick for the
valuation of banks (Bektas & Kaymak, 2009; Makni, Francoeur, & Bellavance, 2009; Gilbert &
Wheelock, 2007; Mishra & Suar, 2010; Agle et al., 1999; Fowler & Schmidt, 1988;
Govindarajan, 1984). Although financial performance remains vital, however non-financial
performance is also significant that affect the stakeholder‟s perceptions about an entity. Financial
performance remains exceptional, however due to rising competitive pressure; organizations are
focusing on non-economic aspects of business which remain material in long run. Non-financial
performance reflects the going concerns and long term sustainability of a business. Although it
seems subjective, however, its long term effects are objective and definite. It is operationalized
by using the measures of a number of employees, customer satisfaction, good customer dealing,
workplace relations; new product development, cost reduction programs, research and
development, personal development, ensuring employee health and safety (Govindarajan, 1984;
Hoque, 2004; Seiford & Zhu, 1999).
Financial performance is an integral part of the financial sector's planning and development. A
number of researchers examined positive relation between financial performance and economic
development, and a negative association between financial distress and economic development
(Muyambiri & Odhiambo, 2018; Musamali et al., 2014; Skare & Golja, 2014; Ekmekcioglu,
2012; Caprio & Levine, 1994). As global financial environment change rapidly, therefore
governments, regulators, managers, and investors are more concerned about banks performance
Page 20
3
as well as their working practices (Khan et al., 2017). Particularly, financial performance in the
context of banking remains more pragmatic and exceptional because the spillover effect of banks
financial instability leads toward other sectors of society. Therefore generally all entities,
however particularly banks remain more sensitive and proactive towards meeting their financial
goals.
The sound financial and non-financial performance positively affects the behavior of stakeholder
and increases the chances of customer retention. Past studies proclaimed various potential
determinants of financial and non-financial performance. Studies have been conducted in
different context and remain consistent in this opinion that financial and non-financial
performance is being determined by micro and macro-economic factors. Various
macro/microeconomic factors influence financial performance of banks. The gross domestic
product, inflation, operating cost efficiency, bank size, risk, and liquidity positively influence the
bank‟s financial performance while there is the negative impact of capital adequacy and
exchange rates on the bank performance (Elyor, 2009; Uzhegova, 2010; Kamau, 2009;
Heffernan & Fu, 2010). Financial innovation contributes to economic development (Schumpeter,
2013). Innovative companies have a competitive edge in this rapidly changing market
environment than its competitors having the low pace of innovation. Therefore, innovation is
also pivotal to signify the organizational performance (Abdulai Mahmoud & Hinson, 2012;
Gonzalez-Ramos et al., 2014). The companies which remain famous for innovation are
considered good companies (Padgett & Moura-Leite, 2012). According to past studies, the good
company means with a good reputation, so innovation remains a potential determinant to reflect
in entities' reputation in today's dynamic market environment (Anser et al., 2018; Padgett &
Moura-Leite, 2012; Padgett & Galan, 2010; Wagner, 2010).
Page 21
4
Studies expounded in past literature, advocate that company reputation is a potential determinant
of financial performance (Deephouse, Li & Newburry, 2009; Gardberg, 2006). Most of the
stakeholder believes that high returns are induced from companies having good reputation. The
firm reputation is a rare and inimitable resource of an entity which further result into competitive
advantage and improved organizational performance (Rindova et al., 2005; Roberts & Dowling,
2002; Barney, 1991). However, there is limited empirical evidence which devotes their efforts to
determine how corporate reputation affects organizational performance. Besides affecting
organizational performance, corporate reputation is also robust to affect stakeholder's perception
(Gatzert, 2015; Maden et al., 2012). It is the image of the organization in the mind of stakeholder
to decide to interact with an entity. Most of the economic contracts are earned on the basis of
corporate reputation.
Therefore, the extending this notion, it will be thought-provoking to investigate that how and to
what extent corporate reputation derive financial performance (Gatzert, 2015; Maden et al.,
2012; Alniacik, Alniacik & Erdogmus, 2012). Moreover, it is also important to study that how
corporate reputation is built over time by the organizations and what are the factors which
composite a favorable reputation in the mind of stakeholder. Last couple of years have witnessed
the surge of social and environmental activism and it is demanded by stakeholder that
organizations should meet the goal of long term sustainability and environmental preservation.
Though literature revealed various antecedents of corporate reputation, however corporate social
responsibility (CSR) is integral determinant (Choongo, 2017; Crifo et al., 2016; Lee & Jung,
2016; Gatsi et al., 2016; Famiyeh et al., 2016; Elouidani & Zoubir, 2015).
Corporations are legal entities, whose major responsibilities to earn a profit, maximize
shareholder wealth, and also contribute to society by enhancing value-added activities. These
Page 22
5
entities establish a corporate agenda with clearly indicating their social role which reveal them as
good citizens. Carroll (1999, 1979) suggested that CSR is operationalized into four categories,
which includes economic, legal, ethical, and philanthropic. Among all economic part of CSR
plays a vital role in organization's performance and helps the stakeholder to analyze important
economic factor, make strategic planning, manage operations of banks, earn profits and
maximize shareholder wealth (Young & Thyil, 2009; Decker & Sale, 2009; Manne & Wallich
1972; Crowther & Aras, 2008). CSR is strictly voluntary action which provides the basis of
legitimacy to operate in the society and fulfill the expectation of various stockholders. It leads to
reduce the information risk and check whether the organization is on right track and fulfill its
obligations. Consequently, it is argued that all these favorable results can have an effect on the
financial performance of a corporation, such as return on sale and return on investment (Peloza
& Shang 2011; McWilliams, Siegel & Teoh, 1999).
Economic responsibility is full filled by focusing on financial innovation. In competitive
environment, financial institutions needs to modify existing structures, generate new
opportunities through effective risk management, developing and introducing new products, that
helps to generate income, earn profit and wealth maximization (Lentner, Szegedi & Tatay, 2015;
Decker & Sale, 2009; Garriga & Mele, 2004; Carroll, 1991). Legal responsibilities are
considered the second cornerstone of CSR which described the country's legal system and it is
more important for financial institutions.
The regulators define rules which purpose is to reduce the risk, ensure security, and enhanced
customer confidence in the financial system. The supervisory agencies and trade associations
prepared rules for implementation and compliance. The basic purpose of these rules is to ensure
social responsibility in corporate activities to safeguard customer‟s stake, reduce frauds and
Page 23
6
ensure the safety of customer's assets (Lentner, Szegedi & Tatay, 2015; Decker & Sale, 2009;
Carroll, 1991). But it was found that the legal system of developed countries is more appropriate
in comparison of developing counties (Sood & Arora, 2006; Chapple & Moon, 2005; Arora &
Puranink, 2004).
Ethical responsibility comprised fair, impartial and smart working environment. Ethical norms
are interpreted with individual integrity and fulfillment of stakeholder‟s expectations. It
represents the fundamental ethical principles of moralities, which is in line with confidence and
is linked to the financial sector (Decker & Sale, 2009; Carroll, 2004). Business ethics based on
principles of integrity, fair conduct, respect, and transparency in the financial sector, are in
accordance with the host country's environment. So, there is need to consider, ethical values and
expectations which communicating in the context of stakeholder perspective (Lentner, Szegedi &
Tatay, 2015; Decker & Sale, 2009; Carroll, 1994).
Philanthropic responsibility is an important element of CSR. In philanthropy, the organizations
voluntarily try to improve the social life of the people through building parks, clean water
projects, making shelter homes, and helping poor persons etc. (Crane & Matten, 2007). Today's
philanthropy helps the banking sector in enhancing good reputation and global corporate
citizenship (Lentner, Szegedi & Tatay, 2015; Decker & Sale, 2009; Carroll, 1994; Carroll, 1991).
In recent years, modern researchers examined that the level of social expectations from the
banking industry was changed. CSR activities are considered integral for the survival of the
banking industry so that they can meet the expectations of stakeholder other than wealth
maximization. This context of corporate social responsibility and financial performance is
supported by multiple theories which include stakeholder theory, social identity theory,
Page 24
7
legitimacy theory, and consumer inference making theory (Pirsch, Gupta & Grau, 2007; Porter &
Kramer, 2002).
Classical theories of finance support the concept of shareholder's theory, which proposed that
main organizational objectives are to maximize the shareholder wealth (Friedman, 1970).
Besides this main objective, societal and other stakeholder's interests should not be compromised
(Crane et al., 2008). Stakeholder theory explained that an organization should consider
stakeholder perspective while making a corporate decision (Barnett & Salomon, 2012). These
stakeholders influence the organizational performance directly and indirectly, so dissatisfaction
of any stakeholder can adversely affect the business performance (Delmas & Toffel, 2008;
Henriques & Sadorsky, 1999; Clarkson, 1995).
Stakeholder theory supports to stakeholders or individuals who influence or influenced by the
corporate strategies or practices. Management is considered to respond the stakeholder concerns
because the main function of managers is to meet the stakeholder's expectations effectively.
Emshoff and Freeman (1978) proposed that organizational objectives should be aligned with
stakeholder‟s expectations. Considering stakeholders expectations while making corporate
decision reflect conventional reputation in the mind of stakeholders. This stakeholder context
explained the notion that consideration of stakeholders interests can lead toward influencing the
organizational performance.
1.2 Contextual Analysis:
Financial sector comprises banks, leasing companies, insurance, investment companies, asset
management companies, Mudarbah, and mutual funds etc. But among all these institutions, the
banking sector of Pakistan comprises 95% of the total financial market and therefore it is
Page 25
8
considered an integral part of the economy (SBP, 2016). It plays an important role in the
prosperity of the economy, while a weak banking sector leads toward financial crisis and it is
dangerous for sustainability of the economy (Herwartz & Walle, 2014; Hsueh, Hu & Tu, 2013).
Therefore, its performance significantly impacts the economy of Pakistan indirectly and
investors stakes directly. But it was found that banking sector of Pakistan is not as performing as
performed by the banking sector of developed countries due to the requirement of the strict
legitimate system (Yamak & Suer, 2005).
In the context of developing counties especially, Pakistan is ranked as the sixth most populated
country in the world and forty-third largest countries in terms of its GDP. In recent years the
banking industry of Pakistan has flourished at a significant level. According to the State Bank of
Pakistan (SBP), the banking industry of Pakistan comprises more than thirty-four scheduled
banks, including four foreign banks and consists of around 12,993 branches with thousands of
ATM‟s (SBP, 2017).
The rapid growth of the banking industry of Pakistan plays a significant role in driving the
growth of the economy (SBP, 2017). The increasing number of national and international banks
reflects tough competition in the banking industry. It is more customers centric with the intention
to earn more profit and maximize shareholder wealth. Banks use modern marketing techniques to
generate customer intention, instead of only improving their performance. In the era of
technological advances and the competitive market, the banking sector has expanded its borders,
such as Islamic, mobile banking and Internet banking, etc. The findings and analysis of historical
investigations, there are different methods of marketing for survival, improvements and
enhanced performance in a tough competition of services industry (Poolthong & Mandhachitara,
Page 26
9
2009). There are different sort of and challenges which the banking industry is facing in
developing economies specifically in Pakistan.
There is a need to improve the corporate governance structure of the banking sector because all
the business strategies are established be corporate managers. Weak governance system leads
toward the numerous frauds, embezzlement cases, excessive leveraging, and risky investments
etc. Banking sector associated with the interest of depositors and investors. They want to make
sure, either their money is invested in less risky, secured, and beneficial projects. Shareholders,
lenders, borrowers, managers, employees, and regulators are other stakeholders of banks. As
compared to other industries, there is comparatively number of stakeholders associated with the
banking industry. It leads toward more complicated information asymmetry. So, there is a need
to improve and establish strict compliance and regulation systems (Yamak & Suer, 2005).
Corporate social responsibility context gaining dominance in modern era in Pakistan (Khan,
2015; Qazi, Ahmed, Kashif, & Qureshi, 2015). Somehow, at corporate level, CSR is mixed with
philanthropic or charitable context. It is found that up to some extent, corporate managers are not
aware off with their social responsibilities (Khan, 2015; Waheed, 2005). Evidence founded that
corporate managers are not so interested to understand the true context of CSR while on the other
hand, there is lack of systematically and formal procedure to train and guide top management
regarding their social responsibilities (Ehsan & Kaleem, 2012). Studies highlighted that extra
working hours, less safety measures, lower level of awareness regarding regulations and non-
compliance of regulations (Kamal et al., 2012; Pasha & liesivuori, 2003).
In the banking sector, besides the short-term internal business interests of financial companies,
social, environmental and human rights objectives are gaining a dominant and interesting role. In
Page 27
10
this perspective, engagement in socially responsible activities can serve as a strategic tool for a
firm‟s to avail competitive edge (McWillians & Siegel, 2000; Porter & Kramer, 2007). Corporate
social responsibility practices in the context of financial benefit remain more robust because
financial institutions play a social role by mobilizing the financial resources in the society. CSR
in the context of the banking sector not only result in competitive advantage but also result in
superior financial performance.
Page 28
11
1.3 Rationale of the Study:
On the basis of extensive literature review, there are certain gaps which have been deduced and
being filed by this study. First of all, historical studies have broadly conducted and literature
posit that studies relevant to CSR and its consequences conducted in the context of developed
economies (Gangi, Mustilli & Varrone, 2018; Lentner, Szegedi & Tatay, 2015; Chiu, 2014;
Decker & Sale, 2009). Therefore due to divergent governance intra-structure, their findings
cannot be generalized in the context of developing economies, particularly for Pakistan. There is
limited empirical evidence in the context of developing economies to determine the quest of CSR
(Ip, 2008). Moreover, CSR practices in developed countries remain divergent than developing
economies (Gao, 2011; Belal, 2001). However past studies in the context of developing
economies provide limited empirical evidence that how and to what extent CSR affects firm
performance (Nyeadi, Ibrahim & Sare, 2018; Choongo, 2017; Crifo et al., 2016; Lee & Jung,
2016; Gatsi et al., 2016).
Historical studies in developing economies have limited scope and based on self-reported
questionnaires. Most of the studies focused on secondary data analysis. Studies only explored the
relationship between CSR and firm performance with a limited number of samples. Non-
financial parameters are necessary that has ignored in current literature (Mishra & Suar, 2010).
Similarly, past studies have not effectively examined the potential significance of non-financial
parameters in context of banking sector. There are few evidences among the relation of CSR and
performance which have demonstrated positive (Malik & Nadeem, 2014), negative (Iqbal et al.,
2013; Aga et al., 2012) and no relation (Kiran et al., 2015), which motivated for current research.
CSR‟ idea is now developing in the Pakistani context, and in addition some analysts carried out
research work in non-financial sector by overlooking the financial sector, especially in the oil
Page 29
12
and gas sector (Kiran et al., 2015), KSE 100 index non-financial sector (Javed et al., 2013),
textile, cement, chemical, tobacco, and pharmaceutical industries (Iqbal et al., 2012; Kakakhel et
al., 2015; Jan & Baloch, 2011), but no evidence found in context of banking sector of Pakistan.
Stakeholder pressure is a recommended as a moderator which never tested earlier (Haleem et al.,
2015). Innovation and corporate reputation could establish the relationship between CSR and
performance. There is no evidence of sequential mediation of innovation and reputation between
CSR and performance. There is the significant role of CSR in determining performance and it
motivated to examine the relationship of CSR and performance in the banking industry of
Pakistan. Moreover, current study leads to validate the theoretical assumptions of stakeholder
theory. Therefore, considering all these potential GAPS, this study aim is to examine CSR-FP,
NFP, and stakeholder pressure as moderating factor, innovation and corporate reputation as
mediating factors in context of Pakistan.
Page 30
13
1.4 Problem Statement:
In developed market economies, financial institutions give more importance to corporate social
responsibility. As they think, their CSR is considered an important factor, like others that helps
them in enhancing profit that resulted in the maximization of shareholder's wealth. They
considered that financial literacy and awareness, financial education, responsible, prudent
lending, risk management, fair and transparent financial services, handling of complaints are
important elements which improve business operations and to get the intention of stakeholders
(Lentner, Szegedi & Tatay, 2015). In essence, a bank‟s stable financial position, increasing
economic performance, ethical and transparent activities, and responsible financial services
ensure its predictable and reliable operations. It is evident of fact that effective implementation
of CSR activities enabled the banking industry to reduce the chances of frauds, embezzlement
cases, excessive leveraging, and risky investments etc.
In banks, besides the short-term internal business interests of entities, social, environmental, and
human rights objectives are gaining a dominant and increasing role (Lentner, Szegedi & Tatay,
2015; Chiu, 2014; Audretsch & Lehmann, 2004). There is an increase in a number of
stakeholders, who think that business decision making must go beyond profit maximization and
it is required to involve in socially responsible activities to solve social issues. Such activities are
far away from their economic interest but included as moral responsibility (Chiu, 2014).
As in developed countries, the banking industry contributing significant role to resolve financial,
economic and social issues. There is significant importance of banking industries in developing
and emerging economies especially in Pakistan. But this industry is facing challenges like
numerous frauds, embezzlement cases, excessive leveraging, and risky investments etc. The
Page 31
14
expectations of the stakeholders include safe products and adequate information. Employees
need a safe and motivating work environment that must be separate from discrimination. In
addition, there is a need for care with the respect and dignity of employees. Furthermore, the
banking sector must be aware of indirect environmental impacts, such as lending activities to
environmentally friendly organizations (Lentner, Szegedi & Tatay, 2015; Hu & Scholtens, 2014;
Chiu, 2014; Branco & Rodrigues, 2008; Scholtens, 2009; Douglas, Doris, & Johnson, 2004.
In developed economies, it is evident that corporate social responsibility contributes to a
significant role in economic development. Moreover, CSR plays an integral role in determining
the financial benefits of financial institutions, because it has a direct link with customer
satisfaction. If clients of any banks are satisfied and feel secure about their investments, they will
lead toward publicity of that banks and repeated association and the long-term relationship will
be established. According to researchers, there are limited evidences on corporate social
responsibility in banking sector of developing counties (Choongo, 2017; Crifo et al., 2016; Lee
& Jung, 2016; Gatsi et al., 2016; Famiyeh et al., 2016; Kilic et al., 2015; Siregar & Bachtiar,
2010; Monteiro & Aibar Guzmán, 2010; Cormier & Gordon, 2001). This evident that corporate
social responsibility plays important role in determining bank performance and it convinced to
examine the relationship between CSR and performance in the banking industry of Pakistan.
Page 32
15
1.5 Research Questions:
1.6 Research Objectives:
Page 33
16
1.7 Significance of the study:
This study examined the influence of corporate social responsibility on the financial and non-
financial performance of the banking sector of Pakistan. Findings of this study are significantly
beneficial to academicians focusing on CSR research studies. It is a contribution to existing
knowledge with the addition to the literature. This study is beneficial to businessmen, managerial
personnel and investors who are concerned with the impact of CSR on firms' financial
performance. It will support to regulators in establishing socially responsible policies keeping in
mind the expectations of stakeholders (Kilic et al., 2015; Lentner, Szegedi & Tatay, 2015; Chiu,
2014; Decker & Sale, 2009).
Most importantly, this study will be beneficial to bankers in developing and introducing financial
products and services keeping in mind the customer‟s interests (Fernando, 2007; Rathnasiri,
2003). The finding and implication of this research will be beneficial to local organizations as
they deal with CSR as a vital segment of the business. Furthermore, it is beneficial to
international organizations as they are making an investment that might crop up as a result of
CPEC etc., to utilize the benefit of developing consumer markets. This study will contribute in
multiple ways to the existing literature and it is a study which is considering both aspects of
financial and non-financial performance in developing countries.
Page 34
17
CHAPTER 2
LITERATURE REVIEW
2.1 Introduction
The objective of this chapter is to review theoretical and practical aspects of CSR literature
covering the objective and philosophy of CSR, empirical studies related to financial verses non-
financial performance of the firms. In addition, historical and current studies on innovation,
corporate reputation, and stakeholder pressure were examined. The main objective of this chapter
is threefold. Firstly, it explained multiple concepts of CSR, financial and non-financial
performance, corporate reputation, innovation, and stakeholder pressure. Secondly, it examined
the relationship between CSR, financial and non-financial performance. Thirdly, it addressed the
CSR performance in the banking sector of Pakistan and the rest of the world. In this section,
literature reviewed and final research gap found which leads toward examining different direct
and indirect relationships.
2.2 Literature Search Strategy
Literature review was based on numerous sources (journals and books), publishers (science
direct, Wiley, Taylor and Francis, sage, emerald, Elsevier), indexing bodies (Thomson Reuter,
Scopus, Proquest, Ulrich), Google scholar and local and foreign dissertations. Recent research
publications were focused for literature review but the theoretical context was covered since the
emergence of theory and basic concepts.
2.3 Corporate Social Responsibility
Many years have passed to investigate CSR and multiple experts, analysts, and researchers are
defining CSR in their own way (McWilliams, Siegel, & Wright, 2006). The evolution in the
Page 35
18
definitions was noticed when thoughts of the multiple researchers are considered. Davis (1973)
described that CSR started with the end of legal obligations. This was a step more than good
citizenship that for society's welfare. CSR was considered to be socially responsible besides legal
responsibility. Gomez (2014) illuminated the social responsibility of the university that other
researchers ignored. Lauesen (2016) explored the question of whether CSR can be used as a
relationship of trust between companies and society, and which part of CSR plays a better role in
organizations.
CSR was the scarification of maximization of profits over being responsible for societal well-
being. It was considered as subjective concept and source of extensive research and arguments
from last few years (Jamali, 2008). European commission defined it as deliberate interaction
between social, environmental activities and interaction with their stakeholders. Friedman (1970)
supported the above arguments and proposed it as a source of agency problem between managers
and stakeholders. It was further examined that CSR is utilized for personal career development
by managers.
Shareholder wealth maximization was the main goal of any business, but social development
activities are gaining momentum in the business. In spite of the fact that, organizations were
observed to be involved in some type of social exercises during the nineteenth century after the
industrial revolution (Maden et al., 2012); however the topic of the impact of CSR on financial
and economic performance have empowered the scholastic and business interests. Socially
responsible organization‟s demand was increasing as they need to meet the multifarious needs of
shareholders as well as stakeholders (Aguinis & Glavas, 2012). CSR was a common part of
corporate entities and organizations are now assigning senior management for discussion on CSR
Page 36
19
issues which coordinate the curriculum of business administration goals relent to social activities
(Montiel & Delgado-Ceballos, 2014).
Organizations were presently incorporating the CSR with their plans of action and working
structures since they outlined a procedure for expanding benefit through self-intrigue (Servaes &
Tamayo, 2013). In the time of globalization, they additionally needed to contend
incomprehensibly (Surroca, Tribo & Zahra, 2013), restoration on the reputational crisis,
mechanical progression (Avram & Avalsilcai, 2014), expanding concerns of environmental
safety and ecological sustainability. There were various ideas of CSR, despite these energetic
social interests by business firms.
CSR has multiple concepts with respect to people, constructs, and researchers are not agreed on a
common definition (Saeidi et al., 2015). The absence of a union, definitional agreement, and
hypothetical development was not allowed to develop a common definition. A universal
understanding of the definition, development and wide acceptance of the concept was essentially
inevitable. CSR considered as a common ideology in existing literature which explained the
method of wealth creation for stockholders relatively stakeholders (Peloza & Shang, 2011).
According to the off-shoot concept, CSR defined as an arrangement of setting particular
corporate activities and approaches that coordinate the stakeholder's expectations and economic,
social, and environmental performance (Aguinis & Glavas, 2012). As per existing gap on CSR
definition and historical researches, it was acknowledged for research on CSR as deliberate
business firm activity coordinated toward enhancing the economic, social, ethical and legal
business activities which influence the organizational performance (Okoye, 2009).
Page 37
20
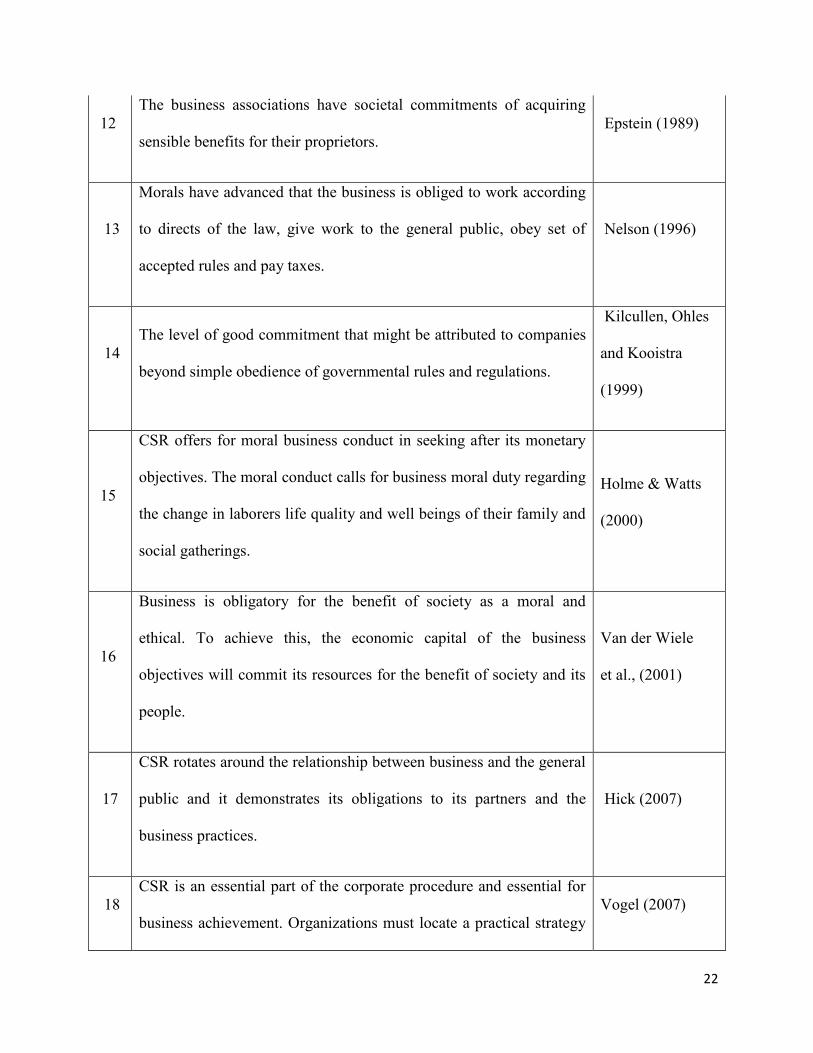
Table 2.1.1.1: Evolving definitions of CSR
Sr.
No
Definitions of CSR Reference
1
The monetary motivation behind the presence of any business
organization is an intensification of benefit. This objective is
accomplished through the acknowledgment of social measurement
that is consumer loyalty. Accordingly, social security and social
wellbeing of any modern culture are one of the necessary factors
organization's duties other than its financial matters targets.
Drucker (1942)
2
The goal of any organization ultimately is survival that is the result of
amicability between the framework and the general population
places. Any conflict between these three players' intuitive
destinations is located in the central business position. In this way,
human labor dignity, status, and workers' training and development
are considered the asset of the company's.
Drucker (1946)
3
The main question of the society, we want a big business but we do
not know what you expect out of it? This means how organizations
are going to ensure their organizational goal of maximization of
profits to serve the aspirations and demands of society as well? To
ensure an equal balance between profit maximization and high
employment as social contributions, government administration
should clearly mention the controlling policies over it.
Drucker (1946)
Page 38
21
4
Businesses are bound to follow policies and decisions which are
necessary for the social values of any society.
Bowen and
Howard (1953)
5
Business will not be limited to corporate interests‟ implementation of
firm policies only, but should also cater for social and legal aspects as
well.
Davis (1960)
6
CSR could not be limited only to economic and legal responsibilities
but societal obligations must be incorporated.
McGuire (1963)
7
CSR is a response to a firm‟s technical and economic issues beyond
legal requirements.
Davis (1973)
8
This "fit" between the business communities' expectations and
business ethics.
Zenisek (1979)
9
Social responsibility is set to operate within complex business
organizations society's economic, legal, ethical and philanthropic
expectations.
Carroll (1979)
10
The distributing a portion of corporate organization is to need
people's needs with master capacities, continue reacting to the
business focus, make quality items in any event possible cost by
compelling and practical use of benefits.
Vogel and
Bradshaw (1981)
11
Philanthropy, responsibility, and policy are three main corporate
levels of any large organization.
Vogel and
Bradshaw (1981)
Page 39
22
12
The business associations have societal commitments of acquiring
sensible benefits for their proprietors.
Epstein (1989)
13
Morals have advanced that the business is obliged to work according
to directs of the law, give work to the general public, obey set of
accepted rules and pay taxes.
Nelson (1996)
14
The level of good commitment that might be attributed to companies
beyond simple obedience of governmental rules and regulations.
Kilcullen, Ohles
and Kooistra
(1999)
15
CSR offers for moral business conduct in seeking after its monetary
objectives. The moral conduct calls for business moral duty regarding
the change in laborers life quality and well beings of their family and
social gatherings.
Holme & Watts
(2000)
16
Business is obligatory for the benefit of society as a moral and
ethical. To achieve this, the economic capital of the business
objectives will commit its resources for the benefit of society and its
people.
Van der Wiele
et al., (2001)
17
CSR rotates around the relationship between business and the general
public and it demonstrates its obligations to its partners and the
business practices.
Hick (2007)
18
CSR is an essential part of the corporate procedure and essential for
business achievement. Organizations must locate a practical strategy
Vogel (2007)
Page 40
23
between what is social, ethically and economically profitable.
19
Kotler holds the view that a firm, other than fulfilling prompt needs
and wants of an objective market, should likewise convey an
incentive to the client that keeps up or boosts buyers and social
prosperity for a long period of time.
Kotler and
Armstrong (2008)
20
CSR is a deliberate business firm activity coordinated toward
enhancing the economic, social, ethical and legal business activities
which influence the organizational performance.
Okoye (2009)
21
CSR identifies with non-benefit exercises of partnerships executed
for the welfare of groups beyond their monetary advantages.
Carroll and
Shabana (2010)
22
CSR is a common ideology which explains the method of wealth
creation for stockholders relatively stakeholders.
Peloza and Shang
(2011)
23
CSR could be defined as an arrangement of setting particular
corporate activities and approaches that coordinate the stakeholder‟s
expectations and economic, social and environmental performance.
Aguinis and
Glavas (2012)
24
CSR is normally related as a way to deal with coordinate social and
environmental aspects into corporate exercises.
Baumgartner
(2014)
Page 41
24
2.4 Dimensions of CSR
Numerous measurements of the CSR were considered as satisfactory for research considerations.
The early conceptualization of CSR was the generous point of view whereby business firms
make altruistic gifts or commitments to the general public (Caroll, 1991). The associations that
make such corporate commitments including banks do open up such demonstrations of liberality
in their distributed information to attract open regard for them in order to accumulate support and
authenticity.
Carroll (1991) proposed that all the dimensions are integrated and could not anyone be
considered as mutually exclusive. CSR framework incorporated the all concepts and definitions
of CSR, corporate citizenship and stakeholder theory during this time period (Carroll, 1979, 1999
& 2004). He divided these responsibilities into four subparts like economic, legal, ethical and
philanthropic. Having a structure and order to the social and moral responsibilities of business
partners around the world was a fundamental best practice. The Pyramid of worldwide CSR was
considered as an attractive method to deal with graphically depicted the four sorts of social
commitment that the organization has concerns about overall stakeholders. The pyramid
delineates the four sections of overall CSR, beginning with the basic building square of financial
performance. Meanwhile, business depended upon to agree to the law since the law is each
nation's codification of adequate and unsatisfactory activities and practices (Carroll, 2004).
Moral and ethical aspects were commercially dependent on business. At its core level, it is
dedicated to reducing stakeholder's loss by opting correct choices. Lastly, policies of acceptable
social and philanthropic activities should be adopted for corporate citizenship. Today, the
Page 42
25
organizations are relying on to collect money and to "give back" to support financial and human
labor resources, so that personal satisfaction can be improved and supported (Carroll, 1999).
Picture-I, Carroll’s (1991), CSR-Pyramid
Economic activities referred to the factors of production to meet consumer market' demand
(Garriga & Mele, 2004). The firm's financial commitments, regardless of whether or not the
world around it is considered as a foundation for business. The overall organizations were
dependent on each other and they offer them an advantage in making ventures. The key sound
organization offers rules on how and where it can be refined in a general environment. At this
level, the agreement is definitely necessary, but the activities related to the money of the
commercial companies are difficult to achieve. What may change according to the nation or
place in the world is the issue of what constitutes a satisfactory rate of return or rate of
development (Carroll, 1999). Associations working in critical situations may consider this issue
remarkably opposed to those working in developed countries. Subsequently, this part of the
structure depends on the neighborhood and regional goals found in financial markets, but they
are still fundamental for survival and advancement (Carroll, 2004).
Page 43
26
The legal responsibilities involve the activities executed in the legal system of the country and
more important for multinational companies. Those countries that have well supported financial
systems will definitely apply legitimate systems. The social contract between commercial
companies and host countries varies by country and, in this sense, legal systems and
responsibilities also vary. At this level, we observe critical differences in honest systems and
commitments with those of kindness on the part of the countries and local regions of the world.
For example, we understand that Chinese labor laws are not executed routinely and that outside
financial professionals are observing that China's legal structure resolves some disputes. We also
realized that the absence of a legitimate framework is repressing remote post-war interest in Iraq
(Dolven, 2003). One thing is clear, however: legitimate duty exists and is found similarly in
developed, emerging, developing and similar underdeveloped nations (King, 2003).
Ethical obligations comprise fair, just and accurately working (Gregory & Mayell, 2004). Ethical
responsibilities deal with those undertakings and practices that are general or repudiated by
society, regardless of whether these principles are not organized (Carroll, 2004). In fact, around
the world, business ethics based on the country's ethical instructions, host country; and the
commitment to the quality. The act of good relativism, in which organizations basically conform
to neighborhood standards, creates a circumstance that is regularly unsustainable in light of the
fact that many nations, especially those that are creating, do not have verbal ethical measures that
guarantee the helpless fire. Ethical universalism as a norm that would establish an ethical
standard recognized by all cultures (Carroll, 2004). The ethical universalism was the
recognizable test of ethical points of reference that would have broad global support, for
example, the United States Global Compact or the Global Reporting Initiative.
Page 44
27
In Philanthropic responsibilities, social work included work to ensure the better quality of social
life (Crane & Matten, 2007). These responsibilities reflected the wishes of society around the
world that companies should participate in social exercises that cannot be ordered by law. The
fact is that it is sometimes handled with a moral chain of social practices. Today's philanthropy
is, as a rule, key in nature, with anticipated businesses that would assume a dynamic part in
global corporate citizenship (Carroll, 1991). As a result of law and morality, philanthropic
desires usually change from one to another nation and will find the wishes of host nations.
Finland, for example, it is discovered that Finns do not respect philanthropy excessively in light
of the fact that in their framework, senior positions are considered by companies rather than to
deal with this type of desire to citizenship. Schwartz and Carroll (2003) merged later on, these
dimensions and provided three overlapping CSR categories because the philanthropic dimension
is not the official responsibility of any business (Lantos, 2001). Look picture I & II which
explains the (Schwartz and Carroll (2003) three domain approach.
Picture-II, Schwartz & Carroll, (2003), Three Domain Approach of CSR
The Global Pyramid of CSR and Performance will help organizational governing bodies to
consider the various stakeholders‟ wishes interconnected with their associations. It is important
Page 45
28
to understand that these duties necessarily to be implemented. Past studies supported that
administrators found the significance of their obligations as taking after this succession of needs:
financial, lawful, moral, and charitable (Aupperle, Carroll & Hatfield 1985).
2.5 Stakeholder Pressure
Many researchers included the customers, suppliers, employees, shareholders, the community,
and government in the category of stakeholders (Buysse & Verbeke 2003; Donaldson & Preston
1995; Freeman 1983; Henriques & Sadorsky 1999). Business strategies toward CSR were
improved from simply showing social responsibilities to internal and external organizational
environments which are associated with stakeholders. These are the forces which influence the
organizational performances in multiple ways. There is a direct impact of losing the interest of
these stakeholders on financial performance (Lee, 2008). Customers stop to purchase products,
shareholders prefer to sell its shares, and employees lose confidence in work and environmental
personnel go for sue (Wood, 1991). Organizational success and survival primarily based on
manager's abilities who want to create enough wealth and stakeholder's' satisfaction (Clarkson,
1995). He further depicted that if anyone from stakeholders ready to support the organization
then its performance will automatically improve.
Impact of stakeholder's based CSR on financial and non-performance could be understood with
help of different underpinning theories which validate the views, concepts and thoughts.
According to social identity theory, there is a direct impact of image and reputation of
organization on employee's self-image, loyalty, and sincerity. Organizational employees relevant
policies reflect the company's intention to fulfill their needs, the participation of employees in
Page 46
29
strategies and union relations, decision making, remuneration policy, better work environment,
employees eradication of child labor expose the practices of organizational CSR.
These proactive activities enhanced improvement in financial and non-financial performance. It
referred to as reputational component and responds as a glamorous power for potential workers
(Turban & Greening, 1997). Moral trustworthiness and positive responses from family and
companions adds to worker work fulfillment and lower job turnover (Riordan et al., 1997) on the
grounds that workers with higher confidence and inspiration will work all the more proficiently
and viable (Berman et al., 1999) and participate in improvement of organizational performance
(Koys, 2001). Valmohammadi, (2014) examined that employee-related CSR activities are
strongly correlated with organizational performance. Gbadamosi, (2016) conducted the study in
US-based banks for identifying CSR and financial performance. He proposed that governance,
diversity, and worker connection were emphatically identified with bookkeeping returns.
According to CIM theory, consumers prefer to purchase products of such like organization which
is socially responsible. So, it is a way of improving purchase intention and consumer goodwill
(Gildea, 1994). According to signaling theory, consumers prefer more products where there exist
information and communication asymmetry in between buyer and sellers. Consumers think that
warranty is an indication of higher product quality and reliability, so it is also an indication of
corporate citizenship (Boulding & Kirmani, 1993; Maignan & Ferrell, 2000).
Customers are also considered as part of stakeholder because CSR practices are impossible to
execute with them. Consumer loyalty can be characterized as a general assessment of the
consumer's aggregate purchasing and utilization which includes different products. Fornell et al.
(2006) expressed that consumer loyalty is perceived as a promoting technique and a key driver of
Page 47
30
organization long-run financial performance and market value (Gruca & Rego 2005).
Valmohammadi, (2014) examined that consumer-related CSR activities are significant and
positively participate in organizational performance.
Firms can improve their relationships with local and international investors by embracing
suitable corporate governance measures. After the financial crisis in all over the worlds, there is
given proper importance to secure the interest and rights of shareholders and investors. This
corporate governance embraces on the suitable financial and non-financial transparency with
legal and regulatory requirements, data frameworks, and the proper accessibility of information.
Investors prefer those organizations which actively participating in CSR related activities like
consulting shareholders' opinion in financial decisions, autonomous audits, and insider's trading
strategies. From above evidences, we can propose that appropriation of better corporate
governance's standards can improve organizational performance. Investors prefer those
corporations which are participating in better governance standards (Coombes & Watson, 2000).
Corporate governance positively contributed toward the financial performance of sector (Dahya
& McConnell, 2007; Black & Khanna, 2007).
Post liberalization decades giving much importance on health and safety, environmental
influences, social involvement, payment of living allowances both at home and within
organizations to outsourced suppliers. In the present ages, organizations are ensuring loyalty with
suppliers if they also make ensure in the eradication of child labor, moral acquisition in raw
material, following human right policies. There is inverse relation in CSR benchmarks and
financial performance of organizations if suppliers violate the CSR standards. In recent evidence,
the Indian carpet industry was banned by international purchasers due to child labor because
Page 48
31
international buyers prefer Rugmark certified firms (Mishra & Suar, 2010). So, we can say that
there is a relation in the CSR of suppliers and organization performance.
Organizations are involving in education, health and development programs for eradication of
poverty from the community. These corporations are performing CSR activities through public-
private partnerships, establishing welfare foundations and NGO's, in the empowerment of the
local community. Microsoft is offering quality educations in backward rural areas (Brugmann &
Prahalad, 2007). Hewlett Packard is offering sustainable livelihoods to women self-held groups
of India (Dunn & Yamashita, 2003). These community development programs are influencing
investors and stakeholders in way of investing, purchasing and motivations toward performance
developments. Valmohammadi, (2014) examined that community-related CSR activities are
participating in organizational performance. Gbadamosi, (2016) conducted a study in US-based
banks for identifying CSR and financial performance and he proposed that product and
community factors were negatively related to profits while study of (Yusoff and Adamu, 2016)
proposed a positive relationship with community-related CSR and performance.
From last few years, global environment protection departments are mounting pressure to follow
strict legislation and organizations are adopting proactive strategies for environmental and
societal development. Organizations are modifying the policies with respect to environmentally
friendly products and manufacturing procedures. Greenhouse and processing resources
developed following environment protection standards. Resource saving and recyclable
technology, efficient manufacturing systems, and management information systems are utilized
as key instruments for protection.
Page 49
32
Graafland, (2002) conducted a research study to analyze long-term reputations are affected by
short-term profit-making strategy. He depicted that today's globalization and growing dynamics
are forcing the organization to consider social and environmental factors stakeholders.
Valmohammadi, (2014) proposed that environment-related CSR activities are strongly related to
organizational performance. These environment protectants improve the organization
performance in way of profitability and growth (Russo & Fouts, 1997; Klassen & Mc Laughlin,
1996), reputation and financial performance (Gil et al., 2001). Yusoff and Adamu (2016)
proposed positive relationship among environment-related CSR and performance.
2.6 Corporate Reputation
Margolis and Walsh (2003) comment that many researches concentrated just on testing the
immediate relationship amongst CSR and firm performance, and concluded that only few
evidences found that are in support of direct relationship (Wood, 2010). Hence, keeping in mind
the main goal to acquire solid outcomes, powerful factors which are excluded and disregarded
should be considered and observationally analyzed. Three interconnected factors, consumer
loyalty, reputation, and feasible competitive edge, were incorporated into to acquire reliable
findings. Existing studies explained that consumer loyalty, reputation, and competitive edge are
connected with organizational performance. Studies on the relationship amongst reputation and
organizational performance demonstrated that financial advantages, as well as non-financial
benefits, are results of a decent reputation (Flatt & Kowalczyk, 2011).
Helm (2007) said that a corporation with decent credibility "is considered less dangerous than
corporations with low economic performance and less reputable corporation". From the financial
perspective, (Roberts & Dowling, 2002) has shown that the organizations with the best
Page 50
33
reputation offer good returns when investing in them. (Shamsie, 2003) proposed the direct and
positive effect of the best reputation on organizational performance. Finally, (Cabral, 2012)
ensures that organizational performance is based on its best reputation, and it is assumed that in
order to maintain overall reputation, organizations should focus on developing good
methodologies.
In the 21st century, development context is increasing as new corporate difficulties for
complexity, rapid competition, corporate direct promotion, and social responsibility. It has
threatened companies to worry about corporate reputation. It is expected that the performance of
a company depends on its reputation (Cabral, 2012). Corporate reputation is an impression of
what the general population is convinced that organizations are fulfilling their wishes with their
offers (Brammer & Pavelin, 2006). As indicated (Walsh et al., 2006), long-term consumer
loyalty tends toward reputation.
Gupta (2002) indicated that the company's CSR capacity is essential to the reputation of an
organization. These findings proposed an observation in the commercial studies that when
customers feel that product and services are being offered on similar rates, then preference
should be gone for those organizations that add practices related to the environment, for
example, CSR. For this situation, companies should know that the most ideal approach to show
an abnormal state of CSR and to build consumer loyalty is to do everything possible to
understand the wishes of interested parties and outline and update their CSR in the same way.
2.7 Innovation
Monetary maintainability captures the general parts of an association that must be considered
taking into account its long life survival. These facets incorporate technological advancement
Page 51
34
and innovation (Baumgartner & Ebner, 2010). The social point of view entails organizations to
show themselves to stakeholders such as clients, financial specialists and the administration and
to comply with the company's internal affairs by inspiring representatives in ways that
incentivize the organization (Eesley & Lenox, 2006; Freeman et al., 2010). In terms of natural
measurement, securing land and expanding ecological performance are at the heart of the
manageability problems that must be incorporated (Baumgartner, 2014).
The financial, social and ecological imperatives are not only diagnostic ideas, but they speak of
the factors that a company can use to adjust the action plan to the commercial technique. CSR is
usually related as a way to address the incorporation of social and natural points of view in
corporate exercises (Baumgartner, 2014). The educational community has shown that the
introduction of CSR is a way to strengthen stability, development and long-term management in
a vibrant and modern state (Prado-Lorenzo et al., 2008). Lo (2010) discussed terminologies such
as CSR and corporate maintainability. These are considered "excellent business exercises" and
CSR is assumed in corporate sustainability, which is a transition phase of the company's
experiences to implement corporate sustainability.
Heikkurinen and Bonnedahl, (2013) indicated that in economic development, organizations
should have the responsibility to assume the key duty of corporate sustainability. With respect to
a dialogue on sustainable development, another key area is the role of innovation to improve
corporate sustainability (Boons et al., 2013). One of the most important ways to contribute to
sustainable development in companies is the participation of innovation practices (Schaltegger,
2011). The integration of products, procedures, and vertical structures is considered an
integration of social perspectives based on sustainability. This indicates a direction for the need
Page 52
35
for the management of financial, social and biological ideology with the purpose of incorporating
new structures, procedures and stops in the plan (Klewitz & Hansen, 2014).
2.8 Corporate social responsibility and Performance
Jain et al., (2016) wants to scrutinize the relationship between CSR and financial performance of
SME's working in Rajasthan. They distributed 384 structured questionnaires among the workers
of multiple sectors like ceramics, carpet, wool, gem and jewelry, machine tools, textile, and other
manufacturing organizations. An exploratory study was conducted and structural equation
modeling was used as an econometric technique. The findings of study designated significant
and positive relationship among CSR and financial performance. They also proposed that SMEs
working in Rajasthan are interconnected with the socially responsible activities. Furthermore, it
was also noticed that such like organizations are not necessarily doing CSR as a necessary
fragment but that associate them with their religious spirit. So, CSR could not be considered an
important factor of economic improvement but it links them with their religious associations.
Yusoff and Adamu, (2016) conducted a research study in the domain of Malaysian stock
exchange. Their sample contained a group of 100 listed companies for a sample period of 5 years
from 2009 to 2013. They investigated the above-mentioned relationship using four aspects of
CSR like environment, community, workplace, and marketplace. This study also provided some
implications that adaptation of corporate socially responsible activities leads to improve the
economic development in Malaysian organizations.
Madorran and Garcia (2016) proposed their study on the background of enormous interests of
academic and business firms in CSR. They want to investigate the interconnection existing
between CSR and financial performance of multiple organizations listed in the IBEX-35 stock
Page 53
36
exchange of Spain. They analyzed the above-mentioned relationship using panel data analysis
for the time period of 8 years during 2003-2010. Findings proposed no apparent connection
exists between independent and dependent factors in organizations of the Spanish market. Nollet
et al. (2016) examined the relationships between CSR and financial performance with a non-
linear and disaggregated approach in the indexed organizations of the S & P 500 for a five-year
sample period between 2007 and 2011. Findings proposed that corporate social performance is
contributing negatively to return on capital during this tenure, while the non-linear model
described the U-shaped diagram in the aforementioned long-term relationship.
Nakamura, (2015) proved a bidirectional relationship between social responsibility and
performance in Japanese organizations through the use of a simultaneous system of linear
equations. The results have shown the mixture of results such as positive, negative and neutral
relationships. For managerial personnel, natural and work-related investments are not feasible to
improve monetary performance, while the total reduction could compromise the reputation of the
organization. Interestingly, social initiatives have proven to be essential. For policymakers,
distinctive methodologies could be utilized to build social investment. From time to time,
legislators can rely on firm activities instead of controlling or improving CSR exercises.
Ahamed et al., (2014) examined in their paper the relationship between CSR and corporate
financial performance for Malaysian firms for the time period of five years from 2007 to 2011.
In their study they incorporated the environment, community, marketplace and workplace CSR
dimensions which could show most probably all positive, negative or neutral relationship with
corporate financial performance. The findings of this research concluded on basis of regression
analysis and concluded that CSR practices positively affect the corporate financial performance.
In addition, this paper added to business literature in recognized interest in CSR will prompt to
Page 54
37
organizational economic performance. CSR significantly contributed toward non-financial
performance in Indian context (Mishra & Suar, 2010).
Gbadamosi (2016) inspected the relation between banking CSR and financial performance of
working in the United States of America. He proposed this review upon the premise on an
example of 71 banks, the freely accessible moral appraisals, budgetary information, and
securities exchange information were broke down utilizing numerous relapse models. The
discoveries of this examination repudiate with the individuals who bolster the positive and
negative relationship in the CSR and performance relation while results presumed that there is no
connection exists in the CSR and financial performance. The review likewise demonstrated that
administration, differing qualities, and worker interconnection were positively identified with
accounting returns while social and communal elements were contrarily interconnected with
profits. This exploration adds to positive social change by helping the bank supervisors,
executives, financial specialists, controllers, and government in enhancing the release of their
separate parts to the optimal allocation of assets to contending social exercises in a way that may
magnify performance and enhance the stakeholder welfare.
Miller (2016) inspected the connection between banking CSR and financial performance in the
United States of America. He proposed this review upon the premise on a specimen of 25 banks
for the example time of 2011 to 2013 and this study examined relationships between fortune
reputation score and financial measure like ROA, ROE, and EPS etc. Results demonstrated that
for the initial two years, there exists a noteworthy positive connection between CSR activities
and performance, however an insignificant relationship found for the time of 2012.
Page 55
38
Awan and Nazish (2016) examined in their paper that CSR influences the financial performance
of the banking industry positively. The prospects, challenges, and impediments have analyzed.
The relationship between bilateral trade, the integration of employees in the banking sector, and
role in Pakistan economic development is tested. Malik and Nadeem (2014) investigated that
CSR influences positively to the financial performance of banks as a service sector of Pakistan.
Regression analysis is incorporated for confirming the relationship between profitability and
CSR. The results have estimated that organizations involved in social activities avail its benefit
and it reflects a long life impact on organizational performance.
Kim et al., (2015) inspected the connection between CSR and organizational financial
performance utilizing a competitive action perspective. They contend that competitive action to
be considered as an imperative possibility that decides the impacts of CSR exercises on firm
monetary performance. The results of this study based on 113 public limited companies from the
time duration of 2000 to 2005. They found that more CSR related activities improve the
organizational performance with more competitive action level. Furthermore, it is assumed that
corporate social irresponsibility enhances the performance with least level of competitive action
level. The contributing factor of this study is an introduction of competitive action in literature
and strategic management.
Kakakhel et al., (2015) researched the influence of CSR on financial performance in the
Pakistani manufacturing industry. They conducted the study on cement organizations listed in
Karachi stock exchange with a sample time of 7 years from 2008 to 2014. Panel analysis was
used to identify outcomes and analysis proposed that CSR of selected organizations is positively
influencing the financial performance. This work additionally strengthens the perspective of
Page 56
39
every one of those specialists whose experimental proof discovered a positive and noteworthy
relationship between CSR and financial performance.
Rodriguez-Fernandez (2016) directed a hypothetical and observational review to explore the
bidirectional relationship between CSR and financial performance in Spanish recorded
organizations. A total hypothetical system - in view of office, stewardship, reliance assets, and
partner hypotheses - gives the premise to the reasonable model. An important commitment is to
use the social behavior record developed by an index based on four indicators. The result of the
performance review in the organizations listed on the Madrid Stock Exchange is that it shows
positive contacts in both aspects, especially beneficial in the social context. The consequences of
this investigation have down to earth applications in the meeting room; they are evidence that all
social strategies increase money related assets, and the other way around, that expanded
monetary exhibitions prompt to more noteworthy social advantages. Consequently, this paper
emphasizes all the people of the board to ensure financial assets in creating ways that will be a
social endeavor with a specific end to contribute globally to the change in society.
2.9 Corporate social responsibility, Stakeholder Pressure, and Performance
The survival of the company is basically based on management skills that have the main task of
producing wealth for their interconnected stakeholders (Clarkson, 1995). Employees, owners,
managers, customers, suppliers and the natural environment should be considered important
stakeholders. There will be an adverse effect on the performance of the organization if any of the
stakeholders refused to participate in their contribution to the organization's support (Clarkson,
1995). Therefore, organizations also try to interconnect and establish relationships with primary
Page 57
40
stakeholders, who could improve their competitive advantage and their performance will
improve (Barney & Hansen, 1994; Fomburn & Shanley, 1990).
Effective organizational management skills, of course, lead to lower costs and performance
inflicted by the stakeholders will be displayed in a positive context (McVea & Freeman, 2005). It
is important to accomplish business sustainability, the companies should have a controversy with
the key recipients who should influence the company, recognize their needs and plan strategies
and methods to implement. Similarly, we describe CSR to a specific group of stakeholders such
as the approaches, procedures, and practices of an organization to meet their needs.
Different examinations explored the analysis of the relationship of CSR and performance;
however, few kinds of researchers explored the moderated-mediated mechanism (Saeidi et al.,
2015; Chang, Oh & Messersmith, 2013; Lioui & Sharma, 2012). There is mixed kind of relations
explored like neutral (McWillians & Siegel, 2000), negative relations (Davidson & Worell,
1988), and positive effects (Prado-Lorenzo, et al., 2008). This study identified the deficiency of
involvement of moderating/mediating factors (Saeidi et al., 2015) and proposed stakeholders as
moderating factor in CSR and financial performance.
Lioui and Sharma (2012) evaluated the impact of environmental CSR on CFP. They showed that
the relationship between the ROA of the companies and the ECSR is significantly negative and it
is a very solid relationship. They also showed that other performance indicators and ECSR are
significantly and negatively correlated. However, explaining the interaction between the
environmental efforts of companies and research and development produces a different
perspective: while the direct effect of CSR on financial performance remains negative, the
interaction of social responsibility and research and development has a positive and significant
Page 58
41
impact on that. The strengths and concerns of social responsibility are harming the CFP, as they
are perceived as a potential cost. However, this social responsibility activity encourages the
research and development efforts of companies that indirectly generate additional value.
Chang, Oh and Messersmith (2013) proposed the relation between CSR and financial
performance while also incorporate high-performance work practices. We use arguments to
demonstrate a vertical association between a company's approach to HRM and the adaptation of
management of a company for social performance. More research is being done on the
moderating effect of HPWPs between social responsibility and financial performance. The
findings explained that there is a significant moderating effect among the aforementioned
relationships and recommended that human resource practices be very important to improve the
performance of the organization. This study also elaborated the alignment of human behaviors
with the values and orientations of the organization.
The market and its external factors moderated the relationship of social responsibility and
performance (Hoffman & Ventresca, 1999; Zhu & Sarkis, 2007). They proposed that coercive
pressures improve environmental practices while competitive pressure improves financial
performance. Ketikidis et al., (2013) examined that external forces do not matter in strengthening
or weakening the aforementioned relationship. This study is conducted on the companies of
southeast European region and found the insignificant relationship between environmental
practices and organizational performance. Marshall and McCarthy (2013) analyzed that
stakeholder's pressure has a significant role in the contribution of CSR, economic and
operational performance. Most of the studies focus on environmental aspects, while this study is
relevant when incorporating comparative social pressure to environmental pressure.
Page 59
42
Zhu and Sarkis (2007) conducted a study on Chinese industry and examined the increase in
external pressures from institutional factors, including market, government and competitive
sources. Few companies started working on the start of green practices to reduce this pressure.
Moderated hierarchical regression analysis is performed and the relationships between green
practice, environmental and economic performance are examined. This study is based on three
main moderating factors: institutional, regulatory and competitive market pressures. The finding
recommended that there is an increase in external pressure that affects green practices in the
Chinese context. In addition, market pressure, competitive and regulatory is also increasing,
which affected the economic and operational performance. Finally, it is examined that the
institutional pressure could not contribute to any type of performance.
2.10 Corporate social responsibility, Corporate Reputation, and Performance
Corporate social responsibility is no more anonymous in a business area but up till now, there is
no well-versed definition to elaborate this terminology which could contain all major aspects in
contextual meanings (Jamali, 2008). Moir (2001) termed CSR as perpetual ethical behavior of an
organization which takes an active part in economic progress also pays to heed towards worker's
wellbeing, amelioration of community as well as betterment of society. Jamali and Mirshak
(2007) also elaborate CSR as "a corporation's responsibility in the achievement of basic
requirements of a considerable domain of participants".
Carroll's (1979) definition, which is widely described in the literature, determines the economic
responsibility of profitable income, legal as the management of the administration and the social
obligations according to the appropriate international laws, ethical means which is emitting of
any misconducting kind, and social wishes to include social responsibilities. There is no
Page 60
43
obligation to include, non-standard articles, or responsible for providing financial awareness to
the investors, and responsible for implementing additional activities that society is willing to
admit. Many experts have repeatedly emphasized that CSR can be considered as part of
organizational culture and it should be understood that not only is the main purpose of profit-
making but also scarification for society (McWillians & Siegel, 2000). The researcher has
recommended that organizations must follow social responsibility strategy to initiate
responsibilities to those individuals that seek more horoscope than economic and legal
obligations.
Hung (2011) believes that the confession of a company to CSR is affected by four elements;
receptive objectives, flexibility, willingness and responsibility for the fight. Moir (2001) believes
that the company's encouragement to emphasize socially responsible activities may be due to
some social desires to maintain trust for the community, government and employees with legal
and moral patrimony and source of wealth creation for shareholders. According to Porter and
Kramer (2007), support for CSR is based on four principles: ethical responsibility, solidarity,
certification, and public relations. Although it is considered that the company gets out of the past
disposal tasks, that is, standard products/services, good follow-up history, curative therapeutic
works and positive words of intentional image development, CSR is an element that is
considered to accelerate the corporate reputation of an organization (Carroll 1979).
The historical studies showed that the corporate reputation and the organizational image is
something valuable that any company has used as a source of development and growth. Walker
(2010) provided a view on the reputation that "is relatively stable, the future scenario of the
company as, compared to some standards". Eberl and Schwaiger (2005) differentiate between the
reputation and the public perspective of the image. They demonstrated that the prestige of a
Page 61
44
company is more important than its transmitted image. It is evolutionary and firmly compatible
with the company and the interested parties. On the contrary, it is based on the sensitivity of the
recipients who have direct and consent experiences with the corporation.
Several ideological and experimental analyzes have shown that CSR has affected the corporate
image of the company as an important factor. For example, Turban and Greening (1997) show
that the self-determination of CSR is positively linked to the reputation of companies. Similarly,
Siltaoja (2006) demonstrated that organizations maintain remarkable behavior as part of the CSR
and when joining dangerous operations they do not have stability in their licenses, so they can
obtain temporary gains. Abdullah and Abdul Aziz (2013) explained that the inductive and
remedial management of CSR programs is important for the business because it molds the
corporate identity of the company and for a long time were able to obtain important commercial
resources.
Fombrun and Van Riel (2004) recommend that a level of corporate charity be related mainly to
corporate repute. De Quevedo-Puente, et al., (2007) proposed that there is no contradiction on
argument that the RSC has strongly emphasized in its reputation. McWilliams, Siegel, and
Wright (2006) suggest that CSR can be qualified as a long-term investment because it is part of
the construction and maintenance of corporate reputation. Famiyeh et al., (2016) has revealed
that solidarity (economic, social and environmental) has a great impact on the corporate image.
For this reason, CSR programs help build a positive reputation and a brand image and (Porter &
Kramer, 2007) proposed that many organizations apply the reputation to their advantage.
The recent study concludes that socially responsible organizations have directly benefited from
the implementation of CSR practices through the improvement of the company's implementation
Page 62
45
in which the image of the company has improved (Van Beurden & Gossling, 2008). Dyer and
Chu (2003) found that good support is due to low inspection and monitoring costs because
providers have a risky risk hazard when businesses change with reputable institutes. Kotha,
Rajgogal and Rindova (2001) explained the same thing as the investment of good corporate
reputation in which the transaction cost reduced what it caused in reducing the cost of the buyer-
supplier exchange. With the help of a high reputation, organizations can easily attract
investments and international collaborations (Fombrun & Van Riel, 2003). This concept can also
help to launch various products while selecting the same products in different competitive
forums.
Great reputation increases customer loyalty and gives a hint of quality when looking for buyers
with a choice among the contending products (Shapiro, 1983). It is observed that companies with
a decent reputation have more value and, therefore, can charge higher costs and obtain better
results than expected, which improves their financial performance. Orlitzky (2005) recommends
that reputation deserve more credit for the positive effect of corporate social measures on its
performance. More products, in any case, show a great positive relationship (Roberts & Dowling
2002; Fombrun & Van Riel, 2004). Multiple analyzes that showed positive results presumed that
a high reputation improves the image of an organization, strengthens its image and increases its
value estimation.
Roberts and Dowling (2002) have described appreciating the additional benefits in order to
accelerate financial performance as time passes. Orlitzky (2005) recommended that social
responsibility contributes to corporate reputation and, after all, is associated with the price of
shares in the stock market. Herremans, Akathaporn and McInnes (1993) found that the major
Page 63
46
companies of US manufacturers that have a good reputation could be considered more profitable
compared to organizations with less reputation.
Famiyeh, et al., (2016) deliberated in their findings that corporate social obligation, in
accordance with their public relations and earnings, increased overall performance in different
contexts and proxies. They indicated in their results that, because it practically confirms the
position of CSR as waste or not only in the organization, but its effect is twofold: this firm and
positive image and the acceleration of institutions in general. Structural equation modeling was
applied to identify the aforementioned relationships after collecting data from sub-Saharan
African areas. This study has also introduced new parts of a particular environment, which is not
an ideological approach despite participating in theory development.
Saeidi et al., (2015) proposed that the beneficial result of CSR in the performance of the
company is due to the constructive result that CSR has in hand, the notoriety and loyalty of the
consumer. The latest discoveries show that the only ideological and high interference in the
connection between CSR and performance. These results recommend a part of CSR, clearly, by
improving the performance of the company, through the improvement of reputation and
profitability, while improving the level of loyalty of the company. The growing modernity of
partners and conditions, the acute rivalry, the growing interest in business frankness and social
duty have progressively become the new corporate difficulties of the 21st century that have made
companies increasingly related about corporate notoriety. It is expected that the performance of a
company depends on its notoriety.
Corporate reputation is an impression of how much people, in general, are fulfilling that
organizations are fulfilling their desires with their articles and administrations (Brammer &
Page 64
47
Pavelin, 2006). According to them, notoriety is one of the results of high long-term consumer
loyalty. Gupta (2002) indicated that the CSR capacity of the association is essential for the
notoriety of an organization. This finding supports the prevailing view in business writing that
when looking at clients with equal cost and quality of items, they would want to choose items
from organizations that add green management practices, for example, CSR. For this situation,
companies should know that the most ideal approach to show an abnormal state of CSR and to
expand consumer loyalty is to do everything possible to understand the wishes of the partners
and define and update their CSR as necessary.
2.11 Corporate social responsibility, Innovation and Performance
The idea of development has sought to represent the way in which organizations can be prepared
to potentially create and develop potential changes, to promote sustainable development
(Gaynor, 2002). In this unique situation, once the improvement is updated, with the advantages
of its association, which have the ability to support its stability in the global economy. Gaynor
(2002) refers to the association of advanced social component that should receive and capture the
directors to transmit to the representatives a basic element of the association's vital relationship
and then urge the workers to seek better arrangements through improvement and data
performance and correspondence innovation frameworks, promotion of techniques or
procedures. These "best answers for change" can be identified with a creative domain that
incorporates representatives as key actors in the distinctive test and the performance of new open
doors that result in more efficient use of assets (Gaynor, 2002).
In this document, the creators receive the approach proposed by Gaynor (2002) and,
consequently, adopt an approach that considers development as the ability to establish the ground
Page 65
48
to move forward and seek better arrangements (Martins & Terblanche, 2003). As Abraham and
Knight (2001) point out, the development includes making the creation of learning and inventive
activity a way of life that confirms, for example, trying to create and expand showcases instead
of simply responding to the client's request. In this line, at its heart, a process of fruitful
development can be seen as the use of better arrangements that meet new needs, unexpressed
needs or needs of the existing commercial sector (Martins & Terblanche, 2003).
It should be noted, in any case, that the creation of measures for the advancement can be a
dubious matter. Previous research has created measures of progress identified with their
performance and components (Leenders & Wierenga, 2002). For example, some previous
examinations have created measures that identify the degree to which an association has an
inventive culture by using measures that are expressly identified with the presence of specific
practices (Brettel & Cleven, 2011), while others recommended that the measurement of
development performance allow authorized representatives to focus on actual progress rather
than simply pretending service to possibly creative practices (Michalisin, 2001). This review
focuses on performance indicators that speak of the long-distance returns of an inventive culture,
improved elements, and administrations, changes in procedures or promotion of techniques
formed by an imaginative culture.
Social advances are developments that are useful for society and improve the ability of the
organization to act in achieving its financial improvement objectives (Rexhepi et al., 2013). In
this way, characterizes the CSR since the initiatives of the organizations go beyond those that
arise due to the instructions to adjust the needs of the partners with the need to obtain a benefit
(Doane & Abasta-Vilaplana, 2005). Hopkins (2016) states that CSR includes cooperation with
external and internal partners of the company in a morally or socially competent manner. This
Page 66
49
understanding verifies the thoughts of (Du, Bhattacharya & Sen (2011) that, by participating in
CSR exercises, organizations cannot simply create positive partner dispositions and best aid
practices (for example, buy, search for business or put resources in the organization).), but also,
as time passes, builds a corporate image, strengthens the connections of the partner organization
and improves the support practices of the partners. In addition, (Rasoulzadeh et al., 2013)
consider that CSR is a method to increase operational productivity and reduce expenses, and
(Dahlsrud, 2008) recommends that, from a financial perspective, CSR be considered to be
identified with the assets of the generation of goods and adventures is dispersed within the social
framework.
Although some consider CSR to be a source of advantage for improving corporate image and
visibility (Knox & Maklan, 2004), it can also be a source of controversy if it is not legitimately
controlled (Doane & Abasta-Vilaplana, 2005). As argued by (Blakely & Aparicio, 1990), it is
likely that financial and social objectives are having progressive difficulties as hierarchical assets
recede and administrative support for social projects decreases. In this way, I understand that
observational investigations of the connection between CSR and performance related to money
have uncertain, revealing positive aspects (Johnson & Greening, 1999), negatives (Davidson &
Worrel, 1988) and even non-partisan results (McWillians & Siegel, 2000). Even so, the lack of
agreement may reflect problems of demonstrative determination, for example, the exclusion of
factors identified with the development.
Martinez-Conesa, Soto-Acosta and Palacios-Manzano (2017) explore the connection between
corporate social obligation and business esteem, however, a critical research gap remains when
considering the connection between CSR and progress. The document evaluates its association
with the hierarchical development and the performance of the company in a solitary integrating
Page 67
50
model by using the auxiliary condition that it shows in an information collection of 552 Spanish
companies. Our results support an impact of fractional intervention in the performance of
progress in the connection between CSR and the performance of the company, from the impact
of CSR on the performance contracts of the company on the expansion of the performance of
development towards the model. The findings can see how CSR is an imperative driving tool for
organizations to be more imaginative, productive and powerful.
Cegarra-Navarro et al., (2016) led in this exam focuses on the culture of advancement of an
organization in the connection of monetary and social duties with performance related to money.
In particular, our research tends to the two investigations that accompany it: Does the advance
trigger the concurrent improvement of the monetary and social measurements of the corporate
social duty? Does the simultaneous search for monetary and social obligations result in a higher
budget performance? These consultations are inspected through an observation examination of
133 organizations, which have a place with the Social Environmental Agreement of Spain, which
uses the auxiliary condition that shows approved by the research factor. The results show that,
despite the fact that organizations are using development results to help the monetary and social
achievements, they are simply successfully exploiting financial achievements to obtain greater
performance related to money.
Wagner (2010) analyzed the connection between progress with high social advantages and
corporate social performance and the part that family businesses play in this. This issue is
especially important given a large number of companies that are claimed by the family. In
addition, the demonstrable ability of the development to accommodate the views of the corporate
management capacity with the gain legitimizes an extended investigation of this connection.
Governments regularly reinforce the socially advantageous advance with different instruments of
Page 68
51
an agreement, with the aim of expanding global aggression and at the same time supporting
sustainable improvement. At the same time, companies look for corporate social duties (CSR)
and ecological management exercises mainly with the expectation that this will encourage such
an advance in their association (close to their fundamental point to improve CSP).
Page 69
52
2.12 Theoretical Background
The main motivation of the study is to investigate how an organization can improve its financial
performance by adopting CSR practices. Multiple theories proposed that CSR leads toward
improving organizational performance (Porter & Kramar, 2002). Corporations are legal entities
with economic responsibilities and also subject to fulfill their moral obligations toward society at
large. CSR is being conceptualized as economic, legal, ethical and philanthropic aspects of an
organization.
The prophecy of the stakeholder theory holds the view that corporate ethics should be preserved
in the decision-making process. Corporate decisions affect stakeholders with a different level of
intensity and organizations should consider their moral obligations toward stakeholders. Past
studies outline various theories which support the phenomena of CSR. Literature base on CSR
proclaims various theories mainly stakeholder theory, social identity theory, consumer inference
making, and signaling theory. Classical economics support the concept of shareholder's theory
(Friedman, 1970), which proposed that organizational objectives are only associated with wealth
maximization of owners. However, organizational objectives should not be effectively
accomplished by compromising societal and other stakeholder's interests (Crane et al., 2008).
Stakeholder theory holds the notion that an organization incorporates the insight of stakeholder
while making a corporate decision (Barnett & Salomon, 2012). These stakeholders influence the
organizational performance directly and indirectly, so dissatisfaction of any stakeholder can
adversely affect the business continuity of an organization (Delmas & Toffel, 2008; Henriques &
Sadorsky, 1999; Clarkson, 1995).
Page 70
53
Stakeholder theory supports to stakeholders or individuals who influence or influenced by the
corporate strategies or practices. Management is considered to respond the stakeholder concerns
because the main function of managers is to meet the stakeholder's expectations effectively.
Emshoff and Freeman (1978) proposed that organizational objectives should be aligned with
stakeholder‟s expectations. Considering stakeholders expectations while making corporate
decision reflect conventional reputation in the mind of stakeholders.
Integrative social contract theory indicates that there exists an implicit contract between business
and society (Donaldson & Dunfee, 1995). It imposes few responsibilities on working business
for the development of society. It also elaborates the socio-cultural context and normative aspect
of management because this will tend to influence the organizational performance. Shareholder
theory indicated that it is the first priority of organization to maximize shareholders wealth which
leads to developing a strong interaction between investors and organization tend to improve its
performance (Greenwood, 2001). Legitimacy theory proposed that the organization's activities
must be accordingly the expectations of societal and environmental norms, values, and beliefs.
This social activism leads to develop a positive perception between the actions of organizations
that tends toward better financial performance (Suchman, 1995).
Besides banking customer demand it's also asserted by stakeholder theory that corporate
decisions affect stakeholders with a different level of intensity and organization should consider
their moral obligations toward stakeholders. Past studies outline various theories which support
the phenomenon of CSR however stakeholder theory dominantly emphasis that CSR remains
vital for positively affecting customer perception and reaping positive outcome. By using the
lens of stakeholder theory it is intriguing to examine the effect of CSR, corporate reputation and
innovation in determining the bank's financial performance in the context of Pakistan.
Page 71
54
2.13 Conceptual Framework
Figure-1: Conceptual Framework
Financial Performance
Innovation
Corporate
Reputation
Stakeholder Pressure
Non-Financial Performance
CSR
Page 72
55
2.14 Hypothesis
Page 73
56
CHAPTER 3
The Data and Research Methodology
3.1 Introduction
The main objective of this chapter includes research design, population and sampling technique,
scale measurements, research procedures, and data analysis techniques. The main concern of this
study is to examine the implications of corporate social responsibility on the financial and non-
financial performance of Pakistani banks. Moreover, moderating role of stakeholder pressure and
mediating role of innovation and corporate reputation between the relationship of CSR and
performance. The research design included the onion metaphor (Saunders et al., 2011) which
explained philosophies, approaches for research, times schedules, choices, procedure &
techniques of this study. This study adopted the positivism philosophy (Crotty, 1998) with a
quantitative methodology to examine the research model through the data collected from
respondents (Robson & McCartan, 2016).
Quantitative method is appropriate for analyzing the cause and effect relationship between
dependent and independent variables (Creswell, 2002; Sekaran, 2006). The current study is
based on cross-sectional data, so survey methods adopted and questionnaires distributed for data
collection. The survey method is considered comparatively better and more adequate to
understand the attitude of the respondents. There are three ways of conducting a study, such as
mono-method, mixed method and multi-method, which are applied research analyzes, but this
study followed a mono-method and the survey data were collected in a single moment.
Page 74
57
3.2 Target Population
Data collection strategy explains the type of required data, respondents, time, place and method.
This study is based on primary data and collected from the banking sector of Pakistan. Banks
contribute a significant role in the economy and these have a direct association with stakes of
investors and other stakeholders (Herwartz & Walle, 2014; Hsueh, Hu & Tu, 2013). With
approximately 12,993 branches, thirty-four scheduled banks are working in Pakistan. There is a
total of eight major banks having 9054 branches in different regions. These banks are targeted
because contributing major role in the banking sector of Pakistan.
3.3 Sampling Design
Data collection was planned through a survey method which includes questionnaires distribution.
Stratified sampling technique is used because sample selection is made based on the strata of
having more than five hundred branches in commercial banks (Sekaran, 2006). These banks are
including Habib Bank Limited, National Bank Of Pakistan, United Bank Limited, Muslim
Commercial Bank Limited, Allied Bank Limited, Bank Alfalah Limited, Bank Al Habib Limited,
and Askari Bank Limited. These banks have total 9054 branches working in all over Pakistan.
Federal, central, and south regions are focused for data collection because the majority of
branches are in working in these regions.
In this study, the unit of analysis is individuals and the respondents include branch managers
(Hidiroglou, 1994). The selected banks have 9054 branches all over Pakistan, and especially
there are 5032 branches working in federal, central and south regions. There are different
methods and formula for sample selection but in this study two methods are used. Firstly,
Page 75
58
Yamane (1967) developed a formula for calculation of sample size. The researcher
recommended that for the targeted population, a sample size of 370 is enough. Secondly, as per
the described table of the researcher, if the population is approximately between 5000-6000, a
sample of 370 will be enough (Annex 3.3.1).
3.4 Data Collection
In this study, keeping in mind the research ethics, few measures applied. Firstly, after getting
complete information regarding a number of branches, addresses, and locations working in
targeted regions; it is started with formally contacting the respective department and operational
management through telephone, emails etc. This was conditional by management not to disclose
the name of the branch and respondents. After having positive consent from their management,
the concerned authorities of targeted banks reviewed the questionnaire. It was planned to
distribute a total of 700 questionnaires keeping in mind the lower response rates, busy schedules,
working hours, and commitments of respondents. Data collection is experienced as a tough job
and after numerous contacts, reminders, and visits, researcher succeeded to receive back 460
questionnaires. (Annex 3.3.2)
3.5 Measurement Scale
The instruments used in this study have adopted from research studies. Corporate social
responsibility scale adopted from (Turker, 2009) and validated by (Moisescu, 2015). Corporate
Page 76
59
reputation scale adopted from (Weiss, Anderson, & MacInnis, 1999) and validated by (Saeidi et
al., 2015). Innovation scale adopted from (Manu, 1992) and validated by (Martinez-Conesa, et
al., 2017; Bocquet et al., 2013; Lee & Choi, 2003). Stakeholder pressure scale adopted from
(Delmas & Toffel, 2008) and validated by (Yu & Ramanathan, 2015). Financial Performance
scale adopted from (Govindarajan, 1984) and validated by (Mishra & Suar, 2010). Non-financial
Performance scale adopted from (Govindarajan, 1984) and validated by (Mishra & Suar, 2010;
Hoque, 2004). The detailed questionnaire is attached in Annexure. Historical research studies
explained different survey methods related to data collection, while this study followed the five-
point Likert scale method. It provides comparatively better results; as it is respondent-friendly. It
indicates that how much respondents consent to a particular articulation can be found out
utilizing Likert questions. The scale starts from 1) strongly disagree to 2) disagree, 3) neutral, 4)
agree, and 5) strongly agree.
3.6 Data Analysis Techniques
This analysis includes cross-sectional data and it was collected from multiple respondents'
belonging to different managerial posts of federal, central and south regions of commercial
banks. SPSS, AMOS and MedThree Macro of (Preacher & Hayes, 2004) were used for analysis.
Following econometric techniques were used for checking normality, correlation and hypothesis
testing of CSR and financial, non-financial performance.
Normality Tests
Descriptive statistics
Correlation
Structural equation modeling
Page 77
60
3.6.1 Normality Tests
Normality tests are applied to check the normal distribution of random variables. Different types
of tests are conducted to verify that data is normal and there is no issue of errors. It is important
to make ensure that the instrument which has used in this study is accurate and truly measuring
the variable. There could be possible variation is the developed scale like including omitted or an
irrelevant case of items. The reliability analysis explains the consistency of the measurement
elements over time and their respective latent variables. It elaborates that the variable is free of
levels of bias. In addition, it can be explained as the stability, consistency and goodness of an
instrument that measures the observed factor with its different elements. This study focused on
data and checked that either data is useful for the research model through reliability, histogram,
P.P. Plot, and Q.Q. Plot etc. Linearity is seen using a graph known as scatter plot in which the
values of two variables are plotted along two axes, the pattern of the resulting points revealing
any correlation present. Furthermore, as there were a total of 460 responses received and few of
questionnaires contained missing values, those were dropped from studies.
3.6.2 Descriptive Statistics
Descriptive statistics indicate the mean and standard deviation. Moreover, it is used for purpose
indicating normality of data using Skewness, and kurtosis. Mean shows that the trend of data is
going toward strongly agree or strongly disagree as per average of results. Skewness is a measure
of symmetry, or all the more unequivocally, the absence of symmetry. An appropriation, or
information set, is symmetric in the event that it appears to be identical to one side and right of
the inside point. Skewness explains the spread of data. Kurtosis is a measure of whether the data
are heavy-tailed or light-tailed relative to a normal distribution. That is, data sets with high
Page 78
61
kurtosis tend to have heavy tails, or outliers. Data sets with low kurtosis tend to have light tails,
or lack of outliers.
3.6.3 Correlation
In this study, the Pearson correlation method has used for the portrayal of the relationship
between Independent, and dependent factors. It gives the level of relationship between factors.
Correlation framework is helpful in light of the fact that it can show the analytical relationship
among factors. This system bargains about the quality and course of the relationship between the
factors. However, correlation is old method since it just considers the quality and heading of a
relationship and does not clarify the lead lack relationship. It just recognizes that factors have no
relationship, negative or positive correlation. Because of these issues, this method is not
considered as a viable strategy. So, other different regression analyses and structural equation
modeling are applied for relationship testing.
3.6.4 Structural Equation Modeling
Structural equation modeling (SEM) is considered an important technique which is used to
analyze the relationships between CSR and financial performance (Rowley & Berman, 2000).
SEM refers to a diverse set of statistical methods that fit observed items of constructs to data. It
includes exploratory factor analysis, confirmatory factor analysis, path analysis, and partial least
squares path analysis. It ascertains the consistency of covariance matrices with their
hypothesized research model. It is considered as extensive form of research technique of
historical multivariate techniques and regression analysis. So, later on it is defined as the
combination of multiple regression technique and factor analysis which also incorporates the
model goodness and fitness (Hair et al., 1998). Structural equation modeling is emerging and is
Page 79
62
being used currently in developing economies at a broader level as compare to other regression
analysis.
In the modern era of technological advancement, new and latest techniques and statistical
packages have developed for the provision of researchers. SEM is considered one of those
advanced techniques that can be applied to the analysis of corporate social responsibility
(Johnson & Greening, 1999). This technique is friendly to researchers because it can provide
simultaneous tests of different independent, dependent and other factors. In this way, the scholars
can analyze multiple relationships only in an individual output with the inclusion of several
measures of goodness of the model. There could be many ways to analyze CSR and
performance, but SEM is considered one of the best ways.
SEM has examined by using AMOS software in social and management sciences. It is used to
testify that which variable and its scale could be best fitted at measurement model and structural
model and applied to analyze the impact of CSR on financial and non-financial performance with
moderating impact of stakeholder pressure and mediating influence of corporate reputation and
innovation. In this study, there are two types of components including a measurement model and
structural model which are applied at two different stages.
The measurement model is the first stage which explains the fitness of each item of scale which
could be included in the model and confirmatory factor analysis is used to analyze the observed
variables and their goodness, fitness, and reliability. The structural model is applied at the second
stage which provides the overall goodness, fitness, and reliability of collected data and the
hypothesized structural model. These are compared by using the fit indices and threshold values.
In this study, AMOS as an advanced statistical package and SEM as an econometric technique
Page 80
63
applied to examine confirmatory factor analysis. This CFA explained the factor loading of the set
of observed factors on its latent factor (Hoyle, 1995). In addition, this technique is also used to
test hypotheses related to different variables. This study followed the SEM technique already
tested CSR and performance relationship (Jain et al., 2016; Valmohammadi, 2014).
This method of research analysis is considered as technique of second-generation which provides
comparatively better causal results between different variables. It is different from old and
traditional regression analysis of first generation (Urbach & Ahlemann, 2010). Researchers and
statistician believes that SEM can provide better and more authentic findings than just simple
regression which will lead to reduction in measurement error and bias (Urbach & Ahlemann,
2010).
3.7 Pilot Testing
In this study, firstly questionnaires are finalized and then given to experts like Ph.D. scholars,
Doctors and Professors in university for proofreading. Secondly, expert's option also taken
working in the corporate sector. Then the first draft of the questionnaire got ready to make
distribution among the sample respondents belonging to commercial banks. The total of 30
questionnaires was distributed for pilot testing. These were analyzed for reliability testing to
make sure that there are possible issues of reliability in the data. Obtained data had shown better
results initially, and indicated that the values of Cronbach alpha are in between defined limits of
0.7 to 0.9 (O'Leary-Kelly & Vokurka, 1998) while it can be considered reliable if greater than
0.6 (Sekaran, 2006), so the further questionnaires were also distributed for data collection.
Page 81
64
3.8 Ethical Consideration
The ethical aspects of data collection are important and researchers, experts, and practitioners
have major attraction in describing how and why data is collected. There are different ethical
considerations that are required during the data collection, such as the potential harm of the
respondent, the lack of secrecy and informed consent, and the leakage of information (Bryman &
Bell, 2015). There are possibilities of reducing the quality of the data due to the absence of the
considerations mentioned above (Saunders et al., 2011). It is necessary to comply with the legal
requirements, if applicable, in the collection and use of data (Bryman & Bell, 2015). Finally, the
approval must be considered for the use of the scale from the scale developers in case of
adopting or adapting.
Page 82
65
CHAPTER 4
EMPIRICAL STUDY
4.1 Introduction
This section contained measurement models, descriptive statistics, model fitness, inter-item
correlation, normality, demographics, correlations matrix, direction relationships, simple and
sequential mediation, and moderation. Study investigated the implications of corporate social
responsibility on financial and non-financial performance in Pakistani banks. Survey-based
strategy was adopted to examine this relation and structured questionnaires were distributed
among respondents using different sources.
4.2 Assessment of Measurement Models
In the structural equation modeling, it is first necessary to consider a confirmatory factor analysis
for the observed variables fitness toward latent factor. In this study, the measurement model of
each variable is applied to analyze its goodness, fitness, reliability and validity.
4.2.1 Measurement Models of Corporate Social Responsibility
Measurement model explains the fitness of each item using descriptive statistics, model fitness,
and inter-item correlation.
4.2.1.1 Descriptive Statistics
Descriptive statistics indicated the normality of data including mean and standard deviations.
Moreover, Skewness and kurtosis are also indicated in the description of data. Cronbach Alpha
indicated the reliability of data which is showing the alpha values in the last column of the
below-mentioned table.
Page 83
66
Table 4.2.1.1 Descriptive Statistics of CSR
Mean Std. Dev Skew Kurt Cronbach Alpha
CSR1 3.74 1.03 -0.543 -0.172 0.849
CSR2 3.58 1.06 -0.385 -0.605 0.854
CSR3 3.58 1.01 -0.648 0.216 0.850
CSR4 3.70 1.04 -0.621 -0.117 0.855
CSR5 3.82 1.13 -0.914 0.139 0.846
CSR6 3.69 0.94 -0.393 -0.097 0.848
CSR7 3.51 1.11 -0.624 -0.248 0.845
CSR8 3.57 1.12 -0.592 -0.336 0.854
CSR9 3.72 1.15 -0.794 -0.109 0.846
CSR10 3.80 0.95 -0.741 0.494 0.848
CSR11 3.52 0.93 -0.399 -0.163 0.847
CSR12 3.54 0.98 -0.686 0.286 0.854
CSR13 3.55 1.09 -0.667 -0.092 0.858
The descriptive statistics table indicated 460 as the total number of respondents who have
participated in this primary research. This study used five Likert scales for research and all items
showed minimum values with 1 and maximum values with 5. Mean values indicated the average
of total responses; they have shown for thirteen items. The highest values are 3.82 and the
minimum mean value is 3.42. The highest values are positive indication and lead to strongly
agree with the measurement item and vice versa. All items of CSR have showed mean value
above 3, which showed that most respondents are leading to agree and strongly agree.
The standard deviation is an amount that expresses how much the members of a group differ
from the mean of the group. This study indicated that standard deviations of majority values are
closer to 1, which means that out of a total of five, 20% of people are deviating from mean
values. Few values are less than one that showed that divergent responses are lower in those
items. Skewness is a measure of the asymmetry of the probability distribution of a random
variable of about its mean. The asymmetry value can be positive or negative, or even undefined.
Page 84
67
The threshold level could be close to zero and in this study, the values of asymmetry of CSR are
closer to zero, but almost all values are negative. Negative values indicated that at the initial
stage, the data trend is negative and CSR data is negatively skewed.
Kurtosis is a measure of whether the data are heavy or light tail in relation to a normal
distribution. It also indicates the sharpness of the peak of the frequency distribution curve. The
threshold value level of kurtosis is 3 and in this study, all values are between "-3 < 0 > +3". It is
an indication of the normality of the data. Cronbach's alpha is known as a reliability test and
historical studies indicated that its value should be between 0.70 and 0.90, but the data will also
be considered as reliable if its value is greater than 0.60. In the case of CSR, the Cronbach's
Alpha value is between the thresholds. It is another indication of the reliability of the data.
4.2.1.2 Assessment of Overall Fitness
CFA-I is conducted to examine the best fit of the measurement model. It is noticed that all the
measurement items of CSR are showing statistical significance of regression weights. Multiple
squared correlation coefficients (R2) indicate the strong internal consistency and uni-
dimensionality of the scale. This first order CFA indicated that all the thirteen items are not
meeting criteria of best fit of measurement model of CSR in total collected data. Values of Chi-
square (χ²) and normed chi-square (χ²/df) are showing greater which indicates at first order CFA
level. Chi-square and normed chi-square are 319.9 which is small preferred and 4.923 which
should less than 5 respectively (Schumacker & Lomax, 2004).
Page 85
68
Table 4.2.1.2: Fit levels of Original CSR Measurement Model
Index Threshold Level Original Model
Statistic Fitness Level
χ² Small preferable 319.9 Poor
χ²/df ≤ 5.0 5.270 Poor
RMR ≤ .08 0.067 Good
CFI ≥ .90 0.823 Poor
GFI ≥ .90 0.906 Good
NFI ≥ .90 0.790 Poor
RMSEA ≤ .10 0.092 Good
There are other few values which are used for goodness and fitness of the model suggested by
multiple experts. These are also showing deviated values from their threshold levels which are an
indication of unfitness of measurement model of CSR. RMR explains the square root of means
of covariance residuals which is actually obtained from the differences of corresponding
elements of observed and predicted covariance matrix. Its value will be considered as best fitted
if closer to zero while possibly up to 0.05 (Steiger, 2000) and 0.08 (Browne & Cudeck, 1989). In
this study value of RMR is 0.067 which just closer to a threshold level.
Comparative fit index (CFI) is obtained from the comparison of the null model to the proposed
model in which factors are proposed to be uncorrelated. Model fit which is obtained by the
difference of observed and predicted covariance matrix known as chi-square index (Shevlin &
Miles, 1998). The goodness of Fit statistic (GFI) is considered as a substitute of chi-square test
which computes the proportion of variance based estimated population covariance (Tabchnick &
Fidell, 2006). Threshold levels of CFI and GFI are considered as 0.90 in case of the higher
sample while in case of lower sample values could be possibly up to 0.95 is considered more
appropriate (Shevlin & Miles, 1998). In this measurement scale, the CFI value is less than the
threshold level which clearly indicates that the model is not properly fitting with the analysis.
Page 86
69
Normed fit index (NFI) is measured using the difference of chi-square and target model and its
value could be possible in between 0 and 1. It is obtained by dividing the difference of values of
chi-square of the null and targeted model by the chi-square value of the null model. Moreover,
NFI indicates the 90% fitness and improvement of the interesting model with respect to the null
model. Value of NFI could deviate as the sample size reduces (Ullman, 2003). Value of NFI is
0.790 which is lower than the threshold level which indicated that this measurement model is not
good and fit.
RMSEA is another measure of model fitness which indicates the fitness of a measurement model
with respect to chosen parameter estimates and it should fit with the population covariance
matrix (Byrne, 1994). This value could possibly deviate from 0.8 to 0.10 which fit show the
model fitness at a lower level but best fit of model its value should be lower than 0.8
(MacCallum et al, 1996). The measurement model of CSR is showing RMSEA value 0.092 and
first order CFA of CSR indicated that RMSEA is crossing the highest cut-off level which is
dangerous and there exists a clear issue in the measurement model which should be overcome.
Page 87
70
Figure I: First-Order CFA of the Original Model of Corporate social responsibility
Generally, it is presumed that there exists an issue in the data which is making issues in
measurement model goodness and fitness. Few of estimations of Chi-square, CFI, and NFI are
veering off from their cut-off or threshold level which demonstrated that the CSR model is not
good and fit. The poor measurement model fitness required to revise the correlations between
items, path estimates and modification indices. Subsequently, after meditation and arduous hit-
and-trial, it was chosen to hold just eight estimation items to obtain best-fitted measurement
model of CSR.
Page 88
71
Figure II: First-Order CFA of the Updated Model of Corporate Social Responsibility
There were total thirteen items were started and finally, only eight items are be processed for
best fit of the model. The standardized estimates (λ) of the final measurement model of CSR are
statistically significant and contributing to determine the other factors. It is noticed that all the
eight items are loading on specified construct and showing significance in factor loading and
squared correlation. The important thing is that standardized estimates are within the threshold
level of one and all variances are a significant positive. Table of assessment of measurement
model fitness is indicating that all standards of goodness and fitness have approximately
achieved.
Page 89
72
Table 4.2.1.3: Comparative Fitness levels of CSR Measurement Model
Index Threshold Level Original Model Updated Model
Statistic Fitness Level Statistic Fitness Level
χ² Small preferable 319.9 Poor 101.02 Good
χ²/df ≤ 5.0 4.923 Good 5.000 Good
RMR ≤ .08 0.067 Good 0.049 Good
CFI ≥ .90 0.823 Poor 0.860 Supported
GFI ≥ .90 0.906 Good 0.945 Good
NFI ≥ .90 0.790 Poor 0.833 Supported
RMSEA ≤ .10 0.092 Good 0.100 Good
The value of chi-square is 101.02 which are much lower than the original model and normed chi-
square showing 5.0 which is at the cut off value. RMR which explains the square root of means
of covariance residuals which is actually obtained from the differences of corresponding
elements of observed and predicted covariance matrix. Its value is as well lower than the
threshold level which supports the goodness and fitness of the measurement model. CFI, GFI,
and NFI also supporting the model fitness as these values are also meeting the threshold level
standards. RMSEA is another measure of model fitness which indicates the fitness of a
measurement model with respect to chosen parameter estimates and it should fit with the
population covariance matrix (Byrne, 1994). RMSEA value is also equal to a threshold level
which supports to model goodness and fitness. Generally, it is presumed that there exists no issue
in the data which would possibly lead to measurement model goodness and fitness.
Page 90
73
4.2.1.3 Assessment of Inter-Item Correlation and Reliability
In the above-mentioned description of model fitness indicated that all the eight factors of CSR
are statistically significant. Factor loading on the unobserved variables of CSR are in between
threshold ranges with the least value of estimates is 0.40. Items are correlated with each other at
a 99% confidence interval. In all the cases correlation level deviated and least correlation is
noticed between CSR2 and CSR5 which is significant and correlated with
and CSR6 and CSR7 are statistically and significantly correlated with each other at 99%
confidence interval with .
Table 4.2.1.3: Inter-Item Correlation of CSR Measurement Model
CSR1 CSR2 CSR3 CSR4 CSR5 CSR6 CSR7 CSR8 Cronbach Alpha
CSR1 1.000
CSR2 .269**
1.000
CSR3 .309**
.187**
1.000
CSR4 .167**
.142**
.425**
1.000
0.747
CSR5 .295**
.161**
.180**
.228**
1.000
CSR6 .329**
.282**
.481**
.229**
.290**
1.000
CSR7 .235**
.217**
.349**
.176**
.080 .467**
1.000
CSR8 .322**
.235**
.293**
.269**
.267**
.272**
.365**
1.000
**Correlation is significant at the 0.01 level
The corrected item-total correlation of all eight items was in the brackets in range, which is
greater than the threshold value for acceptability. The Cronbach alpha for these eight items of
CSR is exceeding the threshold level of 0.70 which is an indication of the reliability of data used
in this measurement model study. Generally, it could be concluded that CSR is a reliable scale
used for final analysis.
Page 91
74
4.2.2 Measurement Models of Corporate Reputation
Measurement model explains the fitness of each item using descriptive statistics, model fitness,
and inter-item correlation.
4.2.2.1 Descriptive Statistics
Descriptive statistics indicating the normality of data including mean, standard deviations.
Moreover, Skewness and kurtosis are also indicated in the description of data. Cronbach Alpha
indicated the reliability of data which is showing the alpha values in the last column of the
below-mentioned table.
Table 4.2.2.1 Descriptive Statistics of Corporate Reputation
Mean Std. Dev Skew Kurt Cronbach Alpha
CR1 3.67 1.25 -0.884 -0.155 0.733
CR2 3.56 1.09 -0.443 -0.402 0.686
CR3 3.55 0.95 -0.39 -0.105 0.724
CR4 3.62 1.00 -0.736 0.360 0.726
CR5 3.53 1.14 -0.634 -0.307 0.774
The descriptive statistics table indicated 460 as the total number of respondents who have
participated in this primary research. This study used five Likert scales for research and all items
showed minimum values with 1 and maximum values with 5. Mean values indicated the average
of total responses; they have shown for five items. The highest values are 3.67 and the minimum
mean value is 3.53. The highest values are a positive indication and lead to strongly agree with
the measurement item and vice versa. All items of corporate reputation have shown a mean value
above 3, which showed that most respondents are leading to agree and strongly agree.
The standard deviation is an amount that expresses how much the members of a group differ
from the mean of the group. This study indicated that standard deviations of majority values are
closer to 1, which means that out of a total of five, 20% of people are deviating from mean
Page 92
75
values. Few values are less than one that showed that divergent responses are lower in those
items. Skewness is a measure of the asymmetry of the probability distribution of a random
variable of about its mean. The asymmetry value can be positive or negative, or even undefined.
The threshold level could be close to zero and in this study, the values of the asymmetry of
corporate reputation are closer to zero, but almost all values are negative. Negative values
indicated that at the initial stage, the data trend is negative and corporate reputation data is
negatively skewed.
Kurtosis is a measure of whether the data are heavy or light tail in relation to a normal
distribution. It also indicates the sharpness of the peak of the frequency distribution curve. The
threshold value level of kurtosis is 3 and in this study, all values are between "-3 < 0 > +3". It is
an indication of the normality of the data. Cronbach's alpha is known as a reliability test and
historical studies indicated that its value should be between 0.70 and 0.90, but the data will also
be considered as reliable if its value is greater than 0.60. In the case of corporate reputation, the
Cronbach's Alpha value is between the thresholds and its value for all the items 0.69-0.77. It is
another indication of the reliability of the data.
4.2.2.2 Assessment of Overall Fitness
First order confirmatory factor analysis is conducted to examine the best fit of the measurement
model. It is noticed that all the measurement items of corporate reputation are showing statistical
significance of regression weights. Multiple squared correlation coefficients (R2) indicate the
strong internal consistency and uni-dimensionality of the scale. This first order CFA indicated
that all the 5 items are not properly fit measurement model of corporate reputation in total
collected data. Values of Chi-square and normed chi-square are showing greater which indicates
Page 93
76
at first order CFA level. Chi-square and normed chi-square are 48.50 which is small preferred
and 9.70 which should less than 5 respectively (Schumacker & Lomax, 2004).
Table 4.2.2.2: Fit levels of Original CR Measurement Model
Index Threshold Level Original Model
Statistic Fitness Level
χ² Small preferable 48.502 Poor
χ²/df ≤ 5.0 9.700 Poor
RMR ≤ .08 0.063 Good
CFI ≥ .90 0.960 Good
GFI ≥ .90 0.930 Good
NFI ≥ .90 0.923 Good
RMSEA ≤ .10 0.138 Poor
There are other few values which are used for goodness and fitness of the model suggested by
multiple experts. These are also showing deviated from their threshold levels which are an
indication of unfitness of measurement model of corporate reputation. RMR explains the square
root of means of covariance residuals which is actually obtained from the differences of
corresponding elements of observed and predicted covariance matrix. Its value will be
considered as best fitted if closer to zero while possibly up to 0.05 (Steiger, 2000) and 0.08
(Browne & Cudeck, 1989). In this study value of RMR is 0.063 which is closer to a threshold
level. Comparative fit index (CFI) and Goodness of Fit statistic (GFI) are just closer to a
threshold level and 0.90 in case of the higher sample while in case of lower sample values could
be possibly up to 0.95 is considered more appropriate (Shevlin & Miles, 1998). In this
measurement scale, the values are close to a threshold level which indicated that the model could
possible fitted with the analysis.
Normed fit index (NFI) is measured using the difference of chi-square and the target model, the
value of NFI could deviate as the sample size reduces (Ullman, 2003). Value of NFI is 0.923
which is more than the threshold level which indicated that this measurement model is good and
Page 94
77
fit. RMSEA is another measure of model fitness and its value should be lower than 0.8
(MacCallum et al, 1996). The measurement model of corporate reputation is showing RMSEA
value 0.138 and first order CFA of corporate reputation indicated that RMSEA is crossing the
highest cut-off level which is dangerous and there exists a clear issue in the measurement model
which should be overcome.
Figure I: First-Order CFA of the Original Model of Corporate Reputation
Generally, it is presumed that there exists an issue in the data which is making issues in
measurement model goodness and fitness. The estimations of Chi-square, normed chi-square and
RMSEA are veering off from their cut-off or threshold level which demonstrated that corporate
reputation model is not properly good and fit. The poor measurement model fitness required to
revise the correlations between items, path estimates and modification indices. Subsequently,
after meditation and arduous hit-and-trial, it was all estimation items to obtain best-fitted
measurement model of corporate reputation, CR5 and few questionnaires were dropped and only
405 questionnaires remain which will be utilized for final analysis.
Page 95
78
Figure II: First-Order CFA of the Updated Model of Corporate Reputation
The standardized estimates of final measurement model of corporate reputation are statistically
significant and contributing to determine the other factors. It is noticed that all the four items are
loading on specified construct and showing significance in factor loading and squared
correlation. The important thing is that standardized estimates are within the threshold level of
one and all variances are a significant positive. Table of assessment of measurement model
fitness is indicating that all standards of goodness and fitness have approximately achieved.
Table 4.2.2.3: Comparative Fitness levels of CR Measurement Model
Index Threshold Level Original Model Updated Model
Statistic Fitness Level Statistic Fitness Level
χ² Small preferable 48.502 Poor 2.681 Good
χ²/df ≤ 5.0 9.700 Poor 2.681 Good
RMR ≤ .08 0.063 Good 0.016 Good
CFI ≥ .90 0.960 Good 0.994 Good
GFI ≥ .90 0.930 Good 0.997 Good
NFI ≥ .90 0.923 Good 0.990 Good
RMSEA ≤ .10 0.138 Poor 0.065 Good
Page 96
79
The value of chi-square is 2.681 which are much lower than the original model and normed chi-
square showing 2.681 which is lower than the cut off value. RMR which explains the square
root of means of covariance residuals which is actually obtained from the differences of
corresponding elements of observed and predicted covariance matrix. Its value is as well lower
than the threshold level which supports the goodness and fitness of the measurement model. CFI,
GFI, and NFI also supporting the model fitness as these values are also meeting the threshold
level standards. RMSEA is another measure of model fitness which indicates the fitness of a
measurement model with respect to chosen parameter estimates and it should fit with the
population covariance matrix (Byrne, 1994). RMSEA value is also lower than the threshold level
which supports to model goodness and fitness. Generally, it is presumed that now there is no
issue in the data which would possibly lead to measurement model goodness and fitness.
4.2.2.3 Assessment of Inter-Item Correlation and Reliability
In the above-mentioned description of model fitness indicated that all the four factors of
corporate reputation are statistically significant. Factor loading on the unobserved variables of
corporate reputation is in between threshold ranges with the least value of estimates is 0.40.
Table 4.2.2.4: Inter-item Correlation of CR Measurement Model
CR1 CR2 CR3 CR4 Cronbach Alpha
CR1 1.000
CR2 0.513**
1.000
0.774
CR3 0.261**
0.435**
1.000
CR4 0.133**
0.345**
0.319**
1.000
**Correlation is significant at the 0.01 level
Page 97
80
Items are correlated with each other at a 99% confidence interval. In all the cases correlation
level deviated and least correlation is noticed between CR1 and CR4 which is significant and
correlated with and CR1 and CR2 are statistically and significantly
correlated with each other at 99% confidence interval with . The
corrected item-total correlation of all items was in the brackets in range of 0.401–0.669, which is
greater than the threshold value of .30 for acceptability. The Cronbach alpha for three items of
corporate reputations is exceeding the threshold level of 0.70 which is an indication of the
reliability of data used in this measurement model study. Generally, it could be concluded that
corporate reputation is a reliable scale used for final analysis.
Page 98
81
4.2.3 Measurement Models of Innovation
Measurement model explains the fitness of each item using descriptive statistics, model fitness,
and inter-item correlation.
4.2.3.1 Descriptive Statistics
Descriptive statistics indicated the normality of data including mean and standard deviations.
Moreover, Skewness and kurtosis are also indicated in the description of data. Cronbach Alpha
indicated the reliability of data which is showing the alpha values in the last column of the
below-mentioned table.
Table 4.2.3.1 Descriptive Statistics of Innovation
Mean Std. Dev Skew Kurt Cronbach Alpha
IP1 3.56 1.23 -0.723 -0.388 0.646
IP2 3.42 1.03 -0.339 -0.285 0.629
IP3 3.51 1.09 -0.548 -0.226 0.615
IP4 3.59 1.04 -0.661 0.039 0.606
IP5 3.65 1.07 -0.705 0.047 0.642
The descriptive statistics table indicated 460 as the total number of respondents who have
participated in this primary research. This study used five Likert scales for research and all items
showed minimum values with 1 and maximum values with 5. Mean values indicated the average
of total responses; they have shown for five items. The highest values are 3.65 and the minimum
mean value is 3.42. The highest values are a positive indication and lead to strongly agree with
the measurement item and vice versa. All items of innovation have shown a mean value above 3,
which showed that most respondents are leading to agree and strongly agree.
The standard deviation is an amount that expresses how much the members of a group differ
from the mean of the group. This study indicated that standard deviations of majority values are
closer to 1, which means that out of a total of five, 20% of people are deviating from mean
Page 99
82
values. Skewness is a measure of the asymmetry of the probability distribution of a random
variable of about its mean. The asymmetry value can be positive or negative, or even undefined.
The threshold level could be close to zero and in this study, the values of asymmetry of
Innovation are closer to zero, but almost all values are negative. Negative values indicated that at
the initial stage, the data trend is negative and innovation data is negatively skewed.
Kurtosis is a measure of whether the data are heavy or light tail in relation to a normal
distribution. It also indicates the sharpness of the peak of the frequency distribution curve. The
threshold value level of kurtosis is 3 and in this study, all values are between "-3 < 0 > +3". It is
an indication of the normality of the data. Cronbach's alpha is known as a reliability test and
historical studies indicated that its value should be between 0.70 and 0.90, but the data will also
be considered as reliable if its value is greater than 0.60. In the case of innovation, the
Cronbach's Alpha value is between the thresholds and its value for all the items 0.61-0.65. It is
another indication of the reliability of the data but still it an indication of weak reliability.
4.2.3.2 Assessment of Overall Fitness
First order confirmatory factor analysis is conducted to examine the best fit of the measurement
model. It is noticed that all the measurement items of innovation are showing statistical
significance of regression weights. Multiple squared correlation coefficients (R2) indicate the
strong internal consistency and uni-dimensionality of the scale. This first order CFA indicated
that all the 5 items are not properly fit measurement model of innovation in total collected data.
Values of Chi-square and normed chi-square are showing greater which indicates at first order
CFA level. Chi-square and normed chi-square are 65.910 which is small preferred and 13.18
which should less than 5 respectively (Schumacker & Lomax, 2004).
Page 100
83
Table 4.2.3.2: Fit levels of Original IP Measurement Model
Index Threshold Level Original Model
Statistic Fitness Level
χ² Small preferable 65.910 Poor
χ²/df ≤ 5.0 13.18 Poor
RMR ≤ .08 0.084 Moderate
CFI ≥ .90 0.828 Poor
GFI ≥ .90 0.941 Good
NFI ≥ .90 0.819 Poor
RMSEA ≤ .10 0.163 Poor
There are other few values which are used for goodness and fitness of the model suggested by
multiple experts. These are also showing deviated from their threshold levels which are an
indication of unfitness of measurement model of innovation. RMR's value will be considered as
best fitted if closer to zero while possibly up to 0.05 (Steiger, 2000) and 0.08 (Browne &
Cudeck, 1989). In this study value of RMR is 0.084 which is moderately high from a threshold
level. Comparative fit index (CFI) and Goodness of Fit statistic (GFI) are just closer to a
threshold level and 0.90 in case of the higher sample while in case of lower sample values could
be possibly up to 0.95 is considered more appropriate (Shevlin & Miles, 1998).
In this measurement scale, the GFI value is good enough to threshold level but CFI and NFI are
lower which indicated that the model could possible unfit with the analysis. RMSEA is another
measure of model fitness and its value should be lower than 0.8 (MacCallum et al, 1996). The
measurement model of Innovation is showing RMSEA value 0.163 and first order CFA of
innovation indicated that RMSEA is crossing the highest cut-off level which is dangerous and
there exists a clear issue in the measurement model which should be overcome.
Page 101
84
Figure I: First-Order CFA of the Original Model of Innovation
Overall it is presumed that there exists an issue in the data which is making issues in
measurement model goodness and fitness. The estimations of Chi-square, normed chi-square,
CFI, NFI, and RMSEA are veering off from their cut-off or threshold level which demonstrated
that Innovation model is not properly good and fit. The poor measurement model fitness required
to revise the correlations between items, path estimates and modification indices. Subsequently,
after meditation and arduous hit-and-trial, it was all estimation items to obtain best-fitted
measurement model of Innovation, IP1 and few questionnaires were dropped and only 405
questionnaires have remained which will be utilized for final analysis.
Page 102
85
Figure II: First-Order CFA of the Updated Model of Innovation
The standardized estimates of final measurement model of Innovation are statistically significant
and contributing to determine the other factors. It is noticed that all the four items are loading on
specified construct and showing significance in factor loading and squared correlation. The
important thing is that standardized estimates are within the threshold level of one and all
variances are a significant positive. Table of assessment of measurement model fitness is
indicating that all standards of goodness and fitness have approximately achieved but still there
exist an issue in the value of RMSEA which exceeding than the threshold level.
Table 4.2.3.3: Comparative Fitness levels of IP Measurement Model
Index Threshold Level Original Model Updated Model
Statistic Fitness Level Statistic Fitness Level
χ² Small preferable 65.910 Poor 16.001 Good
χ²/df ≤ 5.0 13.18 Poor 4.001 Poor
RMR ≤ .08 0.084 Moderate 0.049 Good
CFI ≥ .90 0.828 Poor 0.927 Good
GFI ≥ .90 0.941 Good 0.980 Good
NFI ≥ .90 0.819 Poor 0.920 Good
RMSEA ≤ .10 0.163 Poor 0.072 Poor
The value of chi-square is 16.001 which are much lower than the original model and normed chi-
square showing 4.001 which is greater than the cut off value. It is an indication of possible
variations in the model or data in a final model of this study. RMR's value is as well lower than
the threshold level which supports the goodness and fitness of the measurement model. CFI,
GFI, and NFI also supporting the model fitness as these values are also meeting the threshold
level standards. RMSEA value is also less than threshold level which is supporting to model
goodness and fitness. Generally, it is presumed that now there are few issues in the data which
would possibly lead to measurement model poor fitness.
Page 103
86
4.2.3.3 Assessment of Inter-Item Correlation and Reliability
In the above-mentioned description of model fitness indicated that all the four factors of
innovation are statistically significant. Factor loading on the unobserved variables of innovation
are in between threshold ranges with the least value of estimates is 0.40. Items are correlated
with each other at a 99% confidence interval. In all the cases correlation level deviated and least
correlation is noticed between IP2 and IP5 which is significant and correlated with
and IP4 and IP5 are statistically and significantly correlated with each other at 99%
confidence interval with .
Table 4.2.3.4: Inter-Item Correlation of IP Measurement Model
IP2 IP3 IP4 IP5 Cronbach Alpha
IP2 1.000
IP3 .322**
1.000
0.726
IP4 .264**
.310**
1.000
IP5 .205**
.221**
.456**
1.000
**Correlation is significant at the 0.01 level
The corrected item-total correlation of all items was in the brackets in range of 0.356–0.483,
which is greater than the threshold value of .30 for acceptability. The Cronbach alpha for three
items of Innovation is exceeding the threshold level of 0.726 which is an indication of the
reliability of data used in this measurement model study. Generally, it could be concluded that
Innovation is a reliable scale used for the final analysis.
Page 104
87
4.2.4 Measurement Models of Financial Performance
Measurement model explains the fitness of each item using descriptive statistics, model fitness,
and inter-item correlation.
4.2.4.1 Descriptive Statistics
Descriptive statistics indicating the normality of data including mean, and standard deviations.
Moreover, Skewness and kurtosis are also indicated in the description of data. Cronbach Alpha
indicated the reliability of data which is showing the alpha values in the last column of the
below-mentioned table. The descriptive statistics table indicated 460 as the total number of
respondents who have participated in this primary research. This study used five Likert scales for
research and all items showed minimum values with 1 and maximum values with 5. Mean values
indicated the average of total responses; they have shown for five items. The highest values are
3.82 and the minimum mean value is 3.58. The highest values are a positive indication and lead
to strongly agree with the measurement item and vice versa. All items of financial performance
have shown a mean value above 3, which showed that most respondents are leading to agree and
strongly agree.
Table 4.2.4.1 Descriptive Statistics of Financial Performance
Mean Std. Dev Skew Kurt Cronbach Alpha
FP1 3.726 1.143 -0.891 0.220 0.730
FP2 3.822 1.005 -0.750 0.249 0.735
FP3 3.589 1.005 -0.466 -0.205 0.783
FP4 3.800 0.921 -0.970 1.357 0.831
The standard deviation is an amount that expresses how much the members of a group differ
from the mean of the group. This study indicated that standard deviations of majority values are
closer to 1, which means that out of a total of five, 20% of people are deviating from mean
values. Skewness is a measure of the asymmetry of the probability distribution of a random
Page 105
88
variable of about its mean. The asymmetry value can be positive or negative, or even undefined.
The threshold level could be close to zero and in this study, the values of asymmetry of financial
performance are closer to zero, but almost all values are negative. Negative values indicated that
at the initial stage, the data trend is negative and financial performance data is negatively
skewed.
Kurtosis is a measure of whether the data are heavy or light tail in relation to a normal
distribution. It also indicates the sharpness of the peak of the frequency distribution curve. The
threshold value level of kurtosis is 3 and in this study, all values are between "-3 < 0 > +3". It is
an indication of the normality of the data. Cronbach's alpha is known as a reliability test and
historical studies indicated that its value should be between 0.70 and 0.90, but the data will also
be considered as reliable if its value is greater than 0.60. In the case of financial performance, the
Cronbach's Alpha value is between the thresholds and its value for all the items 0.73-0.83. It is
another indication of the reliability of the data but still it an indication of weak reliability.
4.2.4.2 Assessment of Overall Fitness
First order confirmatory factor analysis is conducted to examine the best fit of the measurement
model. It is noticed that all the measurement items of financial performance are showing
statistical significance of regression weights. Multiple squared correlation coefficients (R2)
indicate the strong internal consistency and uni-dimensionality of the scale. This first order CFA
indicated that all the 4 items are not properly fit measurement model of financial performance in
total collected data. Values of Chi-square and normed chi-square are showing greater which
indicates at first order CFA level. Chi-square and normed chi-square are 14.103 which is small
preferred and 7.051which should less than 5 respectively (Schumacker & Lomax, 2004).
Page 106
89
Table 4.2.4.2: Fit levels of Original FP Measurement Model
Index Threshold Level Original Model
Statistic Fitness Level
χ² Small preferable 14.103 Moderate
χ²/df ≤ 5.0 7.051 Poor
RMR ≤ .08 0.030 Good
CFI ≥ .90 0.983 Good
GFI ≥ .90 0.985 Good
NFI ≥ .90 0.980 Good
RMSEA ≤ .10 0.115 Poor
There are other few values which are used for goodness and fitness of the model suggested by
multiple experts. These are also showing deviated from their threshold levels which are an
indication of unfitness of measurement model of financial performance. RMR, CFI, GFI, and
NFI values are showing best fitting of measurement model of financial performance (Steiger,
2000; Browne & Cudeck, 1989; MacCallum et al, 1996; Shevlin & Miles, 1998). The
measurement model of Financial Performance is showing RMSEA value 0.115 and first order
CFA of financial performance indicated that RMSEA is crossing the highest cut-off level which
is dangerous and there exists a clear issue in the measurement model which should be overcome.
Page 107
90
Figure I: First-Order CFA of the Original Model of Financial Performance
Overall it is presumed that there exist few issues in the data which is making issues in
measurement model goodness and fitness. The estimations of Chi-square, normed chi-square,
and RMSEA are veering off from their cut-off or threshold level which demonstrated that
financial performance model is not properly good and fit. The poor measurement model fitness
required to revise the correlations between items, path estimates and modification indices.
Subsequently, after meditation and arduous hit-and-trial, it was all estimation items to obtain the
best-fitted measurement model of financial performance, few questionnaires were dropped and
only 405 questionnaires remain which will be utilized for final analysis.
Figure II: First-Order CFA of the Updated Model of Financial Performance
The standardized estimates of final measurement model of Financial Performance are
statistically significant and contributing to determine the other factors. It is noticed that all the
four items are loading on specified construct and showing significance in factor loading and
squared correlation. The important thing is that standardized estimates are within the threshold
Page 108
91
level of one and all variances are a significant positive. Table of assessment of measurement
model fitness is indicating that all standards of goodness and fitness have approximately
achieved the threshold level.
Table 4.2.4.3: Comparative Fitness levels of FP Measurement Model
Index Threshold Level Original Model Updated Model
Statistic Fitness Level Statistic Fitness Level
χ² Small preferable 14.103 Moderate 3.213 Good
χ²/df ≤ 5.0 7.051 Poor 3.213 Good
RMR ≤ .08 0.030 Good 0.014 Good
CFI ≥ .90 0.983 Good 0.996 Good
GFI ≥ .90 0.985 Good 0.996 Good
NFI ≥ .90 0.980 Good 0.994 Good
RMSEA ≤ .10 0.115 Poor 0.074 Good
The values of chi-square and normed chi-square are 3.213 which are much lower than the
original model and less than the cut off value. It is an indication of fitness in the model or data in
a final model of this study. RMR's value is as well lower than the threshold level which supports
the goodness and fitness of the measurement model. CFI, GFI, and NFI also supporting the
model fitness as these values are also meeting the threshold level standards. RMSEA value is
also less than threshold level which is supporting to model goodness and fitness. Generally, it is
presumed that now there are no issues in the data which would possibly lead to measurement
model goodness and fitness.
4.2.4.3 Assessment of Inter-Item Correlation and Reliability
In the above-mentioned description of model fitness indicated that all the four factors of financial
performance are statistically significant. Factor loading on the unobserved variables of financial
performance is in between threshold ranges with the least value of estimates is 0.40. Items are
Page 109
92
correlated with each other at a 99% confidence interval. In all the cases correlation level deviated
and least correlation is noticed between FP3 and FP4 which is significant and correlated with
and FP1 and FP2 are statistically and significantly correlated with each
other at 99% confidence interval with .
Table 4.2.4.4: Inter-Item Correlation FP Measurement Model
FP1 FP2 FP3 FP4 Cronbach Alpha
FP1 1.000
FP2 .714**
1.000
0.785
FP3 .412**
.520**
1.000
FP4 .433**
.367**
.399**
1.000
**Correlation is significant at the 0.01 level
The corrected item-total correlation of all items was in the brackets in range of 0.356–0.483,
which is greater than the threshold value of .30 for acceptability. The Cronbach alpha for three
items of financial performances is exceeding the threshold level of 0.785 which is an indication
of the reliability of data used in this measurement model study. Generally, it could be concluded
that Financial Performance is a reliable scale used for final analysis.
Page 110
93
4.2.5 Measurement Models of Non-Financial Performance
Measurement model explains the fitness of each item using descriptive statistics, model fitness,
and inter-item correlation.
4.2.5.1 Descriptive Statistics
Descriptive statistics indicated the normality of data including mean and standard deviations.
Moreover, Skewness and kurtosis are also indicated in the description of data. Cronbach Alpha
indicated the reliability of data which is showing the alpha values in the last column of the
below-mentioned table.
Table 4.2.5.1 Descriptive Statistics of Non-financial performance
Mean Std. Dev Skew Kurt Cronbach Alpha
NFP1 3.804 1.130 -0.928 0.260 0.691
NFP2 3.763 0.823 -0.336 0.004 0.682
NFP3 3.637 0.871 -0.753 1.023 0.681
NFP4 3.652 0.977 -0.664 0.327 0.670
NFP5 3.685 1.002 -0.861 0.502 0.673
NFP6 3.722 0.962 -0.512 0.029 0.718
The descriptive statistics table indicated 460 as the total number of respondents who have
participated in this primary research. This study used five Likert scales for research and all items
showed minimum values with 1 and maximum values with 5. Mean values indicated the average
of total responses; they have shown for five items. The highest values are 3.81 and the minimum
mean value is 3.63. The highest values are a positive indication and lead to strongly agree with
the measurement item and vice versa. All items of non-financial performance have shown a
mean value above 3, which showed that most respondents are leading to agree and strongly
agree.
The standard deviation is an amount that expresses how much the members of a group differ
from the mean of the group. This study indicated that standard deviations of majority values are
Page 111
94
closer to 1, which means that out of a total of five, 20% of people are deviating from mean
values. Skewness is a measure of the asymmetry of the probability distribution of a random
variable of about its mean. The asymmetry value can be positive or negative, or even undefined.
The threshold level could be close to zero and in this study, the values of asymmetry of non-
financial performance are closer to zero, but almost all values are negative. Negative values
indicated that at the initial stage, the data trend is negative and non-financial performance data is
negatively skewed.
Kurtosis is a measure of whether the data are heavy or light tail in relation to a normal
distribution. It also indicates the sharpness of the peak of the frequency distribution curve. The
threshold value level of kurtosis is 3 and in this study, all values are between "-3 < 0 > +3". It is
an indication of the normality of the data. Cronbach's alpha is known as a reliability test and
historical studies indicated that its value should be between 0.70 and 0.90, but the data will also
be considered as reliable if its value is greater than 0.60. In the case of non-financial
performance, the Cronbach's Alpha value is between the thresholds and its value for all the items
0.67-0.72. It is another indication of the reliability of the data but still it an indication of weak
reliability.
4.2.5.2 Assessment of Overall Fitness
First order confirmatory factor analysis is conducted to examine the best fit of the measurement
model. It is noticed that all the measurement items of non-financial performance are showing
statistical significance of regression weights. Multiple squared correlation coefficients (R2)
indicate the strong internal consistency and uni-dimensionality of the scale. This first order CFA
indicated that all the 6 items are not properly fit measurement model of non-financial
performance in total collected data. Values of Chi-square and normed chi-square are showing
Page 112
95
greater which indicates at first order CFA level. Chi-square and normed chi-square are 110.85
which is small preferred and 12.317 which should less than 5 respectively (Schumacker &
Lomax, 2004).
Table 4.2.5.2: Fit levels of Original NFP Measurement Model
Index Threshold Level Original Model
Statistic Fitness Level
χ² Small preferable 110.85 Moderate
χ²/df ≤ 5.0 12.317 Poor
RMR ≤ .08 0.070 Good
CFI ≥ .90 0.805 Poor
GFI ≥ .90 0.925 Good
NFI ≥ .90 0.797 Poor
RMSEA ≤ .10 0.157 Poor
There are other few values which are used for goodness and fitness of the model suggested by
multiple experts. These are also showing deviated from their threshold levels which are an
indication of unfitness of measurement model of non-financial performance. Values of CFI and
NFI are showing poor fitness because these are less than a threshold level. RMR and GFI values
are showing best fitting of measurement model of non-financial performance (Steiger, 2000;
Browne & Cudeck, 1989; MacCallum et al, 1996; Shevlin and Miles, 1998). The measurement
model of Non-financial Performance is showing RMSEA value 0.157 and first order CFA of
non-financial performance indicated that RMSEA is crossing the highest cut-off level which is
dangerous and there exists a clear issue in the measurement model which should be overcome.
Page 113
96
Figure I: First-Order CFA of the Original Model of Non-financial Performance
Overall it is presumed that there exist few issues in the data which is making issues in
measurement model goodness and fitness. The estimations of Chi-square, normed chi-square,
CFI, NFI, and RMSEA are veering off from their cut-off or threshold level which demonstrated
that non-financial performance model is not properly good and fit. The poor measurement model
fitness required to revise the correlations between items, path estimates and modification indices.
Subsequently, after meditation and arduous hit-and-trial, it was all estimation items to obtain
best-fitted measurement model of non-financial performance, NFP 6 and few questionnaires
were dropped and only 405 questionnaires have remained which will be utilized for final
analysis.
Page 114
97
Figure II: First-Order CFA of the Updated Model of Non-financial Performance
The standardized estimates of final measurement model of Non-financial Performance are
statistically significant and contributing to determine the other factors. It is noticed that all the
five items are loading on specified construct and showing significance in factor loading and
squared correlation. The important thing is that standardized estimates are within the threshold
level of one and all variances are a significant positive. Table of assessment of measurement
model fitness is indicating that all standards of goodness and fitness have approximately
achieved the threshold level.
Table 4.2.5.3: Comparative Fitness levels of NFP Measurement Model
Index Threshold Level Original Model Updated Model
Statistic Fitness Level Statistic Fitness Level
χ² Small preferable 110.85 Moderate 1.749 Good
χ²/df ≤ 5.0 12.317 Poor 1.749 Good
RMR ≤ .08 0.070 Good 0.011 Good
CFI ≥ .90 0.805 Poor 0.997 Good
GFI ≥ .90 0.925 Good 0.998 Good
NFI ≥ .90 0.797 Poor 0.994 Good
RMSEA ≤ .10 0.157 Poor 0.043 Good
Page 115
98
The values of chi-square and normed chi-square are 1.749 which is much lower than the original
model and less than the cut off value. It is an indication of fitness in the model or data in a final
model of this study. RMR's value is as well lower than the threshold level which supports the
goodness and fitness of the measurement model. CFI, GFI, and NFI also supporting the model
fitness as these values are also meeting the threshold level standards. RMSEA value is also less
than threshold level which is supporting to model goodness and fitness. Generally, it is presumed
that now there are no issues in the data which would possibly lead to measurement model
goodness and fitness.
4.2.5.3 Assessment of Inter-Item Correlation and Reliability
In the above-mentioned description of model fitness indicated that all the four factors of non-
financial performance are statistically significant. Factor loading on the unobserved variables of
non-financial performance is in between threshold ranges with the least value of estimates is
0.40. Items are correlated with each other at a 99% confidence interval. In all the cases
correlation level deviated and least correlation is noticed between NFP1 and NFP5 which is
significant and correlated with and NFP1 and NFP2 are statistically and
significantly correlated with each other at 99% confidence interval with .
Table 4.2.5.4: Inter-Item Correlation of NFP Measurement Model
NPF1 NPF2 NPF3 NPF4 NPF5 Cronbach Alpha
NPF1 1.000
NPF2 .446**
1.000
NPF3 .218**
.367**
1.000
0.745
NPF4 .133**
.248**
.337**
1.000
NPF5 .167**
.188**
.221**
.406**
1.000
**Correlation is significant at the 0.01 level
Page 116
99
The corrected item-total correlation of all items was in the brackets in range of 0.342–0.475,
which is greater than the threshold value of .30 for acceptability. The Cronbach alpha for three
items of non-financial performances is exceeding the threshold level of 0.785 which is an
indication of the reliability of data used in this measurement model study. Generally, it could be
concluded that Non-financial Performance is a reliable scale used for final analysis.
Page 117
100
4.2.6 Measurement Models of Stakeholder Pressure
Measurement model explains the fitness of each item using descriptive statistics, model fitness,
and inter-item correlation.
4.2.6.1 Descriptive Statistics
Descriptive statistics indicating the normality of data including mean, standard deviations.
Moreover, Skewness and kurtosis are also indicated in the description of data. Cronbach Alpha
indicated the reliability of data which is showing the alpha values in the last column of the
below-mentioned table.
Table 4.2.6.1 Descriptive Statistics of Stakeholder Pressure
Mean Std. Dev Skew Kurt Cronbach Alpha
SP1 3.441 1.403 -0.409 -1.083 0.712
SP2 3.567 1.202 -0.481 -0.657 0.718
SP3 3.376 1.039 -0.333 -0.198 0.785
SP4 3.452 1.054 -0.625 0.049 0.818
The descriptive statistics table indicated 460 as the total number of respondents who have
participated in this research. This study used five Likert scales for research and all items showed
minimum values with 1 and maximum values with 5. Mean values indicated the average of total
responses; they have shown for four items. The highest values are 3.56 and the minimum mean
value is 3.37. The highest values are a positive indication and lead to strongly agree with the
measurement item and vice versa. All items of stakeholder pressure have shown a mean value
above 3, which showed that most respondents are leading to agree and strongly agree.
The standard deviation is an amount that expresses how much the members of a group differ
from the mean of the group. This study indicated that standard deviations of majority values are
closer to 1, which means that out of a total of five, 20% of people are deviating from mean
values. Skewness is a measure of the asymmetry of the probability distribution of a random
Page 118
101
variable of about its mean. The asymmetry value can be positive or negative, or even undefined.
The threshold level could be close to zero and in this study, the values of asymmetry of
stakeholder pressure are close to zero, but almost all values are negative. Negative values
indicated that at the initial stage, the data trend is negative and stakeholder pressure data is
negatively skewed.
Kurtosis is a measure which indicates the sharpness of the peak of the frequency distribution
curve. The threshold value level of kurtosis is 3 and in this study, all values are between "-3 < 0
> +3". It is an indication of the normality of the data. Cronbach's alpha is known as a reliability
test and historical studies indicated that its value should be between 0.70 and 0.90, but the data
will also be considered as reliable if its value is greater than 0.60. In the case of stakeholder
pressure, the Cronbach's Alpha value is between the thresholds and its value for all the items
0.71-0.81. It is another indication of the reliability of the data but still it an indication of weak
reliability.
4.2.6.2 Assessment of Overall Fitness
First order confirmatory factor analysis is conducted to examine the best fit of the measurement
model. It is noticed that all the measurement items of stakeholder pressure are showing statistical
significance of regression weights. Multiple squared correlation coefficients (R2) indicate the
strong internal consistency and uni-dimensionality of the scale. This first order CFA indicated
that all the 4 items are properly fitting to measurement model of stakeholder pressure in total
collected data. Values of Chi-square and normed chi-square are showing lower which indicates
at first order CFA level. Chi-square and normed chi-square are 1.426 which is small preferred
and 0.713 which should less than 5 respectively (Schumacker & Lomax, 2004).
Page 119
102
Table 4.2.6.2: Fit levels of Original SP Measurement Model
Index Threshold Level Original Model
Statistic Fitness Level
χ² Small preferable 1.426 Good
χ²/df ≤ 5.0 0.713 Good
RMR ≤ .08 0.011 Good
CFI ≥ .90 1.000 Good
GFI ≥ .90 0.998 Good
NFI ≥ .90 0.998 Good
RMSEA ≤ .10 0.000 Good
There are other few values which are used for goodness and fitness of the model suggested by
multiple experts. These are showing properly fitted to their threshold levels which are an
indication of fitness of measurement model of stakeholder pressure. Values of RMR, CFI, GFI,
and NFI are showing good fitness because these are matching the threshold level (Steiger, 2000;
Browne & Cudeck, 1989; MacCallum et al, 1996; Shevlin and Miles, 1998). The measurement
model of Stakeholder pressure is showing RMSEA value 0.000 and first order CFA of
stakeholder pressure indicated that RMSEA is matching cut-off level which is best fitted and
there exists no issue in the measurement model.
Figure I: First-Order CFA of the Original Model of Stakeholder pressure
Page 120
103
Overall it is presumed that there exist no issues in the data which could possibly create issues in
measurement model goodness and fitness. The estimations of Chi-square, normed chi-square,
CFI, GFI, NFI, and RMSEA are meeting criteria of their cut-off or threshold level which
demonstrated that stakeholder pressure model is properly good and fit. But actually, in the whole
measurement models, 405 questionnaires are used for overall analysis, so here I am going to test
again on 405 questionnaires which will be utilized for final analysis.
Figure II: First-Order CFA of the Updated Model of Stakeholder pressure
The standardized estimates of final measurement model of Stakeholder pressure are statistically
significant and contributing to determine the other factors. It is noticed that all the four items are
loading on specified construct and showing significance in factor loading and squared
correlation. The important thing is that standardized estimates are within the threshold level of
one and all variances are a significant positive. Table of assessment of measurement model
fitness is indicating that all standards of goodness and fitness have approximately achieved the
threshold level.
Page 121
104
Table 4.2.6.3: Comparative Fitness levels of SP Measurement Model
Index Threshold Level Original Model Updated Model
Statistic Fitness Level Statistic Fitness Level
χ² Small preferable 1.426 Good 6.226 Good
χ²/df ≤ 5.0 0.713 Good 3.113 Good
RMR ≤ .08 0.011 Good 0.020 Good
CFI ≥ .90 1.000 Good 0.991 Good
GFI ≥ .90 0.998 Good 0.993 Good
NFI ≥ .90 0.998 Good 0.987 Good
RMSEA ≤ .10 0.000 Good 0.072 Good
The values of chi-square and normed chi-square are 6.226 and 3.113 respectively which are
lower than the original model and less than the cut off value. It is an indication of fitness in the
model or data in a final model of this study. RMR's value is as well lower than the threshold
level which supports the goodness and fitness of the measurement model. CFI, GFI, and NFI also
supporting the model fitness as these values are also meeting the threshold level standards.
RMSEA value is also less than threshold level which is supporting to model goodness and
fitness. Generally, it is presumed that now there are no issues in the data which would possibly
lead to measurement model goodness and fitness.
4.2.6.3 Assessment of Inter-Item Correlation and Reliability
In the above-mentioned description of model fitness indicated that all the four factors of
stakeholder pressure are statistically significant. Factor loading on the unobserved variables of
stakeholder pressure is in between threshold ranges with the least value of estimates is 0.40. All
the items are correlated with each other at a 99% confidence interval. In all the cases correlation
level deviated and least correlation is noticed between SP3 and SP4 which is significant and
correlated with and SP1 and SP2 are statistically and significantly
correlated with each other at 99% confidence interval with .
Page 122
105
Table 4.2.6.4: Inter-Item Correlation of SP Measurement Model
SP1 SP2 SP3 SP4 Cronbach alpha
SP1 1.000
SP2 .690**
1.000
0.783
SP3 .452**
.510**
1.000
SP4 .452**
.397**
.312**
1.000
**Correlation is significant at the 0.01 level
The corrected item-total correlation of all items was in the brackets in range of 0.467–0.692,
which is greater than the threshold value of .30 for acceptability. The Cronbach alpha for three
items of stakeholder pressures is exceeding the threshold level of 0.785 which is an indication of
the reliability of data used in this measurement model study. Generally, it could be concluded
that Stakeholder pressure is a reliable and valid scale used for final analysis.
Page 123
106
4.3 Assessment of Structural Model
The structural model is incorporated at the second stage which provides the overall goodness,
fitness, and reliability of collected data and the hypothesized structural model.
4.3.1. Normality
The normality tests are carried out to fulfill the basic assumptions of any statistical tool that
explains the suitability of the data for the analysis and the technique. Proper attention has given
to this problem and in a review of multiple books and articles, it is noticed a lot of tests could be
possibly incorporated for removal of issues in sample data. There are several ways to verify
normality, such as descriptive statistics, the P-P plot and the histogram, etc., and these are carried
out to analyze non-normality in particular circumstances (Thode, 2002). Normality tests are
applied to check the normal distribution of random variables. Different types of tests are
conducted to verify that data is normal and there is no issue of errors. It is important to make
ensure that the instrument which has used in this study is accurate and truly measuring the
variable. It is important to make ensure that the instrument which has incorporated in this study
is accurate and truly measuring the variable.
4.3.1.1. Descriptive Statistics of Overall Selected Variables
Descriptive statistics indicate the mean and standard deviation. Moreover, it is used for purpose
indicating normality of data using Skewness, and kurtosis. There are a total of 405 respondents
which have taken part in this research after removing inadequate and inappropriate
questionnaires. Mean and median indicated that the trend of data is going toward strongly agree
as per average of results.
Page 124
107
Table 4.3.1.1 Descriptive Statistics Overall
Mean Std. Dev Skew Kurt
CSR 3.731 0.443 -0.482 0.554
FP 3.882 0.688 -0.750 0.325
NFP 3.823 0.502 -0.805 0.888
CR 3.738 0.618 -0.255 0.457
IP 3.670 0.638 0.462 -0.174
SP 3.644 0.828 -0.591 0.420
Skewness is a measure of symmetry, or all the more unequivocally, the absence of symmetry. An
appropriation, or information set, is symmetric in the event that it appears to be identical to one
side and right of the inside point. Skewness infers about the positive and negative spread of data
and in this study the spread of data gone toward the negative. Kurtosis deals about the flatness of
data spread. Kurtosis is a measure of whether the information is left or right side with respect to
an ordinary dispersion.
4.3.1.2. Histogram and P-P Plot
It is a diagram comprising of rectangles whose region is corresponding to the recurrence of a
variable and whose width is equivalent to the class interim. Histograms are used to explain the
representation of data in numerical ranges with equal size. Normally, it seems that the graphical
representation of the data and the independent factors are represented on the Y axis and the
dependent factors are represented on the X axis. There will be a representation of shaded
rectangles with respect to the variable zone. (Cooper et al., 2003). Histogram of CSR, financial
performance, non-financial performance, corporate reputation, innovation, and stakeholder
pressure have shown in the appendixes. P-P plot matches the empirical cumulative distribution
Page 125
108
function of a data with a specified theoretical cumulative distribution function (Cooper et al.,
2003). Normal P-P plot and detrended normal P-P plot are shown in the appendixes. All the
diagrams of the histogram, normal P-P plot and detrended p-p plot have indicated the normality
of dataset which has used in this study.
4.3.2. Linearity
Linearity is a situation where a dependent variable has a linear relationship with one or more
independent variables and, thus, can be computed as the linear function of the independent
variables. Linearity could be possibly seen using a graph known as scatter plot in which the
values of two variables are plotted along two axes, the pattern of the resulting points revealing
any correlation present. Scatter plot has shown in appendix between CSR and financial
performance, CSR and non-financial performance, CSR and corporate reputation, CSR and
innovation, CSR and stakeholder pressure, corporate reputation and financial performance,
corporate reputation and non-financial performance, innovation and financial performance,
innovation, and non-financial performance.
4.3.3. Multicollinearity
In this study, linearity was considered as a regression assumption. The linear relationship
between the variables is explained as a graphic representation of the standardized residuals. It
explained the linear or curvilinear relationship between variables. It is necessary for the
regression analysis; those variables should be distributed normally. It is necessary that
independent factors should not be strongly correlated with each other. Firstly, the variance
inflation factor (VIF) test was applied to verify the multicollinearity and the VIF value must be
less than 10 (Coenders & Saez, 2000). Secondly, multicollinearity can be tested by the tolerance
test, which means the influence of the prediction factors towards other predictors. Tolerance is
Page 126
109
measured by T = 1 - R² and fitness standards for tolerance are T> 0.2 and T> 0.01, which
confirms that there is no problem of multicollinearity in the factors (Coenders & Saez, 2000).
Table 4.3.3.1: Tolerance Level for Multicollinearity
FP NFP CR IP SP
NFP .713
.650 .640 .625
CR .724 .750
.786 .713
IP .694 .718 .765
.723
SP .860 .851 .840 .876
FP .794 .699 .689 .704
*If tolerance level is T>0.20, T>0.10, then there will be no issue of Multicollinearity
Multicollinearity occurs when the independent variables are not independent of each other. It
could possibly be detected using different methods but correlation and VIF test are most
common. If the value of the correlation between variables greater than 0.80, it is possible that
variables are facing the issue of multicollinearity (Rovny, 2009).
Table 4.3.3.2: VIF Level for Multicollinearity
FP NFP CR IP SP
NFP 1.403
1.539 1.562 1.599
CR 1.381 1.334
1.272 1.403
IP 1.440 1.392 1.308
1.384
SP 1.163 1.175 1.190 1.141
FP 1.259 1.430 1.451 1.421
*If VIF level is VIF<3.00, VIF<10.00, then there will be no issue of Multicollinearity
In homoscedasticity, it is also assumed that variance of error terms is similar across the
independent variables. In the linear relationship assumption, plot the standardized residuals
versus the predicted Y' values which can show whether points are equally distributed across all
values of the independent variables or not. Appendixes from 4.4.3.1 to 4.4.3.5 are showing the
scatter plot which clearly indicated that data is aligned with the line and there is no issue of data
in the whole analysis.
Page 127
110
4.3.4. Demographics
Demographics of this research are based on employees working in the banking sector of
Pakistan. Characteristics of respondents are based on 405 responses which are collected from
managerial employees working in Pakistan with numerous branches. In this study, the primary
target is to check the relationship between CSR and financial performance in well-reputed banks.
The respondents taken for this study were the branch managers of banking sectors working in
Federal, central and south regions.
Table 4.4.4.1: Demographics of Sample
Characteristics Quantity % Characteristics Quantity %
Gender
Age
Male 332 82.0 In between 20 – 30 Years 180 44.4
Female 73 18.0 In between 30 – 40 Years 145 35.8
Qualification In between 40 – 50 Years 79 19.5
Bachelor 109 26.9 More than 50 Years 1 0.20
Master 199 49.1
M.Phil. 92 22.7 Experience
Other Certifications 5 1.30 In between 0-5 Years 260 64.2
In between 6-10 Years 65 16.0
Designation In between 11-15 Years 51 12.6
Branch Manager 405 100.0 More than 16 Years 29 7.20
There are a total of 405 respondents in which the majorities are male, while the proportion of
women workers is around 18%. According to the second characteristics of the qualification, most
of the respondents are master qualified while experienced persons are the bachelor and even in a
third number; many people are M.Phil. The responses of the subject research work were received
from the branch managers, which participated in this research activity. According to the age
characteristic, the majority of the respondents were falling in the range of fewer than 30 years
and only one respondent was over 50 years old. With respect to experience, young people who
Page 128
111
work usually have less than five years of banking experience, while 29 respondents have more
than sixteen years of experience.
4.3.5. Reliability and Validity Analysis
A reliability analysis was performed to verify that the data is reliable or not. Cronbach Alpha
explains that the value should be between 0.7 and 0.9, which is considered more reliable. The
values of almost all the variables in this research are falling in the range of 0.7 to 0.9, which is
good and the data is reliable, which could be used for the analysis described. Cronbach's value of
financial performance is the highest with 0.785. For convergent validity, CR and AVE values are
explained in below mentioned table which considered as fall in category of acceptable
benchmarks.
Table 4.3.5.1: Reliability and Validity Analysis
Variable Scale Developed
By
Total
No. of
Items
Final
Items
Cronbach
Alpha CR AVE
Corporate Social
Responsibility Turker, 2009 13 8 0.747 0.758 0.611
Corporate Reputation Weiss, Anderson, &
MacInnis, 1999 5 4 0.774 0.816 0.596
Innovation Manu, 1992 5 4 0.726 0.801 0.506
Stakeholder Pressure Delmas & Toffel,
2008 4 4 0.783 0.760 0.514
Financial Performance Govindarajan, 1984 4 4 0.785 0.797 0.579
Non-financial
Performance Govindarajan, 1984 6 5 0.745 0.814 0.593
Page 129
112
4.3.6. Goodness and Fitness
First order confirmatory factor analysis was conducted to examine the best fit of the structural
model. It was noticed that all the factors of the structural model are showing statistical
significance of regression weights. Multiple squared correlation coefficients (R2) indicate the
strong internal consistency and uni-dimensionality of the scale. This first order CFA indicated
that values of Chi-square and normed chi-square are showing relevancy. Chi-square and normed
chi-square are 757.72 which is small preferred and 3.093 which should less than 5 respectively
(Schumacker & Lomax, 2004).
Table 4.3.6.1: Good and Fitness levels of Final Structural Model
Index Threshold Level Model
Statistic Fitness Level
χ² Small preferable 757.72 Good
χ²/df ≤ 5.0 3.093 Good
RMR ≤ .08 0.059 Good
GFI ≥ .90 0.875 Supporting
RMSEA ≤ .10 0.072 Good
There are other few values which are used for goodness and fitness of the model suggested by
multiple experts. These are also showing relevancy with their threshold levels which are an
indication of the fitness of the structural model of this study. RMR explains the square root of
means of covariance residuals which is actually obtained from the differences of corresponding
elements of observed and predicted covariance matrix. Its value will be considered as best fitted
if closer to zero while possibly up to 0.05 (Steiger, 2000) and 0.08 (Browne & Cudeck, 1989). In
this study value of RMR is 0.059 which within the threshold level.
The goodness of Fit statistic (GFI) is considered as a substitute of chi-square test which
computes the proportion of variance based estimated population covariance (Tabchnick and
Fidell, 2006). The threshold level of GFI is considered as 0.90 in case of the higher sample while
Page 130
113
in case of lower sample values could be possibly up to 0.95 is considered more appropriate
(Shevlin & Miles, 1998). In this structural scale, the value is closer to the threshold level which
clearly indicates that the model is properly fitting with the analysis. Values of CFI, NFI, and TLI
could also be considered for evaluating goodness and fitness of model.
RMSEA is another measure of model fitness which indicates the fitness of a structural model
with respect to chosen parameter estimates and it should fit with the population covariance
matrix (Byrne, 1994). This value could possibly deviate from 0.8 to 0.10 which fit show the
model fitness at a lower level but best fit of model its value should be lower than 0.8
(MacCallum et al, 1996). The structural model of corporate social responsibility is showing
RMSEA value 0.072 and first order CFA of the study indicated that RMSEA is within the
highest cut-off level which is favorable and there exists no issue in the structural model which
should be overcome. Generally, it is presumed that there exists no issue in the data which would
possibly lead to structural model goodness and fitness.
Page 131
114
4.3.7. Correlation Matrix
Correlation matrix has utilized for the portrayal of the relationship between CSR and financial
performance. It provided the level of relationship between dependent and independent factors.
Correlation framework could be helpful in light of the fact that it showed the analytical
relationship among factors. It explained that there are 0.416 significant and positive relations
between CSR and financial performance. Moreover, CSR has 0.467 significant and positive
relations with non-financial performance. Stakeholder pressure as a moderator was significantly
influencing all the factors, and innovation and corporate reputation as mediator are as well as
influencing the CSR and financial performance.
Table 4.3.7: Correlation Matrix
CSR IP CR SP FP NFP
CSR 1.000
IP .323**
1.000
CR .502**
.390**
1.000
SP .299**
.269**
.173**
1.000
FP .416**
.264**
.356**
.306**
1.000
NFP .467**
.316**
.437**
.307**
.518**
1.000
**Correlation is significant at the 0.01 level
Page 132
115
4.4 Hypothesis Testing
The hypothesis testing is used to examine whether there is sufficient evidence in a sample of data
to infer that a specific condition is valid for the entire population. In this study, I want to examine
direct relationships, simple mediation, sequential mediation, and the impact of moderation on the
relationship between CSR and financial, non-financial performance.
4.4.1 Direct Relationship
The direct relation investigates the amount of variation in one variable due to the variation in
another variable. This relationship could possibly be negative, positive and unrelated. The first
step is to examine the impact of corporate social responsibility on financial and non-financial
performance in the Pakistani banking sector.
4.4.1.1 Corporate Social Responsibility and Financial Performance
The first part of the direct relationship is to examine the relationship between CSR and financial
performance among Pakistani banks. Historical research proposed mixed results regarding the
relationship between CSR and financial performance. Research studies (Miller, 2016, Jain et al.,
2016, Ahamed et al., 2014) proposed significant positive relationships between CSR and
financial performance, while (Nollet et al., 2016) proposed a negative relationship, but
(Madorran & Garcia, 2016) did not examine any relationship between CSR and financial
performance. The following hypothesis is constructed on the basis of the research studies
mentioned above;
H1: There is a significant impact of corporate social responsibility on financial performance.
Page 133
116
Figure I: Impact of CSR on Financial Performance
The structural equations modeling is applied to support the hypothesis and the first-order
confirmatory factor analysis indicated that out of thirteen items of CSR, only eight items will be
in the best fit category and should be processed for further analysis. The financial performance
contained four items since these have shown the best fitness in the measurement model. The
direct relationship indicated that there is a significant and positive relationship between CSR and
financial performance. This finding was supported by multiple studies, as they already tested the
significant and positive relationship between these two factors (Miller, 2016; Jain et al., 2016;
Ahamed et al., 2014).
The coefficient of CSR indicated that with a unit of improvement in CSR will lead to an increase
of 0.299 units in financial performance. The probability value and the t-statistics are in the range
of significance level, which means that CSR acts as a contributing factor in financial
performance. There is no problem of multicollinearity as tested by the Variance Inflation Factor
(VIF). F-statistics is showing a significant level which is the indication of model goodness and
Page 134
117
fitness. R-square is indicating that approximately 17% of changes in financial performance are
coming due to CSR in the regression analysis.
Table 4.4.1.1: CSR and Financial Performance
IV DV Β S.E T-Value P-Value
CSR FP 0.299 0.129 2.323 0.020
F-Stat
84.40
P-value 0.000
R2
0.173
Adj-R
2 0.171
VIF 1.000 Tolerance 1.000
*VIF<3.00, T>0.20, F-Value < 0.10, *Significant at 0.05 level
This finding provided a platform for corporate and management staff to enhance CSR activities
that lead to enhanced financial performance in the banking sector. In addition, the findings
confirm the concepts of stakeholder theory which grounds that organizations must provide
benefits to their stakeholders that ultimately are beneficial to the organizations themselves.
Page 135
118
4.4.1.2 Corporate Social Responsibility and Non-Financial Performance
The main part of this section is examined the direct relationship between CSR and non-financial
performance among Pakistani banks. Historical research proposed mixed results regarding the
relationship between CSR and financial performance. Research studies (Becchetti & Trovato,
2011, Ahmed et. al., 1998, Gil et al., 2001; Luthans, Hodgetts, & Thompson, 1984; Owen &
Scherer, 1993) proposed significant positive relationships between CSR and non-financial
performance. There is no relationship between CSR rating and non-financial performance in the
banking sector (Vitaliano & Stella, 2006). The following hypothesis is constructed on the basis
of the research studies mentioned above;
H2: There is a significant impact of corporate social responsibility on non-financial
performance.
Figure II: Impact of CSR on Non-Financial Performance
Page 136
119
The structural equations modeling is applied to support the hypothesis and the first-order
confirmatory factor analysis indicated that eight items of CSR and five items of non-financial
performance will be in the best fit category and should be processed for further analysis. The
direct relationship indicated that there is a significant and positive relationship between CSR and
non-financial performance. This finding was supported by multiple studies, as they already tested
the significant and positive relationship between these two factors (Becchetti & Trovato, 2011,
Mishra & Suar, 2010; Ahmed et. al., 1998, Gil et al., 2001), but contradicts from the study of
(Vitaliano & Stella, 2006).
Table 4.4.1.2: CSR and Non-Financial Performance
IV DV Β S.E T-Value P-Value
CSR NFP 0.224 0.100 2.248 0.025
F-Stat
112.34
P-value
0.000
R2
0.218
Adj-R
2
0.216
VIF 1.000 Tolerance 1.000
*VIF<3.00, T>0.20, F-Value < 0.10, *Significant at 0.05 level
The coefficient of CSR indicated that with a unit of improvement in CSR will lead to an increase
of 0.224 units in non-financial performance. The probability value and the t-statistics are in the
range of significance level, which means that CSR acts as a contributing factor in non-financial
performance. There is no problem of multicollinearity as tested by the VIF test, autocorrelation
as tested by Durban Watson. F-statistics is showing a significant level which is the indication of
model goodness and fitness. R-square is indicating that approximately 22% of changes in non-
financial performance are coming due to CSR in the regression analysis. This finding provided a
platform for corporate and management staff to enhance CSR activities that lead to improved
personal development, cost reduction (Freeman 1997), in the banking sector. The discoveries
Page 137
120
affirm the ideas of stakeholder theory which grounds that associations must give advantages to
their partners that at last are useful to the associations themselves.
4.4.1.3 Remaining Direct Relationships
Corporate social responsibility directly influenced financial and non-financial performance. In
direct relationships, CSR also influenced innovation and corporate reputation. The coefficient of
the above-mentioned relation was 0.451 and 0.328 respectively. Kim and You (2013) analyzed
that CSR acted as a driving force of innovation in automobile industries. The integration of CSR
as a strategic component creates value, novel ideas and innovation opportunities that lead to
strong long-term performance. This innovative CSR is the key to strategic CSR and the creation
of new values for different stakeholders and shareholders. Cegarra-Navarro et al., (2016)
concluded that CSR significant and positively contributed toward innovation.
Table 4.4.1.3: Direct Relationships
IV DV Β S.E T-Value P-Value
CSR Innovation 0.289 0.115 2.516 0.012*
CSR CR 0.279 0.075 3.737 0.000**
Innovation CR 0.825 0.330 2.498 0.012*
Innovation FP 1.526 0.666 2.293 0.022*
CR NFP -0.082 0.237 -0.348 0.728
Innovation NFP 1.266 0.563 2.247 0.025*
CR FP -0.076 0.286 -0.265 0.791
*VIF<3.00, T>0.20, F-Value < 0.01, *p<0.05, **p<0.01
Famiyeh, et al. (2016) proposed that CSR contributed by companies improves their reputation as
well as their overall performance. The finding indicated that not only operational competitive
capabilities can influence organizational performance in terms of return on investment, sales
growth, market share, and overall profitability, but those soft investments such as social
responsibility and a good reputation can also have a positive impact significant in companies in
Page 138
121
general performance. It is therefore important for managers to pay critical attention to social
responsibility initiatives, such as investments in projects that make the world a better place, care
for the safety of employees and clients, respect for human rights and other investments to
improve society and the environment. In the below mentioned figure, there is explained a
combine structural model which enlightened all the direct relationships.
The innovation influenced corporate reputation, financial and non-financial performance with the
coefficients 0.622, 0.566 and 0.740, respectively. Miller (1988) proposed that innovation and
technological advancement lead to the establishment of corporate reputation among consumers.
The implication for managers is that reputation based on innovation is only sustainable if it is
positively linked with integrity and courage (Chun, 2006). Corporate reputation was included as
the second mediator that showed no significant influence on financial and non-financial
performance. These findings also support the stakeholder theory, since the pressures of different
stakeholder groups determine the organizational decisions (Famiyeh, et al., 2016).
Page 139
122
4.4.2 Simple Mediation
Mediation model is that which tries to distinguish and clarify the procedure that underlies an
unobserved relationship between predicted and predicting variable by means of the incorporation
of a third theoretical variable, known as a mediator. This mediation could be simple and
sequential as mediating variables increases. Innovation and corporate reputation are playing a
mediating role between CSR and financial, non-financial performance.
4.4.2.1 Innovation mediating the relationship of Corporate Social Responsibility and
Financial Performance
Monetary maintainability grasps general parts of an association that must be regarded keeping in
mind the survival to stay in the market for a long time. These aspects incorporate technological
advancement and innovation (Baumgartner & Ebner, 2010). Heikkurinen & Bonnedahl, (2013)
proposed that an economic advancement contends that associations have an obligation regarding
undertaking key duty about CSR. Another key area tackled by the sustainable development
discourse is the role of innovations in enhancing sustainability (Matos & Silvestre, 2013; Boons
et al., 2013).
In this context, once an innovation is implemented, it provides an organization with benefits that
have the potential of sustaining its viability in a global economy. Wagner, (2010) analyzed the
link between innovation with high social benefits and corporate social performance. Cegarra-
Navarro et al., (2016) conducted in this study focuses on the role of a company's innovation
culture in linking economic and social responsibilities with financial performance. So,
innovation could mediate between the relationship of CSR and financial performance. The
following hypothesis is constructed on the basis of the research studies mentioned above;
Page 140
123
H3: Innovation mediates the relationship of corporate social responsibility and
financial performance.
Figure I: Innovation mediates between CSR on Financial Performance
The structural equations modeling was applied to test the hypothesis and simple mediation
divided into three subparts. Firstly, it is tested that CSR in influencing the innovation positively
and standardized regression weight is 0.514. It means that with one unit change in CSR will lead
to 0.514 unit changes in innovation. The first relation is significant which means mediation is
possible (Baron & Kenny, 1986). Secondly, the impact of innovation is tested on financial
performance. The empirical analysis concluded that innovation is significantly contributing to
financial performance. Innovation is positively contributing to 0.142 variations in financial
performance (Martinez-Conesa, et al., 2017).
Page 141
124
Table 4.4.1.1: Mediation I
IV DV Β S.E T-Value P-Value LLCI ULCI
1 CSR IP 0.514 0.075 6.850 0.000 0.366 0.661
2 IP FP 0.142 0.046 0.002 0.000 0.051 0.232
3 CSR FP 0.574 0.072 7.797 0.000 0.429 0.718
Effect SE T-Value P-Value LLCI ULCI
Total Effect
0.646 0.074 9.187 0.000 0.508 0.785
Direct Effect 0.574 0.074 7.797 0.000 0.429 0.718
Effect Boot SE
Boot
LLCI
Boot
ULCI
Indirect Effect 0.073 0.034 0.018 0.150
Effect SE Z-Value P-Value
Sobel Test 0.073 0.026 2.770 0.006
1 2 3
R2
0.104 0.192 0.173
F-Statistics
46.89 47.76 84.40
P-Value 0.000 0.000 0.000
Simple mediation explained that the weight of total effect of CSR on financial performance was
0.646 (p< .01, 95% CI [0.508, 0.785]), while the weight of indirect effect when controlling
innovation was 0.073 (p< .01, 95% CI [0.018, 0.150]. The table also exhibited that innovation
carried 57% of the total effect of CSR on financial performance. There are multiple models
developed by Preacher and Hayes while for simple mediation Model 4 is used. A comparison of
estimates in the figure revealed that there was evidence for partial mediation as CSR' total effect
reduced a little but still remained significant when controlling for the mediator „innovation'. The
significant probability value of the Sobel test indicated that there is existing mediation in the
model and the reduction in the standardized regression weight indicates partial mediation since it
is observed that the standardized regression weight is greater than zero.
These findings have practical implications because inventive devices and innovative channels of
correspondence allow stakeholders (e.g supervisors and consumers) to share resources with each
other and encourage them to provide feedback. Such responses will result in the adjustment of
Page 142
125
CSR exercises, activities, policies and practices that will be financially and not financially
beneficial (Cegarra-Navarro et al., 2016). Durban Watson, Tolerance and VIF tests indicated that
the data is normal and significant F statistics indicated the goodness and fitness of the model. R-
square is showing that 10% of the variation in the model is coming due to CSR and innovation.
Sobel test, Arorian and Goodman Test are performed to verify the existence of mediation in the
regression model.
Page 143
126
4.4.2.2 Innovation mediating the relationship of Corporate Social Responsibility and Non-
Financial Performance
Corporate social responsibility influences organizational performance, financial and non-
financial performance, and brand performance. In this context, innovation is mediating between
CSR and non-financial performance. So, innovation could mediate between the relationship of
CSR and non-financial performance (Mishra & Suar, 2010). The following hypothesis is
constructed on the basis of the research studies mentioned above;
H4: Innovation mediates the relationship of corporate social responsibility and non-financial
performance.
Figure I: Innovation mediates between CSR on Non-Financial Performance
The structural equations modeling was applied to test the hypothesis and simple mediation
divided into three subparts. Firstly, it is tested that CSR in influencing the innovation positively
and standardized regression weight is 0.514. It means that with one unit change in CSR will lead
Page 144
127
to 0.514 unit changes in innovation. The first relation is significant which means mediation is
possible (Baron & Kenny, 1986). Secondly, the impact of innovation is tested on non-financial
performance. The empirical analysis concluded that innovation is significantly contributing to
non-financial performance. Innovation is positively contributing to 0.132 variations in financial
performance (Martinez-Conesa, et al., 2017).
Table 4.4.2.2: Mediation II
IV DV β S.E T-Value P-Value LLCI ULCI
1 CSR IP 0.514 0.075 6.850 0.000 0.366 0.661
2 IP NFP 0.132 0.033 4.044 0.000 0.068 0.195
3 CSR NFP 0.462 0.052 8.915 0.000 0.360 0.563
Effect SE T-Value P-Value LLCI ULCI
Total Effect
0.529 0.050 10.60 0.000 0.431 0.627
Direct Effect 0.432 0.052 8.915 0.000 0.359 0.563
Effect Boot SE
Boot
LLCI
Boot
ULCI
Indirect Effect 0.068 0.036 0.014 0.153
Effect SE Z-Value P-Value
Sobel Test 0.068 0.020 3.454 0.001
1 2 3
R2
0.104 0.249 0.218
F-Statistics
46.89 66.49 112.34
P-Value 0.000 0.000 0.000
Simple mediation explained that the weight of total effect of CSR on non-financial performance
was 0.529 (p< .01, 95% CI [0.431, 0.627]), while the weight of indirect effect when controlling
innovation was 0.068 (p< .01, 95% CI [0.014, 0.153]. The table also exhibited that innovation
carried 57% of the total effect of CSR on non-financial performance. A comparison of estimates
in the figure revealed that there was evidence for partial mediation as CSR‟ total effect reduced a
little but still remained significant when controlling for the mediator „innovation‟. The
significant probability value of the Sobel test indicated that there is existing mediation in the
Page 145
128
model and the reduction in the standardized regression weight indicates partial mediation since it
is observed that the standardized regression weight is greater than zero.
These findings have practical implications because inventive devices and innovative channels of
correspondence allow stakeholders (e.g supervisors and consumers) to share resources with each
other and encourage them to provide feedback. Such responses will result in the adjustment of
CSR exercises, activities, policies and practices that will be not financially beneficial (Cegarra-
Navarro et al., 2016). Durban Watson, Tolerance and VIF tests indicated that the data is normal
and significant F statistics indicated the goodness and fitness of the model. R-square is showing
that 10.4% of the variation in the model is coming due to CSR and innovation. Sobel test,
Arorian and Goodman Test are performed to verify the existence of mediation in the regression
model.
Page 146
129
4.4.2.3 Corporate Reputation mediating the relationship of Corporate Social Responsibility
and Financial Performance
CSR influences organizational performance, financial and non-financial performance, and brand
performance. In this context, corporate reputation is mediating between CSR and financial
performance. So, corporate reputation could mediate between the relationship of CSR and
financial performance (Mishra and Suar, 2010). The following hypothesis is constructed on the
basis of the research studies mentioned above;
H5: Corporate reputation mediates the relationship of corporate social responsibility and
financial performance.
Figure I: Corporate reputation mediates between CSR on Financial Performance
The structural equations modeling was applied to test the hypothesis and simple mediation
divided into three subparts. Firstly, it is tested that CSR in influencing the corporate reputation
Page 147
130
positively and standardized regression weight is 0.701. It means that with one unit change in
CSR will lead to 0.701 unit changes in corporate reputation. The first relation is significant
which means mediation is possible (Baron & Kenny, 1986). Secondly, the impact of corporate
reputation is tested on financial performance. The empirical analysis concluded that corporate
reputation is significantly contributing to financial performance. Corporate reputation is
positively contributing 0.493 variations in financial performance.
Table 4.4.2.3: Mediation III
IV DV β S.E T-Value P-Value LLCI ULCI
1 CSR CR 0.701 0.060 11.65 0.000 0.582 0.818
2 CR FP 0.219 0.057 3.818 0.000 0.106 0.332
3 CSR FP 0.493 0.080 6.162 0.000 0.336 0.650
Effect SE T-Value P-Value LLCI ULCI
Total Effect
0.646 0.074 9.187 0.000 0.508 0.785
Direct Effect 0.493 0.080 6.162 0.000 0.336 0.650
Effect Boot SE
Boot
LLCI
Boot
ULCI
Indirect Effect 0.153 0.048 0.078 0.239
Effect SE Z-Value P-Value
Sobel Test 0.153 0.424 3.616 0.000
1 2 3
R2
0.252 0.202 0.173
F-Statistics
135.7 50.91 84.40
P-Value 0.000 0.000 0.000
Simple mediation explained that the weight of total effect of CSR on financial performance was
0.646 (p< .01, 95% CI [0.508, 0.785]), while the weight of indirect effect when controlling
corporate reputation was 0.153 (p< .01, 95% CI [0.078, 0.239]. The table also exhibited that
corporate reputation carried 15% of the total effect of CSR on financial performance. A
comparison of estimates in the figure revealed that there was evidence for partial mediation as
CSR‟ total effect reduced a little but still remained significant when controlling for the mediator
„corporate reputation‟. The significant probability value of the Sobel test indicated that there is
Page 148
131
existing mediation in the model and the reduction in the standardized regression weight indicates
partial mediation since it is observed that the standardized regression weight is greater than zero.
These findings have practical implications as the organizational reputation improved will lead to
building confidence among top management. This context will improve the working
performance which affects the sale and trading, in turn, financial performance increases. Durban
Watson, Tolerance and VIF tests indicated that the data is normal and significant F statistics
indicated the goodness and fitness of the model. R-square is showing that 25.2% of the variation
in the model is coming due to CSR and corporate reputation. Sobel test, Arorian and Goodman
Test are performed to verify the existence of mediation in the regression model.
Page 149
132
4.4.2.4 Corporate Reputation mediating the relationship of Corporate Social Responsibility
and Non-Financial Performance
CSR influences organizational performance, financial and non-financial performance, and brand
performance. In this context, corporate reputation is mediating between CSR and non-financial
performance. So, corporate reputation could mediate between the relationship of CSR and
financial performance. The following hypothesis is constructed on the basis of the research
studies mentioned above;
H6: Corporate reputation mediates the relationship of corporate social responsibility and
non-financial performance.
Figure I: Corporate Reputation mediates between CSR on Non-Financial Performance
The structural equations modeling was applied to test the hypothesis and simple mediation
divided into three subparts. Firstly, it is tested that CSR in influencing the corporate reputation
positively and standardized regression weight is 0.701. It means that with one unit change in
Page 150
133
CSR will lead to 0.701 unit changes in corporate reputation. The first relation is significant
which means mediation is possible (Baron & Kenny, 1986). Secondly, the impact of corporate
reputation is tested on non-financial performance. The empirical analysis concluded that
corporate reputation is significantly contributing to non-financial performance. Corporate
reputation is positively contributing 0.375 variations in non-financial performance.
Table 4.4.2.4: Mediation IV
IV DV β S.E T-Value P-Value LLCI ULCI
1 CSR CR 0.701 0.060 11.650 0.000 0.582 0.818
2 CR NFP 0.219 0.039 5.495 0.000 0.141 0.297
3 CSR NFP 0.375 0.056 6.735 0.000 0.267 0.485
Effect SE T-Value P-Value LLCI ULCI
Total Effect
0.529 0.049 10.590 0.000 0.431 0.627
Direct Effect 0.373 0.056 6.760 0.000 0.265 0.484
Effect Boot SE
Boot
LLCI
Boot
ULCI
Indirect Effect 0.154 0.030 0.097 0.219
Effect SE Z-Value P-Value
Sobel Test 0.154 0.031 4.955 0.000
1 2 3
R2
0.252 0.273 0.197
F-Statistics
135.7 75.34 112.3
P-Value 0.000 0.000 0.000
Simple mediation explained that the weight of total effect of CSR on financial performance was
0.529 (p< .01, 95% CI [0.431, 0.627]), while the weight of indirect effect when controlling
corporate reputation was 0.154 (p< .01, 95% CI [0.097, 0.219]). The table also exhibited that
corporate reputation carried 15% of the total effect of CSR on non-financial performance. A
comparison of estimates in the figure revealed that there was evidence for partial mediation as
CSR‟ total effect reduced a little but still remained significant when controlling for the mediator
„corporate reputation‟. The significant probability value of Sobel test indicated that there is
Page 151
134
existing mediation in the model and the reduction in the standardized regression weight indicates
partial mediation since it is observed that the standardized regression weight is greater than zero.
These findings have practical implications as the organizational reputation improved will lead to
building confidence among top management. This context will improve the working
performance which affects the sale and trading, in turn, non-financial performance increases.
Durban Watson, Tolerance and VIF tests indicated that the data is normal and significant F
statistics indicated the goodness and fitness of the model. R-square is showing that 25.2% of the
variation in the model is coming due to CSR and corporate reputation. Sobel test, Arorian and
Goodman Test are performed to verify the existence of mediation in the regression model.
Page 152
135
4.4.3 Sequential Mediation
CSR influences organizational performance, financial and non-financial performance, and brand
performance. In this context, innovation and corporate reputation are mediating between CSR
and financial performance. So, innovation and corporate reputation could mediate between the
relationship of CSR and financial performance. The following hypothesis is constructed on the
basis of the research studies mentioned above;
H7: Innovation and corporate reputation mediates the relationship of corporate social
responsibility and financial performance
Figure I: Sequential mediation between CSR on Financial Performance
Preacher and Hayes, (2004) method were applied to test the hypothesis of sequential mediation.
Firstly, it is tested that CSR in influencing the innovation positively and standardized regression
weight is 0.513. It means that with one unit change in CSR will lead to 0.513 unit changes in
Page 153
136
innovation. The first relation is significant which means mediation is possible Preacher and
Hayes, (2004). Secondly, the impact of innovation was tested on corporate reputation. The
empirical analysis concluded that corporate reputation is significantly contributing to financial
performance. Innovation is positively contributing to 0.100 variations in financial performance
(Martinez-Conesa, et al., 2017).
Table 4.4.3.1: Mediation V
IV DV β S.E T-Value P-Value LLCI ULCI
1 CSR IP 0.513 0.075 6.848 0.000 0.366 0.661
2 CSR CR 0.586 0.061 9.858 0.000 0.466 0.705
3 IP CR 0.224 0.038 5.825 0.000 0.148 0.299
4 IP FP 0.100 0.048 2.108 0.036 0.007 0.194
5 CR FP 0.184 0.059 3.094 0.002 0.067 0.301
6 CSR FP 0.466 0.081 5.774 0.000 0.307 0.625
Effect SE T-Value P-Value LLCI ULCI
Total Effect
0.646 0.070 9.19 0.000 0.508 0.784
Direct Effect 0.466 0.081 5.773 0.000 0.307 0.625
Effect Boot SE
Boot
LLCI
Boot
ULCI
Total Indirect
0.180 0.045 0.096 0.275
CSR→IP→FP
0.052 0.032 0.003 0.125
CSR→IP→CR→FP
0.021 0.009 0.008 0.046
CSR→CR→FP 0.108 0.036 0.046 0.187
1 2 3 4
R2
0.104 0.31 0.218 0.173
F-Statistics
46.89 90.37 35.71 84.40
P-Value 0.000 0.000 0.000 0.000
Sequential mediation explained that the weight of total effect of CSR on financial performance
was 0.646 (p< .01, 95% CI [0.508, 0.784]), while the weight of second indirect effect when
controlling innovation and corporate reputation was 0.021 (p< .01, 95% CI [0.008, 0.046]. The
table also exhibited that innovation carried 46% of the total effect of CSR on financial
performance. There are multiple models developed by Preacher and Hayes while for serial
Page 154
137
mediation Model 6 is used. A comparison of estimates in the figure revealed that there was
evidence for partial mediation as CSR' total effect reduced a little but still remained significant
when controlling for the mediator „innovation'. The significant probability value of the Sobel test
indicated that there is existing mediation in the model and the reduction in the standardized
regression weight indicates partial mediation since it is observed that the standardized regression
weight is greater than zero.
Page 155
138
H8: Innovation and corporate reputation mediates the relationship of corporate social
responsibility and non-financial performance
Preacher and Hayes, (2004) method were applied to test the hypothesis of sequential mediation.
Firstly, it is tested that CSR in influencing the innovation positively and standardized regression
weight is 0.513. It means that with one unit change in CSR will lead to 0.513 unit changes in
innovation. The first relation is significant which means mediation is possible Preacher and
Hayes, (2004). Secondly, the impact of innovation was tested on corporate reputation. The
empirical analysis concluded that corporate reputation is significantly contributing to financial
performance. Innovation is positively contributing to 0.100 variations in financial performance
(Martinez-Conesa, et al., 2017).
Figure I: Sequential mediation between CSR on Non-Financial Performance
Page 156
139
Sequential mediation explained that the weight of total effect of CSR on non-financial
performance was 0.529 (p< .01, 95% CI [0.431, 0.627]), while the weight of second indirect
effect when controlling innovation and corporate reputation was 0.022 (p< .01, 95% CI [0.010,
0.043]. The table also exhibited that innovation carried 46% of the total effect of CSR on
financial performance. A comparison of estimates in the figure revealed that there was evidence
for partial mediation as CSR' total effect reduced a little but still remained significant when
controlling for the mediator „innovation'. The significant probability value of the Sobel test
indicated that there is existing mediation in the model and the reduction in the standardized
regression weight indicates partial mediation since it is observed that the standardized regression
weight is greater than zero.
Table 4.4.3.2: Mediation VI
IV DV Β S.E T-Value P-Value LLCI ULCI
1 CSR IP 0.513 0.075 6.847 0.000 0.366 0.661
2 CSR CR 0.586 0.061 9.587 0.000 0.466 0.705
3 IP CR 0.224 0.038 5.825 0.000 0.148 0.299
4 IP NFP 0.089 0.033 2.705 0.007 0.024 0.154
5 CR NFP 0.188 0.041 4.564 0.000 0.107 0.269
6 CSR NFP 0.351 0.056 6.270 0.000 0.241 0.461
Effect SE T-Value P-Value LLCI ULCI
Total Effect
0.529 0.050 10.60 0.000 0.431 0.627
Direct Effect 0.351 0.056 6.270 0.000 0.241 0.461
Effect Boot SE
Boot
LLCI
Boot
ULCI
Total Indirect
0.178 0.037 0.108 0.251
CSR→IP→NFP
0.046 0.032 -0.005 0.120
CSR→IP→CR→NFP
0.022 0.008 0.010 0.043
CSR→CR→NFP 0.110 0.028 0.062 0.172
1 2 3 4
R2
0.104 0.31 0.286 0.219
F-Statistics
46.89 90.37 53.45 112.30
P-Value 0.000 0.000 0.000 0.000
Page 157
140
4.4.4 Moderation
4.4.4.1 Moderation I:
Preacher and Hayes, (2004) method were applied to test the hypothesis of moderation. Firstly, it
is tested that CSR in influencing the financial performance positively and standardized
regression weight is 0.825. It means that with one unit change in CSR will lead to 0.825 unit
changes in financial performance. Impact of stakeholder pressure was also tested on financial
performance. Interaction term showed a significant and positive relation which means
moderation is affecting. The empirical analysis concluded that stakeholder pressure is
significantly establishing the CSR and financial performance relationship.
H9: Stakeholder pressure moderates the relationship of corporate social responsibility and
financial performance.
Table 4.4.4.1: Moderation I
IV DV β S.E T-Value P-Value LLCI ULCI
1 CSR FP 0.825 0.267 3.126 0.002 0.306 1.343
2 SP FP 0.468 0.185 6.004 0.000 0.746 1.473
3 Int-1 FP 0.815 0.286 3.515 0.000 0.232 0.069
Conditional Effect
I
0.595 0.082 7.268 0.000 0.434 0.756
II
0.528 0.076 6.929 0.000 0.378 0.677
III 0.461 0.113 4.056 0.000 0.237 0.683
R2 ΔR
2
0.212 0.002
F-Statistics
35.85 1.14
P-Value 0.000 0.000
In the context of conditional effect, the relationship among CSR and financial performance are
strongly significant and positive. As the influence of stakeholder pressure goes toward moderate,
it weakens the relation and value of coefficient goes down. But in the end, when the moderator is
Page 158
141
fully influencing, the coefficient goes down hugely (Saeidi et al., 2015; Chang, Oh &
Messersmith, 2013; Lioui & Sharma, 2012; Marshall & McCarthy, 2013; Zhu & Sarkis, 2007)
There are multiple models developed by Preacher and Hayes while for moderation, Model 1 is
used.
Page 159
142
4.4.4.2 Moderation II:
Preacher and Hayes, (2004) method was applied to test the hypothesis of moderation. Firstly, it is
tested that CSR in influencing the non-financial performance positively and standardized
regression weight is 0.830. It means that with one unit change in CSR will lead to 0.830 unit
changes in non-financial performance. Impact of stakeholder pressure was also tested on non-
financial performance. Interaction term showed a significant and positive relation which means
moderation is affecting. The empirical analysis concluded that stakeholder pressure is
significantly establishing the CSR and non-financial performance relationship.
H10: Stakeholder pressure moderates the relationship of corporate social responsibility and
non-financial performance.
Table 4.4.4.2: Moderation II
IV DV β S.E T-Value P-Value LLCI ULCI
1 CSR NFP 0.830 0.201 4.141 0.000 0.436 1.224
2 SP NFP 1.109 0.185 6.004 0.000 0.746 1.473
3 Int-1 NFP 0.193 0.054 3.617 0.000 0.298 0.088
Conditional Effect
I
0.565 0.057 9.843 0.000 0.452 0.677
II
0.404 0.053 7.584 0.000 0.299 0.509
III 0.240 0.079 3.076 0.002 0.088 0.401
R2 ΔR
2
0.273 0.023
F-Statistics
50.09 13.08
P-Value 0.000 0.000
In the context of conditional effect, the relationship between CSR and non-financial performance
is very significant and positive. As the influence of stakeholder pressure moderates, the
relationship weakens and the value of the coefficient decreases. But in the end, when the
moderator is influencing completely, the coefficient drops enormously (Saeidi et al., 2015;
Page 160
143
Chang, Oh & Messersmith, 2013; Lioui & Sharma, 2012; Marshall & McCarthy, 2013; Zhu &
Sarkis, 2007).
Page 161
144
CHAPTER 5
DISCUSSION AND CONCLUDING REMARKS
5.1 Introduction:
Corporate social responsibility is emerging phenomenon and researchers, experts, and
practitioners have major attraction. Multiple researchers have studied in more than one aspect but
this study examined the implications of CSR on the financial and non-financial performance of
Pakistani banks. This section contained discussion, concluding remarks, theoretical, practical and
managerial implications, limitations, suggestions and recommendations, and future possible
directions.
5.2 Discussion
This quantitative analysis investigated the implication of CSR in financial and non-financial
performance in the Pakistani banking sector. The purpose of this study is to explain the extent of
the social conduct of banks that lead to affect financial performance. After the financial crisis of
2007-2008, social pressure convinced the organization to get involved in social activities. In the
first question, the main concern of the study is to examine the effect of CSR on financial and
non-financial performance. The direct relationship indicated that there is a significant and
positive relationship between CSR and financial performance. This finding was supported by
multiple studies since they proved a significant and positive relationship between these two
factors (Miller, 2016; Jain et al., 2016; Ahamed et al., 2014).
In the second hypothesis, the direct relationship indicated that there is a significant and positive
relationship between CSR and non-financial performance. This finding was supported by
Page 162
145
multiple studies, as they already tested the significant and positive relationship between these
two factors (Becchetti & Trovato, 2011; Mishra & Suar, 2010; Ahmed et. al., 1998; Gil et al.,
2001), but contradicts from the study of (Vitaliano & Stella, 2006). The findings in the present
investigation resolved the inconsistency of previous investigations with respect to whether the
connection between CSR and performance is positive, negative or impartial. Based on the
stakeholder theory (McWillians & Seigel, 2000), one would have expected that each of the four
measures of Carroll's CSR model would effectively affect performance.
These findings provided implications for business managers that could possibly improve
financial performance while performing better social acts for stakeholders. Another implication
is that the efforts made and the financial resources used to improve the social activities of the
organizations will be rewarded by improving financial performance. In addition, the findings
confirm the concepts of stakeholder theory which grounds that organizations must provide
benefits to their stakeholders that ultimately are beneficial to the organizations.
CSR also influenced innovation and corporate reputation. Kim and You (2013) analyzed that
CSR acted as a driving force for innovation in the automotive industries. The integration of CSR
as a strategic component creates value, new ideas and innovation opportunities that lead to a
solid long-term performance. This innovative CSR is the key to strategic CSR and the creation of
new values for different stakeholders and shareholders. Cegarra-Navarro et al. (2016) concluded
that CSR was significant and positively contributed to innovation. Famiyeh, et al. (2016)
proposed that CSR contributed by companies improves their reputation, as well as their overall
performance.
Page 163
146
Therefore, it is important that managers pay critical attention to social responsibility initiatives,
such as investments in projects that improve the world, taking care of the safety of employees
and customers, respect for human rights and other investments to improve society and
environment. Innovation influenced corporate reputation, financial and non-financial
performance. Miller (1988) proposed that innovation and technological advancement lead to the
establishment of a corporate reputation among consumers. The implication for managers is that
reputation based on innovation is sustainable, if positively related to integrity and courage
(Chun, 2006). Corporate reputation showed insignificant influence on financial and non-financial
performance. These findings also support the stakeholder theory, since pressures from different
stakeholder groups determine the decisions of the organization (Famiyeh, et al., 2016).
Innovation significantly contributed to the relationship of CSR, financial and non-financial
performance. These aspects incorporate technological advancement and innovation
(Baumgartner & Ebner, 2010). Heikkurinen & Bonnedahl, (2013) proposed that economic
advancement contends that organizations have a key obligation regarding CSR. The sustainable
development discourse is the role of innovations in enhancing sustainability (Matos and
Silvestre, 2013; Boons et al., 2013). In this context, once an innovation is implemented, it
provides an organization with benefits that have the potential of sustaining its viability in a
global economy. Wagner, (2010) analyzed the link between innovation with high social benefits
and corporate social performance.
Cegarra-Navarro et al., (2016) conducted in this study focuses on the role of a company's
innovation culture in linking economic and social responsibilities with financial performance.
So, innovation positively mediated between the relationship of CSR, financial and non-financial
performance (Martinez-Conesa, et al., 2017). These findings have practical implications because
Page 164
147
inventive devices and innovative channels of correspondence allow stakeholders (e.g supervisors
and consumers) to share resources with each other and encourage them to provide feedback.
Such responses will result in the adjustment of CSR exercises, activities, policies and practices
that will be financially and not financially beneficial (Cegarra-Navarro et al., 2016).
This study examined the mediating influence of corporate reputation between CSR and financial
and non-financial performance. Corporate reputation contributed as a positive mediator that
partially affected the aforementioned relationship (DiSegni et al., 2015, Siltaoja 2006, Abdullah
& Abdul Aziz 2013). The finding indicates that not only operational competitive capabilities can
influence financial and non-financial performance, but soft investments such as social
responsibility and a good reputation can also have a significant positive impact on the company
performance (Schwaiger 2004; Dyer & Chu 2003). Therefore, it is important that managers pay
critical attention to social responsibility initiatives, such as investments in projects that make the
world a better place, taking care of the safety of employees and customers, respect for human
rights and other investments to improve society and the environment since they have the power
to improve the reputation and performance of their companies.
The moderation analysis explained that stakeholder pressure is influencing the relationship
between CSR and financial and non-financial performance. Researchers proposed that external
pressure is considered one of the key elements that affect the implementation of social practices.
The findings explained above indicated that stakeholder pressures have some moderating effects
for social practices and financial and non-financial performance (Haleem et al., 2015). These
findings are relevant to historical studies of similar relationships (Zhu & Sarkis, 2007, Marshall
& McCarthy, 2013). This study contradicted with (Ketidis et al., 2013) that they found no
moderating effect of the pressures in the construction industry.
Page 165
148
5.3 Conclusion
This study examined the implications of CSR on financial and non-financial performance with
moderating impact of stakeholder pressure and mediating influence of innovation and corporate
reputation of Pakistani banks. The main focus was on Pakistan, a representative member of the
group of developing countries, where such a study has yet to be carried out and where the
increasing internationalization of the country's largest firms should clearly illustrate the
importance of adopting far-reaching corporate social policies. This study will be significantly
beneficial to academicians focusing on CSR and to business pioneers, managerial personnel and
financiers who are concerned with the impact of CSR on firms' financial performance. This study
is identifying the relationship between social welfare and organizational performance which will
enlighten the benefits in term of environment, labor, economy, and philanthropy.
There were different ways of a survey which used for data collection in historical researches but
in this research five points, Likert scales used because these are respondent-friendly and provides
reliable data. The research instruments used in this study has adapted according to multiple
dimensions of CSR (Turker 2009), financial performance (Govindarajan, 1984), non-financial
performance (Govindarajan, 1984), stakeholder pressure (Yu & Ramanathan, 2015), innovation
(Delmas & Toffel, 2008), and corporate reputation (Weiss et al., 1999). These starts from 1)
strongly disagree to 2) disagree, 3) neutral, 4) agree, and 5) strongly agree. Primary data
collected from distributing pre-designed and verified structured questionnaires among branch
managers of banks and 460 respondents responded. Stratified sampling technique was used in
data collection.
Page 166
149
After editing and rectification, only 405 questionnaires could become eligible for analysis.
Firstly, reliability analysis conducted and after meditation and arduous hit-and-trial confirmatory
factor analysis was conducted. Measurement models made confirmation of goodness and fitness
of observed variables with their respective latent variable. Descriptive statistics, P-P Plot
Histogram, inter-item correlation, tolerance level, and VIF tests conducted to verify normality,
linearity, multicollinearity, and homoscedasticity in a different context. Correlation matrix
explained the significant and positive relationship between CSR and financial performance,
innovation, corporate reputation, and stakeholder pressure.
SEM was applied to identify afore-mentioned relationships and the direct relationship indicated
that there is a significant and positive relationship between CSR and financial performance. This
finding was supported by multiple studies, as they already tested the significant and positive
relationship between these two factors (Miller, 2016; Jain et al., 2016; Ahamed et al., 2014). The
direct relationship indicated that there is a significant and positive relationship between CSR and
non-financial performance. This finding was supported by multiple studies, as they already tested
the significant and positive relationship between these two factors (Becchetti & Trovato, 2011,
Mishra & Suar, 2010; Ahmed et. al., 1998, Gil et al., 2001), but contradicts from the study of
(Vitaliano & Stella, 2006).
CSR directly influenced financial and non-financial performance. In other direct relationships,
CSR also influenced innovation and corporate reputation (Kim & You, 2013; Cegarra-Navarro et
al., 2016; Famiyeh, et al., 2016). The innovation influenced corporate reputation (Chun, 2006),
financial and non-financial performance (Miller, 1988). Corporate reputation showed no
significant influence on financial and non-financial performance.
Page 167
150
In a research analysis, simple mediations indicated that innovation played a significant mediation
role in the relationship between CSR, financial and non-financial performance. Moreover,
corporate reputation also mediated among CSR, financial and non-financial performance. In case
of sequential mediation, innovation and corporate reputation have strongly played a role as
mediating variable among CSR, financial and non-financial performance. Last but not least,
stakeholder pressure moderated and established relation of CSR, financial and non-financial
performance.
5.4 Contribution to the Knowledge
First of all, type of study was basic; therefore the prime contribution of research work is to build
the body of knowledge in context of banking sector of Pakistan. This study is conducted for
academic purpose and there is a unique relationship examined among variables. As per
knowledge of researcher, though evident found in developed countries while the impact of
corporate social responsibility through the linkage of sequential mediation on performance
examined and contributed to existing literature especially in the Pakistani context. Innovation
and corporate reputation examined as sequential mediation between CSR and performance.
Moreover, it provides a new perspective to understand the various potential determinants of
banks‟ financial and non-financial performance. This study proposed a significant contribution of
CSR related activities toward the financial and non-financial performance of the banking sector
of Pakistan. As proposed that if the banking industry improves their socially responsible
activities, it will automatically lead toward establishing trust among stakeholders and enhancing
their performance. This study is helpful in the dual aspect, to improve their socially responsible
activities and performance, and also be helpful academic purposive for research scholars.
Page 168
151
Similarly, this research study contributed to the knowledge that the impact of the CSR concept is
tested in the banking sector of Pakistan. The results proved positive and showed that socially
responsible activities are necessarily beneficial to enhance the performance of the banking
industry. Thus, it can help students of management sciences to understand the relationship
between stakeholder's related CSR activities and performance. Finally, the study has contributed
to the gaps identified in CSR literature of developing economies by (Gangi, Mustilli & Varrone,
2018; Nyeadi, Ibrahim & Sare, 2018; Choongo, 2017; Crifo et al., 2016; Lee & Jung, 2016;
Gatsi et al., 2016; Lentner, Szegedi & Tatay, 2015; Chiu, 2014; Gao, 2011; Decker & Sale,
2009; Ip, 2008; Belal, 2001). The most important contribution is to validate the stakeholder
theory, in the context of developing economy. Generally it enriches the literature based on
corporate social responsibility. In this study a new model proposed of CSR and FP relationship
which has been deduced from past studies.
5.5 Implications
First of all, the corporate managers can avail the utility of findings to strengthen their corporate
financial planning. It will assist the management of banks to formulate stakeholder‟s centric
strategies to improve their level of satisfaction. Accordingly the proposed model is pragmatic to
build sound corporate reputation which has abundant material advantages, such as low cost of
doing business, low cost of capital, and competitive edge. In the context of practical
implications, it has significance for corporate managers in the relevance of CSR strategies. The
study findings are significant to professional business practices in the corporate group,
contributing an understanding of best strategies, knowledge, and experience related to CSR and
performance. The results of the study reflect the views of managers in the corporate group about
the best strategies that company managers use to establish an effective organizational strategy to
Page 169
152
improve performance. Business managers who wish to improve corporate group performance
require information about the strategies on how effective CSR affects their financial and non-
financial performance.
For policymakers, different approaches may be adopted to encourage firms to increase CSR
investments. In some cases, policymakers can rely on firm initiatives instead of regulating or
encouraging CSR activities. This study contributes to positive social change by helping the bank
supervisors, executives, financial specialists, controllers, and government in enhancing the
release of their separate parts to the optimal allocation of assets to contending social exercises in
a way that may magnify performance and enhance the stakeholder welfare.
5.6 Limitations
1. This study was conducted on the banking sector in the identification of CSR impact of
the financial and non-financial performance. The first limitation is relevant to sample size
and population. In this study, primary data is collected from 405 respondents of Pakistani
banking respondents which could be small as compared to a total number of branches
working in Pakistan.
2. Secondly, the banking sector is taken as the targeted sector while about 34 other sectors
are also working. One and only one sector restricts the generalizability of any research
study. This study incorporated numerous aspects but it is possible that few aspects could
not include in processing due to time constraints. In the context of Pakistan, scholars are
not normally funded for research studies, so it is much difficult to consider multiple
sectors for analysis.
Page 170
153
3. The third problem is related with the analysis in which the validity of data is not tested. In
this regard, the model is developed under the assumption that all the information used is
valid and reliable, and that the information provided by respondents is accurate, honest
and precise. If such information is not accurate, it could be skewed the overall placement
of a company on the model.
4. Fourth, although, samples are chosen from top eight major banks, there are still some
banks which don't have a sample in this study. Therefore, the sample data may not fully
reflect the current status of the Pakistani banking market, which would affect the
generalizability of the results to a certain extent.
5. The study was carried out in a single country (Pakistan), it may be inappropriate to
generalize the results to employees who work in other countries. Hence, to be able to
generalize the results, the hypotheses should be tested in other contexts. The results of the
study are important enough to open the door to studies in other countries.
6. Finally, a major methodological limitation of this study is that this study was not
longitudinal, which may make it harder to detect a subtle effect. A company that invests
today in CSR initiative might not receive a benefit from the program directly, but rather
through more subtle consumer loyalty derived from the idea and they are buying from a
company that is socially conscious. Therefore, if a longitudinal data across 2 or 3 times
become suitable, and a replication study may provide more robust findings or different
results.
5.7 Delimitations:
1. In this study, (Carroll, 2004) the dimensions are considered while the stakeholder aspect
of corporate social responsibility, including employees, customers, investors, the
Page 171
154
community, suppliers, the environment, could be used as an independent factor (Mishra
& Suar, 2010).
2. In the context of stakeholder pressure, only the environmental and social aspects are
incorporated, while there could possibly be the use of institutional pressure as a
moderating factor enriches future research studies (Zhu & Sarkis, 2007).
3. The research study is based on scales developed by multiple authors, so the analysis
section considered confirmatory factor analysis as the main source, while the exploratory
factor analysis could increase the validity of future studies if new scales are developed
with respect to the nature of the study.
5.8 Recommendations and Future direction:
This study identified the relation between CSR and financial performance but it is possible to
consider the other dimensions of CSR with respect to stakeholder aspect (Mishra & Suar, 2010).
1. Future research in the field of the above-mentioned relationship of CSR and financial
performance could proceed in following directions. First, given the limitation is relevant
to sample size and population. In a future study, sample size and targeted population
could be increased with respect to a total number of branches working in Pakistan.
2. Secondly, the banking sector is taken as a single targeted sector while about 34 other
sectors are also working. So, research studies on multiple sectors could enhance the
generalizability and application.
Page 172
155
3. The third direction is related with the analysis in which the validity of data should
necessarily test. For this regard, exploratory factor analysis is the best source which will
validate the data before confirmatory factor analysis and structural model testing.
4. Fourthly, a major methodological limitation of this study could be detached with a
longitudinal study, which is necessary to detect a long-term and subtle effect (Harrison &
Freeman, 1999). Therefore, if a longitudinal data across 2 or 3 times will become
suitable, and a replication study may provide more robust findings or different results.
5. In stakeholder pressure, only two aspects like social and environmental are considered
but for generalizability other aspects could be incorporated in the analysis. There could
be possible total quality management as mediating variable in between CSR and
financial, non-financial performance.
6. Finally, there could possibly better contribution in the context of comparison of
developed and developing countries, financial and non-financial sectors, services,
merchandising and manufacturing sector with respect to the impact of corporate social
responsibility on financial and non-financial performance.
Page 173
156
References:
Abdulai Mahmoud, M., & Hinson, R. E. (2012). Market orientation, innovation and corporate
social responsibility practices in Ghana's telecommunication sector. Social Responsibility
Journal, 8(3), 327-346.
Abdullah, Z., & Abdul Aziz, Y. (2013). Institutionalizing corporate social responsibility: effects
on corporate reputation, culture, and legitimacy in Malaysia. Social Responsibility
Journal, 9(3), 344-361.
Abusharbeh, M. T., (2017). The Impact of Banking Sector Development on Economic Growth:
Empirical Analysis from Palestinian Economy, International Journal of Finance &
Economics, 6(2), 2306-2316.
Aga, G., Khan, S., Wasim, D., & Shah, A. (2012). The Impact of Corporate Social
Responsibility on The Company‟s Financial Performance A Study of Pharmaceuticals
Firms of Peshawar Pakistan. City University Research Journal, 3(01), 13-18
Agle, B. R., Mitchell, R. K., & Sonnenfeld, J. A. (1999). Who matters to Ceo‟s? An investigation
of stakeholder attributes and salience, corporate performance, and Ceo values. Academy
of management journal, 42(5), 507-525.
Aguinis, H., & Glavas, A. (2012). What we know and don‟t know about corporate social
responsibility a review and research agenda. Journal of management, 38(4), 932-968.
Ahamed, W. S. W., Almsafir, M. K., & Al-Smadi, A. W. (2014). Does corporate social
responsibility lead to improve in firm financial performance? Evidence from
malaysia. International Journal of Economics and Finance, 6(3), 126-138
Page 174
157
Ahmed, N. U., Montagno, R. V., & Firenze, R. J. (1998). Organizational performance and
environmental consciousness: an empirical study. Management Decision, 36(2), 57-62.
Alniacik, E., Alniacik, U., & Erdogmus, N. (2012). How do the dimensions of corporate
reputation affect employment intentions? Corporate Reputation Review, 15(1), 3-19.
Anderson, J. C., & Gerbing, D. W. (1988). Structural equation modeling in practice: A review
and recommended two-step approach. Psychological bulletin, 103(3), 411-423
Anser, M. K., Zhang, Z., & Kanwal, L. (2018). Moderating effect of innovation on corporate
social responsibility and firm performance in realm of sustainable
development. Corporate Social Responsibility and Environmental Management, 25(5),
799-806.
Audretsch, D. B., & Lehmann, E. E. (2004). Financing high-tech growth: the role of banks and
venture capitalists. Schmalenbach Business Review, 56(4), 340-357.
Aupperle, K. E., Carroll, A. B., & Hatfield, J. D. (1985). An empirical examination of the
relationship between corporate social responsibility and profitability. Academy of
management Journal, 28(2), 446-463.
Avram, E., & Avasilcai, S. (2014). Business performance measurement in relation to corporate
social responsibility: A conceptual model development. Procedia-Social and Behavioral
Sciences, 109(1), 1142-1146.
Barnett, M. L., & Salomon, R. M. (2012). Does it pay to be really good? Addressing the shape of
the relationship between social and financial performance. Strategic Management
Journal, 33(11), 1304-1320.
Page 175
158
Barney, J. (1991). Firm resources and sustained competitive advantage. Journal of
management, 17(1), 99-120.
Barney, J. B., & Hansen, M. H. (1994). Trustworthiness as a source of competitive
advantage. Strategic management journal, 15(S1), 175-190.
Baron, R. M., & Kenny, D. A. (1986). The moderator–mediator variable distinction in social
psychological research: Conceptual, strategic, and statistical considerations. Journal of
personality and social psychology, 51(6), 1173.
Baumgartner, R. J. (2014). Managing corporate sustainability and CSR: A conceptual framework
combining values, strategies and instruments contributing to sustainable
development. Corporate Social Responsibility and Environmental Management, 21(5),
258-271.
Baumgartner, R. J., & Ebner, D. (2010). Corporate sustainability strategies: sustainability
profiles and maturity levels. Sustainable Development, 18(2), 76-89.
Becchetti, L., & Trovato, G. (2011). Corporate social responsibility and firm efficiency: a latent
class stochastic frontier analysis. Journal of Productivity Analysis, 36(3), 231-246.
Beck, T., & Levine, R. (2004). Stock markets, banks, and growth: Panel evidence. Journal of
Banking & Finance, 28(3), 423-442.
Bektas, E., & Kaymak, T. (2009). Governance mechanisms and ownership in an emerging
market: The case of Turkish banks. Emerging Markets Finance and Trade, 45(6), 20-32.
Belal, R. A. (2001). A study of corporate social disclosures in Bangladesh. Managerial Auditing
Journal, 16(5), 274-289.
Page 176
159
Berman, S. L., Wicks, A. C., Kotha, S., & Jones, T. M. (1999). Does stakeholder orientation
matter? The relationship between stakeholder management models and firm financial
performance. Academy of Management journal, 42(5), 488-506.
Black, B. S., & Khanna, V. S. (2007). Can corporate governance reforms increase firm market
values? Event study evidence from India. Journal of Empirical Legal Studies, 4(4), 749-
796.
Blakely, E. J., & Aparicio, A. (1990). Balancing social and economic objectives: the case of
California's community development corporations. Community Development, 21(1), 115-
128.
Bocquet, R., Le Bas, C., Mothe, C., & Poussing, N. (2013). Are firms with different CSR
profiles equally innovative? Empirical analysis with survey data. European Management
Journal, 31(6), 642-654.
Boons, F., Montalvo, C., Quist, J., & Wagner, M. (2013). Sustainable innovation, business
models and economic performance: an overview. Journal of Cleaner Production, 45(1),
1-8.
Boulding, W., & Kirmani, A. (1993). A consumer-side experimental examination of signaling
theory: do consumers perceive warranties as signals of quality?. Journal of Consumer
Research, 20(1), 111-123.
Bowen and Howard, (1953), Social Responsibilities of the Businessman. New York: Harper and
Row
Page 177
160
Brammer, S. J., & Pavelin, S. (2006). Corporate reputation and social performance: The
importance of fit. Journal of Management Studies, 43(3), 435-455.
Branco, M. C., & Rodrigues, L. L. (2008). Factors influencing social responsibility disclosure by
Portuguese companies. Journal of business Ethics, 83(4), 685-701.
Brettel, M., & Cleven, N. J. (2011). Innovation culture, collaboration with external partners and
NPD performance. Creativity and Innovation Management, 20(4), 253-272.
British Council, UNDP, CII and Pricewaterhouse Coopers: (2002), „Corporate Social
Responsibility Survey‟, A Survey by British Council, UNDP, CII and Pricewaterhouse
Coopers, India.
Brown, T. J., & Dacin, P. A. (1997). The company and the product: Corporate associations and
consumer product responses. The Journal of Marketing, 61(1), 68-84.
Browne, M. W., & Cudeck, R. (1989). Single sample cross-validation indices for covariance
structures. Multivariate Behavioral Research, 24(4), 445-455.
Brugmann, J. and C. K. Prahalad: 2007, „Co-Creating Business‟s New Social Compact‟,
Harvard Business Review 85(2), 80–90.
Bryman, A., & Bell, E. (2015). Business research methods. Oxford University Press, USA.
Buysse, K., & Verbeke, A. (2003). Proactive environmental strategies: A stakeholder
management perspective. Strategic management journal, 24(5), 453-470.
Byrne, B. M. (1994). Structural equation modeling with EQS and EQS/Windows: Basic
concepts, applications, and programming. Sage.
Page 178
161
Cabral, L. M. B. (2012). Living up to expectations: Corporate reputation and sustainable
competitive advantage. Working papers. New York University, Leonard N. Stern School
of Business, Department of Economics.
Caprio Jr, G., & Levine, R. (1994). Reforming finance in transitional socialist economies. The
World Bank Research Observer, 9(1), 1-24.
Carroll, A. B. (1979). A three-dimensional conceptual model of corporate performance. Academy
of management review, 4(4), 497-505.
Carroll, A. B. (1991). The pyramid of corporate social responsibility: Toward the moral
management of organizational stakeholders. Business horizons, 34(4), 39-48.
Carroll, A. B. (1999). Corporate social responsibility evolution of a definitional
construct. Business & society, 38(3), 268-295.
Carroll, A. B. (2004). Managing ethically with global stakeholders: A present and future
challenge. The Academy of Management Executive, 18(2), 114-120.
Carroll, A. B., & Shabana, K. M. (2010). The business case for corporate social responsibility: A
review of concepts, research and practice. International journal of management
reviews, 12(1), 85-105.
Cegarra-Navarro, J. G., Reverte, C., Gómez-Melero, E., & Wensley, A. K. (2016). Linking
social and economic responsibilities with financial performance: The role of
innovation. European Management Journal, 34(5), 530-539.
Chang, Y. K., Oh, W. Y., & Messersmith, J. G. (2013). Translating corporate social performance
into financial performance: Exploring the moderating role of high-performance work
Page 179
162
practices. The International Journal of Human Resource Management, 24(19), 3738-
3756.
Chapple, W., & Moon, J. (2005). Corporate social responsibility (CSR) in asia a seven-country
study of CSR web site reporting. Business & society, 44(4), 415-441.
Chiu, T. K. (2014). Putting responsible finance to work for Citi microfinance. Journal of
business ethics, 119(2), 219-234.
Choongo, P. (2017). A longitudinal study of the impact of corporate social responsibility on firm
performance in SMEs in Zambia. Sustainability, 9(8), 1-19.
Chun, R. (2006). Innovation and reputation: An ethical character perspective. Creativity and
Innovation Management, 15(1), 63-73.
Clarkson, M. E. (1995). A stakeholder framework for analyzing and evaluating corporate social
performance. Academy of management review, 20(1), 92-117.
Coenders, G., & Saez, M. (2000). Collinearity, heteroscedasticity and outlier diagnostics in
regression. Do they always offer what they claim. New Approaches in Applied
Statistics, 16, 79-94.
Coombes, P., & Watson, M. (2000). Three surveys on corporate governance. McKinsey
Quarterly, (4; SPI), 74-77.
Cooper, D. R., Schindler, P. S., & Sun, J. (2003). Business research methods. (Vol. 9). New
York: McGraw-Hill Irwin.
Page 180
163
Crane, A., & Matten, D. (2007). Business ethics: Managing corporate citizenship and
sustainability in the age of globalization. Oxford University Press, USA.
Creswell, J. W. (2002). Educational research: Planning, conducting, and evaluating
quantitative (pp. 146-166). Upper Saddle River, NJ: Prentice Hall.
Crifo, P., Diaye, M. A., & Pekovic, S. (2016). CSR related management practices and firm
performance: An empirical analysis of the quantity–quality trade-off on French
data. International Journal of Production Economics, 171, 405-416.
Crotty, M. (1998). The foundations of social research: Meaning and perspective in the research
process. Sage.
Crowther, D., & Aras, G. (2008). Corporate social responsibility. Bookboon.
Dahlsrud, A. (2008). How corporate social responsibility is defined: an analysis of 37
definitions. Corporate social responsibility and environmental management, 15(1), 1-13.
Dahya, J., & McConnell, J. J. (2007). Board composition, corporate performance, and the
Cadbury committee recommendation. Journal of Financial and Quantitative
Analysis, 42(03), 535-564.
Davidson III, W. N., & Worrel, D. L. (1988). The impact of announcements of corporate
illegalities on shareholder returns. Academy of management journal, 31(1), 195-200.
Davis, K. (1960). Can business afford to ignore social responsibilities?. California management
review, 2(3), 70-76.
Page 181
164
Davis, K. (1973). The case for and against business assumption of social
responsibilities. Academy of Management journal, 16(2), 312-322.
De Quevedo-Puente, E., de la Fuente-Sabaté, J. M., & Delgado-García, J. B. (2007). Corporate
social performance and corporate reputation: Two interwoven perspectives. Corporate
Reputation Review, 10(1), 60-72.
Decker, S., & Sale, C. (2009). An analysis of corporate social responsibility, trust and reputation
in the banking profession. In Professionals' Perspectives of Corporate Social
Responsibility (pp. 135-156). Springer, Berlin, Heidelberg.
Deephouse, D. L., Li, L., & Newburry, W. (2009). Institutional and national culture effects on
corporate reputation. In Academy of Management Proceedings, 2009(1), 1-6
Delmas, M. A., & Toffel, M. W. (2008). Organizational responses to environmental demands:
Opening the black box. Strategic Management Journal, 29(10), 1027-1055.
DiSegni, D. M., Huly, M., & Akron, S. (2015). Corporate social responsibility, environmental
leadership and financial performance. Social Responsibility Journal, 11(1), 131-148.
Doane, D., & Abasta-Vilaplana, N. (2005). The myth of CSR. Stanford Social Innovation
Review, 3(3), 22-29.
Dolven, B. (2003). Foreign investors find that China's legal system resolves few disputes. Wall
Street Journal.
Donaldson, T., & Dunfee, T. W. (1995). Integrative social contracts theory: A communitarian
conception of economic ethics. Economics & Philosophy, 11(1), 85-112.
Page 182
165
Donaldson, T., and L. Preston. 1995. The Stakeholder Theory of the Corporation: Concepts,
Evidence, and Implications. Academy of Management Review, 20(1), 65–91.
Douglas, A., Doris, J., & Johnson, B. (2004). Corporate social reporting in Irish financial
institutions. The TQM Magazine, 16(6), 387-395.
Drucker, P. F. (1942). The future of industrial man. New York: The John Day Company.
Drucker, P. F. (1946). Concept of the Corporation. Transaction Publishers. New York: The John
Day Company.
Du, S., Bhattacharya, C. B., & Sen, S. (2011). Corporate social responsibility and competitive
advantage: Overcoming the trust barrier. Management Science, 57(9), 1528-1545.
Duncan, E., & Elliott, G. (2004). Efficiency, customer service and financial performance among
Australian financial institutions. International Journal of bank marketing, 22(5), 319-
342.
Dunn, D. and K. Yamashita: 2003, „A Changed World, Micro capitalism and the Mega-
Corporation‟, Harvard Business Review 81(8), 46–54.
Dyer, J. H., & Chu, W. (2003). The role of trustworthiness in reducing transaction costs and
improving performance: Empirical evidence from the United States, Japan, and
Korea. Organization science, 14(1), 57-68.
Eberl, M., & Schwaiger, M. (2005). Corporate reputation: disentangling the effects on financial
performance. European Journal of Marketing, 39(7/8), 838-854.
Page 183
166
Eesley, C., & Lenox, M. J. (2006). Firm responses to secondary stakeholder action. Strategic
Management Journal, 27(8), 765-781.
Ekmekcioglu, E. (2012). The Relationship between Financial Development and Economic
Growth in Emerging Markets. Trakya University Journal of Social Science, 14(2), 147-
156.
Elouidani, A. & Zoubir, F. (2015). “Corporate social responsibility and financial performance”,
African Journal of Accounting, Auditing and Finance, 4(1), 74-85.
Elyor, S. (2009). Factors affecting the performance of foreign banks in Malaysia (Doctoral
dissertation, Universiti Utara Malaysia).
Emshoff, J. R., & Freeman, R. E. (1978). Stakeholder management. Wharton Applied Research
Center.
Epstein, E. M. (1989). Business ethics, corporate good citizenship and the corporate social policy
process: A view from the United States. Journal of Business Ethics, 8(8), 583-595.
Evans, M. E., Hodder, L., & Hopkins, P. E. (2014). The predictive ability of fair values for future
financial performance of commercial banks and the relation of predictive ability to banks'
share prices. Contemporary Accounting Research, 31(1), 13-44.
Famiyeh, S., Kwarteng, A., & Dadzie, S. A. (2016). Corporate social responsibility and
reputation: some empirical perspectives. Journal of Global Responsibility, 7(2), 258-274.
Fernando, M. (2007). Corporate Social Responsibility in the Wake of the Asian Tsunami:: A
Comparative Case Study of Two Sri Lankan Companies. European Management
Journal, 25(1), 1-10.
Page 184
167
Flatt, S. J., & Kowalczyk, S. J. (2011). Corporate reputation persistence and its diminishing
returns. International Journal of Business and Social Science, 2(19), 1-10
Fombrun, C. J., & Van Riel, C. B. (2004). Fame & fortune: How successful companies build
winning reputations. FT Press.
Fombrun, C., & Shanley, M. (1990). What's in a name? Reputation building and corporate
strategy. Academy of management Journal, 33(2), 233-258.
Fornell, C., Mithas, S., Morgeson III, F. V., & Krishnan, M. S. (2006). Customer satisfaction and
stock prices: High returns, low risk. Journal of marketing, 70(1), 3-14.
Fowler, K. L., & Schmidt, D. R. (1988). Tender offers, acquisitions, and subsequent performance
in manufacturing firms. Academy of Management Journal, 31(4), 962-974.
Freeman, R. B. (1997). Working for nothing: The supply of volunteer labor. Journal of Labor
Economics, 15(1, Part 2), S140-S166.
Freeman, R. E. (1983). Strategic management: A stakeholder approach. Advances in strategic
management, 1(1), 31-60.
Freeman, R. E., Harrison, J. S., Wicks, A. C., Parmar, B. L., & De Colle, S. (2010). Stakeholder
theory: The state of the art. Cambridge University Press.
Friedman, M. (1970). The social responsibility of business is to increase its profits. New York,
122-124.
Galbreath, J., & Shum, P. (2012). Do customer satisfaction and reputation mediate the CSR–FP
link? Evidence from Australia. Australian Journal of Management, 37(2), 211-229.
Page 185
168
Gangi, F., Mustilli, M., & Varrone, N. (2018). The impact of corporate social responsibility
(CSR) knowledge on corporate financial performance: evidence from the European
banking industry. Journal of Knowledge Management.
Gao, Y. (2011). CSR in an emerging country: a content analysis of CSR reports of listed
companies. Baltic Journal of Management, 6(2), 263-291.
Gardberg, N. A. (2006). Reputatie, reputation, reputation, reputazione, ruf: A cross-cultural
qualitative analysis of construct and instrument equivalence. Corporate Reputation
Review, 9(1), 39-61.
Garriga, E., & Mele, D. (2004). Corporate social responsibility theories: Mapping the
territory. Journal of business ethics, 53(1), 51-71.
Gatsi, J. G., Anipa, C. A. A., Gadzo, S. G., & Ameyibor, J. (2016). Corporate Social
Responsibility, Risk Factor and Financial Performance of Listed Firms in Ghana. Journal
of Applied Finance and Banking, 6(2), 21-38.
Gatzert, N. (2015). The impact of corporate reputation and reputation damaging events on
financial performance: Empirical evidence from the literature. European Management
Journal, 33(6), 485-499.
Gaynor, G. (2002). Innovation by design: what it takes to keep your company on the cutting
edge. Amacom.
Gbadamosi, W. A. (2016). Corporate Social Responsibility and Financial Performance of Banks
in the United States. Doctoral dissertation, Walden University, USA
Page 186
169
Gil, M. A., Jiménez, J. B., & Lorente, J. C. (2001). An analysis of environmental management,
organizational context and performance of Spanish hotels. Omega, 29(6), 457-471.
Gilbert, R. A., & Wheelock, D. C. (2007). Measuring commercial bank profitability: proceed
with caution. Review, Federal Reserve Bank of St. Louis, 89(6), 515-532.
Gildea, R. L. (1994). Consumer survey confirms corporate social action affects buy. Public
Relations Quarterly, 39(4), 20-22
Gomez, L. (2014). The Importance of University Social Responsibility in Hispanic America: A
Responsible Trend in Developing Countries. Corporate Social Responsibility and
Sustainability: Emerging Trends in Developing Economies (Critical Studies on
Corporate Responsibility, Governance and Sustainability, Volume 8) Emerald Group
Publishing Limited, 8, 241-268.
Gonzalez-Ramos, M. I., Donate, M. J., & Guadamillas, F. (2014). Technological Posture and
Corporate Social Responsibility: Effects on Innovation Performance. Environmental
Engineering & Management Journal (EEMJ), 13(10), 2497-2505.
Govindarajan, V. (1984). Appropriateness of accounting data in performance evaluation: an
empirical examination of environmental uncertainty as an intervening
variable. Accounting, organizations and society, 9(2), 125-135.
Graafland, J. J. (2002). Modeling the trade-off between profits and principles. De
Economist, 150(2), 129-154.
Greenwood, M. (2001). The importance of stakeholders according to business leaders. Business
and Society Review, 106(1), 29-49.
Page 187
170
Griffin, J. J., & Mahon, J. F. (1997). The corporate social performance and corporate financial
performance debate: Twenty-five years of incomparable research. Business &
society, 36(1), 5-31.
Gruca, T. S., & Rego, L. L. (2005). Customer satisfaction, cash flow, and shareholder
value. Journal of Marketing, 69(3), 1-130.
Gupta, S. (2002). Strategic dimensions of corporate social responsibility as sources of
competitive advantage via differentiation. Unpublished Doctoral Dissertation, Temple
University, USA.
Hair, J. F., Black, W. C., Babin, B. J., Anderson, R. E., & Tatham, R. L. (1998). Multivariate
data analysis . Uppersaddle River. Multivariate Data Analysis (5th Ed) Upper Saddle
River.
Haleem, F., Farooq, S., Boer, H., & Gimenez, C. (2015). The moderating role of stakeholder
pressure in the relationship between CSR practices and financial performance in a
globalizing world. In 22nd International EurOMA Conference.
Handelman, J. M., & Arnold, S. J. (1999). The role of marketing actions with a social dimension:
Appeals to the institutional environment. The Journal of Marketing, 63(3), 33-48.
Heffernan, S. A., & Fu, X. (2010). Determinants of financial performance in Chinese
banking. Applied Financial Economics, 20(20), 1585-1600.
Heikkurinen, P., & Bonnedahl, K. J. (2013). Corporate responsibility for sustainable
development: a review and conceptual comparison of market-and stakeholder-oriented
strategies. Journal of Cleaner Production, 43(1), 191-198.
Page 188
171
Helm, S. (2007). The role of corporate reputation in determining investor satisfaction and
loyalty. Corporate Reputation Review, 10(1), 22-37.
Henriques, I., & Sadorsky, P. (1999). The relationship between environmental commitment and
managerial perceptions of stakeholder importance. Academy of management
Journal, 42(1), 87-99.
Herremans, I. M., Akathaporn, P., & McInnes, M. (1993). An investigation of corporate social
responsibility reputation and economic performance. Accounting, organizations and
society, 18(7-8), 587-604.
Herwartz, H., & Walle, Y. M. (2014). Determinants of the link between financial and economic
development: Evidence from a functional coefficient model. Economic Modelling, 37,
417-427.
Hidiroglou, M. A. (1994). Sampling and estimation for establishment surveys: stumbling blocks
and progress. In Proceedings of the Section on Survey Research Methods, American
Statistical Association (pp. 153-162).
Hoffman, A. J., & Ventresca, M. J. (1999). The institutional framing of policy debates
economics versus the environment. American Behavioral Scientist, 42(8), 1368-1392.
Holme, L., & Watts, R. (2000). Making Good Business Sense” The World Business Council for
Sustainable Development. Geneva: World Business Council for Sustainable
Development. http://www. wbcsd.org/web/publications/csr2000.pdf.
Hopkins, M. (2016). The planetary bargain: corporate social responsibility comes of age.
Springer.
Page 189
172
Hoque, Z. (2004). A contingency model of the association between strategy, environmental
uncertainty and performance measurement: impact on organizational
performance. International Business Review, 13(4), 485-502.
Hoyle, R. H. (1995). Structural equation modeling: Concepts, issues, and applications. Sage.
Hsueh, S. J., Hu, Y. H., & Tu, C. H. (2013). Economic growth and financial development in
Asian countries: a bootstrap panel Granger causality analysis. Economic Modelling, 32,
294-301.
Hu, V. I., & Scholtens, B. (2014). Corporate social responsibility policies of commercial banks
in developing countries. Sustainable Development, 22(4), 276-288.
Hung Chen, C. (2011). The major components of corporate social responsibility. Journal of
global responsibility, 2(1), 85-99.
Ip, P. K. (2008). Corporate social responsibility and crony capitalism in Taiwan. Journal of
Business Ethics, 79(1-2), 167-177.
Iqbal, N., Ahmad, N., & Kanwal, M. (2013). Impact of Corporate Social Responsibility on
Profitability of Islamic and Conventional Financial Institutions. Applied mathematics in
Engineering, Management and Technology, 1(2), 26-37.
Iqbal, N., Ahmad, N., Basheer, N. A., & Nadeem, M. (2012). Impact of corporate social
responsibility on financial performance of corporations: Evidence from
Pakistan. International journal of learning and development, 2(6), 107-118.
Page 190
173
Jain, P., Vyas, V., & Chalasani, D. P. S. (2016). Corporate social responsibility and financial
performance in SMEs: A structural equation modeling approach. Global Business
Review, 17(3), 630-653.
Jamali, D. (2008). A stakeholder approach to corporate social responsibility: A fresh perspective
into theory and practice. Journal of business ethics, 82(1), 213-231.
Jamali, D., & Mirshak, R. (2007). Corporate social responsibility (CSR): Theory and practice in
a developing country context. Journal of business ethics, 72(3), 243-262.
Jan, S., & Baloch, Q. B. (2011). Corporate social responsibility in Pakistan. Interdiscip J
Contemp Res Bus, 3(1), 1309-1332.
Javed, M., Saeed, R., Lodhi, R. N., & Malik, Q. U. Z. (2013). The Relationship between
Corporate Social Responsibility and Firm Financial Performance: A Case of
Pakistan. Journal of Basic and Applied Scientific Research, 3(11), 34-45.
Johnson, B., & Christensen, L. (2008). Educational research: Quantitative, qualitative, and
mixed approaches. Sage.
Johnson, R. A., & Greening, D. W. (1999). The effects of corporate governance and institutional
ownership types on corporate social performance. Academy of management
journal, 42(5), 564-576.
Kakakhel, S. J., Ilyas, M., Iqbal, J., & Afeef, M. (2015). Impact of Corporate Social
Responsibility on Financial Performance: Evidence from Pakistan's Cement
Industry. Abasyn University Journal of Social Sciences, 8(2), 392-404.
Page 191
174
Kamau, A. W. (2009). Efficiency in the banking sector: An empirical investigation of
commercial banks in Kenya. Published PhD Thesis, University of Nairobi.
Ketikidis, P. H., Hayes, O. P., Lazuras, L., Gunasekaran, A., & Koh, S. L. (2013). Environmental
practices and performance and their relationships among Kosovo construction
companies: a framework for analysis in transition economies. International Journal of
Services and Operations Management, 14(1), 115-130.
Khan, M. K., Nouman, M., TENG, J. Z., Khan, M. I., & Jadoon, A. U. (2017). Determinants of
financial performance of financial sectors (An assessment through economic value
added). European Academic Research, 5(7), 3291-3329
Kilcullen, M., & Ohles Kooistra, J. (1999). At least do no harm: sources on the changing role of
business ethics and corporate social responsibility. Reference Services Review, 27(2),
158-178.
Kilic, M., Kuzey, C., & Uyar, A. (2015). The impact of ownership and board structure on
Corporate Social Responsibility (CSR) reporting in the Turkish banking
industry. Corporate Governance, 15(3), 357-374.
Page 192
175
Kim, P., & You, J. (2013). Strategic CSR through Innovation and Top Management Team
Decision Making: Evidence from Eco-Friendly Automobile Industry Case
Analyze. Journal of Advanced Management Science, 1(4).
Kiran, S., Kakakhel, J. S., & Saheen, F. (2015). Corporate Social Responsibility and Firm
Profitability: A Case of Oil and Gas Sector of Pakistan. City University Research
Journal, 5(1), 110-119.
Klassen, R. D., & McLaughlin, C. P. (1996). The impact of environmental management on firm
performance. Management science, 42(8), 1199-1214.
Klewitz, J., & Hansen, E. G. (2014). Sustainability-oriented innovation of SMEs: a systematic
review. Journal of Cleaner Production, 65, 57-75.
Knox, S., & Maklan, S. (2004). Corporate Social Responsibility:: Moving Beyond Investment
Towards Measuring Outcomes. European Management Journal, 22(5), 508-516.
Kotha, S., Rajgopal, S., & Rindova, V. (2001). Reputation building and performance: An
empirical analysis of the top-50 pure internet firms. European Management
Journal, 19(6), 571-586.
Kotha, S., Rindova, V. P., & Rothaermel, F. T. (2001). Assets and actions: Firm-specific factors
in the internationalization of US Internet firms. Journal of International Business
Studies, 32(4), 769-791.
Kotler, P., & Armstrong, G. (2008). Principles of Marketing, Pearson Prentice Hall.
Page 193
176
Koys, D. J. (2001). The effects of employee satisfaction, organizational citizenship behavior, and
turnover on organizational effectiveness: A unit‐level, longitudinal study. Personnel
psychology, 54(1), 101-114.
Lantos, G. P. (2001). The boundaries of strategic corporate social responsibility. Journal of
consumer marketing, 18(7), 595-632.
Lauesen L.M (2016). "Stakeholder Dissonance: Corporate Social Responsibility versus
Regulation – A Study of a Trust-Recovery Process" In Accountability and Social
Responsibility: International Perspectives, 9(1), 169-203.
Lee, H., & Choi, B. (2003). Knowledge management enablers, processes, and organizational
performance: An integrative view and empirical examination. Journal of management
information systems, 20(1), 179-228.
Lee, M. D. P. (2008). A review of the theories of corporate social responsibility: Its evolutionary
path and the road ahead. International journal of management reviews, 10(1), 53-73.
Lee, S., & Jung, H. (2016). The effects of corporate social responsibility on profitability: The
moderating roles of differentiation and outside investment. Management Decision, 54(6),
1383-1406.
Leenders, M. A., & Wierenga, B. (2002). The effectiveness of different mechanisms for
integrating marketing and R&D. Journal of product innovation management, 19(4), 305-
317.
Lentner, C., Szegedi, K., & Tatay, T. (2015). Corporate social responsibility in the banking
sector. Pénzügyi Szemle/Public Finance Quarterly, 60(1), 95-103.
Page 194
177
Lin, L., & Piesse, J. (2004). Identification of corporate distress in UK industrials: a conditional
probability analysis approach. Applied Financial Economics, 14(2), 73-82.
Lioui, A., & Sharma, Z. (2012). Environmental corporate social responsibility and financial
performance: Disentangling direct and indirect effects. Ecological Economics, 78, 100-
111.
Lo, S. F. (2010). Performance evaluation for sustainable business: a profitability and
marketability framework. Corporate social responsibility and environmental
management, 17(6), 311-319.
Luthans, F., Hodgetts, R. M., & Thompson, K. R. (1984). Social issues in business: Strategic and
public policy perspectives. Doctoral Dissertation.
MacCallum, R. C., Browne, M. W., & Sugawara, H. M. (1996). Power analysis and
determination of sample size for covariance structure modeling. Psychological
methods, 1(2), 130.
Maden, C., Arıkan, E., Telci, E. E., & Kantur, D. (2012). Linking corporate social responsibility
to corporate reputation: a study on understanding behavioral consequences. Procedia-
Social and Behavioral Sciences, 58, 655-664.
Madorran, C., & Garcia, T. (2016). Corporate social responsibility and financial performance:
the Spanish case. Journal of Business Administration, 56(1), 20-28.
Maignan, I., & Ferrell, O. C. (2000). Measuring corporate citizenship in two countries: The case
of the United States and France. Journal of Business Ethics, 23(3), 283-297.
Page 195
178
Makni, R., Francoeur, C., & Bellavance, F. (2009). Causality between corporate social
performance and financial performance: Evidence from Canadian firms. Journal of
Business Ethics, 89(3), 409-422.
Malik, M. S., & Nadeem, M. (2014). Impact of corporate social responsibility on the financial
performance of banks in Pakistan. International Letters of Social and Humanistic
Sciences, 10(1), 9-19.
Manu, F. A. (1992). Innovation orientation, environment and performance: A comparison of US
and European markets. Journal of International Business Studies, 23(2), 333-359.
Margolis, J. D., & Walsh, J. P. (2003). Misery loves companies: Rethinking social initiatives by
business. Administrative science quarterly, 48(2), 268-305.
Marshall, D., & McCarthy, L. (2013). Impact of customer sustainability pressure on the
relationship between social supply chain sustainability practices and outcomes. In 24th
POMS Annual Conference, Denver, May (pp. 3-6).
Martinez-Conesa, I., Soto-Acosta, P., & Palacios-Manzano, M. (2017). Corporate social
responsibility and its effect on innovation and firm performance: An empirical research in
SMEs. Journal of Cleaner Production, 142, 2374-2383.
Martins, E. C., & Terblanche, F. (2003). Building organizational culture that stimulates creativity
and innovation. European journal of innovation management, 6(1), 64-74.
Matos, S., & Silvestre, B. S. (2013). Managing stakeholder relations when developing
sustainable business models: the case of the Brazilian energy sector. Journal of Cleaner
Production, 45, 61-73.
Page 196
179
McGuire, J. W. (1963). Business and society. McGraw-hill.
McVea, J. F., & Freeman, R. E. (2005). A Names-and-faces approach to stakeholder
management how focusing on stakeholders as individuals can bring ethics and
entrepreneurial strategy together. Journal of management inquiry, 14(1), 57-69.
McWilliams, A., Siegel, D. S., & Wright, P. M. (2006). Corporate social responsibility: Strategic
implications. Journal of management studies, 43(1), 1-18.
McWILLIANS, A., & Siegel, D. (2000). Corporate social responsibility and financial
performance: correlation or misspecification. Strategic Management Journal, 21(5), 603-
609.
Michalisin, M. D. (2001). Validity of annual report assertions about innovativeness: an empirical
investigation. Journal of Business Research, 53(3), 151-161.
Miller, D. P. (2016). The Relationship between Corporate Social Performance and Financial
Performance. “A Doctoral dissertation submitted to University”.
Mishra, S., & Suar, D. (2010). Does corporate social responsibility influence firm performance
of Indian companies?. Journal of Business Ethics, 95(4), 571-601.
Mohanty, B. K. (2006). Role of Loan classification Norms and legal measures in NPA
management of banks. The Management Accountant, 41(1), 7-12.
Moir, L. (2001). What do we mean by corporate social responsibility?. Corporate Governance:
The international journal of business in society, 1(2), 16-22.
Page 197
180
Moisescu, O. I. (2015). Development and Validation of a Measurement Scale for Customer‟s
perceptions Of Corporate Social Responsibility. Management & Marketing
Journal, 13(2), 311-332
Montiel, I., & Delgado-Ceballos, J. (2014). Defining and measuring corporate sustainability are
we there yet?. Organization & Environment, 27(2), 113-139.
Musamali, R. A., Nyamongo, E. M., & Moyi, E. D. (2014). The relationship between financial
development and economic growth in Africa. Research in Applied Economics, 6(2), 190-
208.
Muyambiri, B., & Odhiambo, N. M. (2018). The causal relationship between financial
development and investment: A review of related empirical literature. Comparative
Economic Research, 21(2), 119-136.
Nakamura, E. (2015). The bidirectional CSR investment–economic performance
relationship. Journal of Global Responsibility, 6(1), 128-144.
Nelson, J. (1996). Business as partners in development. In Prince of Wales Business Leaders
Forum.
Nollet, J., Filis, G., & Mitrokostas, E. (2016). Corporate social responsibility and financial
performance: A non-linear and disaggregated approach. Economic Modeling, 52, 400-
407.
Nyeadi, J. D., Ibrahim, M., & Sare, Y. A., (2018) "Corporate social responsibility and financial
performance nexus: Empirical evidence from South African listed firms", Journal of
Global Responsibility, 9(3), 301-328.
Page 198
181
Okoye, A. (2009). Theorising corporate social responsibility as an essentially contested concept:
is a definition necessary?. Journal of Business Ethics, 89(4), 613-627.
O'Leary-Kelly, S. W., & Vokurka, R. J. (1998). The empirical assessment of construct
validity. Journal of operations management, 16(4), 387-405.
Orlitzky, M. (2005). Payoffs to social and environmental performance. The Journal of
Investing, 14(3), 48-52.
Owen, C. L., & Scherer, R. F. (1993). Social responsibility and market share. Review of
business, 15(1), 11-16
Padgett, R. C., & Galan, J. I. (2010). The effect of R&D intensity on corporate social
responsibility. Journal of Business Ethics, 93(3), 407-418.
Padgett, R. C., & Moura-Leite, R. C. (2012). Innovation with high social benefits and corporate
financial performance. Journal of technology management & innovation, 7(4), 59-69.
Peloza, J., & Shang, J. (2011). How can corporate social responsibility activities create value for
stakeholders? A systematic review. Journal of the academy of Marketing Science, 39(1),
117-135.
Pirsch, J., Gupta, S., & Grau, S. L. (2007). A framework for understanding corporate social
responsibility programs as a continuum: An exploratory study. Journal of business
ethics, 70(2), 125-140.
Poolthong, Y., & Mandhachitara, R. (2009). Customer expectations of CSR, perceived service
quality and brand effect in Thai retail banking. International Journal of Bank
Marketing, 27(6), 408-427.
Page 199
182
Porter, M. E., & Kramer, M. R. (2002). The competitive advantage of corporate
philanthropy. Harvard business review, 80(12), 56-68.
Porter, M. E., & Kramer, M. R. (2007). Strategy and society: The link between competitive
advantage and corporate social responsibility. Harvard Business Review, 85(6), 136-137.
Prado-Lorenzo, J. M., Gallego-Álvarez, I., García-Sánchez, I. M., & Rodríguez-Domínguez, L.
(2008). Social responsibility in Spain: Practices and motivations in firms. Management
Decision, 46(8), 1247-1271.
Preacher, K. J., & Hayes, A. F. (2004). SPSS and SAS procedures for estimating indirect effects
in simple mediation models. Behavior research methods, 36(4), 717-731.
Rasoulzadeh, H., Hosseinipour, S. J., Yusof, N. A. M., Soltani, M., & Hashemi, S. (2013). Effect
of dimensions of corporate social responsibility on organization
performance. International Journal of Initiative Ideasa (IJII), 2232-1942.
Rathnasiri, H. C. (2003). Corporate social responsibility practices of Sri Lankan private sector:
An exploratory study. Sri Lankan Journal of Management, 8(3), 195-228.
Reddy, G. S. (2004). Management of Non-Performing Assets (NPA‟s) in Public Sector
Banks. Journal of Banking and Finance, 17(3), 17-21.
Rexhepi, G., Kurtishi, S., & Bexheti, G. (2013). Corporate social responsibility (CSR) and
innovation–the drivers of business growth?. Procedia-Social and Behavioral
Sciences, 75, 532-541.
Page 200
183
Rindova, V. P., Williamson, I. O., Petkova, A. P., & Sever, J. M. (2005). Being good or being
known: An empirical examination of the dimensions, antecedents, and consequences of
organizational reputation. Academy of Management Journal, 48(6), 1033-1049.
Riordan, C. M., Gatewood, R. D., & Bill, J. B. (1997). Corporate image: Employee reactions and
implications for managing corporate social performance. Journal of Business
Ethics, 16(4), 401-412.
Roberts, P. W., & Dowling, G. R. (2002). Corporate reputation and sustained superior financial
performance. Strategic management journal, 23(12), 1077-1093.
Robin, I., Salim, R., & Bloch, H. (2018). Financial performance of commercial banks in the post-
reform era: Further evidence from Bangladesh. Economic Analysis and Policy, 58, 43-54.
Robson, C., & McCartan, K. (2016). Real world research. John Wiley & Sons. Retrieved from
http://books.google.com.
Rodriguez-Fernandez, M. (2016). Social responsibility and financial performance: The role of
good corporate governance. BRQ Business Research Quarterly, 19(2), 137-151.
Rovny, J. (2009). Introduction to Applied Quantitative Methods.
Rowley, T., & Berman, S. (2000). A brand new brand of corporate social performance. Business
& society, 39(4), 397-418.
Russo, M. V., & Fouts, P. A. (1997). A resource-based perspective on corporate environmental
performance and profitability. Academy of management Journal, 40(3), 534-559.
Page 201
184
Saeidi, S. P., Sofian, S., Saeidi, P., Saeidi, S. P., & Saaeidi, S. A. (2015). How does corporate
social responsibility contribute to firm financial performance? The mediating role of
competitive advantage, reputation, and customer satisfaction. Journal of Business
Research, 68(2), 341-350.
Saunders, M. N. (2011). Research methods for business students, 5/e. Pearson Education India.
Schaltegger, S. (2011). Sustainability as a driver for corporate economic success: Consequences
for the development of sustainability management control. Society and Economy, 33(1),
15-28.
Scholtens, B. (2009). Corporate social responsibility in the international banking
industry. Journal of Business Ethics, 86(2), 159-175.
Schumacker, R. E., & Lomax, R. G. (2004). A beginner's guide to structural equation modeling.
Psychology Press.
Schumpeter, J. A. (2013). Capitalism, socialism and democracy. Routledge.
Schwaiger, M. (2004). Components and parameters of corporate reputation. Schmalenbach
business review, 56(1), 46-71.
Schwartz, M. S., & Carroll, A. B. (2003). Corporate social responsibility: A three-domain
approach. Business ethics quarterly, 13(04), 503-530.
Seiford, L. M., & Zhu, J. (1999). Profitability and marketability of the top 55 US commercial
banks. Management science, 45(9), 1270-1288.
Page 202
185
Sekaran, U. (2006). Research methods for business: A skill building approach. John Wiley &
Sons.
Servaes, H., & Tamayo, A. (2013). The impact of corporate social responsibility on firm value:
The role of customer awareness. Management Science, 59(5), 1045-1061.
Shamsie, J. (2003). The context of dominance: an industry‐driven framework for exploiting
reputation. Strategic Management Journal, 24(3), 199-215.
Shapiro, C. (1983). Premiums for high quality products as returns to reputations. The quarterly
journal of economics, 98(4), 659-679.
Shevlin, M., & Miles, J. N. (1998). Effects of sample size, model specification and factor
loadings on the GFI in confirmatory factor analysis. Personality and Individual
Differences, 25(1), 85-90.
Siltaoja, M. E. (2006). Value priorities as combining core factors between CSR and reputation–a
qualitative study. Journal of Business Ethics, 68(1), 91-111.
Skare, M., & Golja, T. (2014). The impact of government CSR supporting policies on economic
growth. Journal of policy modeling, 36(3), 562-577.
Steiger, J. H. (2000). Point estimation, hypothesis testing, and interval estimation using the
RMSEA: Some comments and a reply to Hayduk and Glaser. Structural Equation
Modeling, 7(2), 149-162.
Suchman, M. C. (1995). Managing legitimacy: Strategic and institutional approaches. Academy
of management review, 20(3), 571-610.
Page 203
186
Surroca, J., Tribo, J. A., & Zahra, S. A. (2013). Stakeholder pressure on MNEs and the transfer
of socially irresponsible practices to subsidiaries. Academy of Management
Journal, 56(2), 549-572.
Tabchnick, B. G., & Fidell, L. S. (2006). Using multivariate statistics. Boston: Allyin & Bacon.
Thode, H. C. (2002). Testing for normality (Vol. 164). CRC press.
McWilliams, A., Siegel, D., & Teoh, S. H. (1999). Issues in the use of the event study
methodology: A critical analysis of corporate social responsibility
studies. Organizational Research Methods, 2(4), 340-365.
Turban, D. B., & Greening, D. W. (1997). Corporate social performance and organizational
attractiveness to prospective employees. Academy of management journal, 40(3), 658-
672.
Turker, D. (2009). Measuring corporate social responsibility: A scale development
study. Journal of business ethics, 85(4), 411-427.
Ullman, J. B., & Bentler, P. M. (2003). Structural equation modeling. John Wiley & Sons, Inc..
Urbach, N., & Ahlemann, F. (2010). Structural equation modeling in information systems
research using partial least squares. Journal of Information technology theory and
application, 11(2), 5-40.
Uzhegova, O. (2010). The relative importance of bank-specific factors for bank profitability in
developing economies. Mediterranean Journal of Social Sciences, 6(3), 277-288.
Page 204
187
Valmohammadi, C. (2014). Impact of corporate social responsibility practices on organizational
performance: an ISO 26000 perspective. Social Responsibility Journal, 10(3), 455-479.
Van Beurden, P., & Gossling, T. (2008). The worth of values–a literature review on the relation
between corporate social and financial performance. Journal of business ethics, 82(2),
407-424.
Van der Wiele, T., Kok, P., McKenna, R., & Brown, A. (2001). A corporate social responsibility
audit within a quality management framework. Journal of Business Ethics, 31(4), 285-
297.
Vitaliano, D. F., & Stella, G. P. (2006). The cost of corporate social responsibility: The case of
the Community Reinvestment Act. Journal of Productivity Analysis, 26(3), 235-244.
Vogel, D. (2007). The market for virtue: The potential and limits of corporate social
responsibility. Brookings Institution Press.
Vogel, D., & Bradshaw, T. (1981). Corporations and their Critics: Issues and Answers to the
Problems of CSR. McGraw-Hill, New York
Waddock, S. A., & Graves, S. B. (1997). The corporate social performance-financial
performance link. Strategic management journal, 303-319.
Wagner, M. (2010). Corporate social performance and innovation with high social benefits: A
quantitative analysis. Journal of Business Ethics, 94(4), 581-594.
Walker, K. (2010). A systematic review of the corporate reputation literature: Definition,
measurement, and theory. Corporate reputation review, 12(4), 357-387.
Page 205
188
Walsh, G., Dinnie, K., & Wiedmann, K. P. (2006). How do corporate reputation and customer
satisfaction impact customer defection? A study of private energy customers in
Germany. Journal of Services Marketing, 20(6), 412-420.
Weiss, A., Anderson, E., & MacInnis, D. (1999). Reputation Management as a Motivation for
Sales Structure Decisions. Journal of Marketing, 63(4), 74-89.
Wood, D. J. (1991). Corporate social performance revisited. Academy of management
review, 16(4), 691-718.
Wood, D. J. (2010). Measuring corporate social performance: A review. International Journal of
Management Reviews, 12(1), 50-84.
Yamak, S., & Suer, Ö. (2005). State as a stakeholder. Corporate Governance: The international
journal of business in society, 5(2), 111-120.
Yu, W., & Ramanathan, R. (2015). An empirical examination of stakeholder pressures, green
operations practices and environmental performance. International Journal of Production
Research, 53(21), 6390-6407.
Yusoff, W. F. W., & Adamu, M. S. (2016). The Relationship between Corporate Social
Responsibility and Financial Performance: Evidence from Malaysia. International
Business Management, 10(4), 345-351.
Zenisek, T. J. (1979). Corporate social responsibility: A conceptualization based on
organizational literature. Academy of management review, 4(3), 359-368.
Page 206
189
Zhu, Q., & Sarkis, J. (2007). The moderating effects of institutional pressures on emergent green
supply chain practices and performance. International journal of production
research, 45(18-19), 4333-4355.
Page 207
190
Appendix 4.4.1.2. Histogram and P-P-Plot
of Corporate Social Responsibility
Appendix 4.4.1.2. Histogram and P-P-Plot
of Financial Performance
Page 208
191
Appendix 4.4.1.3. Histogram and P-P-Plot
of Non-Financial Performance
Appendix 4.4.1.4. Histogram and P-P-Plot
of Corporate Reputation
Page 209
192
Appendix 4.4.1.5. Histogram and P-P-Plot
of Innovation
Appendix 4.4.1.6. Histogram and P-P-Plot
of Stakeholder Pressure
Page 210
193
Appendix 4.4.2.1. Scatter Plot of CSR and
Financial Performance
Appendix 4.4.2.2. Scatter Plot of CSR and
Non-Financial Performance
Appendix 4.4.2.3. Scatter Plot of CSR and
Corporate Reputation
Appendix 4.4.2.4. Scatter Plot of CSR and
Innovation
Page 211
194
Appendix 4.4.2.5. Scatter Plot of CSR and Stakeholder Pressure
Annexure 3.3.1
Page 212
195
Questionnaire
Dear Sir/Madam,
I shall be thanks for giving me some moments for answer following questions regarding
my research studies on this topic,
“Implications of Corporate Social Responsibility on Financial and Non-Financial
Performance of Banking Sector of Pakistan: Moderating role of Stakeholder
Pressure and Mediating role of Innovation and Corporate Reputation”
*Please answer all the questions acting as focal person with respect to overall bank.
Section A
1. Gender?
Male Female
2. Age?
In between 20 – 30 Years In between 31 – 40 Years
In between 41 – 50 Years More than 50 Years
3. Qualification?
Bachelor Master
M.Phil. Other Certification
4. Experience in this bank?
In between 0-5 Years In between 6-10 Years
In between 11-15 Years More than 15 Years
5. Name of you bank?
------------------------------
Page 213
196
Section B
1 2 3 4 5 ▼ ▼ ▼ ▼ ▼
Strongly Disagree
Disagree Neutral Agree Strongly Agree
Our bank 1 2 3 4 5
CSR1 Makes investment to create a better life for future generations.
CSR2 Thinks customer satisfaction is highly important.
CSR3 Provide high-quality products to its customers.
CSR4 Always pays its taxes on a regular and continuing basis.
Our bank 1 2 3 4 5
CSR5 Complies with legal regulations completely and promptly.
CSR6 Contributes to campaigns and projects that promote the well-being
of the society.
CSR7
Contributes to schools, hospitals, and parks according to the needs
of the society.
CSR8 Emphasizes the importance of its social responsibilities to the
society.
Our bank 1 2 3 4 5
CSR9 Encourages its employees to participate in voluntarily activities.
CSR10 Endeavors to create employment opportunities.
CSR11 Implements flexible policies to provide a good work & life balance
for its employees.
CSR12 Participates in activities which aim to protect and improve the
quality of the natural environment.
CSR13 Provide a safe and healthy working environment to all its
employees.
Page 214
197
Section C
1 2 3 4 5 ▼ ▼ ▼ ▼ ▼
Strongly Disagree
Disagree Neutral Agree Strongly Agree
Our bank 1 2 3 4 5
SP1 Customers put pressure on management in adopting
environmentally friendly practices
SP2 Stakeholder put pressure in adopting environmentally friendly
practices
SP3 Competitors action put pressure on management in adopting
environmental friendly practices
SP4 Marketing department puts pressure on management in adopting
environmental friendly practices
Our bank 1 2 3 4 5
IP1 New or improved products/services are is above the average within
industry
IP2 New or improved internal processes is above the average of industry
IP3 Top management emphasizes on research and development
IP4 Introduced new product lines in the last five year
IP5 Introduced important changes in products during the last five years.
Our bank 1 2 3 4 5
CR1 Treats customers as being a very professional organization
CR2 Is viewed by customers as a successful entity.
CR3 Reputation is highly regarded.
CR4 Customers view our firm as one that is stable
CR5 Is viewed as well-established by customers.
Page 215
198
Section D
1 2 3 4 5
▼ ▼ ▼ ▼ ▼
Strongly Disagree
Disagree Neutral Agree Strongly Agree
Our bank 1 2 3 4 5
FP-1 Return on asset is increased in last five years.
FP-2 Return on investment is increased in last five years.
FP-3 Market capitalization is increased in last five years.
FP-4 Earnings per share is increased in last five years.
Our bank 1 2 3 4 5
NFP-1 Workplace relations are seen satisfactory
NFP-2 New product development is satisfactory
NFP-3 Considered research and development as important
NFP-4 Emphasized on cost reduction programs.
NFP-5 Personal development of employees
NFP-6 Ensures employee health and safety
Page 216
199
Annexure 3.3.2: Sample Size
Bank Name No of Branches Questionnaires Detail
Bank
Branches Federal Central South Targeted Distributed
Response
Received Discarded
Final
Used
Habib Bank
Limited 1703 46 539 222 807 150 98 1 97
National
Bank of
Pakistan
1519 36 724 278 1038 130 76 8 68
Muslim
Commercial
Bank
1444 42 416 234 692 100 55 1 54
United
Bank
Limited
1379 18 124 230 372 75 22 7 15
Allied Bank
Limited 1250 50 608 338 996 100 87 5 82
Bank
Alfalah
Limited
638 33 216 132 381 50 42 7 35
Bank Al-
Habib
Limited
605 24 221 187 432 55 45 14 31
Askari
Bank
Limited
516 37 138 139 314 40 35 12 23
Total 9054 286 2986 1760 5032 700 460 55 405
Total Banks 34
Total
Branches 12993