IMPLICATIONS OF THE STREAMLINED SALES TAX AGREEMENT FOR GENERAL EXCISE TAX REVENUES Prepared for the State of Hawaii Office of the Auditor Prepared by William F. Fox William B. Stokely Distinguished Professor of Business and Director, Center for Business and Economic Research College of Business Administration The University of Tennessee, Knoxville Knoxville, Tennessee April 6, 2006
Transcript
IMPLICATIONS OF THE STREAMLINED SALES TAX AGREEMENT FOR
GENERAL EXCISE TAX REVENUES
Prepared for the State of Hawaii Office of the Auditor
Prepared by
William F. Fox William B. Stokely Distinguished Professor of Business
and Director, Center for Business and Economic Research College of Business Administration
The University of Tennessee, Knoxville Knoxville, Tennessee
April 6, 2006
Implications of the Streamlined Sales Tax Agreement for General Excise Tax Revenues1
Introduction
This report examines the effect that participation in the Streamlined Sales
and Use Tax Agreement (SSUTA) would have on Hawaii General Excise Tax
(GET) revenues. The intent is to provide an estimate of the revenues that Hawaii
could expect, in 2006 terms, if it was a full participant in the SSUTA and if
vendor collection of the GET becomes mandatory. There is also discussion of the
amount of revenue Hawaii might expect under the SSUTA as remote vendors
agree to voluntarily comply.
The report is divided into six sections. The first section after this
introduction is a summary of the findings that is followed by a section that
provides a thumbnail sketch of the GET. Sections on e-commerce sales in the
U.S., e-commerce sales to Hawaii people and businesses, and the taxability of e-
commerce under the GET are next. The final section provides estimates of the
GET revenue that Hawaii could expect to receive through conformance to the
SSUTA.
The GET2 when levied on final sales of goods and services is similar in
concept to the retail sales taxes that are imposed on sales of goods and services in
other states and is considered as a sales tax in this paper.3 As with all other sales
taxing states, Hawaii levies a corresponding use tax “on the use in this State of
1 The author thanks Dr. Tu Pham and Bernard Wilson of the Hawaii Department of Taxation and Ray Kamikawa for very helpful discussions related to this study. 2 See Hawaii Code 237 for GET legislation. 3 See Fox (2002) for a discussion of why the GET can be treated as a retail sales tax, albeit with a much broader base than the average state.
2
tangible personal property which is imported by a taxpayer in this State whether
owned, purchased from an unlicensed seller, or however acquired for use in this
State (18-238-2)” and “on the value of services or contracting as defined in
section 237-6 that are performed by an unlicensed seller at a point outside the
State and imported or purchased for use in this State” (18-238-2.3). Sales tax
revenues are generally collected on sales of goods and services in Hawaii and use
taxes are normally collected on goods and services that are purchased (or
produced) outside Hawaii for use in Hawaii. The terms use tax, sales tax and
GET are used somewhat interchangeably in this paper.
Participation in the SSUTA is primarily expected to affect revenues by
assisting states in collecting the use tax. The SSUTA can assist states by
enhancing the probability that vendors will collect the use tax on behalf of buyers,
though the effects on revenues can differ during the next several years versus the
longer term depending on whether and when Congress enacts legislation requiring
remote vendors to collect taxes on behalf of buyers. Hawaii’s use tax legislation
requires buyers to remit the GET on their own if the vendor did not remit the tax,
but voluntary compliance by individuals is generally believed to be very limited.
Voluntary compliance by business purchasers is much better than for individuals,
though businesses appear to be much less compliant with the use tax than with the
sales tax.4 In the near term, Hawaii’s participation in the SSUTA can only affect
revenues by increasing voluntary compliance by vendors (as opposed to buyers)
4 For example, in an audit of registered taxpayers Washington State (2003) found 27 percent non-compliance with the use tax but only 1 percent noncompliance with the sales tax.
3
since vendors without nexus cannot be required to collect the tax.5 Vendors have
an incentive to voluntarily comply because the SSUTA provides for an amnesty
from all past sales and use tax liabilities plus penalties and interest in each
member state. The amnesty period runs from October 1, 2005 through September
30, 2006. In the longer term, use tax compliance can be enhanced to a much
greater extent if remote vendors can be required to collect and remit use taxes
either because Congress enacts legislation6 that creates nexus for remote vendors
or because the Supreme Court overturns the Quill Case that established sales tax
nexus on a physical presence basis. Tax administrators and analysts generally
conclude that mandatory collection by vendors significantly improves revenue
performance relative to voluntary collection by either buyers or vendors, so the
revenue potential is dramatically enhanced by mandatory compliance.
Findings
Hawaii businesses and people are estimated to make $9.5 billion in e-
commerce and retail mail order purchases in 2006 (see Table 1). Of this amount,
an estimated $5.9 billion is taxable at either the 4.0 or 0.5 percent GET rate, with
about $3.2 billion taxable at the 0.5 percent rate and about $2.7 billion taxable at
the 4.0 percent rate. In total 62.0 percent of e-commerce transactions is taxable.
Approximately $123.6 million in GET revenues is due on these sales, and an
estimated $51.7 million is not being collected either by the vendors or paid in use
5 The U.S. Supreme Court in Quill, Inc. v. North Dakota ruled that a state can only require firms with physical presence in the state to collect the sales tax. At this point participation in the SSUTA does not alter this Supreme Court determined standard. 6 Legislation to require remote vendors to collect the sales tax on behalf of states that conform to the SSUTA was introduced in Congress on December 21, 2005.
4
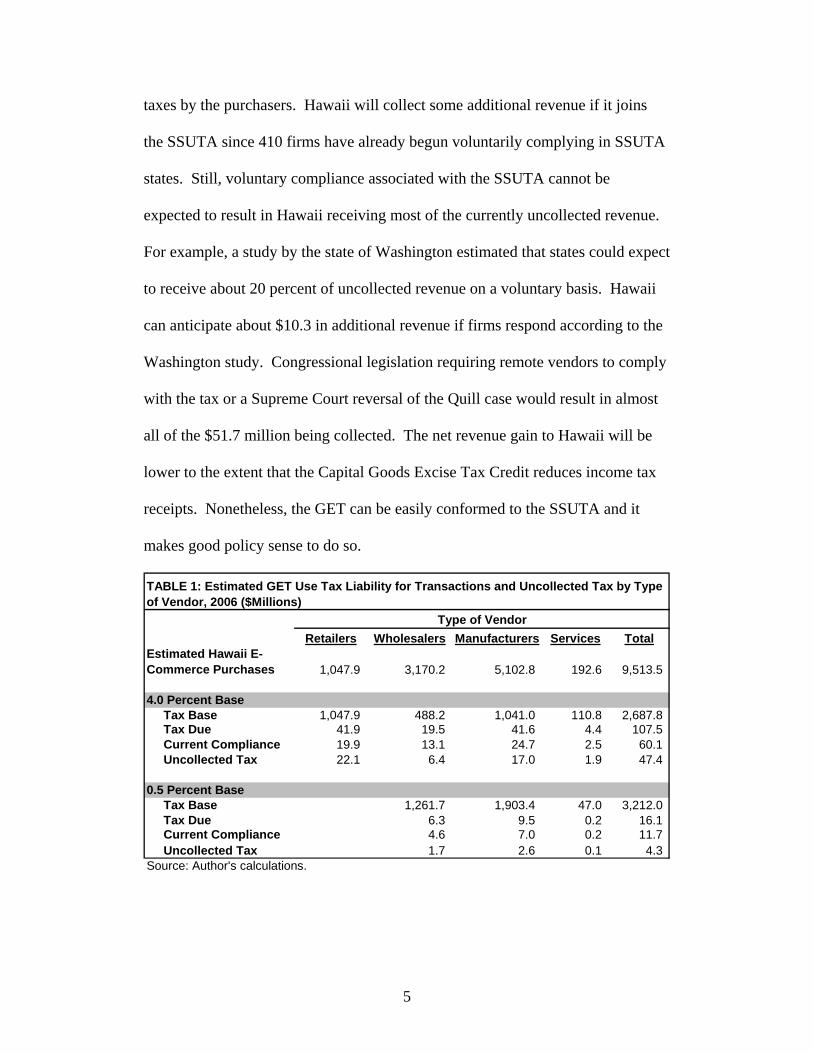
taxes by the purchasers. Hawaii will collect some additional revenue if it joins
the SSUTA since 410 firms have already begun voluntarily complying in SSUTA
states. Still, voluntary compliance associated with the SSUTA cannot be
expected to result in Hawaii receiving most of the currently uncollected revenue.
For example, a study by the state of Washington estimated that states could expect
to receive about 20 percent of uncollected revenue on a voluntary basis. Hawaii
can anticipate about $10.3 in additional revenue if firms respond according to the
Washington study. Congressional legislation requiring remote vendors to comply
with the tax or a Supreme Court reversal of the Quill case would result in almost
all of the $51.7 million being collected. The net revenue gain to Hawaii will be
lower to the extent that the Capital Goods Excise Tax Credit reduces income tax
receipts. Nonetheless, the GET can be easily conformed to the SSUTA and it
4.0 Percent Base Tax Base 1,047.9 488.2 1,041.0 110.8 2,687.8 Tax Due 41.9 19.5 41.6 4.4 107.5 Current Compliance 19.9 13.1 24.7 2.5 60.1 Uncollected Tax 22.1 6.4 17.0 1.9 47.4
0.5 Percent Base Tax Base 1,261.7 1,903.4 47.0 3,212.0 Tax Due 6.3 9.5 0.2 16.1 Current Compliance 4.6 7.0 0.2 11.7 Uncollected Tax 1.7 2.6 0.1 4.3 Source: Author's calculations.
TABLE 1: Estimated GET Use Tax Liability for Transactions and Uncollected Tax by Type of Vendor, 2006 ($Millions)
Type of Vendor
5
A Thumbnail Sketch of the GET
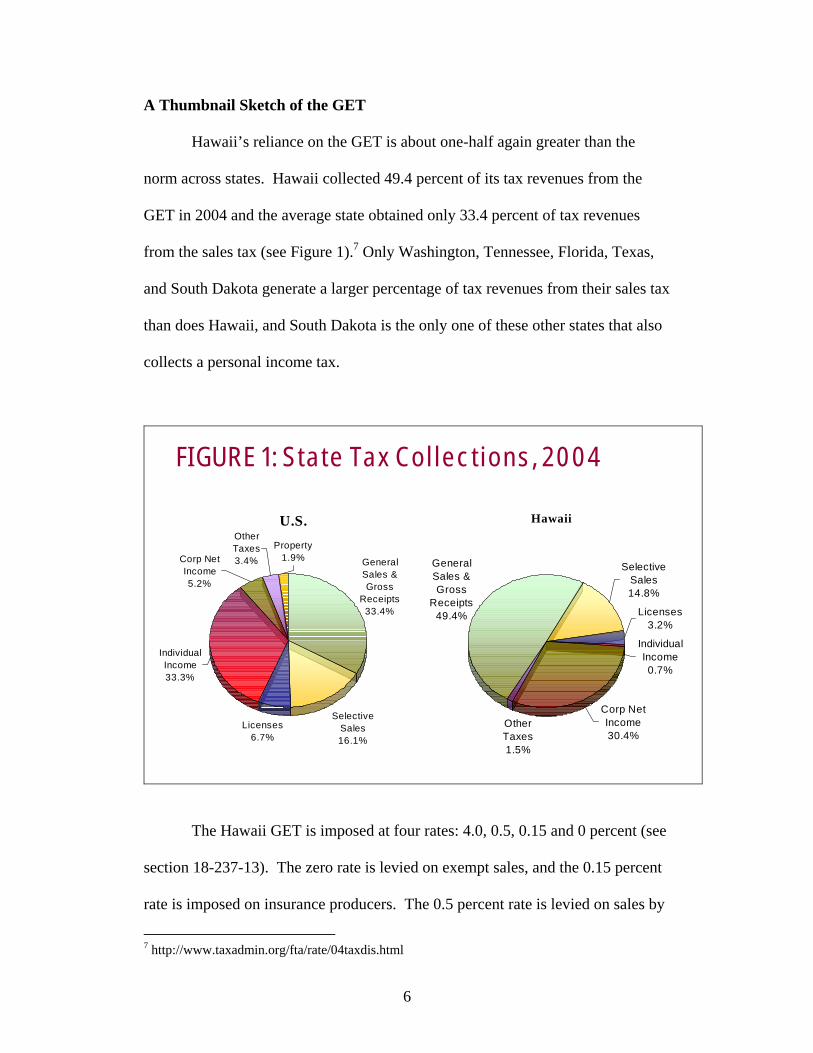
Hawaii’s reliance on the GET is about one-half again greater than the
norm across states. Hawaii collected 49.4 percent of its tax revenues from the
GET in 2004 and the average state obtained only 33.4 percent of tax revenues
from the sales tax (see Figure 1).7 Only Washington, Tennessee, Florida, Texas,
and South Dakota generate a larger percentage of tax revenues from their sales tax
than does Hawaii, and South Dakota is the only one of these other states that also
collects a personal income tax.
FIGURE 1: State Tax Collections, 2004
U.S.
General Sales & Gross
Receipts33.4%
Selective Sales16.1%
Licenses6.7%
Individual Income33.3%
Corp Net Income5.2%
Other Taxes3.4%
Property1.9%
Hawaii
General Sales & Gross
Receipts49.4%
Selective Sales14.8%
Licenses3.2%
Individual Income0.7%
Corp Net Income30.4%
Other Taxes1.5%
The Hawaii GET is imposed at four rates: 4.0, 0.5, 0.15 and 0 percent (see
section 18-237-13). The zero rate is levied on exempt sales, and the 0.15 percent
rate is imposed on insurance producers. The 0.5 percent rate is levied on sales by
7 http://www.taxadmin.org/fta/rate/04taxdis.html
6
manufacturers, wholesalers, intermediary services, sugar processing, and
pineapple canning. The 4.0 percent rate is imposed on all other taxable sales.8
The use tax is imposed at similar rates as the sales tax (see section 18-238-2).
The use tax is 4.0 percent on purchases by individuals; by retailers, contractors,
and service providers on purchases that are not for resale; and by manufacturers
on purchases where the goods do not become component parts of the final
product. Purchases for resale or where they become a component part are taxed at
0.5 percent as long as the wholesaler or manufacturer does not act as a retailer.
The standard GET rate (4.0 percent) is low on the standards of other
states. Five states, Alaska, Delaware, Montana, New Hampshire, and Oregon,
have no state sales tax and therefore a 0 rate. Among sales-taxing states, only
Colorado has a lower state sales tax rate (2.9 percent) than Hawaii, and six states
besides Hawaii have a 4.0 percent state rate. Thirty-four states allow a local sales
tax rate.9 Hawaii’s state and local rate is the lowest among sales-taxing states
when the state rate is combined with the maximum local sales tax rate.10
Hawaii is able to generate a large share of tax revenues from the GET
despite the low tax rate because of the broad base. Hawaii’s taxation of food and
nearly all services and its relatively infrequent granting of exemptions are major
reasons for the broad base. Dividing states’ tax bases by their respective personal
income is one means of comparing the relative breadth of state tax bases.11
8 The GET rate is 4.16 by comparison with the rate levied in many other states. The reason is that the GET is imposed on gross revenues of a business, including any attempt by the vendor to include the GET in the price, while most other states impose the tax on the gross of tax price. 9 Alaska has no state sales tax rate but has local tax rates up to 7.0 percent. 10 See http://www.taxch.com/STRates.stm 11 Personal income is a broad measure of a state economy and includes wages and salaries, rents, interest, dividends, earnings of sole proprietors and farmers, and transfer payments.
7
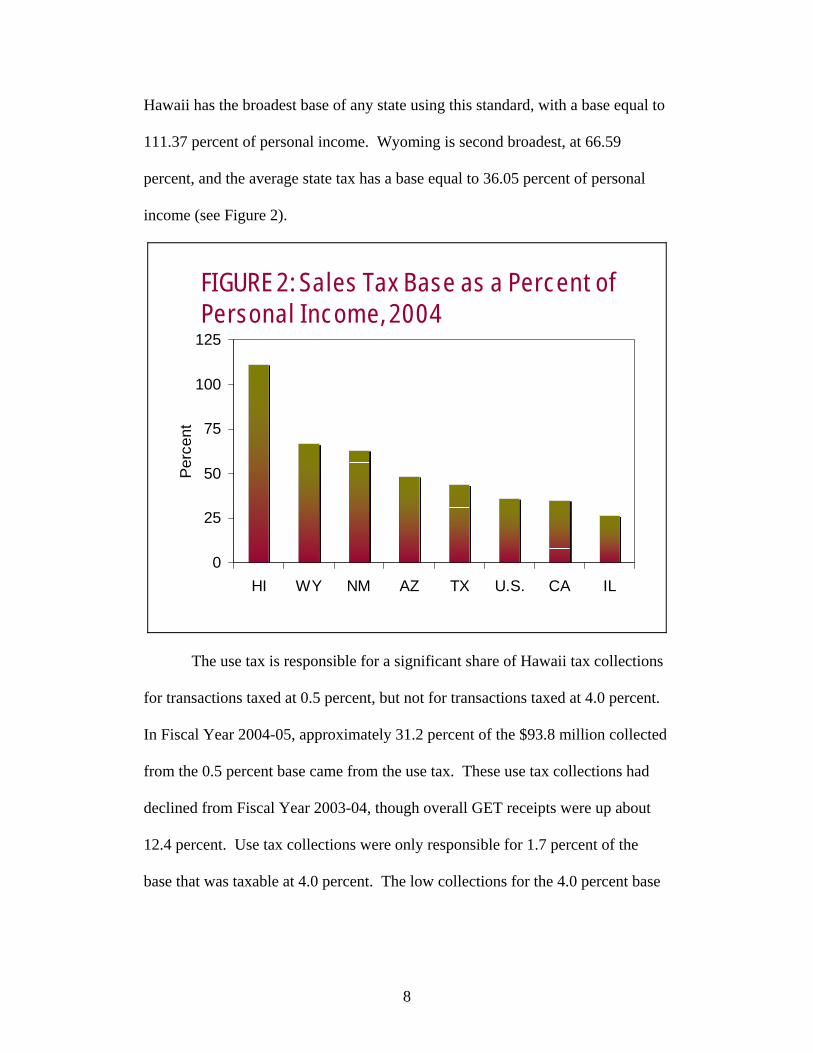
Hawaii has the broadest base of any state using this standard, with a base equal to
111.37 percent of personal income. Wyoming is second broadest, at 66.59
percent, and the average state tax has a base equal to 36.05 percent of personal
income (see Figure 2).
FIGURE 2: Sales Tax Base as a Percent of Personal Income, 2004
0
25
50
75
100
125
HI WY NM AZ TX U.S. CA IL
Perc
ent
The use tax is responsible for a significant share of Hawaii tax collections
for transactions taxed at 0.5 percent, but not for transactions taxed at 4.0 percent.
In Fiscal Year 2004-05, approximately 31.2 percent of the $93.8 million collected
from the 0.5 percent base came from the use tax. These use tax collections had
declined from Fiscal Year 2003-04, though overall GET receipts were up about
12.4 percent. Use tax collections were only responsible for 1.7 percent of the
base that was taxable at 4.0 percent. The low collections for the 4.0 percent base
8
are suggestive of very weak compliance with the use tax by non-business
purchasers.
E-Commerce in the United States
The following sections describe the methodology for estimating the
revenue effects of the SSUTA. The general approach involves a number of steps
including estimation of:
• the total e-commerce sales for the United States • the share of e-commerce sales that is attributable to Hawaii • the GET due on Hawaii-destined transactions • the GET that is currently being collected on these transactions • the currently uncollected GET • the additional GET that would be received under the SSUTA.
This section begins the process by estimating e-commerce transactions for
the U.S. Historical data on e-commerce are available from the U.S. Bureau of the
Census by type of vendor including for manufacturers, wholesalers, retailers and
service providers. These data serve as the beginning point for estimating the
effects of the SSUTA on Hawaii GET revenues. Annual data are available from
the Census by type of vendor for 1998 through 2003, and quarterly data are
provided by the Census for sales by retailers through the second quarter of 2005.12
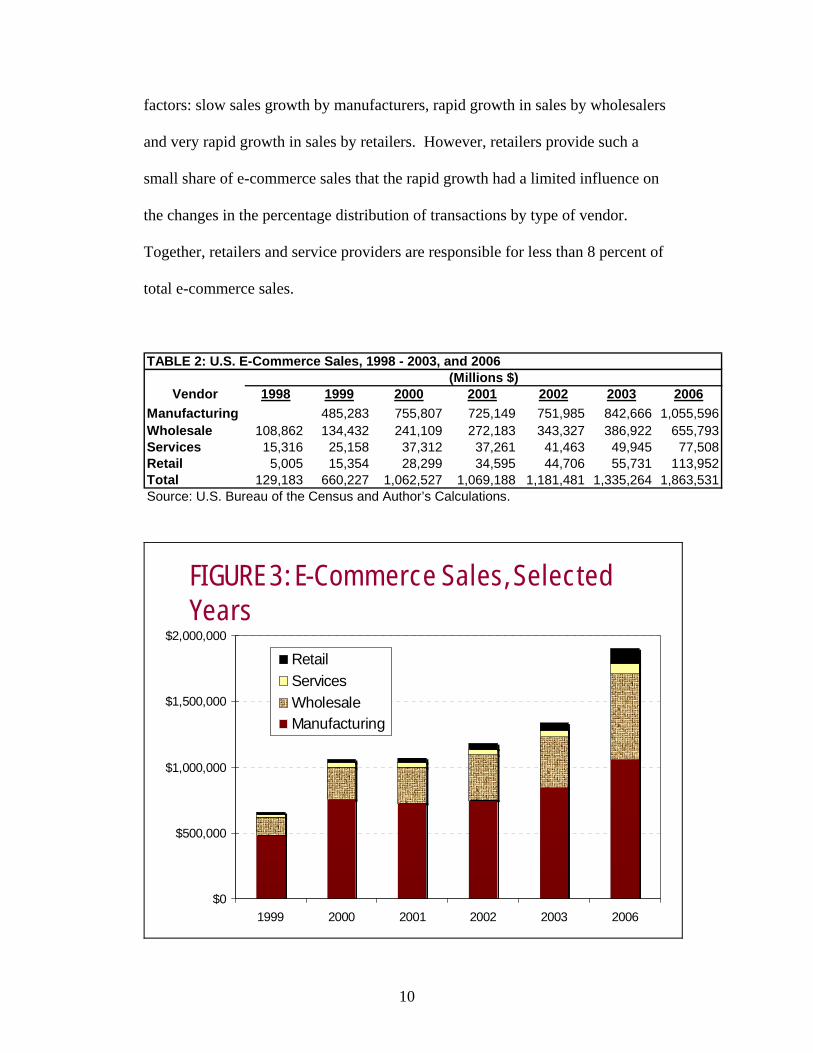
Total e-commerce sales exceeded $1.3 trillion in 2003, and have more than
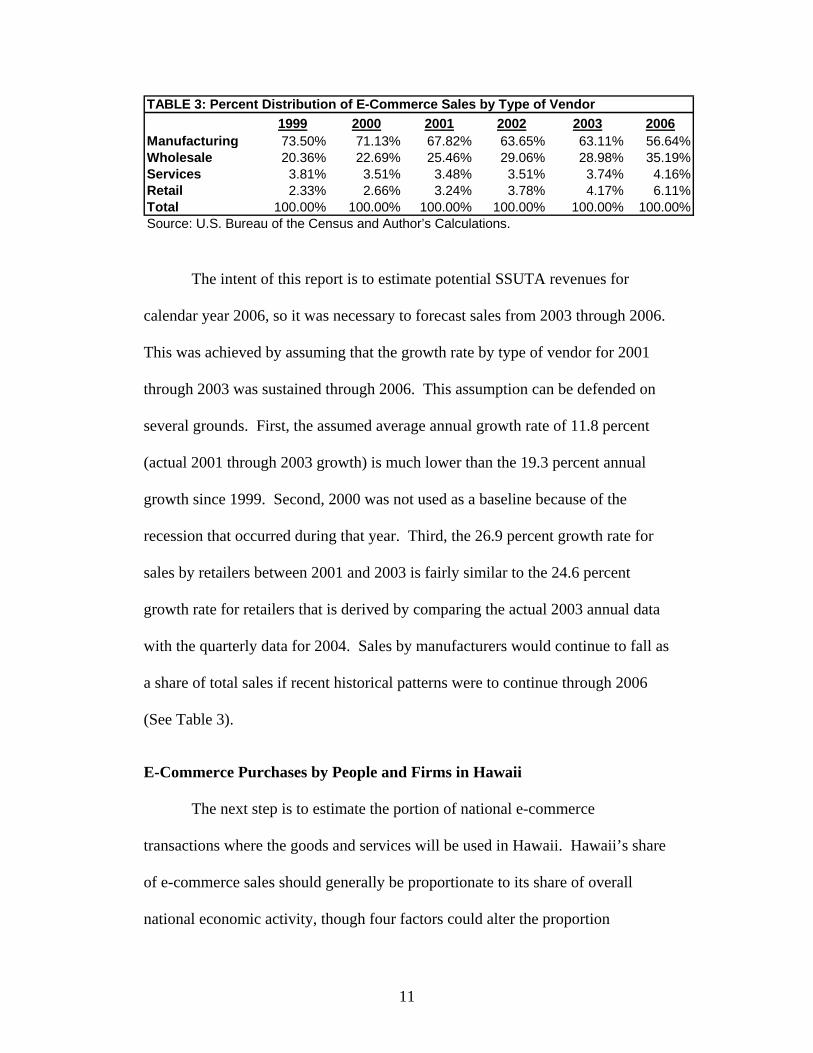
doubled since 1999 (see Table 2 and Figure 3). Manufacturers dominate e-
commerce sales, being responsible for 63 percent of sales in 2003 (Table 3),
though their share has fallen significantly since 1999 (see Table 3). The declining
percentage that manufacturers play in e-commerce can be attributed to three
12 The Census did not report manufacturers’ sales for 1998.
9
factors: slow sales growth by manufacturers, rapid growth in sales by wholesalers
and very rapid growth in sales by retailers. However, retailers provide such a
small share of e-commerce sales that the rapid growth had a limited influence on
the changes in the percentage distribution of transactions by type of vendor.
Together, retailers and service providers are responsible for less than 8 percent of
total e-commerce sales.
Vendor 1998 1999 2000 2001 2002 2003 2006Manufacturing 485,283 755,807 725,149 751,985 842,666 1,055,596Wholesale 108,862 134,432 241,109 272,183 343,327 386,922 655,793Services 15,316 25,158 37,312 37,261 41,463 49,945 77,508Retail 5,005 15,354 28,299 34,595 44,706 55,731 113,952Total 129,183 660,227 1,062,527 1,069,188 1,181,481 1,335,264 1,863,531Source: U.S. Bureau of the Census and Author’s Calculations.
TABLE 2: U.S. E-Commerce Sales, 1998 - 2003, and 2006(Millions $)
FIGURE 3: E-Commerce Sales, Selected Years
$0
$500,000
$1,000,000
$1,500,000
$2,000,000
1999 2000 2001 2002 2003 2006
RetailServicesWholesaleManufacturing
10
1999 2000 2001 2002 2003 2006Manufacturing 73.50% 71.13% 67.82% 63.65% 63.11% 56.64%Wholesale 20.36% 22.69% 25.46% 29.06% 28.98% 35.19%Services 3.81% 3.51% 3.48% 3.51% 3.74% 4.16%Retail 2.33% 2.66% 3.24% 3.78% 4.17% 6.11%Total 100.00% 100.00% 100.00% 100.00% 100.00% 100.00%Source: U.S. Bureau of the Census and Author’s Calculations.
TABLE 3: Percent Distribution of E-Commerce Sales by Type of Vendor
The intent of this report is to estimate potential SSUTA revenues for
calendar year 2006, so it was necessary to forecast sales from 2003 through 2006.
This was achieved by assuming that the growth rate by type of vendor for 2001
through 2003 was sustained through 2006. This assumption can be defended on
several grounds. First, the assumed average annual growth rate of 11.8 percent
(actual 2001 through 2003 growth) is much lower than the 19.3 percent annual
growth since 1999. Second, 2000 was not used as a baseline because of the
recession that occurred during that year. Third, the 26.9 percent growth rate for
sales by retailers between 2001 and 2003 is fairly similar to the 24.6 percent
growth rate for retailers that is derived by comparing the actual 2003 annual data
with the quarterly data for 2004. Sales by manufacturers would continue to fall as
a share of total sales if recent historical patterns were to continue through 2006
(See Table 3).
E-Commerce Purchases by People and Firms in Hawaii
The next step is to estimate the portion of national e-commerce
transactions where the goods and services will be used in Hawaii. Hawaii’s share
of e-commerce sales should generally be proportionate to its share of overall
national economic activity, though four factors could alter the proportion
11
attributable to Hawaii. First, Hawaii’s low sales tax rate makes Hawaii residents
less likely to shop online to avoid paying the use tax that is due than are residents
of higher tax rate states (see Goolsbee, 1999). Second, the long distances to the
mainland may increase the propensity to shop online because fewer alternatives
are available for shopping in neighboring states. Third, four of the top thirty-five
and K-Mart) do not ship to Hawaii. This reduces the online shopping options for
Hawaii residents. Finally, higher shipping costs to Hawaii might discourage
online purchasing, though the goods still must be shipped if people obtain the
goods through some other mechanism. Relatively little research exists on the
propensity in different states to shop online, but it is suggestive that Hawaii
residents are more likely than average to shop online. A recent study by
Scarborough Research indicates that Hawaii Internet users are more likely to
make significant purchases than are people in the average state.13 As a result, it is
assumed that Hawaii residents and businesses make 10 percent more online
purchases relative to their personal income than do those in the average state.
Hawaii residents’ purchases from retailers and service providers are
presumed to be proportionate to the state’s share of total capacity to consume, and
purchases from manufacturers and wholesalers are presumed to be proportionate
to the state’s share of total production. Capacity to consume is proxied by
personal income, and Hawaii had 0.42 percent of national personal income in
2004. Production is proxied with gross state product (GSP), and Hawaii had 0.43
13 See “Honolulu 3rd in High-Speed Net Access,” Honolulu Advertiser, March 14, 2006.
12
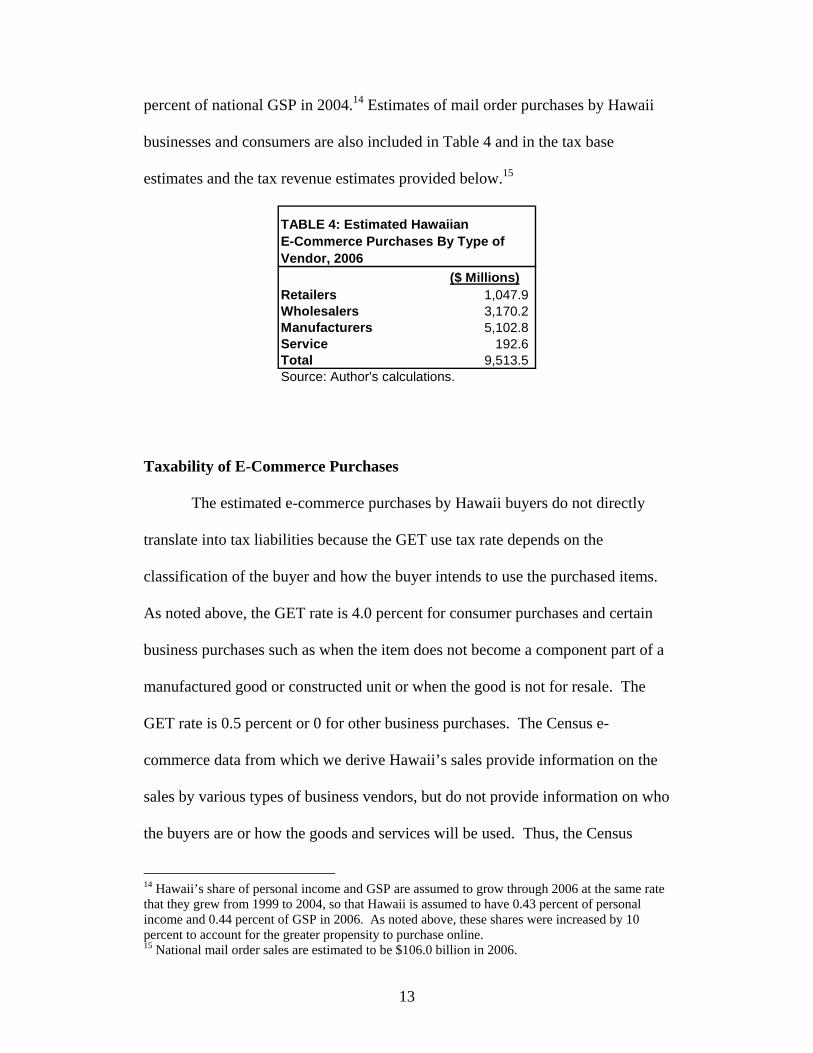
percent of national GSP in 2004.14 Estimates of mail order purchases by Hawaii
businesses and consumers are also included in Table 4 and in the tax base
estimates and the tax revenue estimates provided below.15
($ Millions)Retailers 1,047.9 Wholesalers 3,170.2 Manufacturers 5,102.8 Service 192.6 Total 9,513.5 Source: Author's calculations.
TABLE 4: Estimated Hawaiian E-Commerce Purchases By Type of Vendor, 2006
Taxability of E-Commerce Purchases
The estimated e-commerce purchases by Hawaii buyers do not directly
translate into tax liabilities because the GET use tax rate depends on the
classification of the buyer and how the buyer intends to use the purchased items.
As noted above, the GET rate is 4.0 percent for consumer purchases and certain
business purchases such as when the item does not become a component part of a
manufactured good or constructed unit or when the good is not for resale. The
GET rate is 0.5 percent or 0 for other business purchases. The Census e-
commerce data from which we derive Hawaii’s sales provide information on the
sales by various types of business vendors, but do not provide information on who
the buyers are or how the goods and services will be used. Thus, the Census
14 Hawaii’s share of personal income and GSP are assumed to grow through 2006 at the same rate that they grew from 1999 to 2004, so that Hawaii is assumed to have 0.43 percent of personal income and 0.44 percent of GSP in 2006. As noted above, these shares were increased by 10 percent to account for the greater propensity to purchase online. 15 National mail order sales are estimated to be $106.0 billion in 2006.
13
classifications do not directly allow the e-commerce data to be translated into the
various taxable groupings in Hawaii. This section describes how the data by type
of vendor sale are converted into taxable purchases in Hawaii.
Two basic steps are needed to determine the taxability and tax rate for
Hawaii e-commerce transactions: the transactions must be divided into sales to
individual consumers versus sales to businesses, and the business sales must be
divided into those taxable at 4 percent, those at 0.5 percent, and those that are
exempt. The 1997 Economic Census for the United States is one source of data to
assist in these tasks. The Economic Census includes data for sales by retail,
wholesale and service vendors for various types of buyers. These data are eight
years old and are for all sales by these vendors not just e-commerce sales. Still,
the data can be used to provide some insight into who purchases the sales of
various classes of vendors. Nonetheless, purchasing patterns may differ between
e-commerce and other types of commerce and may have changed over time, so
these data are not accepted totally on face value in this report.
Retail Vendors
The Economic Census data indicate that on average 84.2 percent of retail
sales are to final consumers, 4.4 percent are to businesses to use as inputs that
become part of the final product and 11.4 percent are to businesses for other
uses.16 The data allow further refinement because the distribution of purchases by
category is available for many types of retailers. The data for seven different
categories of e-commerce retailers are used here to estimate the distribution of
16 U.S. Bureau of the Census, U.S. Department of Commerce, 1997 Economic Census, Retail Trade, Table 2, Class of Customer by Kind of Business.
14
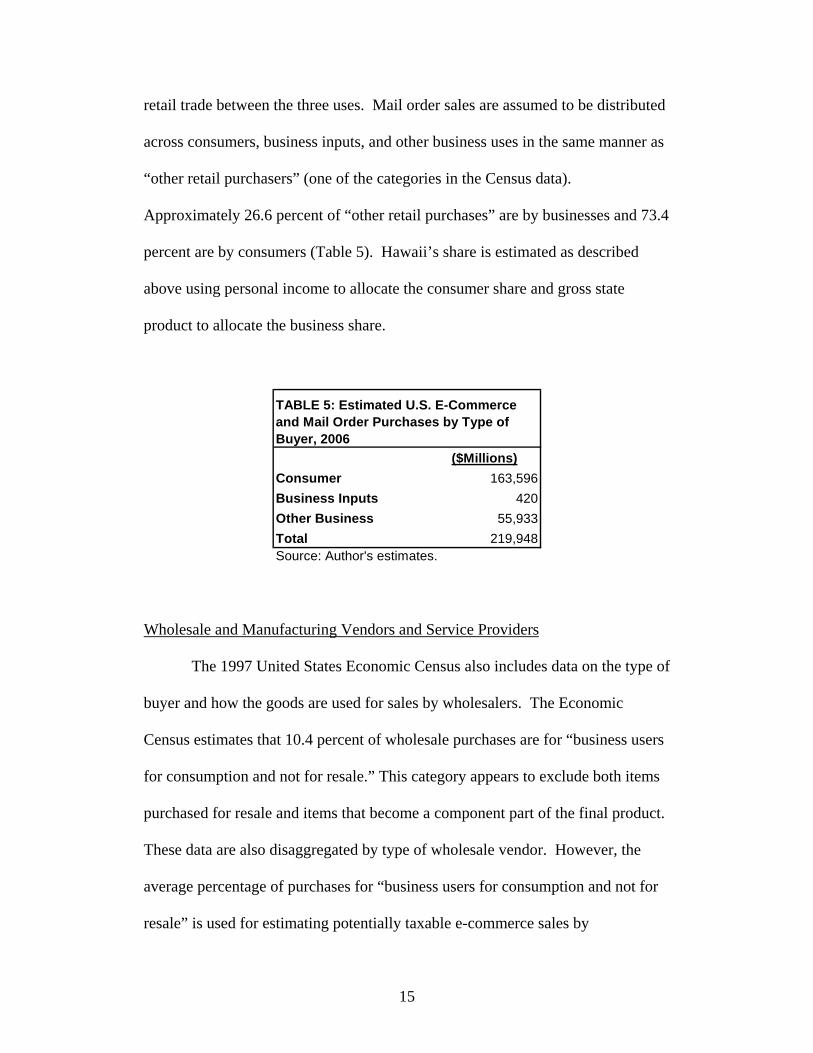
retail trade between the three uses. Mail order sales are assumed to be distributed
across consumers, business inputs, and other business uses in the same manner as
“other retail purchasers” (one of the categories in the Census data).
Approximately 26.6 percent of “other retail purchases” are by businesses and 73.4
percent are by consumers (Table 5). Hawaii’s share is estimated as described
above using personal income to allocate the consumer share and gross state
product to allocate the business share.
($Millions)Consumer 163,596Business Inputs 420Other Business 55,933Total 219,948Source: Author's estimates.
TABLE 5: Estimated U.S. E-Commerce and Mail Order Purchases by Type of Buyer, 2006
Wholesale and Manufacturing Vendors and Service Providers
The 1997 United States Economic Census also includes data on the type of
buyer and how the goods are used for sales by wholesalers. The Economic
Census estimates that 10.4 percent of wholesale purchases are for “business users
for consumption and not for resale.” This category appears to exclude both items
purchased for resale and items that become a component part of the final product.
These data are also disaggregated by type of wholesale vendor. However, the
average percentage of purchases for “business users for consumption and not for
resale” is used for estimating potentially taxable e-commerce sales by
15
wholesalers, rather than the disaggregated sales17 because of the likely differences
that exist between the types of sales that were made by traditional wholesalers and
e-commerce firms.18 According to the Census data, another 0.6 percent of
wholesale sales are to consumers. Nonetheless, consumers are assumed to
purchase 5 percent of wholesale e-commerce sales, because consumers are much
better able to buy from remote wholesalers than from traditional wholesalers.
Data are not available in the Economic Census by type of purchaser for
manufacturing vendors. Therefore, manufacturers are presumed to sell to
business users not for resale and to consumers in the same proportions as e-
commerce wholesalers.
Finally, some data are available from the 1997 Census for selected
services.19 For example, consumers purchase 18 percent of accounting services,
various business users buy 58 percent, and miscellaneous and government users
procure 24 percent. Based on these data for all service sales, individuals are
assumed to purchase 25 percent of services sold via e-commerce and businesses
are assumed to buy 32.5 percent of services for uses that are taxable at the 4.0
percent tax rate.
GET Revenues and Effects of the SSUTA
This section estimates the tax revenue that is due on remote e-commerce
purchases, the degree to which these taxes are already being collected, and the 17 Use tax revenues from firms paying the 4.0 percent rate would be somewhat smaller if the disaggregated percentages were used. 18 U.S. Bureau of the Census, U.S. Department of Commerce, 1997 Economic Census, Wholesale Trade, Table 1. 19 U.S. Bureau of the Census, U.S. Department of Commerce, 1997 Economic Census, Professional, Scientific and Technical Services, Table 2, Receipts by Class of Consumers for Selected Professional, Scientific and Technical Services.
16
amount that is currently uncollected. Finally, discussion of the potential for
collection under the SSUTA is provided. The GET tax base is estimated using the
methodology described above to separate sales by each type of vendor into
taxable purchases by consumers and businesses. All purchases by consumers are
presumed to be taxable at 4.0 percent. It remains necessary to separate business
purchases into those taxable at 4.0 percent, those taxable at 0.5 percent, and non-
taxable purchases. These generally required assumptions that implicitly presumed
what type of business is making the purchase since manufacturing and wholesale
purchases generally are either exempt or are taxable at 0.5 percent but many
retailer purchases are taxed at 4.0 percent or 0.5 percent.
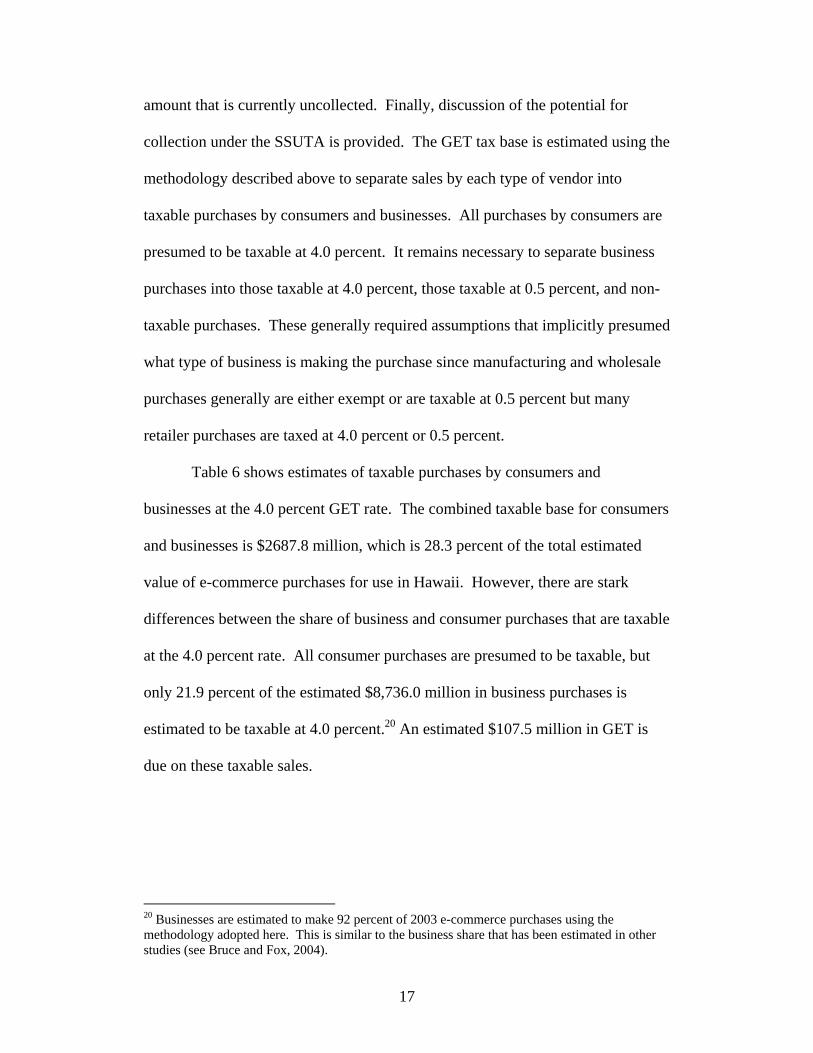
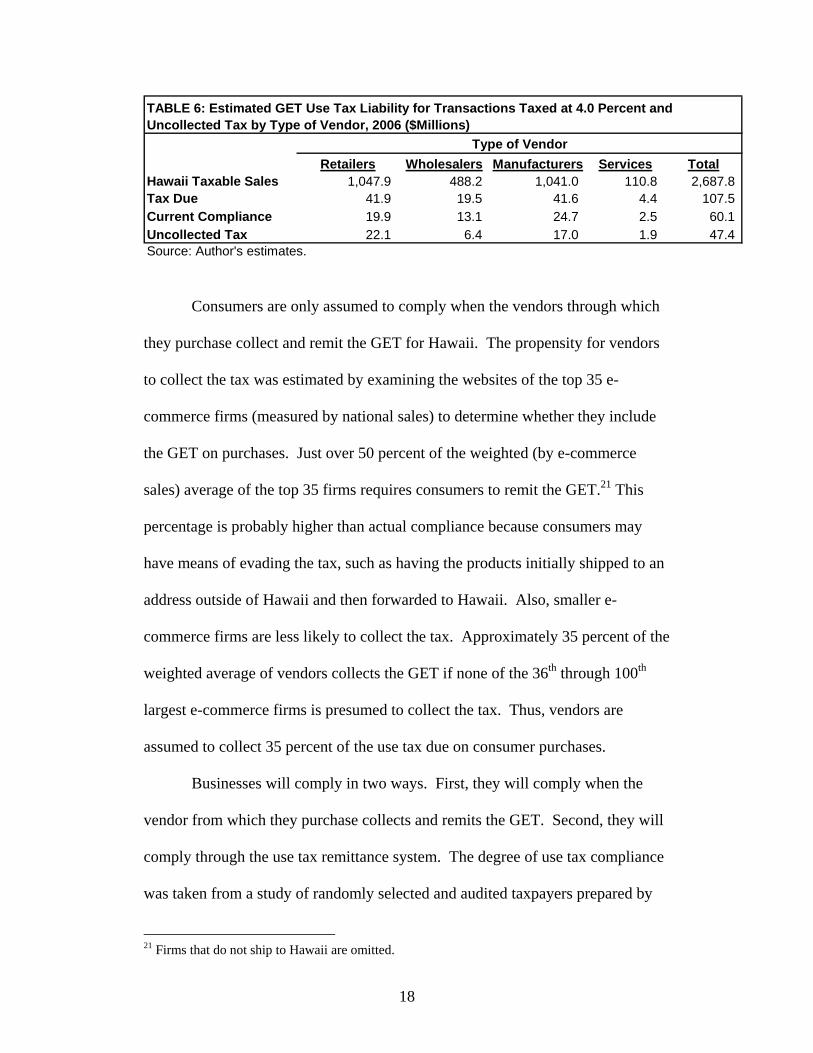
Table 6 shows estimates of taxable purchases by consumers and
businesses at the 4.0 percent GET rate. The combined taxable base for consumers
and businesses is $2687.8 million, which is 28.3 percent of the total estimated
value of e-commerce purchases for use in Hawaii. However, there are stark
differences between the share of business and consumer purchases that are taxable
at the 4.0 percent rate. All consumer purchases are presumed to be taxable, but
only 21.9 percent of the estimated $8,736.0 million in business purchases is
estimated to be taxable at 4.0 percent.20 An estimated $107.5 million in GET is
due on these taxable sales.
20 Businesses are estimated to make 92 percent of 2003 e-commerce purchases using the methodology adopted here. This is similar to the business share that has been estimated in other studies (see Bruce and Fox, 2004).
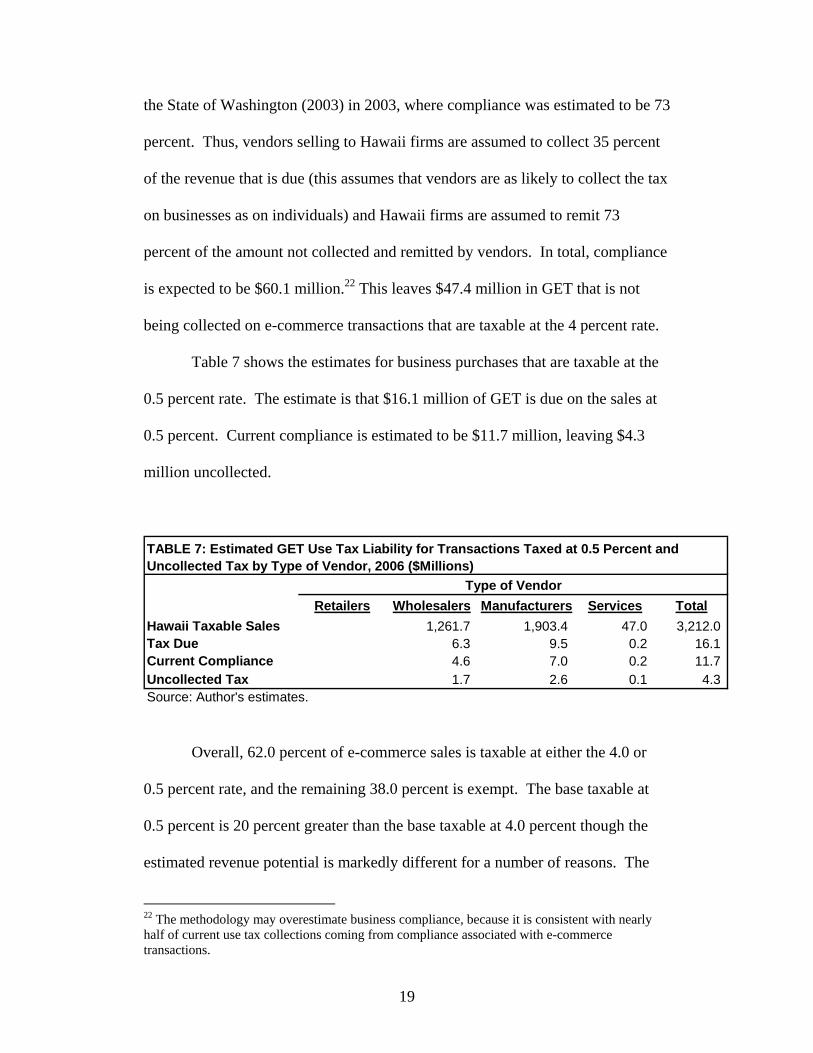
TABLE 7: Estimated GET Use Tax Liability for Transactions Taxed at 0.5 Percent and Uncollected Tax by Type of Vendor, 2006 ($Millions)
Type of Vendor
Overall, 62.0 percent of e-commerce sales is taxable at either the 4.0 or
0.5 percent rate, and the remaining 38.0 percent is exempt. The base taxable at
0.5 percent is 20 percent greater than the base taxable at 4.0 percent though the
estimated revenue potential is markedly different for a number of reasons. The
22 The methodology may overestimate business compliance, because it is consistent with nearly half of current use tax collections coming from compliance associated with e-commerce transactions.
19
higher tax rate is an obvious factor in creating a much higher overall tax liability.
On the other hand, businesses are more likely than individuals to comply with the
GET, so relatively more of the revenue due at the 0.5 percent rate is collected.
A combined $123.6 million of GET is due on e-commerce transactions of
which $51.7 million is currently uncollected. This estimate of uncollected
revenue is about two-thirds of the revenue loss estimated by Bruce and Fox
(2004). Several factors explain the difference. First, the evidence suggests that
vendors are more likely to be collecting and remitting the tax than had been
assumed by Bruce and Fox in earlier studies. Second, the Bruce and Fox
methodology was based on making national estimates and allocating to states. In
doing so, the Bruce and Fox methodology did not allow for multiple tax rates,
which tended to overstate Hawaii’s taxes given that many of the sales are taxable
at the lower rate. Finally, this report accepts the Census classifications of vendors
and uses of goods and services. It is likely that Hawaii administrative practices
categorize more transactions as taxable and classify relatively more transactions
as taxable at the 4.0 percent rate. Thus, the estimates provided here are probably
on the lower end of the revenues associated with remote purchases and the
uncollected extent of these revenues.
It should be noted that the Capital Goods Excise Tax Credit provides
income tax credits that could reduce the net additional revenues received by
Hawaii. The Capital Goods Excise Tax Credit is allowed for GET paid on
eligible, depreciable, personal property. The Credit is not available to taxpayers
who elect immediate expensing under IRC Section 179. Receipt of the credit
20
would reduce total new revenues to Hawaii since lower income tax receipts would
offset GET payments as the credit is realized. The Credit is refundable.
Hawaii’s participation in the SSUTA will increase compliance in the near
term as firms choose to voluntarily comply. The SSUTA reports that 410 firms
have already registered to voluntarily comply with states’ sales taxes.23 These
appear to be firms that have nexus in two to five SSUTA states and are complying
so that they can operate freely across all SSUTA states. If Hawaii were to join the
SSUTA, these same firms would comply with the GET and this would generate
some additional revenue. At this point, Hawaii’s membership in the SSUTA will
expand vendor compliance but much of the revenue will still go uncollected. A
Washington State study concluded that states could expect about 20 percent of
uncollected revenue to be remitted on a voluntary basis. This suggests that
Hawaii can anticipate about $10.3 million in additional receipts, which means
conformity with the SSUTA will provide some important revenues. Over the
longer term, Hawaii’s participation could result in almost all of the estimated
$51.7 million being collected through vendor compliance if either Congress acts
to require vendor compliance or the Supreme Court overturns the Quill case. For
example, the State of Washington estimated 1.3 percent vendor non-compliance
with the sales tax. Nearly all of the uncollected taxes will be obtained if similar
compliance can be obtained through mandatory collection by remote vendors.
23 Based on telephone conversations with SSUTA officials in February 2006.
21
References
Bruce, Donald and William F. Fox. 2004. “State and Local Tax Revenue Losses from E-Commerce: Estimates as of July 2004,” State Tax Notes, August. Fox, William F. 2002. “Should the Hawaii General Excise Tax Look Like Other States’ Sales Taxes?” Report prepared for the 2002 State of Hawaii Tax Review Commission, October 15. Goolsbee, Austan. 1999. “In a World Without Borders: The Impact of Taxes on Internet Commerce,” Quarterly Journal of Economics, Volume 115, No. 2, pp. 561-576. Hawaii Department of Revenue Annual Report, 2004. State of Washington. 2003. “Department of Revenue Compliance Study,” Research Report No. 2003-1, January 17.