ORIGINAL PAPER Importance of tree basic density in biomass estimation and associated uncertainties: a case of three mangrove species in Tanzania Marco Andrew Njana 1 & Henrik Meilby 2 & Tron Eid 3 & Eliakimu Zahabu 4 & Rogers Ernest Malimbwi 4 Received: 26 February 2016 /Accepted: 8 September 2016 /Published online: 13 October 2016 # INRA and Springer-Verlag France 2016 Abstract & Key message Aboveground and belowground tree basic densities varied between and within the three mangrove species. If appropriately determined and applied, basic density may be useful in estimation of tree biomass. Predictive accuracy of the common (i.e. multi-species) models including aboveground/belowground basic density was better than for common models developed without either basic density. However, species-specific models de- veloped without basic density performed better than com- mon models including basic density. & Context Reducing Emissions from Deforestation and forest degradation and the role of sustainable forest management, con- servation and enhancement of carbon stocks (REDD+) initiatives offer an opportunity for sustainable management of forests in- cluding mangroves. In carbon accounting for REDD+, it is re- quired that carbon estimates prepared for monitoring reporting and verification schemes should ensure that all known sources of uncertainty are minimised as much as possible. However, uncer- tainties of applying indirect method of biomass determination are poorly understood. & Aims This study aimed to assess importance of tree basic density in modelling aboveground and belowground biomass and examine uncertainties in estimation of tree biomass using indirect methods. & Methods This study focused on three dominant man- grove species ( Avicennia marina (Forssk.) Vierh, Sonneratia alba J. Smith and Rhizophora mucronata Lam.) in Tanzania. A total of 120 trees were destructive- ly sampled for aboveground biomass, and 30 among them were sampled for belowground biomass. Tree mer- chantable volume and both aboveground and below- ground basic densities were determined. Biomass models including basic density as a predictor variable were de- veloped using the non-linear mixed-effects modelling approach. Handling Editor: Barry Alan Gardiner Electronic supplementary material The online version of this article (doi:10.1007/s13595-016-0583-0) contains supplementary material, which is available to authorized users. * Marco Andrew Njana [email protected]Henrik Meilby [email protected]Tron Eid [email protected]Eliakimu Zahabu [email protected]Rogers Ernest Malimbwi [email protected]1 Tanzania Forest Services (TFS) Agency, P.O. Box 40832, Dar es Salaam, Tanzania 2 Faculty of Science, University of Copenhagen, Rolighedsvej 23, 1958 Frederiksberg C, Denmark 3 Department of Ecology and Natural Resources Management, Norwegian University of Life Sciences, P.O Box 1432, Ås, Norway 4 Department of Forest Mensuration and Management, Sokoine University of Agriculture, P.O. Box 3013, Morogoro, Tanzania Annals of Forest Science (2016) 73:1073–1087 DOI 10.1007/s13595-016-0583-0
Transcript
ORIGINAL PAPER
Importance of tree basic density in biomass estimationand associated uncertainties: a case of three mangrove speciesin Tanzania
Marco Andrew Njana1 & Henrik Meilby2 & Tron Eid3& Eliakimu Zahabu4
&
Rogers Ernest Malimbwi4
Received: 26 February 2016 /Accepted: 8 September 2016 /Published online: 13 October 2016# INRA and Springer-Verlag France 2016
Abstract& Key message Aboveground and belowground tree basicdensities varied between and within the three mangrovespecies. If appropriately determined and applied, basicdensity may be useful in estimation of tree biomass.Predictive accuracy of the common (i.e. multi-species)models including aboveground/belowground basic densitywas better than for common models developed withouteither basic density. However, species-specific models de-veloped without basic density performed better than com-mon models including basic density.& Context Reducing Emissions from Deforestation and forestdegradation and the role of sustainable forest management, con-servation and enhancement of carbon stocks (REDD+) initiativesoffer an opportunity for sustainable management of forests in-cluding mangroves. In carbon accounting for REDD+, it is re-quired that carbon estimates prepared for monitoring reportingand verification schemes should ensure that all known sources of
uncertainty are minimised as much as possible. However, uncer-tainties of applying indirect method of biomass determination arepoorly understood.& Aims This study aimed to assess importance of tree basicdensity in modelling aboveground and belowground biomassand examine uncertainties in estimation of tree biomass usingindirect methods.& Methods This study focused on three dominant man-grove species (Avicennia marina (Forssk.) Vierh,Sonneratia alba J. Smith and Rhizophora mucronataLam.) in Tanzania. A total of 120 trees were destructive-ly sampled for aboveground biomass, and 30 amongthem were sampled for belowground biomass. Tree mer-chantable volume and both aboveground and below-ground basic densities were determined. Biomass modelsincluding basic density as a predictor variable were de-veloped using the non-linear mixed-effects modellingapproach.
Handling Editor: Barry Alan Gardiner
Electronic supplementary material The online version of this article(doi:10.1007/s13595-016-0583-0) contains supplementary material,which is available to authorized users.
& Results Results showed that both tree aboveground andbelowground basic density varied significantly betweensites between tree species, among individuals of the samespecies and between tree components. The use of tree-and component-specific aboveground basic density result-ed in unbiased tree aboveground biomass estimates; how-ever, uncertainties were high when using abovegroundbasic density values from the Global Wood Density(GWD) database. Predictive accuracy of the commonmodels including aboveground/belowground basic densitywas better than for the common models developed previ-ously without basic density. However, the species-specificmodels developed previously without basic density weresuperior to the common models including basic densitydeveloped in the present study.& Conclusion Tree aboveground and belowground basic den-sities were useful in modelling tree aboveground and below-ground biomass, respectively. This is demonstrated by im-proved goodness of fit associated with inclusion of basic den-sity. However, species-specific models developed without ba-sic density performed better than common models includingbasic density. If appropriately determined and applied, basicdensity may be useful in estimation of tree biomass and hencecontribute to improved accuracy of carbon stock estimates forREDD+ and sustainable management of mangroves ingeneral.
Keywords Tree aboveground and belowground biomass .
Inter- and intra-tree basic density variation . Biomassmodels .
Indirect tree biomass estimation .Mixed-effects models
1 Introduction
Mangroves represent about 0.39 % of global forest cover(FAO 2010) and comprise up to 70 tree species, out of which14 are growing naturally along the Eastern Coast of Africa(Saenger et al. 1983; Tomlinson, 1986; Aksornkoae et al.1992). In Tanzania, mangrove forests cover about158,100 ha (MNRT 2015) and include ten different species,namely Avicenia marina (Forssk.) Vierh., Bruguieragymnorrhiza (L.) Lamk., Ceriops tagal (Perr.) C. B. Rob.,Heritiera littoralis Dryand., Lumnitzera racemosa Willd.,Pemphis acidula J.R. & G. Forst., Rhizophora mucronataLam., Sonneratia alba J. Smith, Xylocarpus granatumKoen. and Xylocarpus moluccensis (Lamk.) Roem. Thesespecies also appear in Kenya and Mozambique (Tamoohet al. 2008; Fatoyinbo et al. 2008). A. marina, S. alba andR. mucronata are the most abundant species in Tanzania(Luoga et al. 2004; Nshare et al. 2007).
Mangroves are important for biological, ecological, eco-nomic and protection reasons (Kristensen et al. 2008;Spalding et al. 2010; Nagelkerken et al. 2008; Zhang et al.
2012a). Although mangroves cover relatively small areas,they hold large quantities of carbon per unit area stored inaboveground and belowground biomass (Donato et al. 2011;Duncan et al. 2016). Despite their importance, mangroves arethreatened by deforestation and forest degradation, which ledto a loss of 35% of the world’s mangrove cover between 1980and 2000 (Valiela et al. 2001; Langner et al. 2007).
Given the valuable services offered by mangrove ecosys-tems, their sustainable management is imperative.Unfortunately, most of the services offered by mangroves arenon-market services; which may lead to low motivation foreffective management of mangroves. However, ReducingEmissions from Deforestation and forest degradation and therole of sustainable forest management, conservation and en-hancement of carbon stocks (REDD+) is a potential opportu-nity with an orientation of supporting conservation and sustain-able management of forests such as mangroves (Alongi 2011;Locatelli et al. 2014; Wylie et al. 2016). REDD+ is a system offinancing mechanisms and incentives aimed at mitigating cli-mate change by reducing deforestation and forest degradationbut also through sustainable management of forests and con-servation and enhancement of carbon stocks (Angelsen andHofstad 2008; UNFCCC 2011). Countries participating inREDD+ projects are required to produce accurate estimatesfor their forest carbon stocks and changes through robust mea-surement, reporting and verification (MRV) schemes.
The Intergovernmental Panel on Climate Change (IPCC)emphasises that carbon estimates prepared for MRV schemesshould be accompanied by an appropriate measure of uncer-tainty, while at the same timeminimising all known sources ofuncertainty (IPCC 2006). Based on previous studies, uncer-tainties are likely to occur at each of the following stages inbiomass quantification: (i) sampling design, (ii) field measure-ments, (iii) selection of biomass model and (iv) selection ofbasic density values when used as a biomass predictor variable(Ketterings et al. 2001; Chave et al. 2004; Henry et al. 2010;Clark and Kellner 2012).
Biomass can be quantified in different ways, but most com-monly by applying a biomass model to forest inventory data,leading to single tree or stand and landscape level estimates.Development of biomass models requires destructive samplingof trees. Selected sample trees are felled and partitioned into treecomponents such as stems, branches, and twigs and leaves. Themerchantable part of the tree, i.e. stem and branches defined by aminimum top diameter (IPCC 2006), is then crosscut into billets,which can be measured for fresh weight and/or fresh volumeover bark. Thus, tree aboveground biomass estimates fromwhichcarbon stock is derived may be determined using either (1) directtree aboveground biomass determinationmethodwhich involvesdetermining fresh weight which is converted to dry weight usinga dry to fresh weight ratio or (2) indirect tree aboveground bio-mass determination method which involves determining freshvolume which is converted to dry weight using aboveground
1074 M. A. Njana et al.
basic density. The indirect method is often suggested for sam-pling large trees because the directmethod is labour intensive andcostly (Brown 1997; Picard et al. 2012).
For both direct and indirect methods however, the non-merchantable part of the tree has to be determined for freshweight, which is converted to dry weight using a dry to freshweight ratio estimate. Merchantable and non-merchantabledry weights are then summed to get the total tree dry weight.The total tree dry weight obtained through either of the twomethods of biomass estimation may be used to develop bio-mass models.
For the indirect aboveground biomass determination meth-od, however, the accuracy of determining aboveground biomassbased on the volume of part of a tree (merchantable part) isunknown. Extraction of sub-samples from sample trees for de-termination of both aboveground and belowground basic den-sity without knowledge on how it varies between species, with-in trees, among individuals of the same species and betweensites may introduce uncertainties when such values are appliedas volume to biomass conversion factors or predictor variables.
Most biomass models for mangroves include tree diameterat breast height (dbh) as the only predictor variable (e.g.Komiyama et al. 2005), but some models also include totaltree height (ht) as a second predictor variable (e.g. Komiyamaet al. 2008). Yet, other authors take into account that for sometree species, basic density varies between sites and thereforeinclude this variable as a second or third predictor variable indeveloping models that are valid across sites and species(multi-species models) (e.g. Chave et al. 2005; Komiyamaet al. 2005).
According to Chave et al. (2005), in decreasing order ofimportance, dbh, aboveground basic density and ht are themost important predictor variables of tree abovegroundbiomass. Recently, Njana et al. (2016) reported abovegroundand belowground biomass models for A. marina, S. alba andR. mucronata in Tanzania with dbh only and both dbh and htas predictor variables. The main argument for not includingbasic density as predictor variable in the models for the pur-pose of improving their predictive accuracy was that the non-linear mixed-effects modelling approach was regarded as suf-ficiently robust in distinguishing species when using speciesas a random-effects variable. Conversely, assuming that basicdensity varies between trees and sites, its inclusion may po-tentially make the models more accurate when applied at amangrove site outside the sampling frame.
To minimise propagation of uncertainties in subsequentstages of biomass estimation at stand or landscape levels, itis important that uncertainties in tree or sub-tree biomass esti-mates are identified, quantified and minimised. Focusing onthe three dominant mangrove species in Tanzania, A. marina,S. alba and R. mucronata, our study therefore aimed (i) todetermine and assess variations of tree aboveground and be-lowground basic density between and within species; (ii) to
test the hypothesis that during destructive sampling, the indi-rect method of determining tree aboveground biomass (fromvolume using aboveground basic density as a conversion fac-tor) yields as accurate estimates as does the direct method(actual weighing) and (iii) to investigate the importance ofincluding aboveground and belowground basic density as apredictor variable of tree aboveground and belowground bio-mass, respectively.
2 Methods
2.1 Study area
The present study was carried out at four sites along the coast-line of Tanzania. The sites included Pangani (5° 38′ S, 38° 54′E to 5° 40′ S, 38° 53′ E), Bagamoyo (6° 20′ S, 38° 50′ E to 6°33′ S, 39° 06′ E), Rufiji (7° 38′ S, 39° 16′ E to 7° 55′ S, 39° 24′E) and Lindi (10° 02′ S, 39° 39′ E)-Mtwara (10° 23′ S, 40° 23′E). The climate in the study area is influenced by north-eastmonsoon winds from October to March and south-east mon-soon winds from April to October. Average annual rainfallvaries from 879 mm (Rufiji) to 1240 mm (Pangani) whileaverage annual temperatures range from 25.7 °C (Lindi) to27.0 °C (Rufiji).
2.2 Plot sampling, measurements of standing treesand tree selection
Generally, site conditions in mangrove forests vary across andnot along the sea or river shores. To cover as much variation aspossible, we established 37 transects running from the edge ofthe sea or river across the entire expanse of the mangrovevegetation. Within each transect, one to four circular plotswere established, the first plot being located close to the edgeof the sea/river (for details, see Njana et al. 2015). The remain-ing plots were distributed along the transect lines with inter-vals ranging from 150 to 250 m. A total of 120 plots wereestablished using a nested plot design.
Within each plot, one tree was selected for destructive sam-pling, thus making up a total of 120 trees (40 for each of thethree species, A. marina, S. alba and R. mucronata). Amongthe 120 trees (sampled for aboveground basic density, above-ground biomass and aboveground merchantable fresh vol-ume), roots of 30 trees (10 for each of the three species) wereexcavated for determination of tree belowground basic densityand belowground biomass. Fifteen trees (5 for each species)were sampled at each of the sites in Pangani and Lindi-Mtwara, and 45 trees (15 for each species) were sampled ateach of the sites in Bagamoyo and Rufiji.
The sample trees were selected purposively to ensure ade-quate representation of each of the three species across sitesand dbh ranges. In the selection of trees for root excavation
Tree basic density and biomass estimation 1075
(n = 30), the feasibility of belowground sampling was alsoconsidered to make excavation less destructive. The samplingprocedures are detailed by Njana et al. (2015).
For all sample trees of A. marina and S. alba, wemeasured dbh and ht. For R. mucronata, we measuredthe same parameters, but ht was measured from thehighest stilt root to the highest living part of a tree.Three R. mucronata sample trees were multi-stemmed.For these trees, diameters of individual stems (dbhi)were combined and a surrogate for dbh was determined
as dbh ¼ffiffiffiffiffiffiffiffiffiffiffiffiffiffiffiffiffiffi∑ dbhið Þ2
q(e.g. Zhou et al. 2007). Diameters
of trees harvested for aboveground biomass estimationranged from 1.1 to 70.5, 1.1 to 63.6 and 1.4 to 41.5 cmfor A. marina, S. alba and R. mucronata respectively.Similarly, for excavated trees, diameter varied from 3.0to 38.6 cm for A. marina, 6.5 to 33.8 cm for S. albaand 1.4 to 32.6 cm for R. mucronata. Details areprovided by Njana et al. (2015) and Njana et al. (2016).
2.3 Destructive sampling
The sampling aimed at generating data for determinationof tree aboveground basic density, aboveground bio-mass, aboveground fresh volume, belowground basicdensity and belowground biomass. Basic density is de-fined as oven-dry mass divided by fresh volumeexpressed in tons per cubic metre, kilograms per cubicmetre or grams per cubic centimetre (Williamson andWiemann 2010; Wiemann and Williamson 2012).Aboveground tree components included stem, branchand twig and leaf, while belowground tree componentsincluded root crown and root (see Njana et al. 2016).
Using a chainsaw, sample trees were cut 15 cmabove the soil surface (A. marina and S. alba) or im-mediately above the highest stilt root (R. mucronata).After felling a tree, the aboveground part was dividedinto three components, (i) stems, (ii) branches (≥5 cmdiameter) and (iii) twigs (<5 cm diameter), and leavesfor trees with dbh ≥15 cm. Stems and branches werecross-cut into billets. Fresh weights of large billets (di-ameter ≥5 cm) were determined using a spring balance(to the nearest 0.1 kg).
Furthermore, for each sample tree with dbh ≥15 cm, thecross-cut stem and branch billets (diameter ≥5 cm) were re-corded for mid-diameter (cm) and length (m) in order to de-termine merchantable volume. By merchantable volume, wemean the volume of the tree including stem and branches to afixed top diameter of 5 cm. The number of trees with dbh≥15 cm were 22 (A. marina), 12 (S. alba) and 21(R. mucronata).
From each sample tree, we extracted three sub-samplesfrom stems, two from branches and two from twigs for
determination of aboveground basic density and dry to freshweight ratio. All sub-samples included bark (Fearnside 1997;Somogyi et al. 2007). Sub-samples from all aboveground treecomponents except for stems were extracted at random. Forstems, sub-samples were extracted at 0, 40 and 70 % of totaltree height (e.g. Githiomi and Kariuki 2010).
To determine belowground basic density and belowgroundbiomass, root crown and roots were excavated. For A. marinaand S. alba, the belowground part consisted of root crown androots (see Fig. 1); for R. mucronata, it consisted of root crown,aboveground stilt roots and belowground stilt roots (seeFig. 2). For A. marina and S. alba, belowground biomasswas quantified using a root sampling approach (not all rootswere excavated). Root crown and selected roots were fullyexcavated and their dry weights recorded. Basal diameter forboth excavated and unexcavated roots were recorded. ForR. mucronata, roots were excavated entirely and root crownand all aboveground stilt roots were harvested. All below-ground stilt roots were also fully excavated (see Njana et al.2015). For all the three species, sub-samples from the rootcrown were collected by slicing the root crown from the topand downwards so as to secure an appropriate vertical repre-sentation. In addition, sub-samples were extracted from ran-domly selected locations along the length of main and sidecable roots (A. marina and S. alba). For R. mucronata, inaddition to sub-samples from the root crown, sub-sampleswere also collected from randomly selected locations onaboveground and belowground stilt roots.
After extraction of sub-samples, their fresh weight wasimmediately determined using a digital balance (to the nearest0.01 g). This was followed by labelling and packing for fur-ther measurements in the laboratory.
2.4 Laboratory procedures
In the laboratory, sub-samples were soaked in distilled waterand fresh volume determined by water displacement (Brown1997). Subsequently, sub-samples were oven-dried to con-stant weight at 105 °C and their dry weight determined usinga digital balance (Picard et al. 2012).
2.5 Determination of basic density, dry to fresh weightratio, tree biomass and volume
For each tree component sub-sample, basic density was deter-mined as oven-dry weight (g) per fresh volume (cm3). Dry tofresh weight ratio was determined as the ratio of sub-sampledry to fresh weight. Exploratory analysis of covariance(ANCOVA) for dry to fresh weight ratios, where dbh servedas a covariate, revealed that they varied significantly betweenaboveground tree components and with tree size (p < 0.05).
Total observed fresh weight of each aboveground compo-nent was obtained by summation. Total observed tree
1076 M. A. Njana et al.
aboveground biomass was calculated as the sum of the prod-ucts of tree- and component-specific fresh weights and dry tofresh weight ratios (Eq. 1).
AGBiobs ¼Xjs¼1
ns
FWi js
� �*DFi js
!þ
Xjb¼1
nb
FWi jb
� �*DFi jb
!
þXjt¼1
nt
FWi jt
� �*DFi jt
!þ
Xjl¼1
nl
FWi jl
� �*DFi jl
!
ð1Þwhere n = total number of billets/twig bundles/leaf weights fora given aboveground tree component, s = stem, b = branch,t = twig, l = leaf, i = ith tree, j = jth sub-section/bundle of twigs
or leaves, AGBiobs = observed total tree aboveground dryweight (kg), FWi js ; FWi jb ; FWi jl and FWi jl are stem, branch,twig and leaf fresh weights (kg) respectively and DFi js , DFi jb ,DFi jt and DFi jl are stem, branch, twig and leaf dry to freshweight ratios, respectively.
The volume of individual billets was computed usingHuber’s formula (e.g. West 2009). Merchantable volumewas calculated as the sum of the volumes of all billets for eachtree component (stem, branches). We applied tree- andcomponent-specific aboveground basic density values to con-vert merchantable volume to biomass. Tree-specific andspecies-specific mean aboveground basic density values fromthis study were also tested. In addition, we applied species-
Cable root lengthRoot crown
Side cable root
Main cable root
PneumatophoresFeeder root
Anchor root
Stem
Cable root basal diameter
15 cm
Fig. 1 A. marina and S. alba treeroot system (modified fromPurnobasuki 2013); the dashedlines indicate cut-off pointsbetween root crown and maincable roots and between maincable roots and side cable roots
Ground level
Root crown
Stem
Stilt root
Above ground
Below ground
Fig. 2 R. mucronata tree rootsystem; the dashed lines indicatecut-off points between root crownand stilt roots
Tree basic density and biomass estimation 1077
specific aboveground basic density values from the GlobalWood Density (GWD) database (Chave et al. 2009; Zanneet al. 2009). The estimated tree aboveground biomass wascalculated using Eq. 2.
AGBiest ¼Xjs¼1
ns
FVi js
� �*BDi js
!þ
Xjb¼1
nb
FVi jb
� �*BDi jb
!
þXjt¼1
nt
FWi jt
� �*DFi jt
!þ
Xjl¼1
nl
FWi jl
� �*DFi jl
!
ð2Þwhere n = total number of billets/twig bundles/leaf weights fora given aboveground tree component, s = stem, b = branch,t = twig, l = leaf, i = ith tree, j = jth sub-section/bundle of twigsor leaves, AGBhest = estimated total tree aboveground dryweight (kg), FVi js and FVi jb are stem and branch fresh volume(m3), respectively and BDi js and BDi jb are stem and branchbasic density values, respectively. Other abbreviations are asdefined previously.
Using excavated cable root data (A. marina and S. alba),regression models were developed with root dry weight as aresponse variable and basal root diameter as a predictor variable(see Njana et al. 2015). The dry weight models were then appliedto predict dry weights of unexcavated roots. Total belowgroundbiomass was derived as the sum of the dry weights of root crownand roots (excavated and unexcavated). For R. mucronata, be-lowground biomass included root crown and aboveground andbelowground stilt roots as defined by Komiyama et al. (2005),Ong et al. (2004) and Comley and McGuinness (2005).
2.6 Statistical data analysis
Data was analysed using R software (R Core Team 2013). Weinitially analysed variation of aboveground and belowgroundbasic density between species followed by determination ofinter- and intra-tree basic density variation. To prepare a basisfor analysing inter-tree basic density variation, mean above-ground and belowground basic densities were calculated foreach tree. The potential determinants of inter-tree basic densi-ty variation were selected based on previous studies (e.g.Zhang et al. 2012b; Auty et al. 2014) which included numberof trees per hectare (N) (no. of trees ha−1), basal area perhectare (G) (m2 ha−1), dbh class (10 cm classes) and study site.
Variation of aboveground and belowground basic densitybetween tree species was determined using linear mixed-effects model (LMM) procedures (Gałecki and Burzykowski2013), where species served as a fixed-effects variable. Theuse of LMMwasmotivated by the hierarchical structure of thedata used in this study since tree basic density observationswere nested within site; site was considered as a random-effects variable. Model fitting was done using the lme function
in the nlme package. The significance of species differences inexplaining the variation of basic density was determined by Ftests. Post hoc tests were carried out using the glht function inmultcomp package (Bretz et al. 2011).
Preliminary analysis indicated thatN,G and dbh class wereeither uncorrelated or approximately linearly related with treebasic density. Therefore, for each of the three species, theinfluence of these variables on aboveground and belowgroundbasic density, together with study site, was determined usingLMM. In this case N, G, dbh class and site served as fixed-effects variables. Models were fitted as described earlier.
We also determined variation in aboveground and below-ground basic density between tree components (intra-treevariation) using LMMs. In this case, tree component wastreated as a fixed-effects variable. Subsequently, variation ofaboveground and belowground basic density within tree com-ponent was examined. For stems, the analysis considered var-iation along stem (i.e. intra-tree variation) using data from thethree different sampling heights, i.e. 0, 40, and 70 % of totaltree height. Since basic density data were nested, they wereanalysed using LMM where stem absolute sampling heightwas treated as a fixed-effects variable (stem) and site and treeas random-effects variables (all components). Model fittingand post hoc tests followed procedures described previously.
Ninety-five percent confidence intervals for both observedtree aboveground biomass (i.e. obtained using the direct meth-od involving actual weighing and derived using Eq. 1) andestimated tree aboveground biomass (i.e. obtained indirectlyusing products of volume and aboveground basic density andderived using Eq. 2) were determined. Subsequently, accuracyof the indirect method of aboveground biomass determinationwas assessed using percentage mean prediction error (MPE(%)) calculated as average of estimated aboveground biomassminus observed aboveground biomass relative to observedaboveground biomass. Positive MPE (%) values and signifi-cantly different from zero signified over-estimation of treeaboveground biomass (i.e. positive bias). Similarly, negativeMPE (%) values and significantly different from zero signifiedunder-estimation of tree aboveground biomass (i.e. negativebias). Conversely, tree aboveground biomass estimates withnon-significant MPE (%) values were considered unbiased(Walther and Moore 2005; IPCC 2003).
Explorative analysis revealed that the relationships be-tween aboveground and belowground biomass and dbh werenon-linear (Njana et al. 2016). We therefore initially testedseveral options to describe the non-linear relationships (e.g.second-order polynomial function, exponential function)where the power function was the best. The power functionhas also been widely used to describe similar relationships(e.g. Komiyama et al. 2008). Therefore, using Eqs. 3 and 4,aboveground biomass and belowground biomass models weredeveloped using the non-linear mixed-effects modelling(NLME) approach (Pinheiro and Bates 2000):
1078 M. A. Njana et al.
Bikm ¼ β0*dbhikmβ1þαkmð Þ*BDikm
β2 þ εikm ð3ÞBikm ¼ β0*dbhikm
β1þαkmð Þ*htikmβ2*BDikmβ3 þ εikm ð4Þ
where Bikm is either aboveground biomass or belowgroundbiomass (kg tree−1) of tree i for species k in site m; BDikm iseither aboveground or belowground basic density of tree i forspecies k in site m; β0, β1 and β2 are fixed-effects parameters;αkm is a random-effects parameter for species k in site m (as-sociated with β1); dbhikm and htikm are the dbh and ht of tree i,respectively, and ɛikm is the error term for tree i, species k atsitem,which is assumed to be normally distributed with mean0 and variance σ2. Model fitting was done using the nlmefunction in the nlme package.
To assess the importance of basic density in modelling treeaboveground and belowground biomass, models based onEqs. 3 and 4 above were compared with common models(CMs)/fixed-effects (FE) models (FE1, FE2 and FE3) andtheir corresponding species-specific models/random-effects(RE) models (RE1, RE2, RE3, RE4, RE5, RE6, RE7, RE8and RE9) reported recently by Njana et al. (2016) (seeTable A1; Online Appendix).
Models based on Eq. 3 were compared with models FE1and FE3, while models based on Eq. 4 were compared withmodel FE2. Common models including basic density werealso compared with species-specific models developed previ-ously without basic density (Njana et al. 2016). Model com-parison for the purpose of determining the importance ofaboveground and belowground basic density inmodelling treebiomass was possible because Eq. 3 is a reduced version ofEq. 4 and because the models are based on the same data andmodelling approach. If inclusion of aboveground or below-ground basic density in a model resulted in lower percentageMPE (%) and Akaike information criteria (AIC), the modelswere considered as improved, thus implying that abovegroundand belowground basic density was useful in modelling treeaboveground and belowground biomass, respectively.
3 Results
3.1 Basic density values and variations
Basic density values for aboveground and belowgroundtree components as well as whole trees (overall) aresummarised in Table 1. Results based on LMM revealeda significant variation of tree aboveground basic density(F (2, 112) = 195.41, p < 0.001) and belowground basicdensity (F (2, 23) = 29.34, p < 0.001) between species. Posthoc tests for multiple comparisons indicated that allpairwise comparisons were significant at the 0.1 % level,except for the belowground basic densities of A. marina
and R. mucronata, which were not significantly different(p > 0.05).
Mixed results were observed for factors considered as de-terminants for variation in basic density (Table 2). In mostcases, the relationships based on Spearman correlation wereweak and statistically insignificant (p ≥ 0.05), especially forbelowground basic density for all the three species. Strongrelationships were observed between aboveground basic den-sity and N (A. marina), aboveground basic density and G(S. alba) and aboveground basic density and dbh (S. albaand R. mucronata). Similarly, site was a significant source ofvariation for aboveground basic density (S. alba andR. mucronata). The relationship between aboveground basicdensity and dbh was generally positive and non-linear whilethe relationship between belowground basic density and dbhwas positive and linear for all the three species (Table 2).
For aboveground basic density, the intra-tree variation wassignificant for R. mucronata and S. alba while for below-ground basic density, it was significant for A. marina andR. mucronata (Table 3). The results also showed that withinthe stem component, basic density varied with samplingheight. The variation was significant for S. alba (F(1,
114) = 7.80, p < 0.001) but not for the other two species. Forother tree components, basic density varied significantlyamong twigs (p < 0.05) and branches (p < 0.01) forA. marina, among roots (p < 0.01) for S. alba and amongbelowground stilt roots (p < 0.01) for R. mucronata. In allother cases, the variations within tree components were statis-tically insignificant (p ≥ 0.05).
3.2 Accuracy and precision of tree aboveground biomassestimation using aboveground basic densityas a conversion factor
The use of tree- and component-specific basic density in esti-mation of tree aboveground biomass (using Eq. 2) resulted inunbiased tree aboveground biomass estimates (p > 0.05) forall three species (Table 4). On the other hand, the use ofspecies-specific mean (overall) from this study (Table 4) orfrom the GWD database resulted in biased tree abovegroundbiomass estimates (p < 0.05) for S. alba and R. mucronata.
3.3 Importance of basic density in modelling treeaboveground and belowground basic density
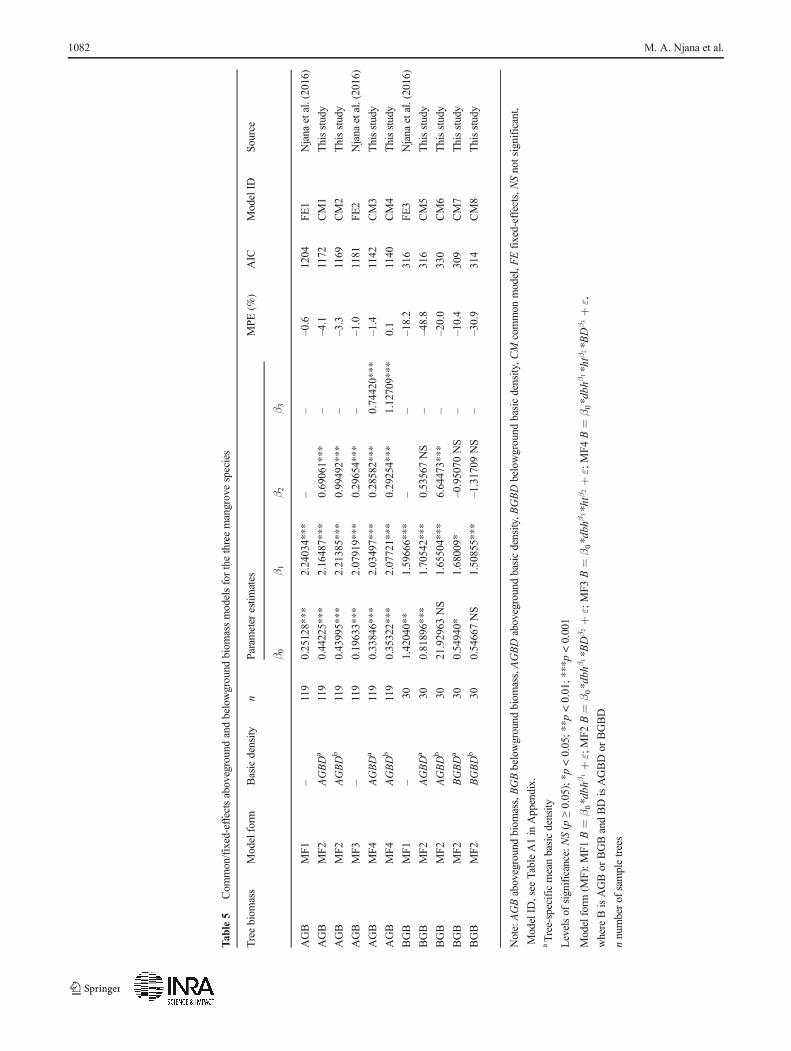
The importance of using aboveground and belowground basicdensity in modelling tree aboveground and belowground bio-mass, respectively was examined through development ofaboveground or belowground biomass models includingaboveground and belowground basic density as a predictorvariable and comparing these models with models includingdbh only and dbh and ht reported previously by Njana et al.(2016) (Table 5). The use of site and species as random-effects
Tree basic density and biomass estimation 1079
variables seemingly improved the goodness of fit, but theparameter estimates were not significant and the models weretherefore not reported.
Inclusion of tree-specific mean aboveground basic densityand species-specific mean aboveground basic density in thetree aboveground biomass models resulted in a decline of AICwhen our common models (CM1, CM2, CM3 and CM4,Table 5) were compared with those reported by Njana et al.(2016) (FE1 and FE2, Table A1, Online Appendix). Amongthe tree aboveground biomass models developed in this study,the common models based on species-specific mean
aboveground basic density (CM2, CM4) gave the best resultas indicated by the lowest AIC. Notwithstanding the fact thatthe significance of the parameters used in these models is verydifferent from the calculations of tree aboveground biomass(Table 4), it is interesting that the use of species-specific meanaboveground basic density in modelling tree abovegroundbiomass resulted in lower AIC (Table 5).
With reference to the model reported by Njana et al. (2016)for tree belowground biomass (FE3), neither tree-specific norspecies-specific mean aboveground basic density was useful inmodelling tree belowground biomass since their inclusion in the
Table 1 Descriptive statistics on distribution of tree aboveground and belowground basic density (g cm−3) for the three mangrove species
Basic density/component
A. marina S. alba R. mucronata
n Mean ± SE STD Min. Max. n Mean ± SE STD Min. Max. n Mean ± SE STD Min. Max.
Note: Since basic density varies between trees, the basic density average values represent weighted mean using tree aboveground biomass for above-ground basic density and tree belowground biomass for belowground basic density as weights.
SE standard error of a mean, n number outside brackets represents of sample trees while those in brackets represent sub-samples extracted from sampletrees
Table 2 Inter-tree aboveground and belowground basic density variation for three mangrove species
Sources of variation Category A. marina S. alba R. mucronata
N number of trees per hectare,G basal area per hectare, AGBD aboveground basic density,BGBD belowground basic density, r Spearman correlation,NSnot significant at the 5 % level
*Significant at the 5 % level; **significant at the 1 % level; ***significant at the 0.1 % level
1080 M. A. Njana et al.
models resulted in a higher AIC. On the other hand, inclusion ofspecies and tree-specific mean belowground basic density result-ed in lowerAIC. In this regard, themodelwith tree-specificmeanbelowground basic density (CM7) exhibited the best results.
Figure 3 summarises 95 % confidence intervals of ob-served and predicted tree aboveground and belowgroundbiomass. Predicted values are based on both commonand species-specific models. Generally, the resultsshowed that the species-specific models based on dbhonly (RE1, RE2, RE3, RE7, RE8 and RE9) and on bothdbh and ht (RE4, RE5 and RE6) reported by Njana et al.(2016) were more accurate than the common models de-veloped in this study (CM1, CM2, CM3, CM4, CM5,CM6, CM7 and CM8) and those reported by Njanaet al. (2016) (FE1, FE2 and FE3).
For aboveground biomass, however, the differences inpredictive power between the models were minimal(Fig. 3). For belowground biomass, the species-specificmodels reported by Njana et al. (2016) performed gener-ally well. However, the performance of the common be-lowground biomass model (FE3) reported by Njana et al.(2016) varied with species and gave larger uncertaintiesthan the common models developed in this study (CM5,CM6, CM7 and CM8).
4 Discussion
This study reports tree aboveground and belowground basicdensity values for three mangrove species in Tanzania. To our
Table 4 Accuracy and precision of tree aboveground biomass estimation using aboveground basic density as a conversion factor
Species Basic density applieda nb 95 % confidence intervals (kg) MPE(%)
Observed abovegroundbiomass
Estimated abovegroundbiomass
A. marina Tree- and component-specific mean from thisstudy
22 761.5 ± 259.5 763.2 ± 273.2 +0.2 NS
Tree-specific mean from this study 22 761.5 ± 259.5 759.5 ± 272.9 −0.3 NS
Species-specific mean from this study (overall) 22 761.5 ± 259.5 756.9 ± 278.5 −0.6 NS
S. alba Tree- and component-specific mean from thisstudy
12 536.3 ± 181.6 537.0 ± 192.9 +0.1 NS
Tree-specific mean from this study 12 536.3 ± 181.6 526.3 ± 185.3 −1.9 NS
Species-specific mean from this study (overall) 12 536.3 ± 181.6 491.6 ± 158.8 −8.3*GWD database species-specific mean 12 536.3 ± 181.6 498.4 ± 161.5 −7.1*
R. mucronata Tree- and component-specific mean from thisstudy
21 611.4 ± 167.7 600.7 ± 166.4 −1.7 NS
Tree-specific mean from this study 21 611.4 ± 167.7 577.4 ± 157.7 −5.6***Species-specific mean from this study (overall) 21 611.4 ± 167.7 561.9 ± 150.0 −8.1***GWD database species-specific mean 21 611.4 ± 167.7 649.2 ± 174.3 +6.2***
NS not significant at the 5 % levela Basic densities from the Global Wood Density (GWD) database were 648 kg m−3 (A. marina), 509 kg m−3 (S. alba) and 814 kg m−3 (R. mucronata)
n Number of sample trees b Includes only trees with dbh ≥15 cm
*Significant at the 5 % level; **significant at the 1 % level; ***significant at the 0.1 % level
Table 3 Intra-tree abovegroundand belowground basic densityvariation for three mangrovespecies
Source of variation Category A. marina S. alba R. mucronata
Note: For aboveground basic density, the tree components include stem, branch and twig; for belowground basicdensity, they include root crown and root
AGBD aboveground basic density, BGBD belowground basic density, NS not significant at the 5 % level
*Significant at the 5 % level; **significant at the 1 % level; ***significant at the 0.1 % level
Tree basic density and biomass estimation 1081
Tab
le5
Com
mon/fixed-effectsabovegroundandbelowground
biom
assmodelsforthethreemangrovespecies
Treebiom
ass
Modelform
Basicdensity
nParameter
estim
ates
MPE
(%)
AIC
ModelID
Source
β0
β1
β2
β3
AGB
MF1
–119
0.25128***
2.24034***
––
–0.6
1204
FE1
Njana
etal.(2016)
AGB
MF2
AGBDa
119
0.44225***
2.16487***
0.69061***
––4.1
1172
CM1
Thisstudy
AGB
MF2
AGBDb
119
0.43995***
2.21385***
0.99492***
––3.3
1169
CM2
Thisstudy
AGB
MF3
–119
0.19633***
2.07919***
0.29654***
––1.0
1181
FE2
Njana
etal.(2016)
AGB
MF4
AGBDa
119
0.33846***
2.03497***
0.28582***
0.74420***
–1.4
1142
CM3
Thisstudy
AGB
MF4
AGBDb
119
0.35322***
2.07721***
0.29254***
1.12709***
0.1
1140
CM4
Thisstudy
BGB
MF1
–30
1.42040**
1.59666***
––
–18.2
316
FE3
Njana
etal.(2016)
BGB
MF2
AGBDa
300.81896***
1.70542***
0.53567NS
––48.8
316
CM5
Thisstudy
BGB
MF2
AGBDb
3021.92963
NS
1.65504***
6.64473***
––20.0
330
CM6
Thisstudy
BGB
MF2
BGBDa
300.54940*
1.68009*
–0.95070
NS
––10.4
309
CM7
Thisstudy
BGB
MF2
BGBDb
300.54667NS
1.50855***
–1.31709
NS
––30.9
314
CM8
Thisstudy
Note:AGBabovegroundbiom
ass,BGBbelowground
biom
ass,AGBDabovegroundbasicdensity,B
GBDbelowground
basicdensity,C
Mcommon
model,F
Efixed-effects,NSnotsignificant,
ModelID
,see
TableA1in
Appendix.
aTree-specificmeanbasicdensity
Levelsof
significance:N
S(p
≥0.05);*p
<0.05;*
*p<0.01;*
**p<0.001
Modelform
(MF):M
F1B¼
β0*dbh
β1þε;MF2
B¼
β0*dbh
β1*B
Dβ2þε;MF3
B¼
β0*dbh
β1*htβ
2þε;MF4B¼
β0*dbh
β1*htβ
2*B
Dβ3þε,
where
BisAGBor
BGBandBDisAGBDor
BGBD
nnumberof
sampletrees
1082 M. A. Njana et al.
knowledge, this is the first study to report belowground basicdensity for the three mangrove species. For a given species, itmay be expected that different studies would yield similarvalues of tree basic density. Komiyama et al. (2005) reporteda tree aboveground basic density value similar to our study for
R. mucronata. However, Komiyama et al. (2005) reportedaboveground basic density values of 0.48 ± 0.05 g cm−3
(STD) (S. alba) while Jachowski et al. (2013) reported above-ground basic density of 0.41 ± 0.04 g cm−3 (STD) for S. alba.The aboveground basic density values reported in these
(−
(−)
)
(a)
(b)
Fig. 3 Comparison of predictiveaccuracy of aboveground biomass(AGB) (a) and belowgroundbiomass (BGB) (b) models (cf. listof models from Njana et al.(2016) and Table 5 and Table A1in Online Appendix). The barsrepresent mean values with theircorresponding lower and upper95 % confidence limits. The greydotted lines indicate 95 %confidence limits for observedtree biomass values (Obs)
Tree basic density and biomass estimation 1083
studies are thus different from each other and very differentfrom the aboveground basic density value of 0.54 ± 0.04 g cm−3
(STD) estimated for S. alba in our study (Table 1).The tree aboveground basic density values reported in our
study also deviate from those reported in the GWD database(Chave et al. 2009; Zanne et al. 2009), where the values varyconsiderably. For example, tree aboveground basic densityvalues for A. marina vary from 0.52 to 0.73 g cm−3 whilefor S. alba they vary from 0.39 to 0.63 g cm−3 (Chave et al.2009; Zanne et al. 2009). The variation of these values ex-ceeds the ranges (minimum–maximum) of the tree above-ground basic density values observed in our study for the samespecies. The variations of aboveground basic density notedbetween different studies may be due to, for example, differ-ences in site conditions, basic density determination methods,sampling design and sample size. For instance, many above-ground basic density values reported in the GWD databasewere prepared to describe wood mechanical properties andmay therefore be based on small samples from very few sites,thus reducing the generality of such basic density estimates.Generally, the variation in basic density between studies limitsthe reliability of results generated using aboveground basicdensity values as conversion factors for estimation of treeaboveground biomass.
We also found variation in basic density at species level,between trees (inter-tree) and within trees between treecomponents (intra-tree), and in some cases the variationwas significant (Tables 2 and 3). Factors responsible forthe between-tree variation included variation in N, G, treesize (dbh) and site. All these factors were tested (Table 2),but their effects on basic density were mostly weak, par-t icularly on belowground basic densi ty. Geneticdifferences may also explain variation in abovegroundand belowground basic density between trees. Withintrees, for example, basic density variation along stemmay be due to variation in the proportion of wood versusbark, heartwood versus sapwood, proportion of juvenilewood and growth ra t e . In our s tudy, however,aboveground and belowground basic density values didnot vary significantly between sites for A. marina.Contrary to our findings, Saintini et al. (2012) found dif-ferent aboveground basic density values at different sitesfor A. marina. Saintini et al. (2012) reported that thegrowth rate of A. marina was positively correlated withxylem vessel size and aboveground basic density and con-cluded that high wood density was associated with largexylem vessels and thick fibre walls. Similarly, in our studywe found that aboveground basic density values were sig-nificantly correlated with dbh (S. alba and R. mucronata,Table 3) implying that aboveground basic density increaseswith tree size up to a particular threshold.
The variation of aboveground and belowground basic den-sity between and within tree components observed in our
study generally showed the importance of implementing anappropriate sampling strategy for determination of basic den-sity values for biomass estimation and related applications.The nature of variation in basic density with stem samplingheight for example suggests that sampling for abovegroundbasic density should ensure that basic density variation alongthe stem is sufficiently accounted for. Sampling of basic den-sity at a fixed tree height by e.g. coring or disc extraction at1.3 m (Williamson and Wiemann 2010) for trees of differentsizes is likely to provide a good description of abovegroundand belowground basic density variation with dbh but ignoresbasic density variation between and within tree components.
We also tested the accuracy of indirect method for estima-tion of tree aboveground biomass where volume is first deter-mined and then converted from volume to dry weight usingaboveground basic density as conversion factor (Table 4).Both the direct and indirect method may be employed whensampling and measuring trees to generate data for the purposeof modelling (Brown 1997; Picard et al. 2012). The use ofindirect method is particularly recommended for large treesas a means of reducing costs (Brown 1997). The results fromour study showed that direct and indirect methods for estima-tion of tree aboveground biomass gave consistent and unbi-ased estimates of tree aboveground biomass when applyingtree- and component-specific aboveground basic densityvalues (Table 4).
The relatively large and significant MPE values thatwere found when applying species-specific abovegroundbasic density from the GWD database (S. alba andR. mucronata, Table 4) indicate that basic density sourcedfrom the GWD database may lead to biased local biomassestimates. This calls for inclusion of all sources of varia-tion in determination of aboveground basic density as avolume to dry weight conversion factor and shows thatbasic density values from the GWD database need to beused with caution. Uncertainty due to the use of basicdensity as a conversion factor may be propagated intosubsequent stages of biomass estimation, for examplewhen tree aboveground biomass estimates are used inmode l d eve l opmen t ( e . g . Hen ry e t a l . 2010 ;Mwakalukwa et al. 2014). Both uncertainty due to above-ground basic density and the model itself affect estimatesat the tree, stand and landscape levels. This is also thecase when landscape tree volume estimates are convertedinto tree aboveground biomass using aboveground basicdensity (IPCC 2006; Somogyi et al. 2007).
Based on the conservative principle that the risk of over-and under-estimation should be minimised (Grassi et al.2008), during destructive sampling for estimation of treeaboveground biomass, we recommend the direct method(weighing) for estimation of tree aboveground biomass. Theindirect method should only be applied when it is not practi-cally feasible to use the direct method (e.g. very large trees).
1084 M. A. Njana et al.
The following considerations are also essential in order tominimise uncertainties; when using the indirect method,tree- and component-specific aboveground basic densityvalues should be applied. Moreover, when using the indirectmethod, we recommend working with a large number of ob-servations (sample size ≥30) which helps ensuring normallydistributed residuals and unbiased estimates.
This study also examined the importance of using above-ground and belowground basic density in modelling above-ground and belowground biomass, respectively. Generally,species-specific mean aboveground and belowground basicdensities were significant in explaining variations of treeaboveground and belowground biomass, respectively(Table 5). This points to the importance of applying above-ground basic density as a predictor variable for abovegroundbiomass and belowground basic density as a predictor variablefor tree belowground biomass, contrary to the existing prac-tice of applying aboveground basic density in modelling treebelowground biomass (e.g. Komiyama et al. 2005).
The results obtained in this study demonstrated that evenwith the use of mixed-effects modelling approach, inclusionof aboveground and belowground basic density as predictorvariables for tree aboveground and belowground biomass re-spectively further improved goodness of fit of fixed-effectsmodels (Table 5). This result is contrary to what was sug-gested by Njana et al. (2016) where the authors argued thatit was not necessary to include aboveground and/belowground basic density in order to improve the predictiveaccuracy of the models since the non-linear mixed-effectsmodelling approach is robust in distinguishing species usingspecies as a random-effects variable.
The fact that basic density values in our data varied signif-icantly between species and that the predictive accuracy of thecommon models including species-specific mean above-ground basic density were better than the common modelsbased on dbh only, or dbh and ht (Table 5) demonstrates theimportance of including basic density when modelling treebiomass for multiple species data. Similarly, previous studieshave successfully developed common biomass models formixed species mangrove forests by incorporating above-ground basic density (e.g. Komiyama et al. 2005; Chaveet al. 2005). Whether these studies developed their commonaboveground biomass models using tree-specific above-ground basic density or species-specific mean abovegroundbasic density or both is not clear. If both tree-specific andspecies-specific mean basic density values are mixed up inmodelling tree biomass, they are likely to lead to confoundingeffects (i.e. model quality will be affected by a mix of bothtree-specific and species-specific mean basic density varia-tions).Mixing up tree-specific and species-specific mean basicdensity values should therefore be avoided. Instead, for caseswhere basic density varies between species and with tree size,and where tree basic density data or basic density models are
available, tree biomass may be modelled using tree-specificbasic density. Otherwise, in the absence of tree-specific basicdensity, tree biomass may be modelled using species-specificmean basic density. The use of tree-specific basic density im-plies that basic density accounts for both species and tree dbhvariations, while the use of species-specific mean basic densi-ty accounts for variation between species only.
The common aboveground and belowground biomassmodels including basic density performed better than the com-monmodels based on dbh and ht reported byNjana et al. (2016).However, the species-specific models based on dbh and ht(Njana et al. 2016) turned out to be superior to the commonmodels including basic density developed in the present study.Moreover, given the fact that aboveground basic density valuesfrom the GWD database were observed to be inaccurate and thataboveground and belowground basic density generally variesbetween species (Table 1) and sites (Table 2), application ofcommon models including such predictor variables would re-quire determination of site-specific basic density so as to ensurethat such models perform as observed in this study. Using com-mon models including basic density is therefore inefficient, botheconomically and statistically, and we therefore recommendusing the species-specific models reported by Njana et al.(2016) for estimation of tree aboveground and belowground bio-mass for relevant mangrove species in Tanzania.
5 Conclusions
Basic density is important for various applications includingconversion of tree volume to biomass (conversion factor) andprediction of tree biomass. The study found that tree above-ground and belowground basic density varied between speciesand within species. Accordingly, sampling for estimation ofbasic density should take into account all sources of variation.Accurate estimation of tree biomass is essential for REDD+ and808 forest management in general. The use of tree- andcomponent-specific basic density values as a volume-biomassconversion factor resulted in relatively accurate tree above-ground estimates. However, the use of species-specific meanand basic density values sourced from the GWD database maylead to biased tree aboveground biomass estimates; therefore,such undertakings should be done cautiously. On the otherhand, common aboveground and belowground biomassmodelsincluding basic density performed better than the commonmodels developed without aboveground/belowground basicdensity previously. This demonstrates the importance of above-ground and belowground basic density inmodelling tree above-ground and belowground biomass, respectively. However, thespecies-specific models developed without basic density werebetter than the common models including basic density.Therefore, we recommend the use of species-specific biomass
Tree basic density and biomass estimation 1085
models developed without basic density rather than commonmodels including density.
Acknowledgments The authors would like to thank Tanzania ForestService field officers D.Mnyagi (Pangani), S. K. Nyabange (Bagamoyo),H. Mallya (Rufiji) and M. C. Mbago (Mtwara) for facilitation and logis-tical support during field work. In addition, we would like to thank ourfield assistants and boat driver for their perseverance and hard work.Thanks are also due to the anonymous reviewer and the handling editorwhose comments helped to improve the manuscript. We are also indebtedto the Climate Change Impacts and Adaptation Mitigation (CCIAM)Programme for granting a PhD scholarship to the first author and financ-ing field work.
Contribution of co-authors M. A. Njana: took part in design of re-search, responsible for data collection and preparation, data analysis andmanuscript development
H. Meilby: framing the study and provide technical guidance on dataanalysis and commenting on the manuscript
T. Eid: took part in design of the research, supervising the work,commenting on the manuscript
E. Zahabu: supervising the work and commenting on the manuscriptR. Malimbwi: coordinating the design of research project and
commenting on the manuscript
Compliance with ethical standards
Conflict of interest The authors declare that they have no conflict ofinterest.
Funding The work reported here was financed by the CCIAMProgramme and the research project Enhancing the Measuring,Reporting and Verification (MRV) of forests in Tanzania through thecooperation between the Government of the United Republic ofTanzania and the Kingdom of Norway.
References
Aksornkoae S, Maxwell GS, Havanond S, Panichsuko S (1992) Plants inmangroves. IUCN Asian Regional Office, Bangkok
Alongi DM (2011) Carbon payments for mangrove conservation: ecosys-tem constraints and uncertainties of sequestration potential. EnvironSci Pol 14:462–470
Angelsen A, Hofstad O (2008) Inputs to the development of a NationalReducing carbon Emissions from Deforestation and forestDegradation (REDD) strategy in Tanzania, Norwegian Universityof Life Sciences (UMB). Report for the Norwegian Embassy inTanzania
Auty D, Achim A, Macdonald E, Cameroon AD, Gardiner BA (2014)Models for predicting wood density variation in Scots pine. Forestry87:449–458
Bretz F, Hothorn T, Westfall P (2011) Multiple comparisons using R.CRC Press, New York
Brown S (1997) Estimating biomass change of tropical forests: Primer,FAO Forestry Paper 134, Rome, Italy
Chave J, Condit R, Aguilar S, Hernandez A, Lao S, Perez R (2004) Errorpropagation and scaling for tropical forest biomass estimates. PhilosTrans R Soc London B 359:409–420
Chave J, Andalo C, Brown S, Cairns MA, Chambers JQ, Eamus D,Fölster H, Fromard F, Higuchi N, Kira T, Lescure JP, Nelson B,Ogawa H, Puig H, Riéra B, Yamakura T (2005) Tree allometry
and improved estimation of carbon stocks and balance in tropicalforests. Oecologia 145:87–99
Chave J, Coomes DA, Jansen S, Lewis SL, Swenson NG, Zanne AE(2009) Towards a worldwide wood economics spectrum.Ecological Lett 12(4):351–366
Clark DC, Kellner JR (2012) Tropical forest biomass estimation and thefallacy of misplaced concreteness. J Veg Sci 23:1191–1196
Comley BWT, McGuinness KA (2005) Above- and belowground bio-mass, and allometry of four common northern Australian man-groves. Aust J Bot 53:431–436
Donato DC, Kauffman JB, Murdiyarso D, Kurnianto S, Stidham M,Kanninen M (2011) Mangroves among the most carbon-rich forestsin the tropics. Nat Geosci 4:293–297
Duncan C, Primavera JH, Pettorelli N, Thompson JR, Loma RJA,Koldewey HJ (2016) Rehabilitating mangrove ecosystem services:A case study on the relative benefits of abandoned pond reversionfrom Panay Island, Philippines. Marine Pollution Bulletin 109: 772-782
Fatoyinbo TE, Simard M, Washington-Allen RA, Shugart H (2008)Landscape-scale extent, height, biomass, and carbon estimation ofMozambique’s mangrove forests with Landsat ETM+ and shuttleradar topography mission elevation data. Geophys Res 113:1–14
Fearnside PM (1997) Wood density for estimating forest biomass inBrazilian Amazonia. Forest Ecol Manag 90:59–87
Gałecki A, Burzykowski T (2013) Linear mixed-effects models using R:a step by step approach. Springer, New York
Githiomi JK, Kariuki JG (2010) Wood basic density of Eucalyptusgrandis from plantations in central rift valley, Kenya: variation withage, height level and between sapwood and heartwood. J Trop ForSci 22:281–286
Grassi G, Monni S, Federici S, Achard F, Mollicone D (2008) Applyingthe conservativeness principle to REDD to deal with the uncer-tainties of the estimates. Environ Res Lett 3:1–11
Henry M, Besnard A, Asante WA, Eshun J, Adu-Bredu S, Valentini R(2010) Wood density, phytomass variations within and among treesand allometric equations in a tropical rainforest of Africa. ForestEcol Manag 260:1375–1388
IPCC (2003) IPCC good practice guidance for LULUCF. Institutefor Global Environmental Strategies (IGES) for the IPCC.Kanagawa, Japan
IPCC (2006) Guidelines for National Greenhouse Gas Inventories.IGES, Japan
Jachowski NRA, Quak MSY, Friess DA, Duangnamon D, Webb EL,Ziegler AD (2013) Mangrove biomass estimation in South-westThailand using machine learning. Appl Geogr 45:311–321
Ketterings QM, Coe R, van Noordwijk M, Ambagau Y, Palm CA (2001)Reducing uncertainty in the use allometric biomass equations forpredicting aboveground tree biomass in mixed secondary forests.Forest Ecol Manag 146:199–209
Komiyama A, Poungparn S, Kato S (2005) Common allometric equa-tions for estimating the tree weight of mangroves. J Trop Ecol 21:471–477
Komiyama A, Ong JE, Poungparn S (2008) Allometry, biomass, andproductivity of mangrove forests: a review. Aquat Bot 89:128–137
Kristensen E, Bouillon S, Dittmar T, Marchand C (2008) Organic carbondynamics in mangrove ecosystems: a review. Aquat Bot 89:201–219
Langner A, Miettinen J, Siegert F (2007) Land cover change 2002–2005in Borneo and the role of fire derived from MODIS imagery. GlobChange Biol 13:2329–2340
Locatelli T, Binet T, Kairo JG, King L,Madden S, Patenaude G, Upton C,HuxhamM (2014) Turning the tide: how blue carbon and paymentsfor ecosystem services (PES) might help save mangrove forests.Ambio 43:981–995
1086 M. A. Njana et al.
Luoga EJ, Malimbwi RE, Kajembe GC, Zahabu E, Shemwetta DTK,Lyimo-Macha J, Mtakwa P, Mwaipopo CS (2004) Tree speciescomposition and structures of Jasini Mkwajuni mangrove forest atPangani, Tanzania. J Tanzan Assoc For 10:42–47
MNRT (Ministry of Natural Resources and Tourism) (2015) NAFORMA(National Forest Monitoring and Assessments of Tanzania) mainresults. Dar es Salaam
Mwakalukwa EE, Meilby H, Treue T (2014) Volume and abovegroundbiomass models for dry miombo woodlands in Tanzania. Intern JFor Res doi. doi:10.1155/2014/531256
Nagelkerken I, Blaber SJM, Bouillon S, Green P, Haywood M, KirtonLG,Meynecke JO, Pawlik J, Penrose HM, Sasekumar A (2008) Thehabitat function of mangroves for terrestrial and marine fauna: areview. Aquat Bot 89:155–185
Njana MA, Eid T, Zahabu E, Malimbwi R (2015) Procedures for quanti-fication of belowground biomass of three mangrove tree species.Wetlands Ecol and Manage 23:749–764
Njana MA, Bollandsås OM, Eid T, Zahabu E, Malimbwi RE (2016)Above- and belowground tree biomass models for three mangrovespecies in Tanzania: a non-linear mixed-effects modelling approach.Ann For Sci 73:353–369
Nshare JS, Chitiki A, Malimbwi RE, Kinana BM, Zahabu E (2007) Thecurrent status of the mangrove forest along seashore at Salendabridge, Dar es Salaam, Tanzania. J Tanzan Assoc For 11:172–179
Ong JE, Gong WK, Wong CH (2004) Allometry and partitioning of themangrove, Rhizophora apiculata. Forest Ecol Manag 88:395–408
Picard N, Saint-André L, Henry M (2012) Manual for building tree vol-ume and biomass allometric equations: from field measurement toprediction. Food and Agricultural Organization of the UnitedNations, Rome, and Centre de Coopération Internationale enRecherche Agronomique pour le Développement, Montpellier
Pinheiro J, Bates D (2000) Mixed effects models in S and S-plus.Springer, New York
Purnobasuki H (2013) Characteristics of root caps in four root types ofAvicennia marina (Forsk.) Vierh. Am J P Sci 4:853–858
R Core Team (2013) R: a language and environment for statistical com-puting. R Foundation for Statistical Computing, Vienna.http://www.R-project.org/. Accessed 20 Nov 2013
Saenger P, Hegerl EJ, Davie JDS (eds) (1983) Global status of mangroveecosystems by the Working Group on Mangrove Ecosystems of theIUCN Commission on Ecology in cooperation with the UnitedNations Environment Programme and the World Wildlife Fund.Environmentalist 3:1–88
Saintini NS, Schmitz N, Lovelock CE (2012) Variation in wood densityand anatomy in a widespread mangrove species. Trees 26:1–9
Somogyi Z, Cienciala E, Mäkipää R,Muukkonen P, Lehtonen A,Weiss P(2007) Indirect methods of large-scale forest biomass estimation.Eur J Forest Res 126:197–207
Spalding M, Kainuma M, Collings L (2010) World atlas of man-groves. A collaborative project of ITTO, ISME, FAO, UNEP-WCMC, UNESCO-MAB, UNU-INWEH and TNC. Earthscan,London
Tamooh F, Huxham M, Karachi M, Mencuccini M, Kairo JG, Kirui B(2008) Below-ground root yield and distribution in natural andreplanted mangrove forests at Gazi bay, Kenya. Forest EcolManag 256:1290–1297
Tomlinson PB (1986) The botany of mangroves. Cambridge UniversityPress, Cambridge
UNFCCC (2011) United Nations Framework Convention on ClimateChange (2011) Outcome of the Ad Hoc Working Group on Long-term Cooperative Action Under the Convention (Draft Decision[−/CP.17])
Valiela I, Bowen JL, York JK (2001)Mangrove forests: one of the world’sthreatened major tropical environments. Bioscience 51:807–815
Walther BA, Moore JL (2005) The concepts of bias, precision and accu-racy, and their use in testing the performance of species richnessestimators, with a literature review of estimator performance.Ecography 28:815–829
West PW (2009) Tree and forest measurements. 2nd edition. Springer-Verlag, Berlin Heidelberg
Wiemann MC, Williamson GB (2012) Density and specific gravity met-rics in biomass research. USDA Forest Service, Forest ProductsLaboratory, General Technical Report, FPL-GTR-208
Williamson GB, Wiemann MC (2010) Measuring wood specific gravitycorrectly. Am J Bot 97:519–524
Wylie L, Sutton-Grier AE, Moore A (2016) Keys to successful bluecarbon projects: lessons learned from global case studies. MarPolicy 65:76–84
Zanne AE, Lopez-Gonzalez G, Coomes DA, Ilic J, Jansen S, Lewis SL,Miller RB, Swenson NG,WiemannMC, Chave J (2009) Data from:towards a worldwide wood economics spectrum. Dryad DigitalRepository. doi:10.5061/dryad.234
Zhang K, Liu H, Xu H, Shen J, Rhome J, Smith TJ (2012a) The role ofmangroves in attenuating storm surges. Estuar Coast Shelf S 103:11–23
Zhang L, Deng X, Lei X, Xiang W, Peng C, Lei P, Yan W (2012b)Determining stem biomass of Pinus massoniana L. through varia-tions in basic density. Forestry 85:601–609
Zhou X, Brandle JR, Schoeneberger MM, Awada T (2007) Developingabove-ground woody biomass equations for open-grown, multiple-stemmed tree species: shelterbelt-grown Russian-olive. Ecol Model20:311–323