Munich Personal RePEc Archive Importance-Satisfaction Analysis for Tioman Island Marine Park Mohd Salleh Norlida Hanim and Othman Redzuan Universiti Kebangsaan Malaysia March 2010 Online at https://mpra.ub.uni-muenchen.de/22679/ MPRA Paper No. 22679, posted 17. May 2010 13:08 UTC
Transcript
MPRAMunich Personal RePEc Archive
Importance-Satisfaction Analysis forTioman Island Marine Park
Mohd Salleh Norlida Hanim and Othman Redzuan
Universiti Kebangsaan Malaysia
March 2010
Online at https://mpra.ub.uni-muenchen.de/22679/MPRA Paper No. 22679, posted 17. May 2010 13:08 UTC
Importance-Satisfaction Analysis for Tioman Island Marine Park
Redzuan Othman, Norlida Hanim Mohd Salleh, Abdul Hamid Jaafar and Nor Ghani Md. Nor
Pusat Pengajian Ekonomi
Fakulti Ekonomi dan Perniagaan Universiti Kebangsaan Malaysia, BANGI.
Abstract
The purpose of this research is to evaluate the importance and satisfaction level of tourists at the Tioman Island Marine Park (TIMP) toward the island’s environmental attributes and service quality offered. This research analyses the overall tourists, as well as comparison between the local and foreign tourists. The measurement of importance and satisfaction is based on the mean analysis, i.e. the importance mean (estimated/expected mean) and the perceived mean (satisfactory mean). The difference between these mean values shows the gap value. The gap analysis in this research is assisted by the t-analysis in explaining the existence of difference, if any. If there is no difference in this analysis, it shows that the tourists get what they expected from their trips to the TIMP. However, if there is existence of difference, it must be ascertained as to whether the trips satisfy their expectations or otherwise. Again, the gap analysis will be able to answer this question. The research result shows that all tourists (both locals and foreign) agree on the importance and satisfaction toward the TIMP‘s environmental attributes and service quality offered. Besides the existence of difference in value between the said means, whether through the gap analysis or the paired t-test; the gap analysis finds that the mean values for most of the environmental attributes and service quality evaluated, are negative. Thus, these negative values indicate a relatively low satisfaction level.
Keywords: Tourists’ perceptions, Environmental attributes, Environmental Service
Quality, Tioman Island Marine Park
2
Introduction Marine Parks are one of the few protected areas. As a protected area, limited activities are allowed and those that are destructive toward marine ecology are strongly prohibited. Nonetheless, only activities that are not destructive to ecology are allowed, including tourism. In fact, tourism is highly encouraged at these marine parks. Currently in Malaysia there are five Marine Parks with a total of 42 islands which are the Payar Island Marine Park (4 islands), Redang Island Marine Park (9 islands), Tioman Island Marine Park (7 islands), Mersing Marine Park (13 islands) and Labuan Marine Park (3 islands) (Abdul Khalil Abdul Karim, 2003). All these Marine Parks are developed as tourist destinations. This is because tourism is not regarded as destructive towards the marine parks’ marine ecology if they are sustainably managed. Moreover, more importantly, the tourism activities are also income generating to those locals who are now prohibited from carrying out their main source of income activity, which is fishing. In general, the level of tourism sector’s development at the marine parks is very good. This is because almost all marine parks are fully equipped with various facilities for the tourists such as resorts, chalets, restaurants, souvenir shops, jetties and other facilities. Thus, the influx of tourists from both local and abroad can be observed yearly (Redzuan and Norlida, 2003). However lately, the robust development of the tourism industry and the high number of tourist arrivals are seen as invitation to destroy the marine parks’ ecosystem. Thus, this research concentrates on the Tioman Island Marine Park as the research location in order to evaluate the importance and satisfaction of tourists toward the island’s environmental attributes and service quality. With the evaluation of the tourist’s importance and satisfaction, conclusions can be drawn in regard to the TIMP’s environment and the environmental service quality after the island’s robust tourism development.
Discussion of this paper will be in the following sequence: ii) Research location background, iii) Past researches reviews, iv) Methodology and research objectives, v) Research Result; and vi) Conclusion and Research Implications
Research Location Background The Tioman Island is located in the state of Pahang. It consists of nine islands namely the Tulai Island, Labas Island, Chebeh Island, Sepoi Island, Gut Island, Seri Buat Island, Sembilang Island, Tokong Bara Island and Tioman Island. Tioman Island is the biggest among the nine islands as well as the only island inhabited and developed with tourism activities. The Tioman Island is situated on the Sunda shelf, with its topography and landscape filled with rolling hills and mountain peaks, sandy beaches and rocky cliffs. It has a network of 69 kilometres of beaches and 42 percent of these beaches, or 29 kilometres,
3
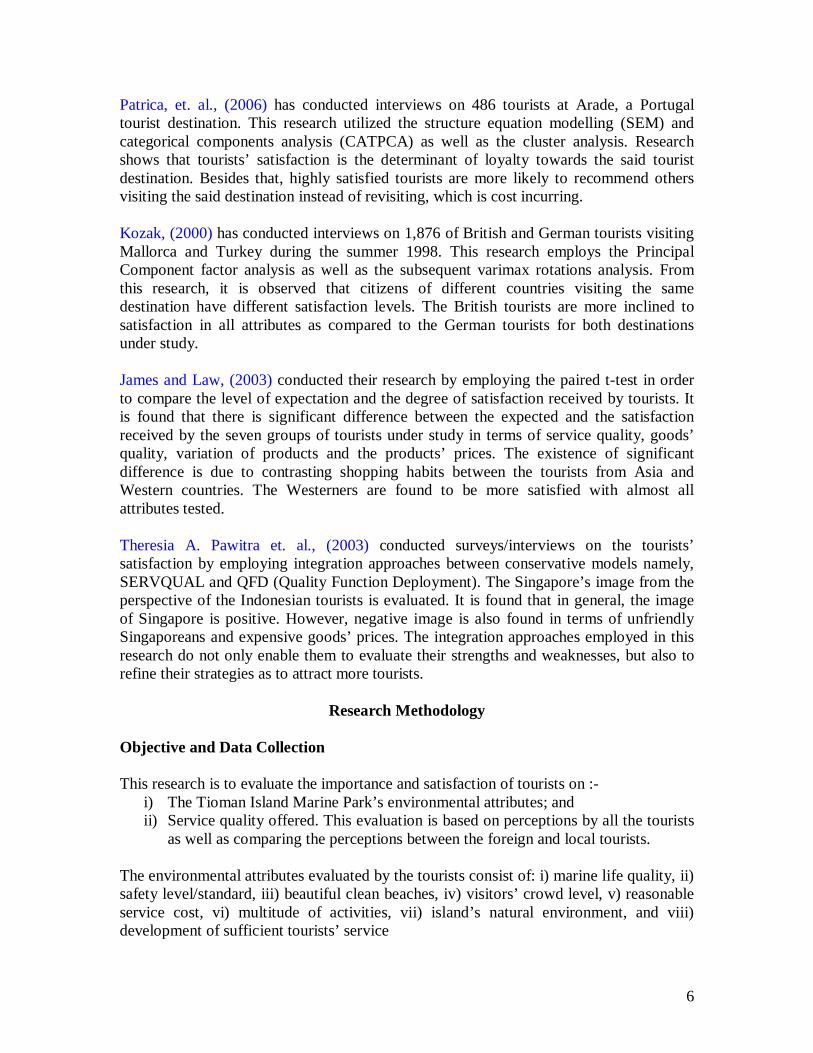
are sandy beaches and steep cliffs especially at the island’s east coast. The main sandy beaches are the beaches at Kampung Tekek, Kampung Salang, Kampung Air Batang, Kampung Lalang, Kampung Paya, Kampung Genting, Kampung Nipah, Kampung Juara, and Kampung Mukut. Besides that, there is also sandy area at the Tulai Island which is the Pasir Panjang beach. Almost 80 percent of the Tioman Island’s landscape is of rocky hills and mountains with gradient exceeding 20o with the highest point known as Kajang Mountain, which is 1,083 meter above sea level. It is found that only 27 percent of the land is below 100 meters above sea level, 59 percent is at 100 to 300 meters above sea level and almost 14 percent exceed 600 meters above sea level (Ministry of Natural Resources, 2004). Even though Tioman Island is the only island that is inhabited and developed with the assortment of facilities, other islands are as equally important as destinations for the scuba diving and snorkelling activities. The main method to TIMP is by seaway which is through the Tanjung Gemok jetty in Pahang and Mersing jetty in Johor. From the Tanjung Gemok jetty, there is a ferry service which has 2 to 3 trips daily with each journey taking 1 ¼ hour. As for the ferry service in Mersing, it takes 2 hours for each journey with 4 trips daily. Besides that, there is also a speed boat service which takes an hour per each journey as well as via air which takes about 40 minutes from the Subang Airport (Ministry of Natural Resources, 2004).
\
Figure 1: Tioman Island
•
•
••
• •
•Kg. Salang
••Kg. Nipah
4
The main economic activities at the TLPT, specifically at the Tioman Island are in the trade/business and service sectors which are at 72.56 percent and in other sectors namely management, education, health (government servants) at 14.62 percent. Farming and fishing activities are third most important employment sector for the locals at 6.25 percent. The locals are also involved in the production, construction, finance and property sectors. Tourism is the main activity in service sector. It provides numerous employment opportunities to the locals with the establishments of resorts, chalets, restaurants and duty free shops (Ministry of Natural Resources, 2004). The development of tourism sector has been very drastic and it has successfully becoming the main source of income to the Tioman Island’s local. The tourist arrivals have also improved. In 1995, around 93,994 both local and foreign tourists had visited the island. This number had increased to 106,780 in 2000 and reduced to 96,071 in 2008. On the average, the growth of tourist arrivals to the TIMP is in the range of 3.3 percent for the period of 1995-2008. Please refer Table 1.
Table 1: Number of Tourist Arrivals to TIMP, 1995-2008
Source : Department of Marine Parks Malaysia, 2010.
In reference to Table 1 and by observing the annual tourist arrivals, the statistics reveal decreasing number of tourists both from local and abroad to the TIMP. For example, for the period of 1997 to 1999, the number of tourist arrivals (both locals and foreigners) was at its peak. However, there were reductions in the subsequent years. This situation is difficult to explain. Nonetheless, the development of other marine parks such as the Redang Island Marine Park, Payar Island Marine Park, Mersing Marine Park and Labuan Marine Park as well as the existence of other famous marine parks such as Kapas Island, Sipadan and others, may explain the reducing number in tourist arrivals.
5
Past Researches Review
Discussion in regard to tourists’ importance and satisfaction is common among the tourism’s researchers. This is because each researcher wants to explain the factors that affect the choice of destination from the tourists’ perspectives; as well as their satisfaction level after those trips. A research done by Tzu-Kuang, et. al., (2009) is one of the examples. He attempts to identify the factors that influence the tourists’ choice of destinations and the important values of Taiwan’s destinations. Employing the fuzzy set theory and TOPSIS, choices of 8 main destinations are chosen by the tourists and Taipei 101 emerged as the top choice. Meanwhile, visiting friends/relatives and safety are the top two important factors for tourists visiting Taiwan. In terms of price factor, even though it is important, it is the last priority/important factor.
In terms of research related to satisfaction, perception and gap analysis, a research carried out by Garyfallos and Evangelos, (2010) is one fine example. The research conducted at the Dadia-Lefkimi-Souflion National Park attempt to analyze the tourists’ satisfaction in relation to various factors such as the regional environmental attributes, service standard and sufficient accommodation for tourists. The data is evaluated using the MUSA (Multicriteria Satisfaction Analysis) methodology and other related software. The focused result is to determine factors that increase tourists’ satisfaction level, and the critical point in the national park’s administration’s power/authority. Their research shows that tourists are quite satisfied with all the service criteria as well as high satisfaction level with the environmental criteria offered by the said national park. Besides that, the tourists are also satisfied with the infrastructural criteria, but with low satisfaction level. Meanwhile, as for the recreational facilities criteria, the tourists are satisfied but with low satisfaction level. As for the criteria related to the information communication, the satisfaction level is comparatively high
A research was also carried out by John and Damiannah, (2003) on the Kenya National Park, which is the country’s main tourist attraction. The research attempts to explore the tourists’ satisfaction level towards their safari trips and various other eco-tourism activities. A total of 200 tourists were interviewed in regard to their perceptions on the said national park’s quality. It is found that 70 percent of the tourists interviewed are satisfied with the national park’s quality. In terms of research done by Dennis and Axel, (2007), it is conducted in order to evaluate the satisfaction and perception toward the crowding problem at the German National Park. In this research, interviews are divided into two sections, the guided tourists and the unguided tourists. Visual approach is utilized in order to identify the factors contributing towards the crowd level in the said area. From this research, it is found that only 20 percent of the tourists agree that the area is crowded. Thus, most tourists do not find that tourism activities contribute towards the crowding situation. The tourists who are sensitive towards the crowd situation are the daily visitors, while the guided tourists are more tolerable.
6
Patrica, et. al., (2006) has conducted interviews on 486 tourists at Arade, a Portugal tourist destination. This research utilized the structure equation modelling (SEM) and categorical components analysis (CATPCA) as well as the cluster analysis. Research shows that tourists’ satisfaction is the determinant of loyalty towards the said tourist destination. Besides that, highly satisfied tourists are more likely to recommend others visiting the said destination instead of revisiting, which is cost incurring. Kozak, (2000) has conducted interviews on 1,876 of British and German tourists visiting Mallorca and Turkey during the summer 1998. This research employs the Principal Component factor analysis as well as the subsequent varimax rotations analysis. From this research, it is observed that citizens of different countries visiting the same destination have different satisfaction levels. The British tourists are more inclined to satisfaction in all attributes as compared to the German tourists for both destinations under study. James and Law, (2003) conducted their research by employing the paired t-test in order to compare the level of expectation and the degree of satisfaction received by tourists. It is found that there is significant difference between the expected and the satisfaction received by the seven groups of tourists under study in terms of service quality, goods’ quality, variation of products and the products’ prices. The existence of significant difference is due to contrasting shopping habits between the tourists from Asia and Western countries. The Westerners are found to be more satisfied with almost all attributes tested.
Theresia A. Pawitra et. al., (2003) conducted surveys/interviews on the tourists’ satisfaction by employing integration approaches between conservative models namely, SERVQUAL and QFD (Quality Function Deployment). The Singapore’s image from the perspective of the Indonesian tourists is evaluated. It is found that in general, the image of Singapore is positive. However, negative image is also found in terms of unfriendly Singaporeans and expensive goods’ prices. The integration approaches employed in this research do not only enable them to evaluate their strengths and weaknesses, but also to refine their strategies as to attract more tourists.
Research Methodology
Objective and Data Collection This research is to evaluate the importance and satisfaction of tourists on :-
i) The Tioman Island Marine Park’s environmental attributes; and ii) Service quality offered. This evaluation is based on perceptions by all the tourists
as well as comparing the perceptions between the foreign and local tourists. The environmental attributes evaluated by the tourists consist of: i) marine life quality, ii) safety level/standard, iii) beautiful clean beaches, iv) visitors’ crowd level, v) reasonable service cost, vi) multitude of activities, vii) island’s natural environment, and viii) development of sufficient tourists’ service
7
As for the environmental service quality, it is in relation to: i) abundance and variety of coral reefs, ii) abundance and variety of fishes, iii) clear and clean water, iv) peaceful island, v) clean unspoiled beaches, vi) untouched terrestrial flora and faunas, and vii) serenity of fishermen’s village. The tourists’ profiles are also compiled in this research. In this research, interviews were conducted randomly with foreign tourists (85) and locals (80), at four main locations, namely the Kg Air Batang, Kg Tekek, Kg Juara and Kg Salang in the months of April-May 2009. Interviews took around 20-30 minutes. Data Analysis Evaluation on the environmental attributes and service quality offered at the TIMP is based on:- i) Mean Analysis
The mean analysis indicates the tourists’ importance and satisfaction toward the environmental attributes and service quality offered at the TIMP. The mean values obtained from the tourists’ responses are based on four likert scale namely 1-very unimportant/satisfactory, 2-not important/satisfactory, 3-important/satisfactory, and 4-very important/satisfactory. If the mean value is between 3 and 4, this means that the tourists agree that the environmental attributes and service quality offered at the TIMP are important /satisfactory. However, if the mean value is between 1 and 2, it means otherwise. ii) Gap Analysis
The importance mean is usually referred to as the tourists’ estimated/expected mean before trips. As for the satisfaction mean, it is the tourists’ perceived mean after trips (John and Damiannah, 2003). In reality, sometimes there is difference in these two mean values. The difference in value between the estimated/expected mean and the perceived mean indicates gap analysis (Jaana Tonge and Susan, 2007). Detail is per equation below:
Gap Analysis = Perceived mean – estimated/expected mean
In the event the gap value is positive, it means that the tourists’ actual experience from the environmental attributes and service quality offered at the TIMP is the same or more than their expectations, but if otherwise, the gap value is negative (Jaanna Tonge and Susan, 2007; Joan and Damiannah, 2003).
8
iii) Paired t-test
The paired t-test is also employed in this research. This test is done in order to determine as to whether the gap (difference in mean values) is significant or otherwise. Statistically, the paired t-test is to test the following hypotheses: H0: None-existence of difference between the perceived mean and estimated/expected
mean towards the environmental attributes/ service quality before and after trips H1: Existence of difference between the perceived mean and estimated/expected mean
towards the environmental attributes/service quality before and after trips
In the event of nonexistence of difference in the tourists’ perceived mean and the estimated/expected mean towards the environmental attributes/service quality, this means that the tourists’ experiences during their trips to the TIMP is exactly as expected by them. This means, there is failure to reject the null hypotheses1. However, if there is existence of difference between the means, the gap analysis will be referred to in order to determine as to whether the said difference is positive or negative. This is done so that a conclusion can be drawn as to whether the experiences are as the tourists expected or otherwise.
Research Result
The discussion on result from the interviews will be in the following order: i) TIMP’s tourists’ profiles, ii) Importance and satisfaction analysis on all the tourist, iii) Comparative analysis between the importance and satisfaction between/among the tourists
i) TIMP’s tourists profile
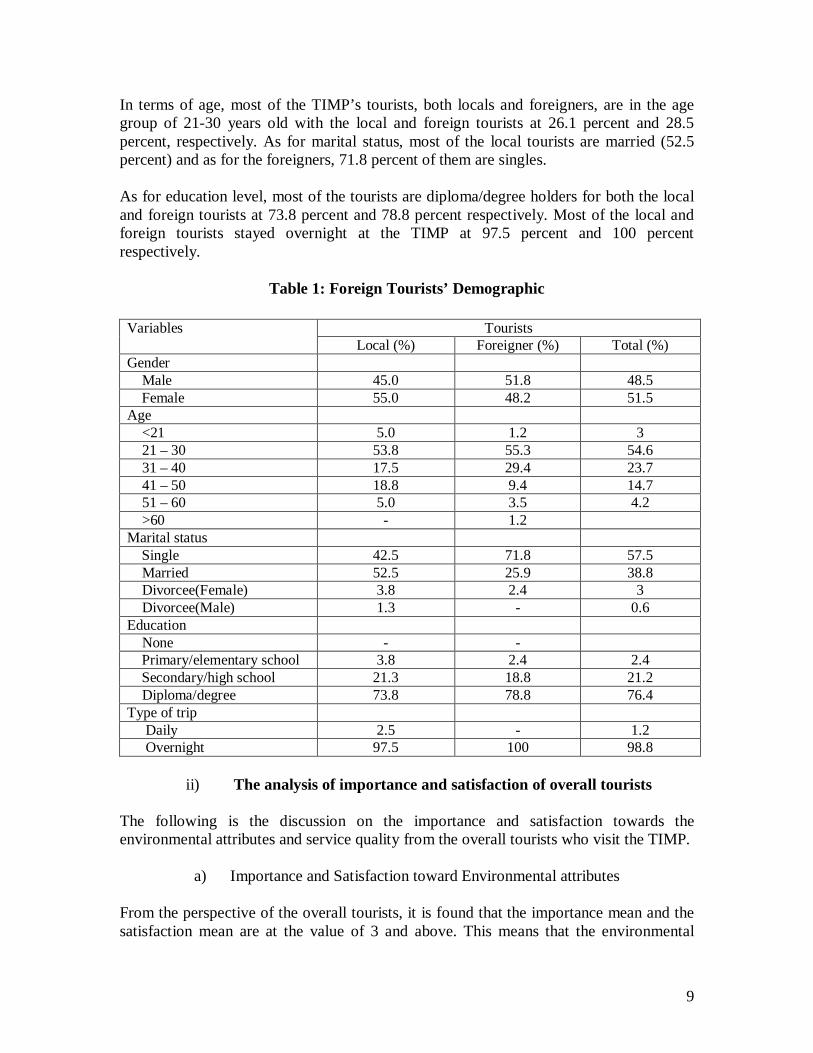
Field study finds that most tourists who visit TIMP are male (51.5 percent) as compared to female (48.5 percent). From the age aspect, majority of them are in the age range of 21-30 years old (54.6 percent). This is followed by those in the age range of 31-40 years old (23.7 percent), 41-50 years old (14.7 percent) and 51-60 years old (4.2 percent). Majority of the TIMP’s tourists are singles (57.5 percent), while 38.8 percent are those who are married. In terms of education, the tourists have high education level with most of them are diploma/degree holders (76.4 percent), followed by high/secondary school (21.2 percent) and primary/elementary school (2.4 percent). Majority of the tourists have accommodations at the TIMP (98.8 percent) and only a handful of 1.2 percent is daily visitors. The local tourists who visit TIMP are mainly female (55.0 percent) as compared to male (45.0 percent). This is in contrast if compared to the foreign tourists whereby most of them are male (51.8 percent) and female (48.2 percent).
1 Fail to reject the null hypotheses if the p-value is more than α = 0.05, and otherwise
9
In terms of age, most of the TIMP’s tourists, both locals and foreigners, are in the age group of 21-30 years old with the local and foreign tourists at 26.1 percent and 28.5 percent, respectively. As for marital status, most of the local tourists are married (52.5 percent) and as for the foreigners, 71.8 percent of them are singles. As for education level, most of the tourists are diploma/degree holders for both the local and foreign tourists at 73.8 percent and 78.8 percent respectively. Most of the local and foreign tourists stayed overnight at the TIMP at 97.5 percent and 100 percent respectively.
Table 1: Foreign Tourists’ Demographic
Tourists Variables Local (%) Foreigner (%) Total (%)
Gender Male 45.0 51.8 48.5 Female 55.0 48.2 51.5 Age <21 5.0 1.2 3 21 – 30 53.8 55.3 54.6 31 – 40 17.5 29.4 23.7 41 – 50 18.8 9.4 14.7 51 – 60 5.0 3.5 4.2 >60 - 1.2 Marital status Single 42.5 71.8 57.5 Married 52.5 25.9 38.8 Divorcee(Female) 3.8 2.4 3 Divorcee(Male) 1.3 - 0.6 Education None - - Primary/elementary school 3.8 2.4 2.4 Secondary/high school 21.3 18.8 21.2 Diploma/degree 73.8 78.8 76.4 Type of trip Daily 2.5 - 1.2 Overnight 97.5 100 98.8
ii) The analysis of importance and satisfaction of overall tourists
The following is the discussion on the importance and satisfaction towards the environmental attributes and service quality from the overall tourists who visit the TIMP.
a) Importance and Satisfaction toward Environmental attributes
From the perspective of the overall tourists, it is found that the importance mean and the satisfaction mean are at the value of 3 and above. This means that the environmental
10
attributes at the TIMP are in the important domain and are very important; as well as satisfactory and highly satisfy the tourists2.
Meanwhile, the gap analysis shows that, the difference between the tourists’ importance mean and satisfaction mean for all the environmental attributes have negative difference value. This indicates that there is a difference between the importance mean and the satisfaction mean for each of the environmental attributes.
Based on the paired t analysis, it is also proven that there is existence of difference between the overall tourists’ importance mean and satisfaction mean towards the chosen attributes. However, only the good/quality marine life; as well beautiful clean beaches attributes are found to be highly significant at 0.05 significance level. This situation indicates that tourists are satisfied with their visits, but their satisfaction level is low as indicated by the negative gap value. Table 2: Assessment on the Environmental Service Quality surrounding the TIMP
b) Importance and Satisfaction on the Environmental Service Quality The importance mean and the satisfaction mean toward the environmental service quality are valued at more than 3. Thus, conclusion can be drawn that all tourists who visit this marine park are satisfied with the environmental service quality. Moreover, it shows that these aspects are important to them. Nonetheless, the gap analysis shows that there is difference between the tourists’ estimated/expected mean and the real mean with negative values for all attributes except for the fishermen’s village. The t-paired test also shows the existence of difference between the estimated/expected mean and the real mean towards the environmental service quality. This shows that even though tourists are satisfied with the environmental service quality offered by the TIMP, their satisfaction level is low due to their high expectation as compared to what they have experienced during their visits.
2 1-highly not important/satisfactory, 2-not important/satisfactory, 3-important/satisfactory, 4-very important/satisfactory
11
Table 3: Tourists’ Assessments toward the Satisfaction Level at the Tioman Island Marine Park
Attributes Estimated/ expected
Mean (SD)
Perception/ Perceived Mean
(SD)
Gap t-test
1. Abundance and variety of corals 3.4424 (0.78) 3.1212 (0.69) -0.32 -4.812** 2. Abundance and variety of fishes 3.4909 (0.75) 3.2061 (0.59) -0.28 -4.832** 3. Clear and clean water 3.6121 (0.71) 3.1939 (0.53) -0.42 -6.565** 4. Peaceful island 3.4848 (0.73) 3.2000 (0.49) -0.28 -4.249** 5. Clean unpolluted beaches 3.6303 (0.67) 2.9758 (0.62) -0.65 -8.871** 6. Untouched terrestrial flora and fauna 3.4242(0.73) 3.1636 (0.56) -0.26 -4.101** 7. Serene fishermen’s village 2.8970 (0.89) 3.0303 (0.68) 0.13 0.926 * P<0.05 ** P<0.00
iii) Comparative Analysis between the Importance and Satisfaction of Tourists
Comparison on the importance and satisfaction toward the environmental attributes and service quality are also conducted between the local tourists and the foreign tourists as explained below.
a) Importance and Satisfaction towards Environmental attributes
Research result shows that both tourist groups have the importance mean and satisfaction mean exceeding 3. Thus, regardless of the tourists’ origin, both indicate that the environmental attributes and service quality at the TIMP are vital and satisfactory. However, these two groups have different insights when the values of the importance mean and the satisfaction mean between the local tourists and the foreign tourists are compared. This can be further proven by the t-test. As for the local tourists, all the environmental attributes have recorded different mean values. This is supported by the t-test whereby all the environmental attributes stated are significantly different except for the low tourists’ crowd with the test conducted at significance level of 0.05. All the attributes have negative gap mean values. Thus, this shows that even though local tourists are satisfied with their TIMP’s visits, their real satisfaction is lower than expected. As for the foreign tourists, even though there is difference between the importance mean and the satisfaction mean, it is found that most of the t-tests are not significant. Only the good/quality marine life, beautiful clean beaches as well as provision of sufficient tourism services are significant. This shows that the even though foreign tourists are satisfied with the TIMP’s environmental attributes with mean value exceeding 3; their real satisfaction is lower than expected. Attributes that indicate positive satisfaction are good safety measures/standard, low visitors’ crowd, reasonable cost of environmental service, multitude of eco-related activities, the island’s natural environment and provision of sufficient tourism services. Please refer Table 4.
12
Table 4: Local and Foreign Tourists’ Assessments toward the Environmental
attributes at the Tioman Island Marine Park
Local Tourists Foreign Tourists Attributes Estimated/Expec
ted Mean (SD)
Perceived Mean
(SD)
Gap t-test Estimated/expe
cted mean (SD)
Perceived mean (SD)
Gap t-test
1. Good/quality marine life
3.4000 (0.74)
3.0250 (0.42) -0.38 -4.029** 3.4643
(0.86) 3.0476 (0.66) -0.42 -3.311*
2. Good safety standard/measures
3.3625 (0.75)
3.0125 (0.44) -0.35 -3.851** 3.0122
(0.99) 3.1220 (0.51) 0.11 0.933
3. Beautiful and clean beaches
3.4937 (0.75)
3.0000 (0.53) -0.50 -4.513** 3.4000
(0.89) 2.8235 (0.68) -0.58 -5.004**
4. Low visitors’ crowd
3.1026 (0.85)
3.0000 (0.39) -0.10 -1.070 2.9740
(0.86) 3.1429 (0.39) 0.16 1.714
5. Reasonable eco-related service cost
3.3117 (0.77)
3.000 (0.45) -0.31 -3.229* 3.0130
(0.83) 3.1299 (0.44) 0.12 1.136
6. Multitude of eco-related activities
3.3038 (0.74)
3.0000 (0.45) -0.31 -3.649** 2.8354
(0.87) 3.0506 (0.48) 0.22 1.873
7. Island’s natural environment
3.4684 (0.75)
3.1139 (0.42) -0.35 -3.651** 3.2875
(0.83) 3.3500 (0.55) 0.06 0.583
8. Provide sufficient tourism service
3.4000 (0.74)
2.9625 (0.46) -0.44 -4.838** 2.7342
(0.84) 3.0633 (0.51) 0.33 2.828*
* P<0.05 ** P<0.00
b) Importance and Satisfaction toward Environmental Service Quality There is similarity between the local and foreign tourists when they evaluate the environmental service quality at the TIMP. Both groups of tourists indicate that all quality of services is important and they are satisfied with their visits (the mean values for importance and satisfaction are more than 3). Please refer Table 5. Based on the t-test, it is found that all aspects of environmental service quality are significant except for the local tourists on the environmental service quality at the fishermen’s village. Thus, the existence of difference in mean values indicates that there is a difference between the estimated/expected value and the real value by both the locals and foreigners, from the tourism activities they undertake at the TIMP.
As per Table 5, the gap analysis supports the above analysis. The gap analysis shows negative value for each aspect of environmental quality assessed. This means that even though both the local and foreign tourists are satisfied with the environmental service quality at the TIMP (mean values more than 3); their real satisfaction towards the environmental service quality is lower than expected.
13
Table 5: Local and Foreign Tourists Assessments on the Environmental Service Quality at the Tioman Island Marine Park
Local Tourists Foreign Tourists Attributes
Expected /Estimated Mean
(SD)
Perceived mean (SD)
Gap t-test Expected/Estim
ated Mean (SD)
Perceived
mean (SD)
Gap t-test
1. Abundance and variety of corals
3.3750 (0.82)
3.1000 (0.56) -0.28 -2.614* 3.5062
(0.73) 3.0494 (0.68) -0.46 -4.161**
2.Abundance and variety of fishes
3.4625 (0.75)
3.1625 (0.49) -0.3 -3.110* 3.5185
(0.73) 3.165 (0.56) -0.35 -3.702**
3. Clean and clear water
3.5125 (0.75)
3.2000 (0.46) -0.31 -3.472* 3.6867
(0.67) 3.1566 (0.55) -0.53 -5.809**
4. Peaceful island 3.4750 (0.76)
3.1750 (0.47) -0.30 -3.282* 3.4941
(0.72) 3.2235 (0.52) -0.27 -2.757*
5. Clean unpolluted beaches
3.4750 (0.75)
3.0750 (0.49) -0.40 -
3.938** 3.7765 (0.56)
2.8824 (0.52) -0.89 -8.901**
6. Untouched terrestrial flora and fauna
3.4250 (0.76)
3.1250 (0.51) -0.30 -3.059*
3.4217 (0.72)
3.1566 (0.53) -0.27
-2.730*
7. Fishermen village 3.1375 (0.85)
3.0000 (0.55) -0.14 -1.417 2.6625
(0.86) 2.9375 (0.62) 0.275 2.542*
* P<0.05 ** P<0.00
Conclusion
This research is undertaken in order to evaluate the importance and satisfaction of tourists towards the environmental attributes and service quality offered by TIMP. The environmental attributes under scrutiny are good/quality marine life, safety standard/measures, beautiful clean beaches, visitors’ crowd level, reasonable environmental service cost, multitude of eco-related activities, island’s natural environment and provision of sufficient tourism services. Meanwhile, the environmental service quality offered are related to the abundance and variety of corals, abundance and variety of fishes, clean and clear water, peaceful island, clean unpolluted beach, untouched terrestrial flora and fauna and serene fishermen’s village. For the purpose of this research, interviews are randomly conducted among the local and foreign tourists at four main locations namely the Kg Air Batang, Kg Tekek, Kg Juara and Kg Salang during the months of April-May 2009. Each interview takes about 20-30 minutes. Three types of analyses are employed in this research namely the mean analysis, gap analysis and paired t-test. Based on the mean analysis, almost all locals and foreign tourists agree that the environmental attributes and service quality offered at the TIMP are important and satisfactory as indicated by the expected/estimated means and perceived means.
14
Nonetheless, the gap analysis shows the existence of difference between the perceived mean and the estimated/expected mean. This shows that even though in general the tourists are satisfied with most of the environmental attributes and service quality under observation, the said values (satisfaction) are less than what they have expected as indicated by the negative gap values. The paired t-test shows that the research result is almost identical as the gap analysis. This is because there is difference between the tourists’ perceived means and the estimated/expected means to almost all the environmental attributes and service quality that are evaluated by the overall tourists. Nonetheless, if we are to compare between the local and foreign tourists, the result will slightly differs. As for the local tourists, most of the environmental attributes have significant difference, except for the low visitors’ crowd. Meanwhile, as for the foreign tourists, the significant attributes are good marine life, beautiful and clean beaches and provision of sufficient tourism services. In terms of the environmental service quality, research result is similar between the local and foreign tourists except for the fishermen’s village which is not significant to the local tourists. With the negative difference values, these values indicate that even though the local and foreign tourists are satisfied with the environmental service quality attributes offered at the TIMP, they are all lower than what are expected from their trips. The research result seems to indicate degradation in the environmental attributes and service quality aspects offered by TIMP. As both of these aspects are important to tourists, the marine park’s management and other related parties are to contribute toward improving the said marine park’s environmental service quality. Controlled development must also be undertaken so that the environmental service quality is not compromised. Moreover, the environmental attributes can also be conserved as to more attract tourists to visit marine parks specifically the TIMP. The same conclusion and proposal are also suggested by Jamal and Norlida, (2003).
15
References
Abdul Khalil Abdul Karim and Mohd Najib Ramli (2003). Pelancongan dan Alam Sekitar: Taman Laut Malaysia, (edited by: Mohd Fauzi M.J., Zaimah, D., Mohaini, T., Norlida Hanim, M.S., Basri, A.T., Nik Hashim, N.M., Mohd Azlan, S.Z., Nafisah., M., in Trade Liberalitaion and Agricultural Sector in Malaysia, Fakulti Ekonomi, UKM, Bangi, Selangor.
Dennis Kalisch and Axel Klaphake (2007). Visitors satisfaction and perception of
crowding in a German National Park: A Case Stady on the Island of Halling Hooge. For.Snow Landsc. Res.81,1/2:109-122 (2007).
and Gap Analysis: The Case of Dadia-Lefkimi-Souflion National Park. Forest policy Economic: (12), 163-172.
Jaanna Tonge and Susan, (2007). Importance-Satisfaction Analysis for Marine Park
Hinterlands: A Western Australian Case Study. Tourist Management: (28), 768-776.
James Wong dan Rob Low (2003). Difference in Shopping Satisfaction levels: A Study
of Tourists in Hong Kong. Tourism Management: (24), 401-410. John S. Akama, Damiannah Mukethe Kieti (2003). Measuring Tourist Satisfaction with
Kenya’s Wildlife Safari: A Case Study of Tsavo West National Park. Tourist Management: (24), 73-81.
M. Kozak, (2000). Comparative Assessment of Tourist Satisfaction with Destinations
Across Two Nationalities. Tourist Management: (22), 391-401. Jabatan Taman Laut Malaysia (2010). Jamal, O and Norlida Hanim, M.S (2003). Penganggaran Caj Kemasukan Sesuai bagi
Taman-taman Laut Malaysia: Pendekatan Penyenaraian Kontingen. Malaysian Journal of Environmental Managemen: (4), 57-82.
Kementerian Sumber Asli dan Alam Sekitar (2004). Laporan Tahap Tampungan dan
Garis Panduan dan Pembangunan Pulau Tioman. Jabatan Pembangunan dan Perancangan Desa, Kuala Lumpur.
Nanthakumar Loganathan & Madzli Harun. 2008. Pelancongan dan Ekonomi Malaysia.
Dalam Yahya Ibrahim (ketua penyunting). Pelancongan Malaysia Isu Pembangunan, Budaya, Komuniti dan Persetempatan. Penerbit Universiti Utara Malaysia.
16
Patrica, et. al., (2006). Tourist Satisfaction and Destination Loyalty Intention: A Structural and Categorical Analysis. Jurnal of Business Science and Applied Management: (1)1
Redzuan Othman, Norlida Hanim Mohd Salleh. 2003. Ke Arah Pembangunan
Pelancongan Lestari Kawasan Dilindungi. Liberalisasi Perdagangan dan Sektor Pertanian Malaysia. Dalam Mohd Fauzi Mohd Jani (Ketua Penyunting). Liberalisasi Perdagangan, Daya Saing dan Inovasi Sektor Pertanian.Penerbit Univision Press.
Theresia A. Pawitra and Kay C. Tan (2003). Tourist satissfaction in Singapore – a
Satispective from Indonesian Tourists. Managing Service Quality: (13), 399-411. Tzu-Kuang Hsu, Yi-Fan Tsai, Herg-Huey Wu (2009). The Preference Analysis for
Tourist Choice of Destination: A Case study of Taiwan. Tourism Management: (30), 288-297.
Yahya Ibrahim & Nuraidah Ali Azizan. 2008. Peranan Komuniti dalam Pembangunan
dan Perubahan Alam Sekitar di Pulau Tioman. Dalam Yahya Ibrahim (ketua penyunting). Pelancongan Malaysia Isu Pembangunan, Budaya, Komuniti dan Persetempatan. Penerbit Universiti Utara Malaysia