45
Photo: Nancy Buck IMPORTANT PLANT AREAS PILOT MODEL FOR THE CALIFORNIA CENTRAL VALLEY 1

Photo: Nancy Buck
IMPORTANT PLANT AREASPILOT MODEL FOR THE CALIFORNIA CENTRAL VALLEY
1

Photos: Julie Evens cnps.org
IMPORTANT PLANT AREAS
• What are Important Plant Areas, and how are they a solution to current problems?
• How do we model Important Plant Areas?
• What are our Preliminary Results?
• Where do we go next?
2

Background and Context
cnps.org
Biodiversity is on the decline on a global scale• Global Strategy for plant conservation first adopted in 2000
• Called for protecting 50% of the most important areas for plant conservation• PlantLife International published criteria for identifying Important Plant
Areas in 2002
Photo: Nick Jensen
3

Background and Context
cnps.org
California is a Global Biodiversity Hotspot• More than 6500 taxa, approximately 25% of which are found nowhere else• East Bay Chapter of CNPS publishes assessment of Botanical Priority
Conservation Areas in 2006• Governor’s Office issues Executive Order declaring September 7 CA Biodiversity
Day, and calling for implementation of the California Biodiversity Initiative
Photo: Nick Jensen
4

Photo: Susan Levitsky 5
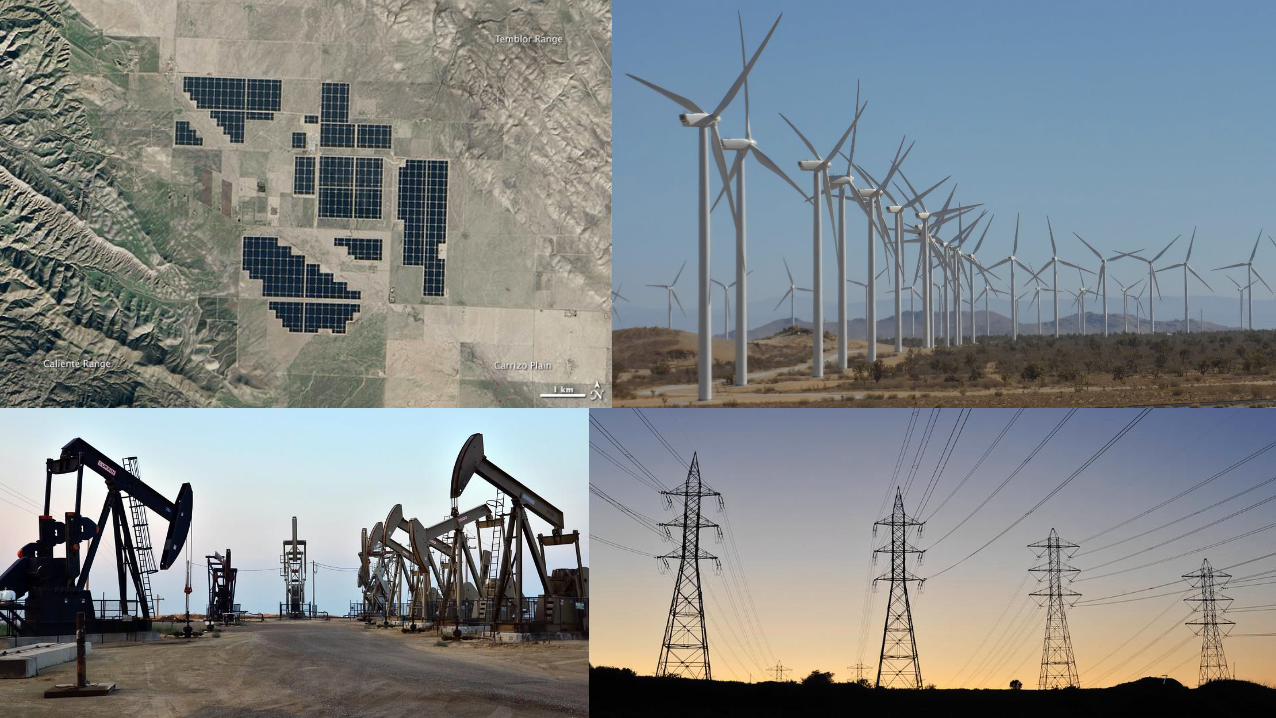
But there are competing
demands for resources…

Photo: Susan Levitsky 6
7
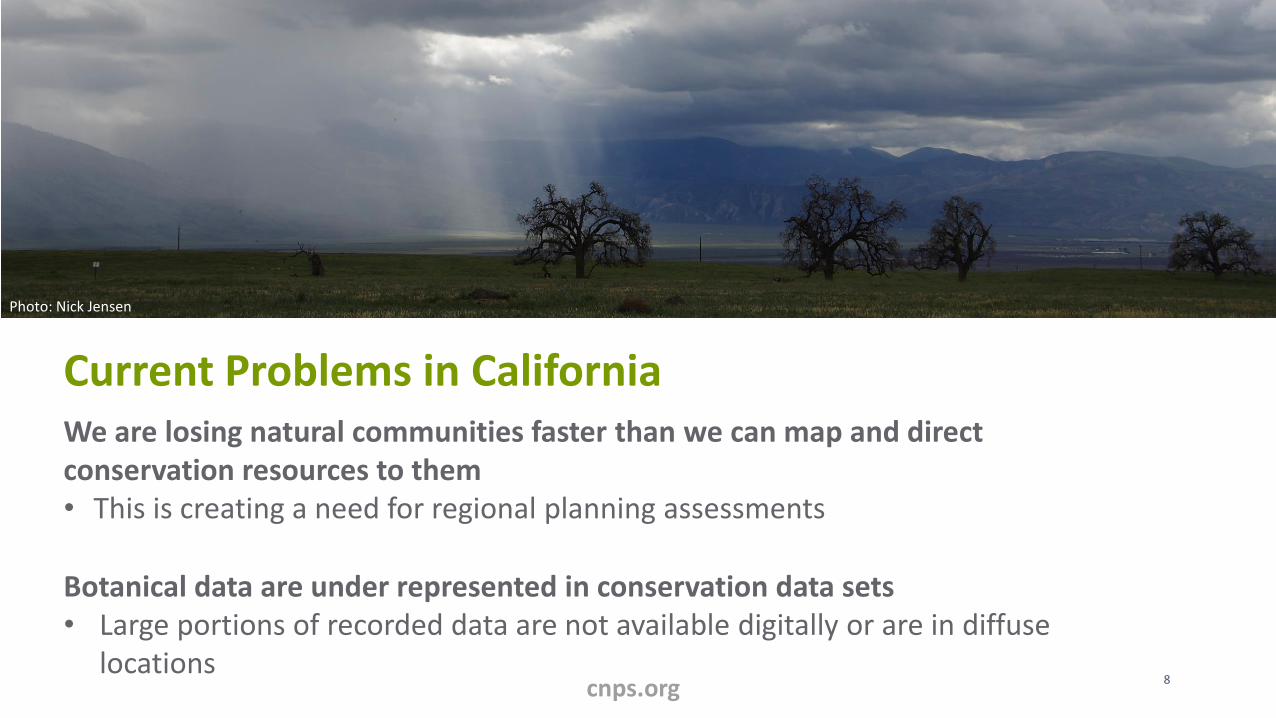
Current Problems in California
cnps.org
We are losing natural communities faster than we can map and directconservation resources to them• This is creating a need for regional planning assessments
Botanical data are under represented in conservation data sets• Large portions of recorded data are not available digitally or are in diffuse
locations
Photo: Nick Jensen
8
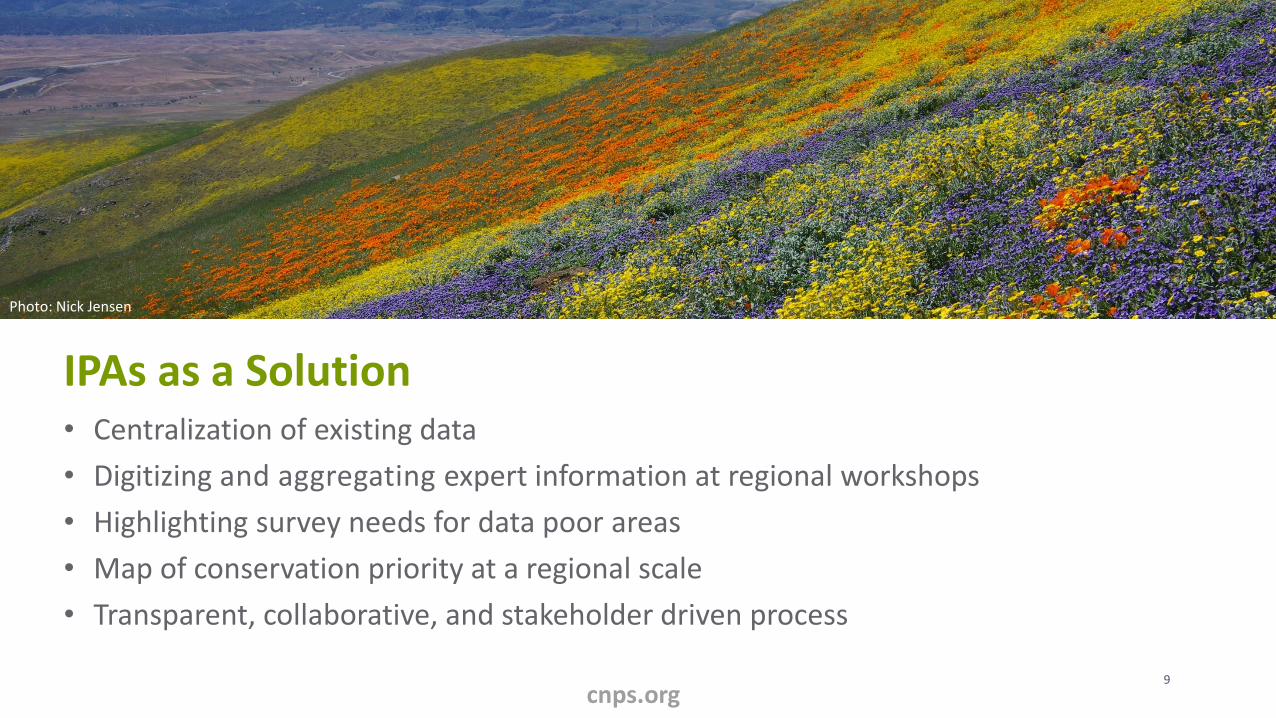
• Centralization of existing data
• Digitizing and aggregating expert information at regional workshops
• Highlighting survey needs for data poor areas
• Map of conservation priority at a regional scale
• Transparent, collaborative, and stakeholder driven process
IPAs as a Solution
cnps.org
Photo: Nick Jensen
9

HOW DO IMPORTANT PLANT AREAS WORK?
Photo: Nancy Buck cnps.org 10

Important Plant Areas are:
Photos: Jeff Bisbee cnps.org 5
• The areas most critical to preserving the flora of California which is under threat from changing land use and a changing climate.
• IPAs are identified by significant:• Rare plant populations• Rare vegetation communities• Ethnobotanical/cultural value• Species richness/Phylodiversity• Soil/Geology/other Unique Habitat
features
11
Photo: Nick Jensen
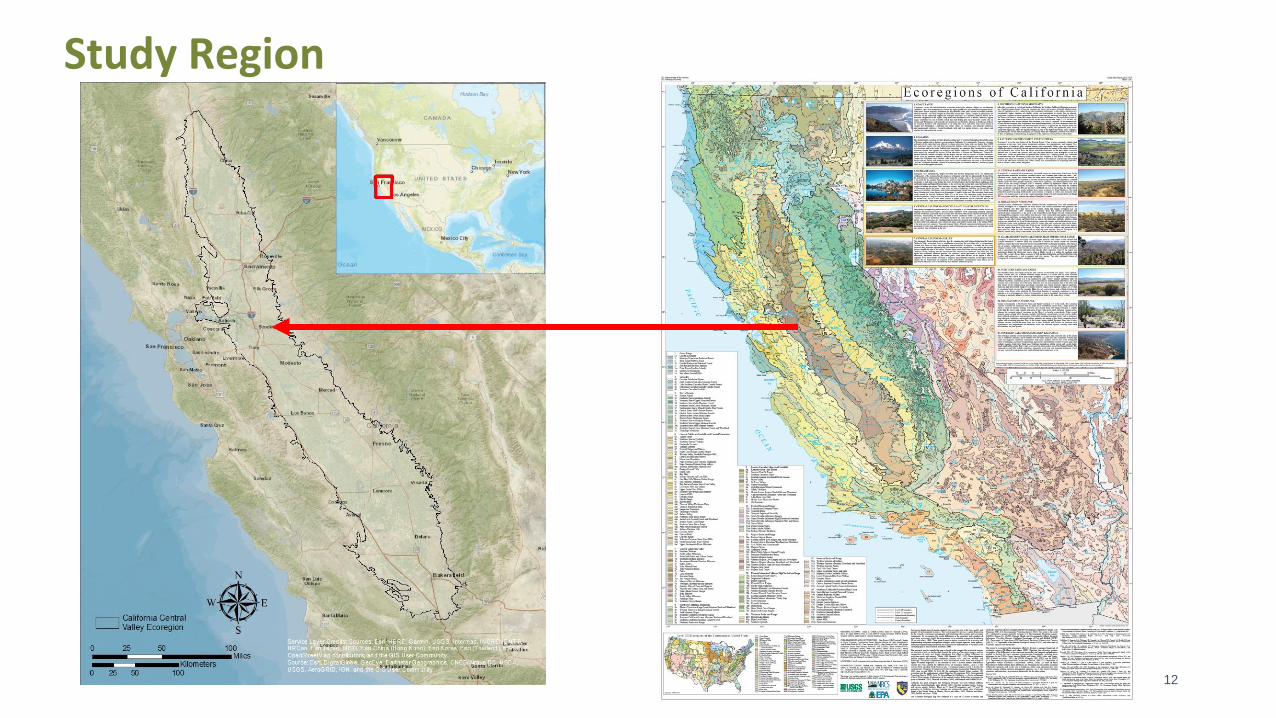
Study Region
12

Environmental Evaluation ModelingSystem (EEMS)
Photos: Jeff Bisbee cnps.org
• Developed by Conservation Biology Institute
• Normalized Logic Model
• Input attributes are resampled and processed to cellswithin a master shapefile
• Attributes are then stretched on a continuous spectrum from“False” (-1) to True (+1) based on how they contribute toconservation value
• Logic operators, weights, and thresholds allow for thecombination and manipulation of normalized attributes to produce a final “heat map for Conservation
Photos: Julie Evens 13
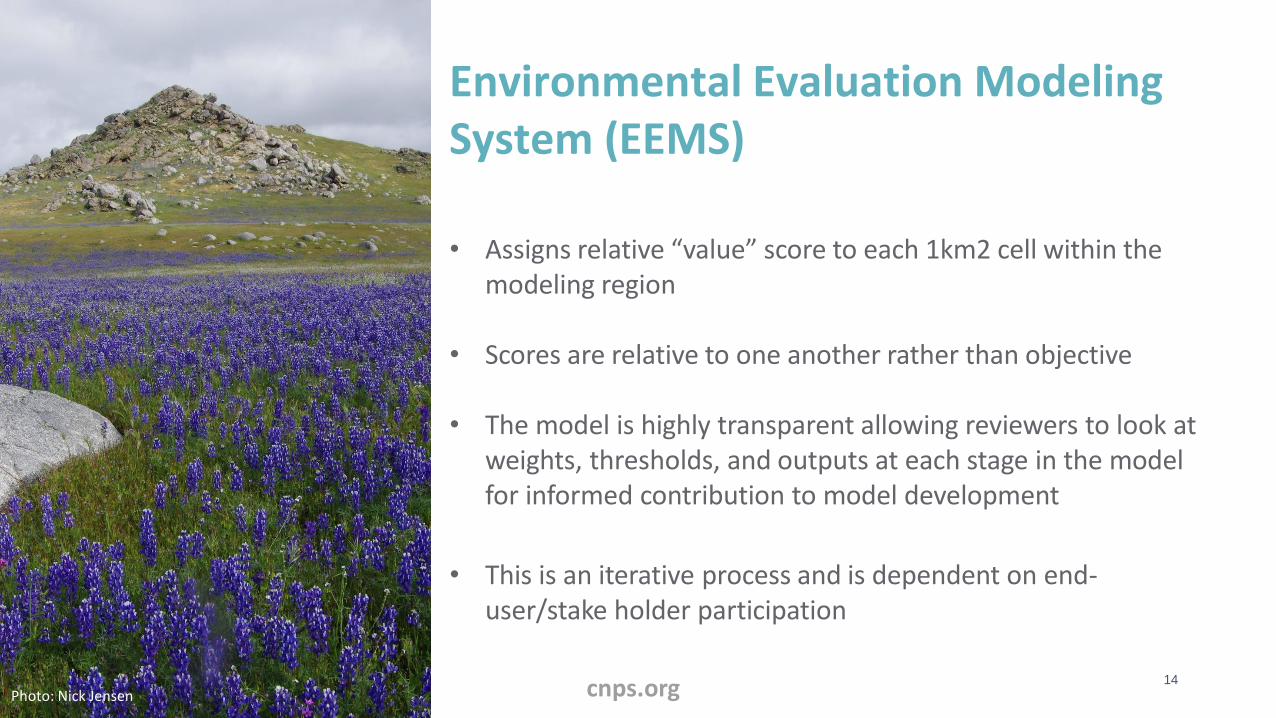
Environmental Evaluation ModelingSystem (EEMS)
Photos: Jeff Bisbee cnps.org
• Assigns relative “value” score to each 1km2 cell within the modeling region
• Scores are relative to one another rather than objective
• The model is highly transparent allowing reviewers to look atweights, thresholds, and outputs at each stage in the model for informed contribution to model development
• This is an iterative process and is dependent on end-user/stake holder participation
14
Photo: Nick Jensen
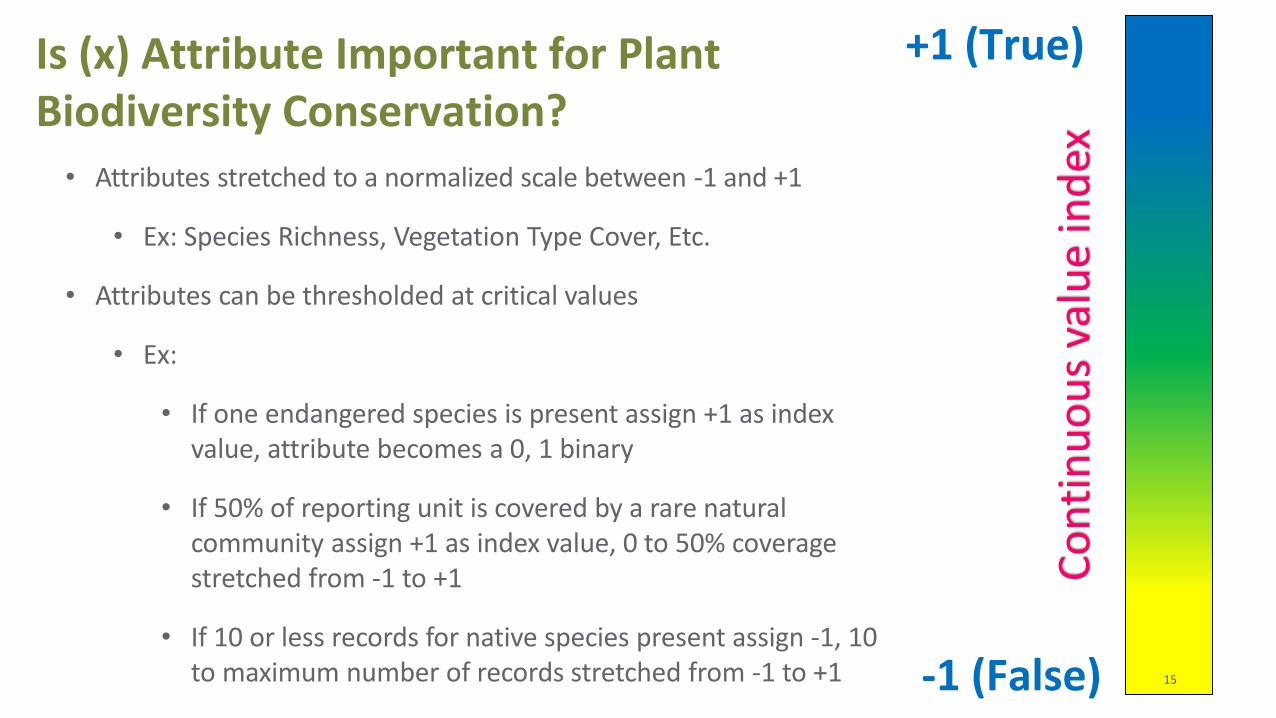
Is (x) Attribute Important for Plant Biodiversity Conservation?
+1 (True)
-1 (False)
• Attributes stretched to a normalized scale between -1 and +1
• Ex: Species Richness, Vegetation Type Cover, Etc.
• Attributes can be thresholded at critical values
• Ex:
• If one endangered species is present assign +1 as index value, attribute becomes a 0, 1 binary
• If 50% of reporting unit is covered by a rare natural community assign +1 as index value, 0 to 50% coverage stretched from -1 to +1
• If 10 or less records for native species present assign -1, 10 to maximum number of records stretched from -1 to +1
Co
nti
nu
ou
s va
lue
ind
ex
15
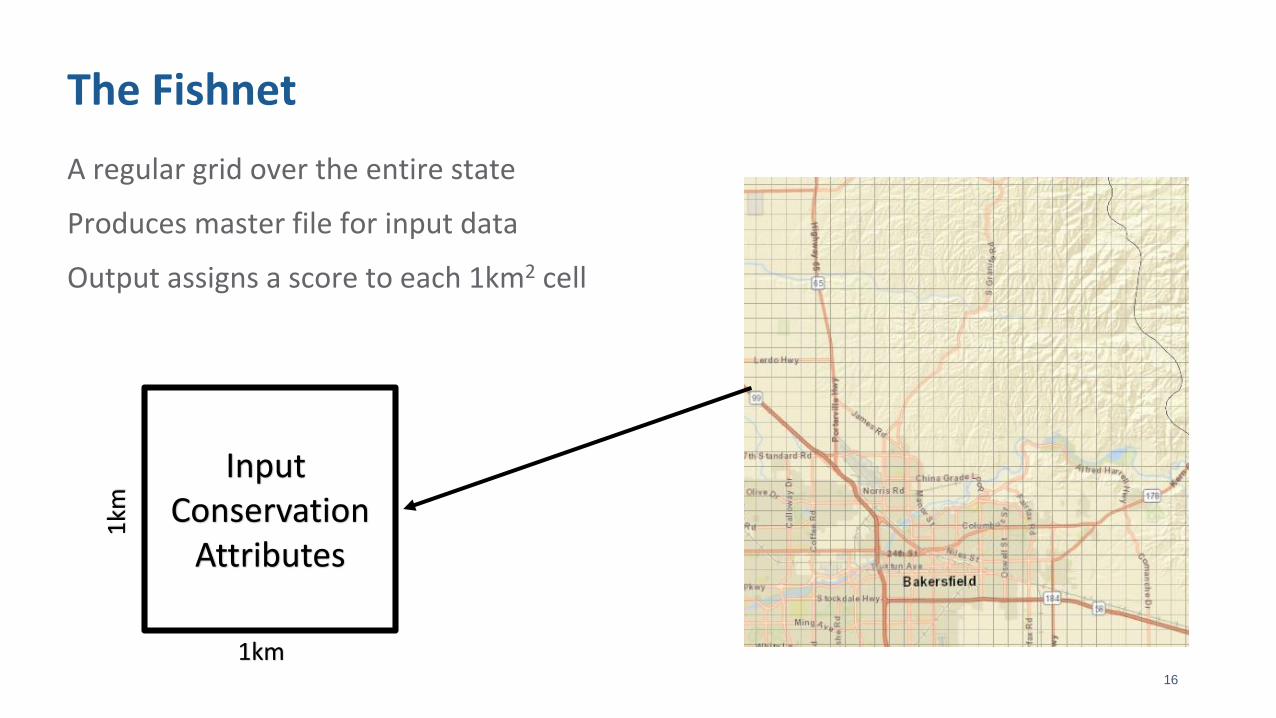
The Fishnet
A regular grid over the entire state
Produces master file for input data
Output assigns a score to each 1km2 cell
1km
1km
Input Conservation
Attributes
16

Important Plant Areas
Rare Species
Rare Vegetation and Habitat
FeaturesBotanically Significant Areas
Count of unique rare species within each 1km2 reporting unit
Sum of rare vegetation coverage
within each 1km2
reporting unit
Count/Sum of unique features each 1km2
reporting unit
Count of unique features in each 1km2
reporting unit
Set Threshold Set Threshold Set Threshold Set ThresholdBinary
(Presence/Absense)
CNDDB, RPI, CCH, CalFlora/iNaturalist,
SDMs, Expert Workshop Input
VegCAMP, Critical Habitat, CalVEG,
SSURGO, Geology, Expert Workshop Input
S1-S2 alliances andassociations CCH, SDMs, Land
Facets, Lineage Survival Time, Expert
Workshop Input
Workshop Inputfrom Indigenous
CommunitiesData Sources
Inputs
Metrics
Delineation Thresholds
Output Categories
Rare Species Location Data
Rare Vegetation Location Data
Native Species and Habitat Diversity
Metrics
Indigenous Gathering/ Cultivation Areas
17
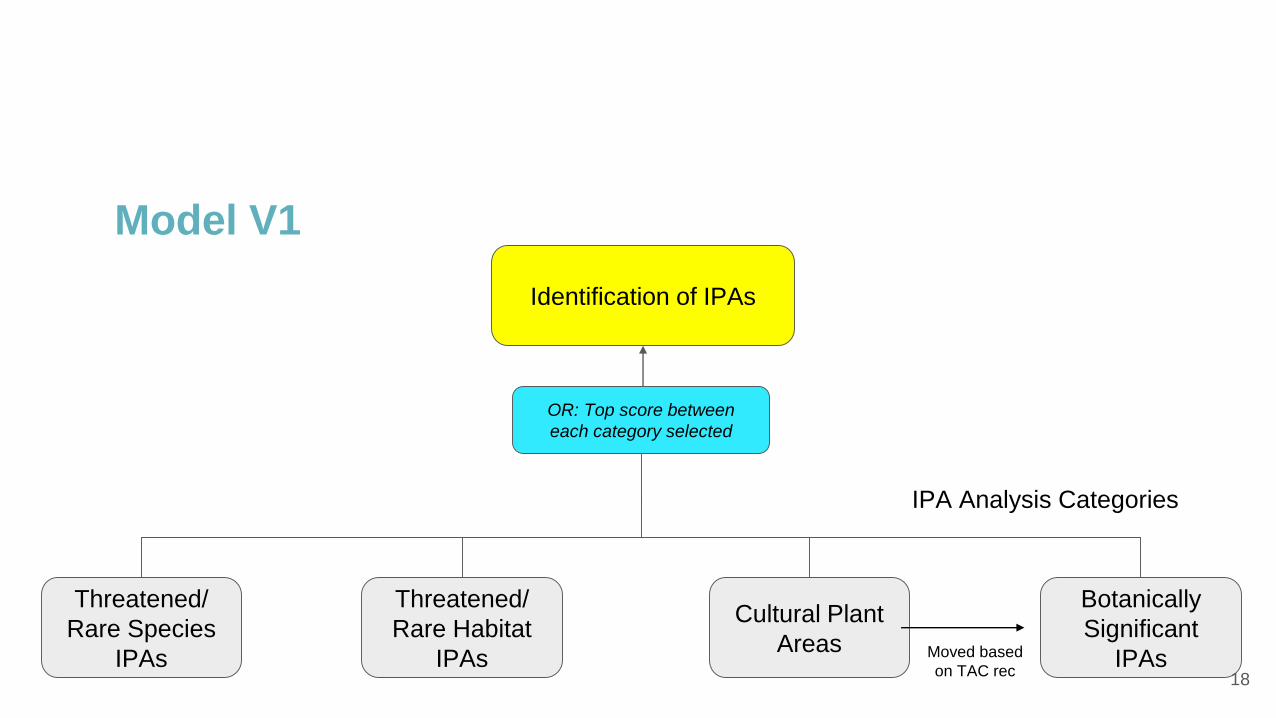
Threatened/
Rare Species
IPAs
Threatened/
Rare Habitat
IPAs
Cultural Plant
Areas
Botanically
Significant
IPAs
OR: Top score between
each category selected
IPA Analysis Categories
Identification of IPAs
Moved based
on TAC rec
Model V1
18

Threatened/
Rare Species
IPAs
Threatened/
Rare Habitat
IPAs
Botanically
Significant
IPAs
OR: Top score between
each category selected
Identification of
IPAs
Model V2
19
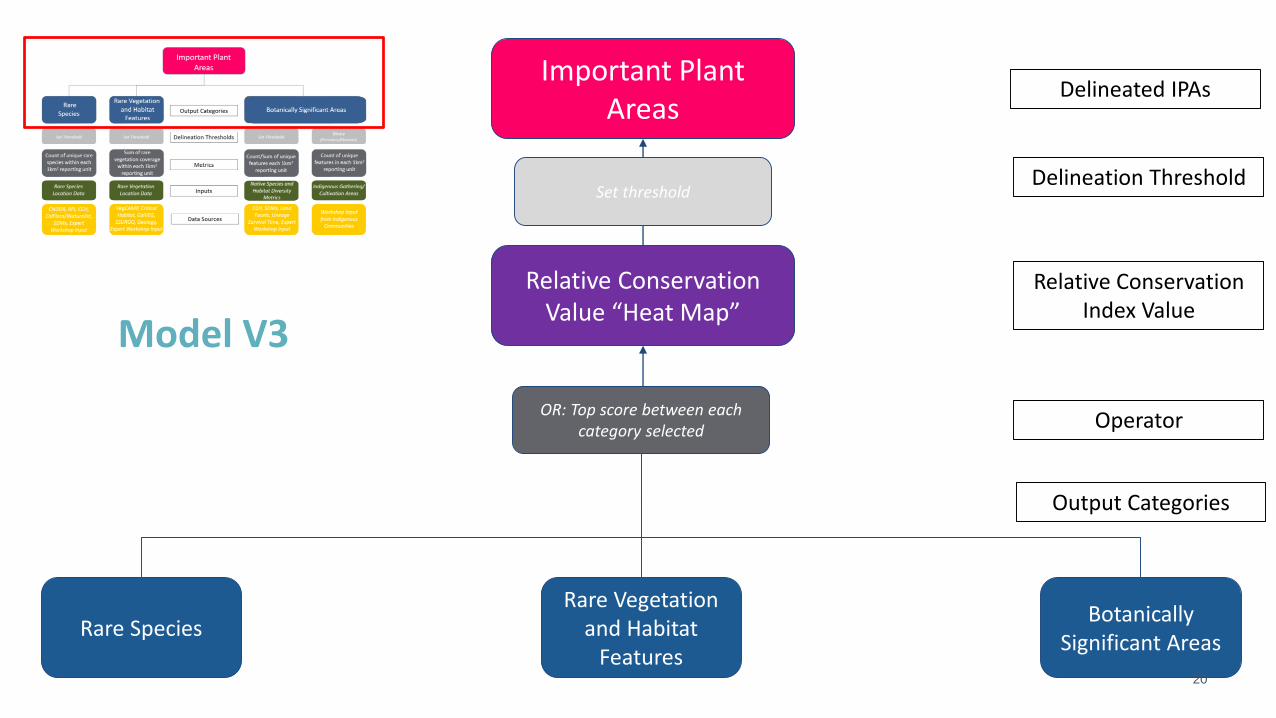
Rare SpeciesRare Vegetation
and Habitat Features
Botanically Significant Areas
OR: Top score between each category selected
Relative Conservation Value “Heat Map”
Important Plant Areas
Set threshold
Output Categories
Operator
Relative Conservation Index Value
Delineation Threshold
Delineated IPAs
20
Model V3

Threatened/Rare
Species IPAs
Weighted Union of
Count of unique
rare/special status
species within each
reporting unit
Set Thresholds: 0 =
FALSE; Greatest
Value = TRUE
CNDDB: Extirpated/ Historic
Occurrences
Removed
CNPS RPI
CCH/Symbiota/
iNaturalist/
CalFlora
All Location Data
from Workshops
Modeled Range
Data
Input Data
Fishnet
Evaluation
Metric
EEMS
Normalization
Parameters
Weighted Union
Weight = 1, 0.8 Weight = 1, 0.8 Weight = 1, 0.8 Weight = 1, 0.8
Delineating
threshold from
output “heat
map”
Weight = 1, 0.8
Weights are for CESA/FESA/List 1/List 2
plants, and List 3/List 4 Plants respectively
Weighted Union of
unique rare/special
status species SDM
within each reporting
unit
Set Thresholds: 0 =
FALSE; Greatest
Value = TRUE
Weight = 1, 0.5
Model V1
21
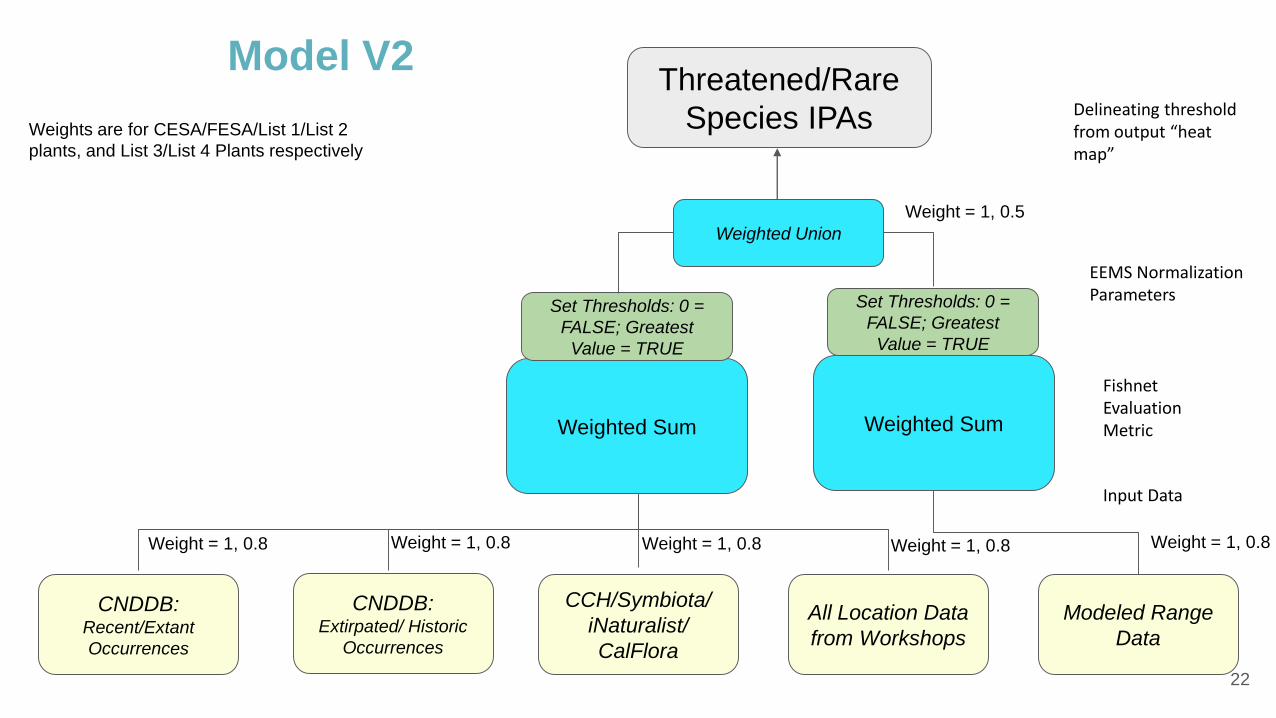
Threatened/Rare
Species IPAs
Weighted Sum
Set Thresholds: 0 =
FALSE; Greatest
Value = TRUE
CNDDB: Recent/Extant
Occurrences
CCH/Symbiota/
iNaturalist/
CalFlora
All Location Data
from Workshops
Modeled Range
Data
Input Data
Fishnet Evaluation Metric
EEMS Normalization Parameters
Weighted Union
Weight = 1, 0.8 Weight = 1, 0.8 Weight = 1, 0.8 Weight = 1, 0.8
Delineating threshold from output “heat map”
Weight = 1, 0.8
Weights are for CESA/FESA/List 1/List 2
plants, and List 3/List 4 Plants respectively
Weighted Sum
Set Thresholds: 0 =
FALSE; Greatest
Value = TRUE
Weight = 1, 0.5
CNDDB: Extirpated/ Historic
Occurrences
Model V2
22

Rare Species
Weighted Sum
Species Richness: Recent Presumed
ExtantOccurrences
Species Richness: Exirpated
Occurrences
Species Richness: Occurrences for
species presumed to be extinct
Modeled Range Data
Weighted Union
Species Richness: Historic Presumed
Extant Occurrences
Set Thresholds: 0 = FALSE; 1= TRUE
Weighted Sum Weighted Sum Sum Weighted Sum
Set Thresholds: 0 = FALSE; 1= TRUE
Set Thresholds: 0 = FALSE; 1= TRUE
Set Thresholds: 0 = FALSE; 1= TRUE
Set Thresholds: 0 = FALSE; 24 = TRUE
23
Model V3

Rare Species
Occurrence Data
California Natural Diversity Database – May 2019 Download. Will be updated in next iteration• Removed occurrences with less than .25mi accuracy
California Consortium of Herbaria – February 2019 extraction from CCH database• Added 0.25mi buffer to points to standardize accuracy
Calflora• Includes “research grade” iNaturalist records which Calflora imports• Some spatial data does not export from CalFlora – specifically regional checklist information which contains
observation locations.• Added 0.25mi buffer to standardize accuracy
Workshop Input• New and updated occurrence information provided at 2017 expert workshop in Bakersfield, CA.
24
Rare Species
Occurrence Data
• All occurrence data is joined with CNPS Rare Plant Inventory export tables to standardize nomenclature and assign appropriate rare plant rank if applicable
• Separated extirpated and possibly extirpated occurrences as independent input
• Separated occurrences older than 20 years as independent input
• Separated occurrences from within the last 20 years as independent input
• Separated occurrences for species thought to be extinct in California
• Combined count of unique species in each as measure of species richness
25
Species Distribution Models
• Thornhill et al., 2017 (https://dash.berkeley.edu/stash/dataset/doi:10.6078/D1QQ2S) species distribution models for over 5,000 species in California
• Special status species copied to subfolder using custom .bat file and aggregated by Rare Plant Rank:• 1A – Species presumed to be extinct• 2A – Species presumed to be extinct in California, but are still present elsewhere• 1B – Rare, threatened, or endangered in California and elsewhere• 2B – Rare, threatened, or endangered in California, but more common elsewhere• 3 – plants which have little data available (review list)• 4 – plants of limited distribution (watch list)(https://www.cnps.org/rare-plants/cnps-inventory-of-rare-plants)
• Used sum of continuous MaxEnt score for all species modeled in each California Rare Plant Rank List.
Rare Species
26
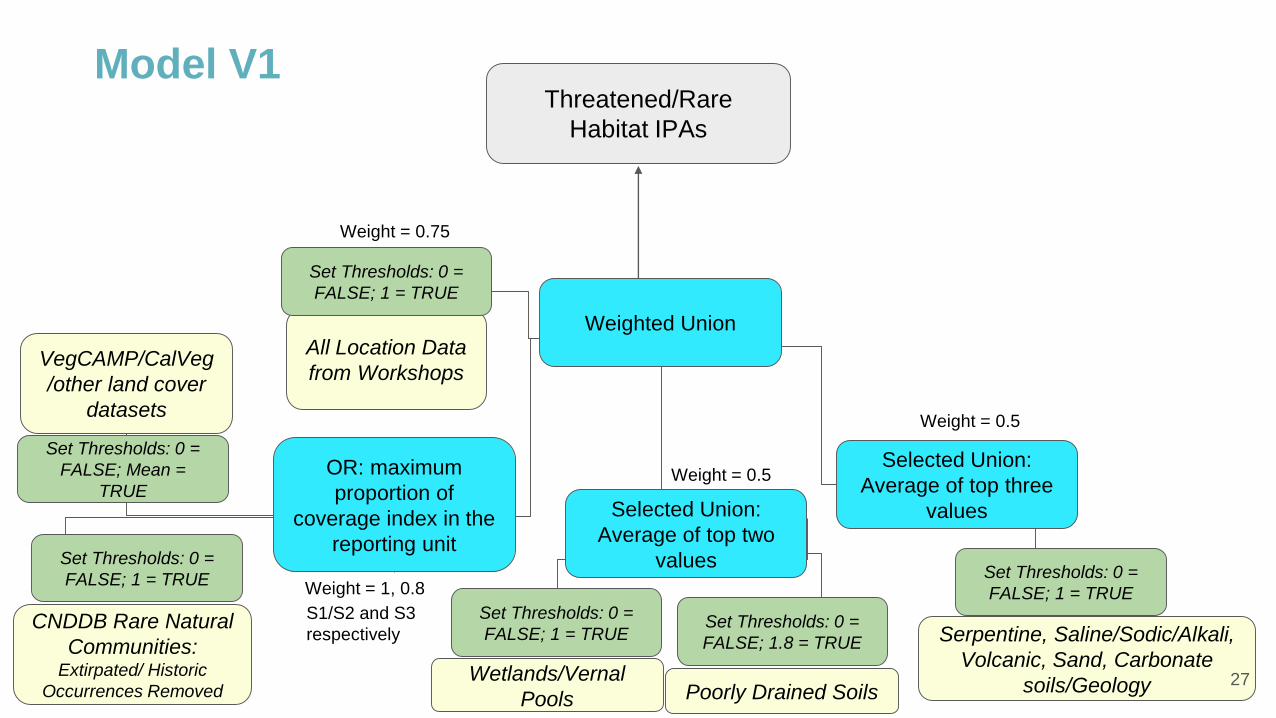
Threatened/Rare
Habitat IPAs
OR: maximum
proportion of
coverage index in the
reporting unit
Set Thresholds: 0 =
FALSE; Mean =
TRUE
CNDDB Rare Natural
Communities: Extirpated/ Historic
Occurrences Removed
VegCAMP/CalVeg
/other land cover
datasets
All Location Data
from Workshops
Serpentine, Saline/Sodic/Alkali,
Volcanic, Sand, Carbonate
soils/Geology
Set Thresholds: 0 =
FALSE; 1 = TRUE
Set Thresholds: 0 =
FALSE; 1.8 = TRUE
Poorly Drained SoilsWetlands/Vernal
Pools
Set Thresholds: 0 =
FALSE; 1 = TRUE
Set Thresholds: 0 =
FALSE; 1 = TRUE
Selected Union:
Average of top two
values
Selected Union:
Average of top three
values
Set Thresholds: 0 =
FALSE; 1 = TRUE
Weighted Union
Weight = 1, 0.8
S1/S2 and S3
respectively
Weight = 0.75
Weight = 0.5
Weight = 0.5
Model V1
27
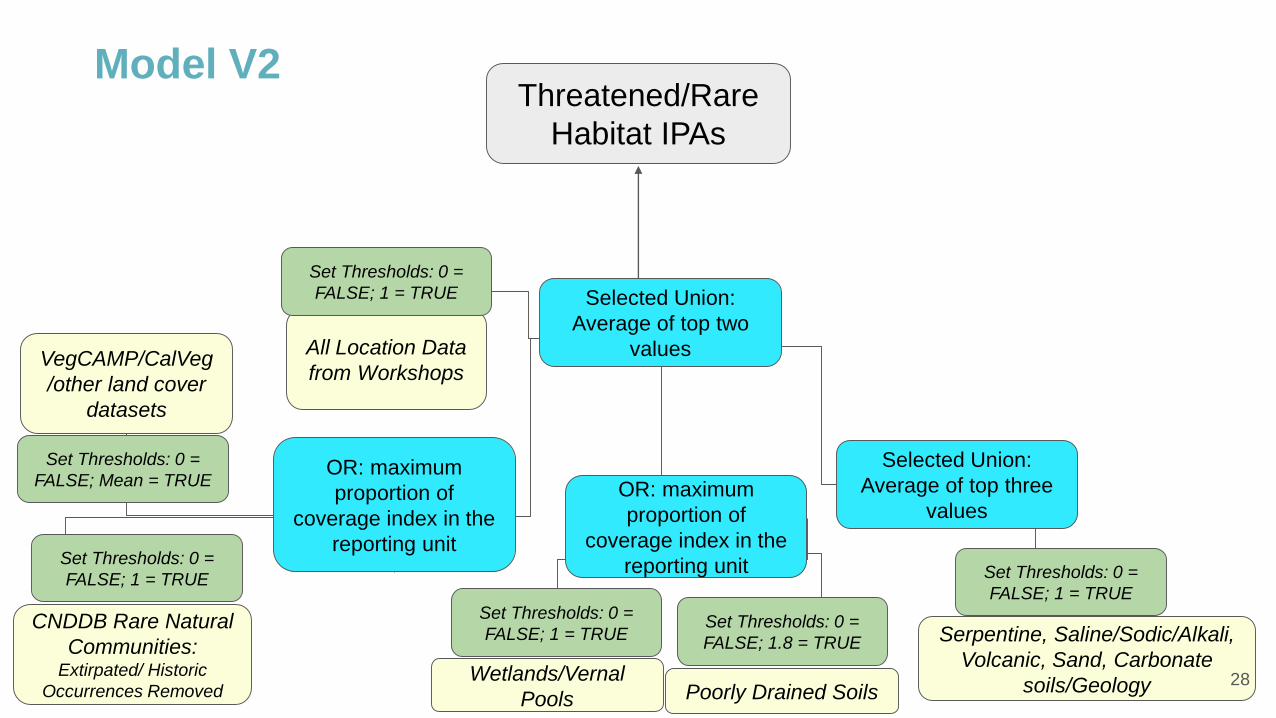
Threatened/Rare
Habitat IPAs
OR: maximum
proportion of
coverage index in the
reporting unit
Set Thresholds: 0 =
FALSE; Mean = TRUE
CNDDB Rare Natural
Communities: Extirpated/ Historic
Occurrences Removed
VegCAMP/CalVeg
/other land cover
datasets
All Location Data
from Workshops
Serpentine, Saline/Sodic/Alkali,
Volcanic, Sand, Carbonate
soils/Geology
Set Thresholds: 0 =
FALSE; 1 = TRUE
Set Thresholds: 0 =
FALSE; 1.8 = TRUE
Poorly Drained SoilsWetlands/Vernal
Pools
Set Thresholds: 0 =
FALSE; 1 = TRUE
Set Thresholds: 0 =
FALSE; 1 = TRUE
OR: maximum
proportion of
coverage index in the
reporting unit
Selected Union:
Average of top three
values
Set Thresholds: 0 =
FALSE; 1 = TRUE
Selected Union:
Average of top two
values
Model V2
28
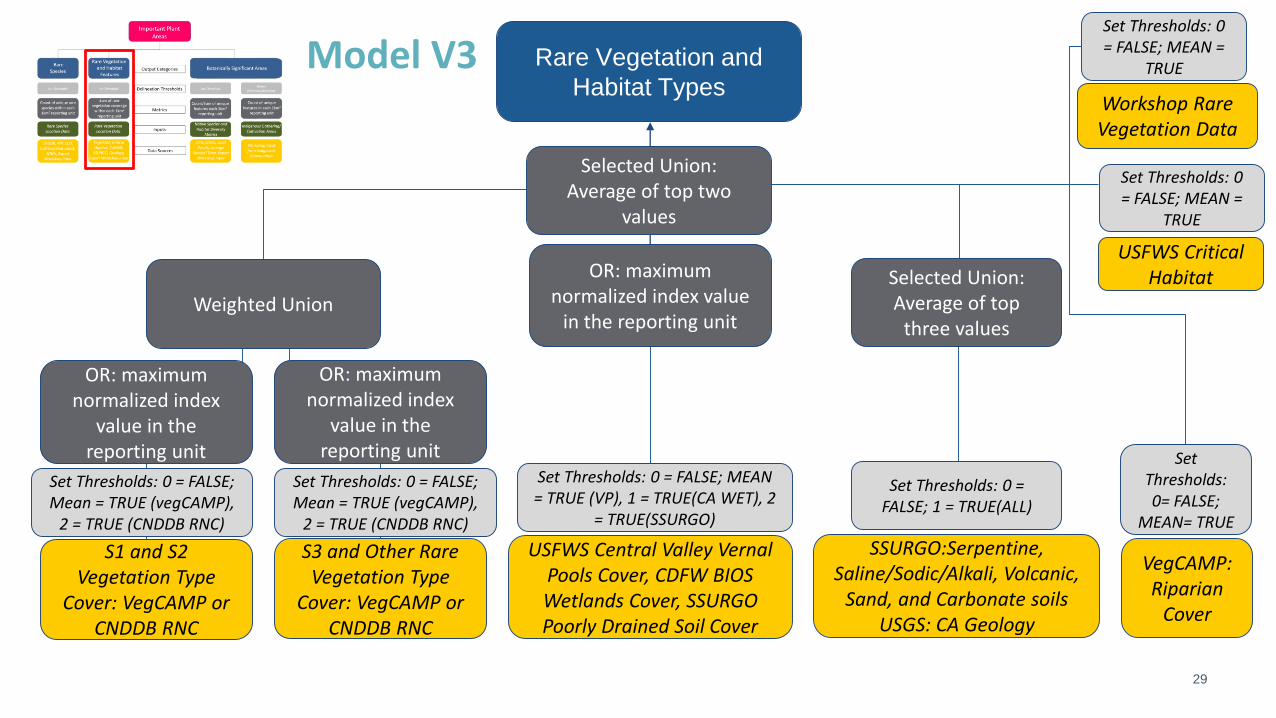
Set Thresholds: 0 = FALSE; Mean = TRUE (vegCAMP),
2 = TRUE (CNDDB RNC)
USFWS Central Valley Vernal Pools Cover, CDFW BIOS Wetlands Cover, SSURGO Poorly Drained Soil Cover
S1 and S2 Vegetation Type
Cover: VegCAMP or CNDDB RNC
Workshop Rare Vegetation Data
SSURGO:Serpentine, Saline/Sodic/Alkali, Volcanic,
Sand, and Carbonate soilsUSGS: CA Geology
Set Thresholds: 0 = FALSE; Mean = TRUE (vegCAMP),
2 = TRUE (CNDDB RNC)
Set Thresholds: 0= FALSE;
MEAN= TRUE
USFWS Critical Habitat
Set Thresholds: 0 = FALSE; MEAN =
TRUE
Set Thresholds: 0 = FALSE; MEAN = TRUE (VP), 1 = TRUE(CA WET), 2
= TRUE(SSURGO)
Selected Union: Average of top
three values
Set Thresholds: 0 = FALSE; 1 = TRUE(ALL)
Selected Union: Average of top two
values
Rare Vegetation and
Habitat Types
Weighted Union
OR: maximum normalized index
value in the reporting unit
S3 and Other Rare Vegetation Type
Cover: VegCAMP or CNDDB RNC
OR: maximum normalized index
value in the reporting unit
OR: maximum normalized index value
in the reporting unit
VegCAMP: Riparian
Cover
Set Thresholds: 0 = FALSE; MEAN =
TRUE
29
Model V3

Vegetation
VegCAMP Great Valley Vegetation Dataset• Extracted “rare” polygons• Categorized by S1 – S3 or unlabeled• Extracted Riparian polygons
CNDDB Rare Natural Communities – May 2018• Removed all extirpated or possibly extirpated occurrences• Categorized by S1 – S3
Workshop Data• Rare vegetation type occurrence data gathered at the South San Joaquin Workshop in 2017
Protected Habitat
USFWS Critical Habitat• Extracted critical habitat polygons for plant species in California
Rare Vegetation and
Habitat Types
30
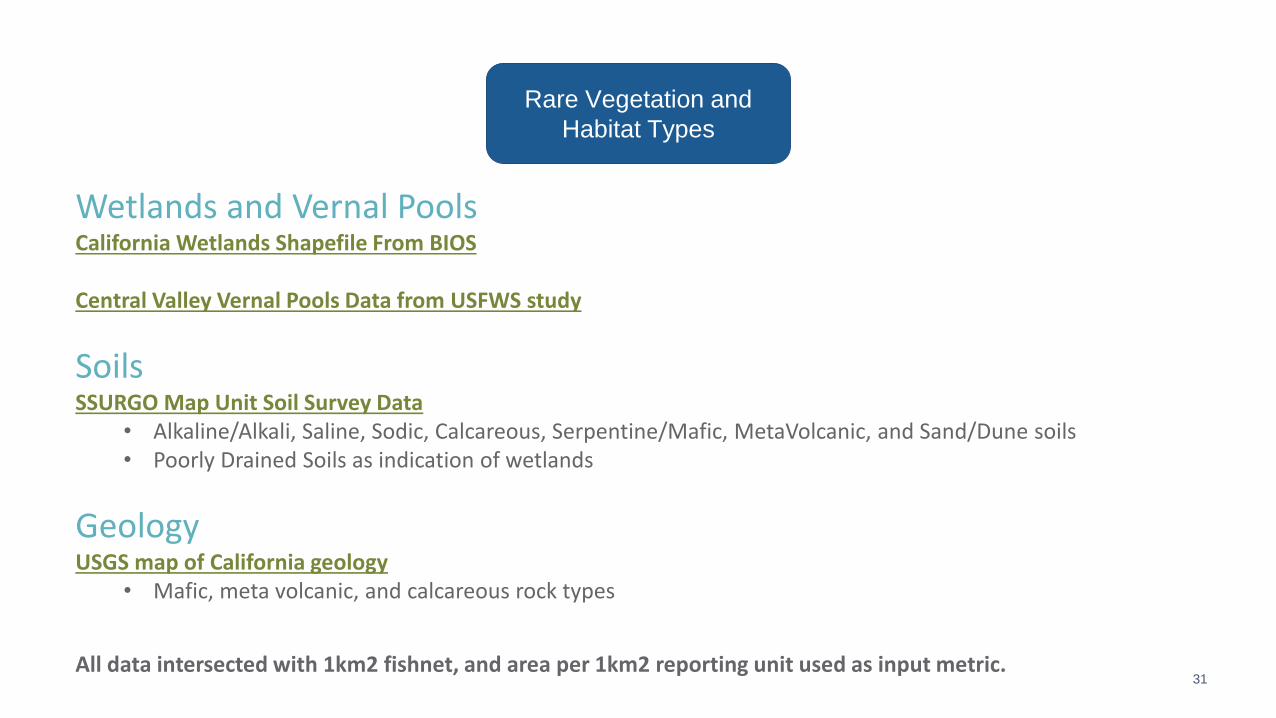
Wetlands and Vernal PoolsCalifornia Wetlands Shapefile From BIOS
Central Valley Vernal Pools Data from USFWS study
SoilsSSURGO Map Unit Soil Survey Data
• Alkaline/Alkali, Saline, Sodic, Calcareous, Serpentine/Mafic, MetaVolcanic, and Sand/Dune soils• Poorly Drained Soils as indication of wetlands
GeologyUSGS map of California geology
• Mafic, meta volcanic, and calcareous rock types
All data intersected with 1km2 fishnet, and area per 1km2 reporting unit used as input metric.
Rare Vegetation and
Habitat Types
31

Botanically Significant IPAs
Set Thresholds: Least Value =
FALSE; Greatest Value =
TRUE
Phylodiversity/
Phyloendemism
(Survival Time)
High native
species richness
from Baldwin
data
Input Data
Fishnet
Evaluation Metrics
EEMS Function
Weight = 0.8 Weight = 1
Delineating threshold from output “heat map”
Workshop Input
Modeled Native
Species
Richness
Weight = 0.75
Weighted Union
EEMS Normalization Parameters
Relative Relief Slope Variability
Aspect Variability
Union of
topographic
featuresSet Thresholds: 0 = FALSE; 1
= TRUESet Thresholds: Least Value =
FALSE; Greatest Value =
TRUE
Weight = 0.5
Weight = 0.5
Model V1
32
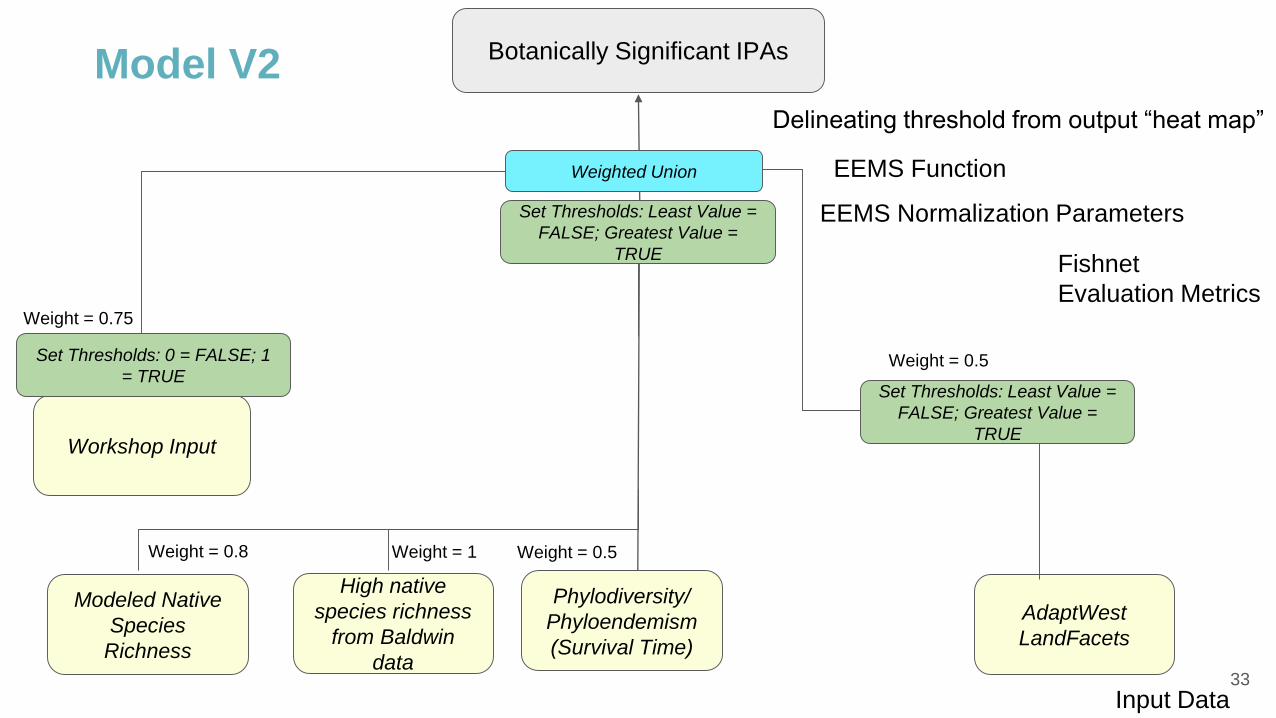
Botanically Significant IPAs
Set Thresholds: Least Value =
FALSE; Greatest Value =
TRUE
Phylodiversity/
Phyloendemism
(Survival Time)
High native
species richness
from Baldwin
data
Input Data
Fishnet
Evaluation Metrics
EEMS Function
Weight = 0.8 Weight = 1
Delineating threshold from output “heat map”
Workshop Input
Modeled Native
Species
Richness
Weight = 0.75
Weighted Union
EEMS Normalization Parameters
AdaptWest
LandFacets
Set Thresholds: 0 = FALSE; 1
= TRUESet Thresholds: Least Value =
FALSE; Greatest Value =
TRUE
Weight = 0.5
Weight = 0.5
Model V2
33
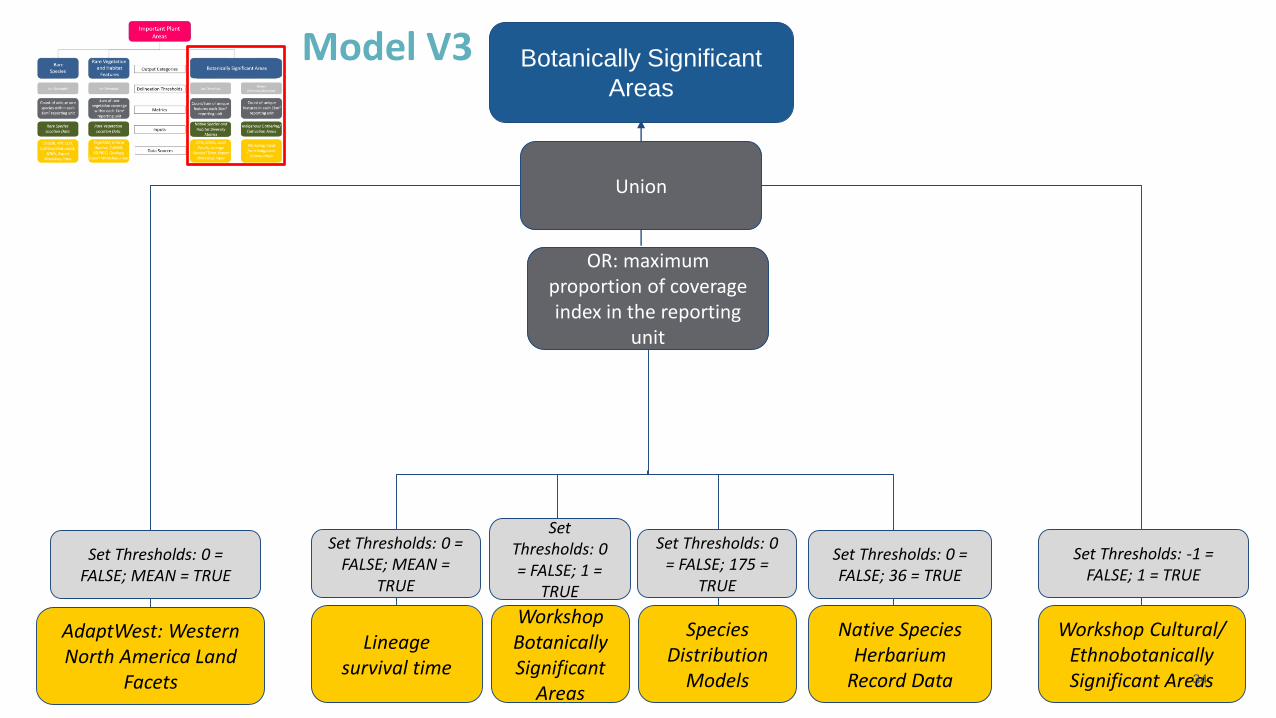
Set Thresholds: 0 = FALSE; MEAN =
TRUE
Lineage survival time
AdaptWest: Western North America Land
Facets
Workshop Botanically Significant
Areas
Workshop Cultural/ EthnobotanicallySignificant Areas
Set Thresholds: 0 = FALSE; MEAN = TRUE
Set Thresholds: 0 = FALSE; 36 = TRUE
Native Species Herbarium
Record Data
Species Distribution
Models
Set Thresholds: 0 = FALSE; 175 =
TRUE
OR: maximum proportion of coverage index in the reporting
unit
Set Thresholds: -1 = FALSE; 1 = TRUE
Union
Botanically Significant
Areas
Set Thresholds: 0 = FALSE; 1 =
TRUE
34
Model V3
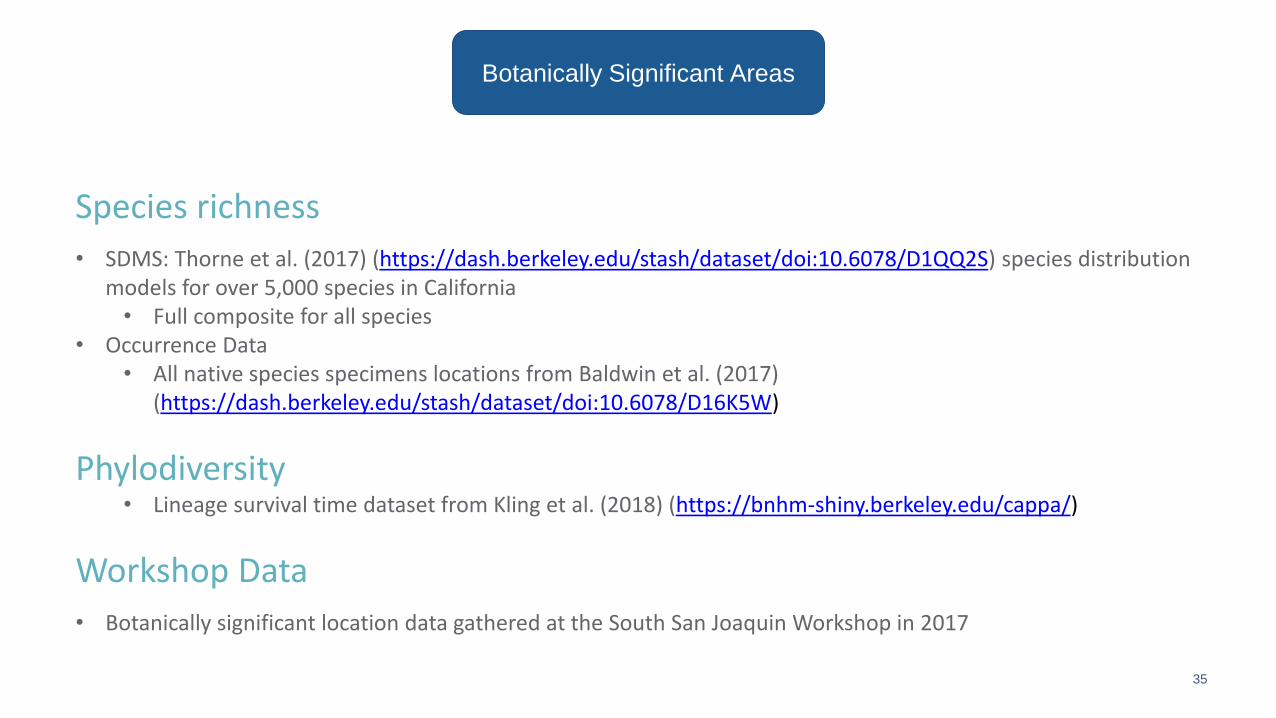
Species richness
• SDMS: Thorne et al. (2017) (https://dash.berkeley.edu/stash/dataset/doi:10.6078/D1QQ2S) species distribution models for over 5,000 species in California
• Full composite for all species• Occurrence Data
• All native species specimens locations from Baldwin et al. (2017) (https://dash.berkeley.edu/stash/dataset/doi:10.6078/D16K5W)
Phylodiversity• Lineage survival time dataset from Kling et al. (2018) (https://bnhm-shiny.berkeley.edu/cappa/)
Workshop Data
• Botanically significant location data gathered at the South San Joaquin Workshop in 2017
Botanically Significant Areas
35
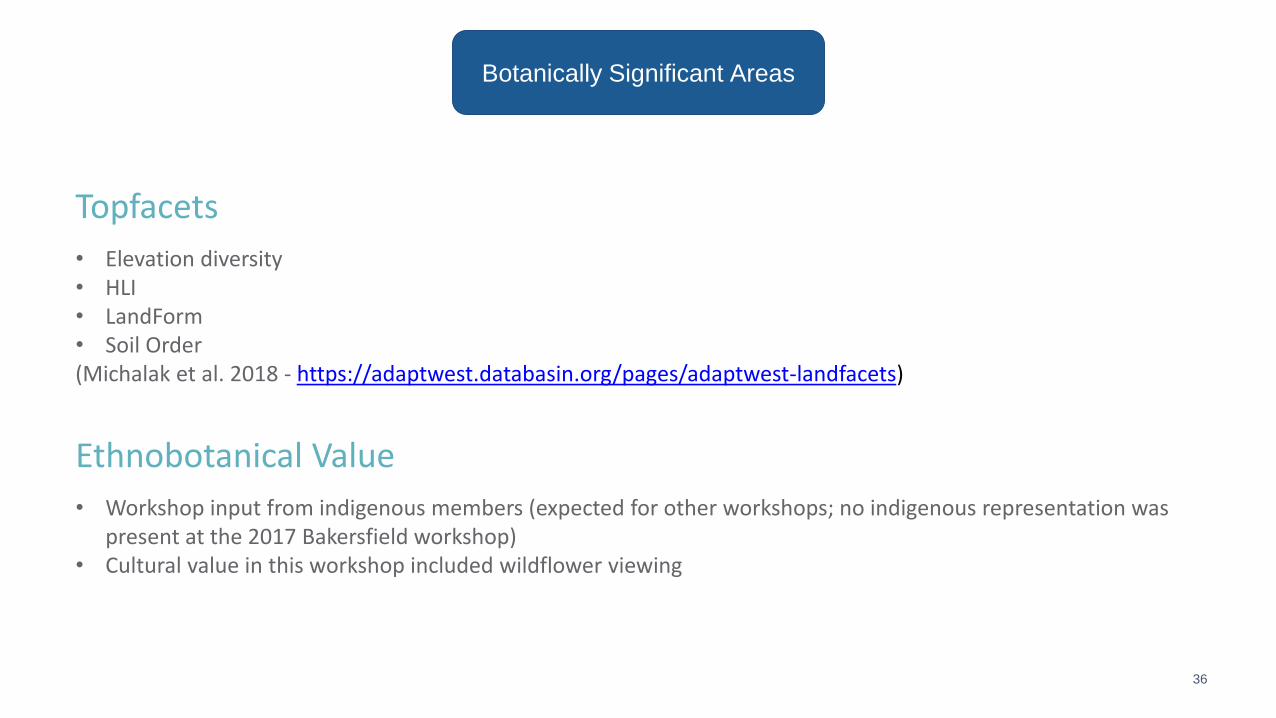
Topfacets
• Elevation diversity• HLI• LandForm• Soil Order(Michalak et al. 2018 - https://adaptwest.databasin.org/pages/adaptwest-landfacets)
Ethnobotanical Value
• Workshop input from indigenous members (expected for other workshops; no indigenous representation was present at the 2017 Bakersfield workshop)
• Cultural value in this workshop included wildflower viewing
Botanically Significant Areas
36

PRELIMINARY RESULTS
Photo: Nancy Buck cnps.org 37

Photos: Judy Kramer cnps.org
2
13
4
5
6
7
8 9
10
Model V11. Sacramento National Wildlife Refuge
2. Butte Sink Wetlands
3. East Sacramento Valley Vernal Pool Complexes
4. Travis Air Force Base Vernal Pools
5. San Luis National Wildlife Refuge, Merced National Wildlife Refuge, and Mud Slough Wetlands
6. Merced Vernal Pools Complexes
7. Mendota Waterfowl Management Area
8. Pixley National Wildlife Refuge, Kern National Wildlife Refuge, and South San Joaquin Vernal Pool Complexes
9. Southwest San Joaquin Valley Edge
10. Tejon Ranch Wildflower Fields
38

Photos: Judy Kramer cnps.org
2
13
4
5
6
7
8 9
10
Model V21. Sacramento National Wildlife Refuge
2. Butte Sink Wetlands
3. East Sacramento Valley Vernal Pool Complexes
4. Travis Air Force Base Vernal Pools
5. San Luis National Wildlife Refuge, Merced National Wildlife Refuge, and Mud Slough Wetlands
6. Merced Vernal Pools Complexes
7. Mendota Waterfowl Management Area
8. Pixley National Wildlife Refuge, Kern National Wildlife Refuge, and South San Joaquin Vernal Pool Complexes
9. Southwest San Joaquin Valley Edge
10. Tejon Ranch Wildflower Fields
39

Photos: Judy Kramer cnps.org
2
13
4
5
6
7
8 9
10
Model V3 Results1. Sacramento National Wildlife Refuge
2. Butte Sink Wetlands
3. East Sacramento Valley Vernal Pool Complexes
4. Travis Air Force Base Vernal Pools
5. San Luis National Wildlife Refuge, Merced National Wildlife Refuge, and Mud Slough Wetlands
6. Merced Vernal Pools Complexes
7. Mendota Waterfowl Management Area
8. Pixley National Wildlife Refuge, Kern National Wildlife Refuge, and South San Joaquin Vernal Pool Complexes
9. Southwest San Joaquin Valley Edge
10. Tejon Ranch Wildflower Fields
40
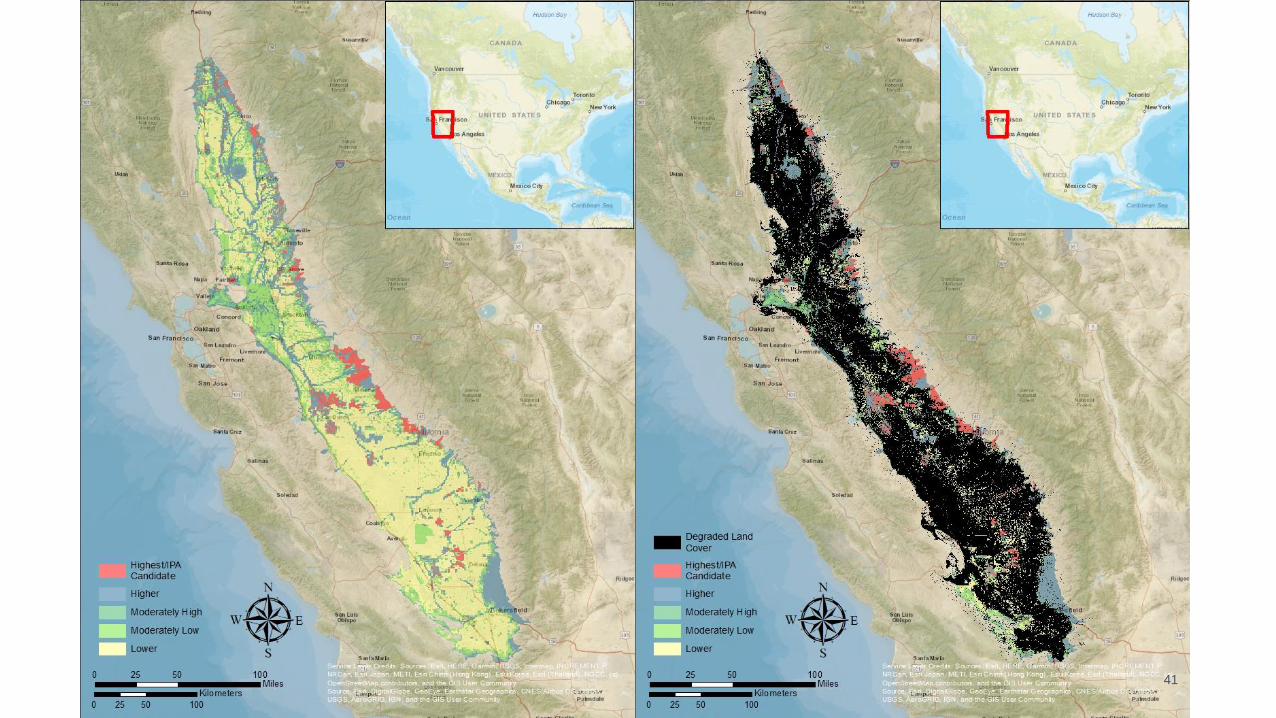
Photos: Judy Kramer cnps.org 1041

cnps.org 1042
Remaining natural habitats in the California
Central Valley are highly valuable for regional
biodiversity conservation.
• Model consistently identified similar areas as high or highest relative conservation
value across all three versions despite differences in input metrics and operators
• These consistently aligned with remaining natural habitat in the central valley
• Many of these areas are already have some form of protected status with the
exception of the southeastern valley edge – possible conservation opportunity?

Important Plant Areas uses:
Photos: Jeff Bisbee cnps.org 5
• A map of conservation priority
• A decision support tool for land managers
• A lever for conservation advocacy
• A transparent method for agencies toallocate limited conservation resources most efficiently
43
Photo: Nick Jensen
Next Steps
Photos: Judy Kramer cnps.org
1) Broader stakeholder engagement and
additional model iteration
2) Replication of process for the rest of
California’s Ecoregions
44

Thank You and Acknowledgements
cnps.org 23
Photo: Nick Jensen
EEMS Modeling and EEMS Online Technical Support
IPA Technical Advisory Committee
IPA Workshop Participants and Data Contributors
Heath Bartosh, Stephanie Dashiel , Rebecca Degange, Melanie Gogol-Prokurat, Denny Grossman, Todd Keeler -Wolf, Lech Naumovich, Dustin Pearce, Jim Strittholt
Fred Chynoweth, Lucy Clark, Jul ie Clark DeBlasio, El len Cypher, Andrew Glazier, Clyde Golden, Rob Hansen, Bobby Kamansky, Denis Kearns, Mathew Kling, Russel l Kokx, Neal Kramer, El lery Mayence, Randi McCormick, Brent Mishler, Diane Mitchell , Laura Pavl iscak, Rich Spjut, Greg Warrick, Chris Winchell , Camdil la Wirth
45


