ROBERT Z. LAWRENCE Brookings Institution Imports in Japan: Closed Markets or Minds? COMPAREDWITH other industrial countries, Japanimportsan unusually small share of its domestic use of manufactured goods. In 1980, for example, imports accounted forjust5.8 percent of Japanese expenditures on manufactured products, comparedwith 9.3 percent of U.S. expen- ditures.That same year, non-ECimportsaccountedfor 13.9percent of spending by the European Community. I WhyJapan importsso little is a source of greatcontroversy. Popular explanations stress the role of bothofficial andunofficial import barriers. The Japanese government allegedlytakes advantage of the openness of foreign markets while reserving local markets for domesticfirms. It once implemented this mercantilist policy through formalprotectionist mea- sures such as tariffsand quotas. Today it uses administrative guidance, discriminatory standardsand regulations, selective government pro- curement,the official organization of domestic firms into cartels, and weak enforcement of antitrust laws. Japaneseimports are also discour- agedby unofficial practices, such as the strongrelationships ("invisible handshakes") betweenlocal suppliers andbuyers, "just-in-time" inven- tory practices that give nearby suppliers an edge, and an unusually complex distribution system that creates substantial entry barriers for newcomers, whether Japanese or foreign.2 I amgrateful to Morio Kuninori, Marcus Noland,and Gary Saxonhouse forcomments; to Gregory Hume, Dale Thompson,and Amy Salsbury for researchassistance; and to EvelynTaylor for text processing. 1. Derek BladesandWendy Simpson,"TheOECD Compatible Trade andProduction Data Base," Working Paper 18 (Organization forEconomic Cooperation and Development, January 1985). 2. See Dorothy Christelow, "Japan's Intangible Barriers to Trade in Manufactures," Federal Reserve Bank of New York Quarterly Review, vol. 10 (Winter 1985-86), pp. 11- 517
Transcript
ROBERT Z. LAWRENCE Brookings Institution
Imports in Japan: Closed Markets or Minds?
COMPARED WITH other industrial countries, Japan imports an unusually small share of its domestic use of manufactured goods. In 1980, for example, imports accounted forjust 5.8 percent of Japanese expenditures on manufactured products, compared with 9.3 percent of U.S. expen- ditures. That same year, non-EC imports accounted for 13.9 percent of spending by the European Community. I
Why Japan imports so little is a source of great controversy. Popular explanations stress the role of both official and unofficial import barriers. The Japanese government allegedly takes advantage of the openness of foreign markets while reserving local markets for domestic firms. It once implemented this mercantilist policy through formal protectionist mea- sures such as tariffs and quotas. Today it uses administrative guidance, discriminatory standards and regulations, selective government pro- curement, the official organization of domestic firms into cartels, and weak enforcement of antitrust laws. Japanese imports are also discour- aged by unofficial practices, such as the strong relationships ("invisible handshakes") between local suppliers and buyers, "just-in-time" inven- tory practices that give nearby suppliers an edge, and an unusually complex distribution system that creates substantial entry barriers for newcomers, whether Japanese or foreign.2
I am grateful to Morio Kuninori, Marcus Noland, and Gary Saxonhouse for comments; to Gregory Hume, Dale Thompson, and Amy Salsbury for research assistance; and to Evelyn Taylor for text processing.
1. Derek Blades and Wendy Simpson, "The OECD Compatible Trade and Production Data Base, " Working Paper 18 (Organization for Economic Cooperation and Development, January 1985).
2. See Dorothy Christelow, "Japan's Intangible Barriers to Trade in Manufactures," Federal Reserve Bank of New York Quarterly Review, vol. 10 (Winter 1985-86), pp. 11-
517
518 Brookings Papers on Economic Activity, 2:1987
Other observers dismiss allegations of import barriers as based on biased evidence and stress instead Japanese manufacturing prowess. The Japanese make high-quality products that both foreigners and Japanese prefer. While the Japanese invest in long-term strategies to win foreign markets, foreigners are unwilling to make similar efforts in Japan.
Many economists also dispute the anecdotal evidence on Japanese protectionism. They explain Japan' s trade structure by the fundamentals of its economic situation. Because its citizens have high saving rates and diminished domestic investment opportunities, Japan runs a current account surplus. Because it is poorly endowed in arable land, oil, and other natural resources, it achieves this surplus through a strong com- parative advantage in manufacturing.3 In this view, popular perceptions of Japanese trade practices reflect minds closed by prejudice. Japanese industrial policies, for example, have actually been relatively ineffective or have simply overcome some unique Japanese practices, thereby replicating the impact of market forces.4
In a seminal study, Gary Saxonhouse provided support for the explanation based on economic fundamentals.5 Saxonhouse explained the trade flows of twenty-two countries, including Japan, using a model specified in terms of the Heckscher-Ohlin paradigm and based on 109
18; and William V. Rapp, "Japan's Invisible Barriers to Trade," in Thomas A. Pugel and Robert G. Hawkins, eds., Fragile Interdependence: Economic Issues in U.S.-Japanese Trade and Investment (Lexington Books, 1986), pp. 21-45.
3. If Japanese goods were of poorer quality, a weaker yen rather than a different trade structure would result.
4. See Gary R. Saxonhouse, "What's All This about Industrial Targeting in Japan?" The World Economy, vol. 6 (September 1983), pp. 253-74; Philip Trezise, "Industrial Policy Is Not the Major Reason for Japan's Success," Brookings Review, vol. 1 (Spring 1983), pp. 13-18; and Charles L. Schultze, "Industrial Policy: A Dissent," Brookings Review, vol. 2 (Fall 1983), pp. 3-12. For a view stressing the role of industrial policy, see Chalmers Johnson, MITI and the Japanese Miracle: The Growth of Industrial Policy, 1925-1975 (Stanford University Press, 1982).
5. See Gary R. Saxonhouse, "The Micro- and Macro-economics of Foreign Sales to Japan," in William R. Cline, ed., Trade Policies in the 1980's (Washington, D.C.: Institute for International Economics, 1983), pp. 259-304; Saxonhouse, "What's Wrong with Japanese Trade Structure?" PacificEconomicPapers, no. 137 (July 1986); and Saxonhouse and Robert M. Stern, "An Analytical Survey of Formal and Informal Barriers to International Trade and Investment in the United States, Canada and Japan," paper prepared for conference on U.S.-Canadian Trade and Investment Relations with Japan (University of Michigan, April 2-3, 1987).
Robert Z. Lawrence 519
Table 1. Merchandise Trade and Current Account Balance, Japan and Germany, 1986
Total merchandise balance 4.3 5.8 Current account balance 4.4 3.9
Soujrces: Organization for Economic Cooperation and Development, Econtomic Suirvey: 198611987: Germany (Paris: OECD, July 1987), Statistical Annex, tables B and H; and Bank of Japan, Economic Statistics Monthly (Tokyo: Bank of Japan, July 1987), pp. 135, 178.
industries. He found that Japan's net exports differed significantly from those predicted by its factor endowments and its distance from trading partners in industries that accounted for only 6.1 percent of its external trade.6 Saxonhouse's influential work has been interpreted as indicating that Japan's trade structure is conventional and that, in fact, its trade policy does not matter.7
Although Saxonhouse begins his study citing the unusual nature of Japanese manufactured goods imports, he actually examines net exports. And although relative factor endowments may well explain Japan's net trade balance, Japan's trade structure may nonetheless be unusual because both exports and imports are too small. Many configurations of manufactured exports and imports can generate the current account surplus compatible with Japan's saving rate and resource endowments. Saxonhouse fails to address the crucial question of why Japan achieves its manufactured goods surplus with so few imports.
This issue emerges clearly in a comparison of Japan and West Germany, as reported in table 1. In some respects the German and Japanese economies have similar structures. Both nations run large
6. Edward Leamer also does not find Japan unusual in terms of the Heckscher-Ohlin model. See Edward E. Leamer, Sources ofInternational Comparative Advantage: Theory and Evidence (MIT Press, 1984).
7. See L. Alan Winters, "Patterns of World Trade: Does Trade Policy Matter?" Discussion Paper 160 (London: Centre for Economic Policy Research, March 1987).
Sweden 0.66 0.68 United Kingdom 0.82 0.78 United States 0.67 0.60 Korea ... 0.48 Switzerland ... 0.61
Source: Author's calculations using the following formula:
E [(Xu + Mij) - I Xij- Mij I]
Indexj i=
2 (Xi + Mij)
where i denotes manufacturing category, j denotes country, and x and m are exports and imports, respectively. This follows Herbert G. Grubel and P. J. Lloyd, Intra-Industry Trade: The Theory and Measurement of International Trade in Differentiated Products (New York: Halstead Press, 1975), p. 22. Data for the twenty-one industries are from the OECD Compatible Trade and Production Data Base. Data for the ninety-four industries are from United Nations, Commodity Trade Statistics, 1980, UN Statistical Papers, Series D (New York: United Nations, 1980).
manufactured goods surpluses to offset deficits in primary commodities and services. In 1986, their manufacturing trade and current account balances were similar percentages of GDP. But the German example demonstrates that low levels of manufactured imports are not necessarily "required" in resource-poor countries. Despite manufactured goods imports of 14.2 percent of GDP, Germany has been able to run surpluses in its manufactured goods trade that were larger shares of GDP than those of Japan.
The Heckscher-Ohlin theory assumes standardized products and predicts that countries will not import and export the same products, that is, that there will be no intra-industry trade. In terms of the theory, intra-industry trade is a statistical artifact resulting from insufficient disaggregation. Relying on this view, Saxonhouse has argued that his use of net exports as a dependent variable is permissible because his data are disaggregated. However, as reported in table 2, the Grubel-
Robert Z. Lawrence 521
Lloyd index of intra-industry trade calculated using data on ninety-four manufacturing industries indicates that Japan is noteworthy for its lack of intra-industry trade even at the disaggregation level used by Saxon- house. Table 3 further highlights the unusual nature of Japanese ratios of exports to imports. For eleven of the twenty-two categories (account- ing for 48.4 percent of OECD manufactured goods trade), the Japanese ratios are far higher than those of any other country. The average industry ratio of Japanese exports to imports in 1980 was 7.6, compared with that of the next highest country, Finland, which, because of its high ratio in wood products, had an average ratio of 2.6.
Other authors have examined imports directly. C. Fred Bergsten and William Cline regress the ratio of aggregate imports of goods and nonfactor income services to GNP against income, population, resource endowments, and distance from trading partners.8 They find that the Japanese import ratio does not differ significantly from that of other countries in the sample, and they conclude that Japan does not have excessive trade protection.9 Bela Balassa, however, using a different specification of transportation costs and specifying the European couli- tries separately, concludes that Japan is an "outlier" in both its manu- facturing and total imports.10 The Cline-Bergsten and Balassa studies have been criticized by Saxonhouse and Marcus Noland for not being based on a clear theoretical foundation. 1I Apparently, in addition, the methodology yields results that are sensitive to minor changes in variable specification.
Noland has tried to remedy these shortcomings by using a theoretical model presented by Elhanan Helpman and Paul Krugman that explains the volume of trade and allows for intra-industry trade. 12 He concludes
8. C. FredBergstenandWilliamR. Cline, The United States-JapanEconomicProblem (Washington, D.C.: Institute for International Economics, 1985).
9. A similar conclusion is reached by Luca Barbone, "Is Japan an Underimporter? Some Contrasting Results" (OECD, 1987).
10. Bela Balassa, "Japan's Trade Policies," Weltwirtschaftliches Archiv., vol. 122, no. 4, pp. 745-90.
11. As Noland notes, we have "two studies without formal models reaching opposite conclusions, and one study with a formal model of uncertain relevance. " Marcus Noland, "An Econometric Investigation of International Protection" (Washington, D.C.: Institute for International Economics, June 1987), p. 6.
12. Elhanan Helpman and Paul R. Krugman, Market Structure and Foreign Trade: Increasing Returns, Imperfect Competition, and the International Economy (MIT Press, 1985), chaps. 7-8.
z o o O ',
S: w w b t t o k.t o i
to .WX^ote
ZS, moos o
*W st N o ^ o U o mo
LE :3 b t s 0 t Q E 'IC C)
= ,,, e 0O v o St-t o>o "C
c6 ,Q o C; C
4; oil 0o gSt O .os
V-) V) e E Z
Robert Z. Lawrence 523
that Japanese aggregate exports, imports, and total trade are not out of the ordinary. Although Noland's work uses a more appropriate theoret- ical framework, he explains total merchandise trade volumes and pro- vides no test of trade in manufactured products alone. 13 Because manu- factured goods account for less than a third of Japanese imports, even substantial underimporting of manufactured goods is not likely to be detected in the aggregate specification.
In sum, the behavior of Japanese manufactured goods imports has not been adequately explained. Although the accounts stressing import barriers and those stressing factor endowments are not mutually exclu- sive, a sense of the relative importance of each is essential for policy- making. If trade barriers are unimportant and Japan's low imports of manufactured goods are the inevitable result of its macroeconomic behavior and factor endowments, policymakers who commit themselves to raising imports through removal of trade barriers could be frustrated and disappointed. On the other hand, if import barriers are important, Japan's adjustment to recent changes in macroeconomic policy and exchange rates could occur predominantly in Japanese exports, and the Japanese market could remain relatively closed. If significant barriers are found, their nature needs to be determined. Are the barriers official or private? Are they like quotas, so that imports are unresponsive to price changes, or are they like tariffs, so that despite their presence, import volumes will respond to currency changes?
In this report I explore some of these questions. Using a model based on the theory of trade under imperfect competition, I demonstrate that Japanese manufactured imports are about 40 percent lower than one would expect of a typical industrial economy. If Japanese manufactured imports reflected more typical trade, Japan's manufactured goods trade surplus would be only about 16 percent smaller, but Japan would have considerably more intra-industry trade.
The model leaves certain questions unanswered. It cannot distinguish between the impact of Japanese barriers on foreign imports and that of foreign barriers on Japanese exports, nor can it differentiate between the effects of import barriers and the peculiar preferences of Japanese
13. Data constraints (Noland does not measure factor endowments such as human and physical capital explicitly) and the need to assume balanced trade-clearly violated in practice-may compromise Noland's conclusions.
524 Brookings Papers on Economic Activity, 2:1987
buyers. Because there were few export restraints on Japanese trade in early observation years of the data sample, results from these years provide measures of the impact of import barriers and unusual prefer- ences.
In the second part of the paper I examine the price sensitivity of Japanese manufactured imports and find that, for many products, import price elasticities are as high as those in the United States. Japanese import barriers thus operate more like tariffs than like quotas and are probably due to unofficial practices based on unusual buyer preferences and monopolies in the distribution system rather than to officially implemented cartels or quantitative restraints. I conclude that these barriers will not, for the most part, prevent an import response to the stronger yen. Finally, I argue that Japan must take steps beyond the strong exchange rate to increase the openness of its markets.
Is Japanese Import Behavior Unusual?
I will use a special case of a model developed by Helpman and Krugman to explain trade in differentiated products. The theory explains the volume of imports independent of comparative advantage. It predicts a relationship between the share of imports in domestic consumption and the share of home production in world production.
In the simplest version of the model, two countries of equal size, with identical factor endowments and access to the same technology, produce the same good: a differentiated product, produced in numerous vari- eties.'4 Each variety is produced with the same production function, which exhibits economies of scale. These scale economies are fairly small, however, so the industry accommodates many producers, each producing a different variety. In the long run, firms enter the market until each earns zero profits.'5 Consumers in both countries have similar
14. For a rigorous elaboration of this model, see Helpman and Krugman, Market Structure and Foreign Trade, chap. 7.
15. Ibid., p. 132. As Helpman and Krugman point out, "The industry [has] a market structure known as monopolistic competition; that is, every firm chooses a variety and pricing strategy so as to maximize profits, taking as given the variety choice and pricing strategy of the other producers in the industry. In this case every firm ends up producing a different variety of the product."
Robert Z. Lawrence 525
tastes but a preference for variety. 16 There are no trade barriers and no transportation or other transactions costs. Trade is balanced. In equilib- rium, there will be n firms of equal size in each country. With identical demand curves for each variety and cost functions for each firm, output and prices of each firm will be the same. Consumption patterns in each country will be identical, with domestic and foreign firms accounting for equal shares in the purchases of each consumer.
If country A doubles in size, A will produce 2n varieties; B, n vari- eties. Consumers in both countries will allocate two-thirds of their consumption to A goods and one-third to B goods. One-third of the production of A and two-thirds of the production of B will be exported. Similarly, imports will be one-third of consumption in A and two-thirds of consumption in B.
Thus, in this frictionless model, a country's share in both national markets will be proportional to its share in world production. As Helpman observes, relative country size is the determinant of trade when all products are differentiated.'7 The larger the country's share in world production, the larger its share in its home market and thus the smaller exports or imports as a share of GNP.
What happens in this model if trade is not balanced? Assume, for example, that the economies are of equal size, each producing n varieties in similar amounts, but that country A consumes only half its income (O.5n if production of each firm is defined as one unit of income) and lends the other half to country B, which consumes 1 .5n. If indifference curves are homothetic (all varieties have unitary income elasticities), consumers in both countries will consume A and B goods in equal proportions. A trade surplus implies a greater share in world production than in world consumption, but the consumption proportions at home and abroad of home goods remain equal to shares in production. That
16. See Avinash K. Dixit and Joseph E. Stiglitz, "Monopolistic Competition and Optimum Product Diversity," American Economic Review, vol. 67 (June 1977), pp. 297- 308. One form of the utility function, following Dixit and Stiglitz, would be a concave and symmetrical CES function. The number of varieties available potentially can be infinite. However, given fixed production costs, a finite number is supplied in equilibrium. If varieties are equally priced, each individual will consume all varieties in equal proportions. See Helpman and Krugman, Market Structure and Foreign Trade, pp. 117-20.
17. Elhanan Helpman, "Imperfect Competition and International Trade: Evidence from Fourteen Industrial Countries," Seminar Paper 304 (Stockholm University, Institute for International Economic Studies, December 1984), p. 8.
526 Brookings Papers on Economic Activity, 2:1987
finding is important because it predicts that the share of imports in consumption does not depend on the trade balance.
Some of the strong assumptions in this model can be relaxed without changing this finding. Increasing the number of countries does riot alter the conclusions. Countries may produce both differentiated and undif- ferentiated products and may differ in factor endowments.18 Production costs could also differ between countries. Assume, in the two-country model described above, that A products rise in price by 1 percent. If demand elasticities are the same worldwide, the share of A in demand should fall by the same percentage in both markets. Similarly, if the relative quality of products from A improves, both foreign and domestic buyers should raise their purchases by similar percentages. Each country could specialize fully in the production ofjust one variety. Again, shares in consumption in each country and in world production will correspond.
Three assumptions are, however, crucial for this result: similarity in tastes, absence of trade barriers, and zero transactions costs.19 If countries have a preference for goods made at home, shares of home goods in domestic consumption will exceed those of home goods in world production. Import barriers such as tariffs or quotas will raise the share of home goods in home consumption relative to their share in world production. Similarly, barriers against a country's exports will lead it to consume relatively large shares of its home production. If there are international transactions costs, home goods will be relatively cheaper in the domestic market and their share in domestic consumption could deviate from that in world production.20
This analysis suggests that market shares can be explained by pro- duction shares, transportation and transactions costs, trade barriers, and taste differences:
(la) (Mij/D Uij) = f (Pil/Pi, Tij, Bij),
18. A complete treatment of this case is provided in Helpman and Krugman, Market Structure and Foreign Trade.
19. The assumption that utility functions are similar and homothetic, so that consump- tion patterns are independent of income, is sufficient for this analysis. If the functions are not homothetic, differences in incomes could affect demand patterns despite similarities in tastes.
20. For an exploration of the impact of transportation costs, see Helpman and Krugman, Market Structure and Foreign Trade, pp. 205-09. See also Paul R. Krugman, "Scale Economies, Product Differentiation and the Pattern ofTrade, " American Economic Review, vol. 70 (December 1980), pp. 950-59.
Robert Z. Lawrence 527
where M is imports, D U is domestic use (consumption plus investment), P is production, Tis transactions costs, and B is trade barriers and taste differences. The suffix i denotes products and j denotes countries. In this context trade barriers include barriers on both exports and imports. If we were to estimate equation la,
(lb) (MijD Uij) = A + B(P1j/Pi) + C(Tij),
in the frictionless economy, the coefficient C would be zero, A would be 1.0, andB would be - 1.0. In this case, if (Pij/Pi) is zero, the country does not produce the product, and (Mij/DUij) would be 1-all doinestic use would be imported. If (Pij/Pi) is unity, the country accounts for all global production, and (Mij/D Uij) would be zero-none of domestic use would be imported. In the real world, however, in the presence of frictions, transportation costs, and nonlinear relationships, coefficients will not equal unity. Nonetheless, the coefficients on both the distance and production shares variables are expected to be negative.
A SECOND SPECIFICATION
In the frictionless model outlined above, the shares of a country's products in its domestic market will equal its shares in the foreign market. Thus export shares in foreign consumption should equal the share of home goods in domestic consumption, and foreign market shares should offer an alternative method forjudging import shares. Indeed, this theory has some popular appeal. When the semiconductor industry in the United States argues that Japan follows discriminatory practices, its spokesmen point to the high shares of U.S. semiconductor products in the United States and other foreign markets in support of their case. Similarly, those defending Japan from allegations that it is discriminating against foreign goods point to Japanese success in foreign markets in electronics and motor vehicles as evidence that Japan simply makes better products. Again, differences in tastes, trade barriers, and trans- actions costs could influence the results.
This analysis suggests a second equation:
(2) (Mij/D Uij) = f(XijlFUi, Tij, Bij),
where X denotes exports, and FU denotes the use of i in countries other thanj.
528 Brookings Papers on Economic Activity, 2:1987
IMPLEMENTATION
With a satisfactory proxy for international transactions costs, esti- mating equations la or 2 without explicit measures for Bij will capture the relationship typical of countries in the sample between imports and production shares (and export performance) inclusive of the impact of normal trade barriers and taste differences. A country dummy variable will not indicate the total impact of trade barriers and taste differences. It indicates the impact of only those trade barriers and taste differences that are unusual. A negative dummy variable indicates the aggregate impact of three kinds of unusual behavior: unusual preferences for domestic goods, abnormally high import barriers, and unusual foreign discrimination against the dummied country's exports.
For estimating equations la and 2, I exploit a data set that details national manufacturing production and trade between 1970 and 1983 for thirteen countries matched at a fairly disaggregated level, with the manufacturing sector divided into twenty-two industries.21 Domestic use (consumption plus investment) for each country in the sample is estimated using the formula
(3) ~~~~DUlj = Plj - Xlj + MIJ.
I assume that transportation and other transactions costs (Tij) are related to the distance of each country from its trading partners. The distances from national economic centers are weighted by shares in manufacturing production and domestic use. The variable is specified in logarithmic form to capture the notion that costs do not increase linearly with distance. A squared term is tried to allow for further nonlinearities.22
21. The data must be treated with some caution. They are converted using current exchange rates rather than purchasing-power measures. For a detailed description, see Blades and Simpson, "The OECD Compatible Trade and Production Data Base."
22. The distance variable Dj is weighted as
E (2Pk + 2DUk) E -(Pk+ -DUk)
DISTjk
where Pk is the production of country k, DUk is the domestic use of country k, and DISTjk is the distance between countriesj and k. This weighting method follows Gary Saxonhouse,
Robert Z. Lawrence 529
RESULTS
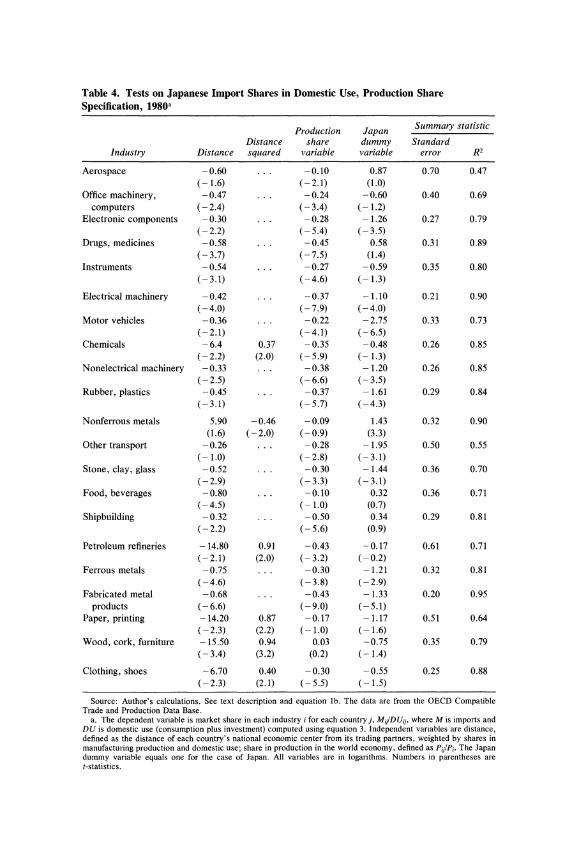
After determining the most appropriate functional form (a logarithmic specification gave the best results), I entered a dummy variable equal to unity in the case of Japan. The results of the twenty-one regressions run on 1980 data for each industry are reported in table 4.23 The amount of variance explained excluding the Japanese observation is high (the average R2 is 0.77). Almost all the coefficients are correctly signed and most are significantly different from zero. The coefficient on production suggests considerably more bias toward production for the home market than the frictionless model would suggest. In contrast to the proportional relationship in the frictionless model, on average in the twenty-one industries used in the estimation, countries supplied 60 percent of their home market while accounting for 8 percent of the sample production. Evaluated at their means, the typical coefficient of - 0.35 implies that a 1 percentage point rise in production share (for example, from 8 percent to 9 percent) lowers the import share by 1.8 percentage points (from 40 percent to 38.2 percent).
Equation standard errors average 36 percent. In sixteen of twenty- one equations the dummy variable on the Japanese observation is negative; in nine of these the t-ratio is greater than 2; in five others it lies between 1 and 2. The industries with significant and negative coefficients account for 49.9 percent of Japanese manufacturing production (and 56.6 percent of Japanese manufactured goods trade). Japan's imports are significantly higher than predicted in only one case, nonferrous metals. No unusual barriers appear (coefficients positive or close to zero) in the equations for aerospace, drugs, chemicals, food, shipbuild- ing, and petroleum refineries.
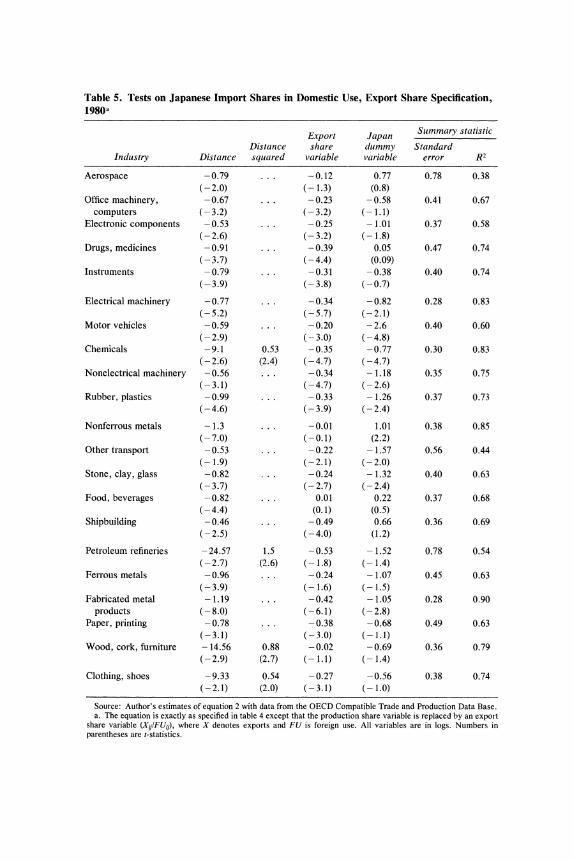
The export shares specification, reported in table 5, also yields
"What's Wrong with Japanese Trade Structure?"; Pentti Poyhonen, "A Tentative Model for the Volume of Trade between Countries," Weltwirtschaftlichles Archiv., vol. 90, nIo. 1 (1960), pp. 93-99; and Edward E. Leamer, "The Commodity Composition of International Trade in Manufactures: An Empirical Analysis," Oxford Economic Papers, vol. 26 (November 1974), pp. 350-74.
23. Data peculiarities (a share of imports in domestic use greater than unity in a large number of cases) led to dropping the industrial category for miscellaneous manufacturing from these tests.
Table 4. Tests on Japanese Import Shares in Domestic Use, Production Share Specification, 1980a
Production Japan Summary statistic
Distance share dummy Standard Industry Distance squared variable variable error R2
Source: Author's calculations. See text description and equation lb. The data are from the OECD Compatible Trade and Production Data Base.
a. The dependent variable is market share in each industry i for each country j, MVjIDUijQ where M is imports and DU is domestic use (consumption plus investment) computed using equation 3. Independent variables are distance, defined as the distance of each country's national economic center from its trading partners, weighted by shares in manufacturing production and domestic use; share in production in the world economy, defined as PjjIPi. The Japan dummy variable equals one for the case of Japan. All variables are in logarithms. Numbers in parentheses are t-statistics.
Table 5. Tests on Japanese Import Shares in Domestic Use, Export Share Specification, 1980a
Expor-t Japan Summaty statistic
Distance share dummy Standard Industry Distance squared variable var-iable error R2
Source: Author's estimates of equation 2 with data from the OECD Compatible Trade and Production Data Base. a. The equation is exactly as specified in table 4 except that the production share variable is replaced by an export
share variable (XU/FUij), where X denotes exports and FU is foreign use. All variables are in logs. Numbers in parentheses are t-statistics.
532 Brookings Papers on Economic Activity, 2:1987
Table 6. Pooled Regressions Explaining Import Share in Domestic Use, 1970, 1980, and 1983a
Japan ProductionSlummary statistic
dumnmy Production Export Standard Year and equation Distance variable share share error R2
Source: Author's calculations. See tables 4 and 5. a. Data for the twenty-one industries from the sample of thirteen countries were concatenated to create variables
with 273 observations each. The results reported here, therefore, are summary measures for the results of the twenty- one regressions reported in tables 4 and 5. All variables are in logs. Numbers in parentheses are t-statistics.
generally significant coefficients, although it explains less variance (average R2 of 0.68) and has higher standard errors (average 43 percent). Negative coefficients on the Japanese dummy occur in sixteen of twenty- one industries, with coefficients that are statistically significant in seven industries (electrical and nonelectrical machinery; motor vehicles; other transportation; stone, clay, and glass; rubber and plastics; and fabricated metals). This test suggests statistically unusual import behavior in products accounting for 20 percent of production.
The industry data have been pooled into single regressions, each with 273 observations, constraining the coefficients to be similar for all industries. These equations, reported in table 6 for different periods, have highly significant coefficients. The production shares specification explains about 60 percent of the sample variance, the export shares about 45 percent. The coefficients are relatively stable over time. In every case, the coefficient of the Japanese dummy is negative and significant. The typical value on the dummy variable (-0.60) in the production share specification indicates that Japanese import shares are unusually low by about 45 percent.
Data on the members of the European Community in the sample have
Robert Z. Lawrence 533
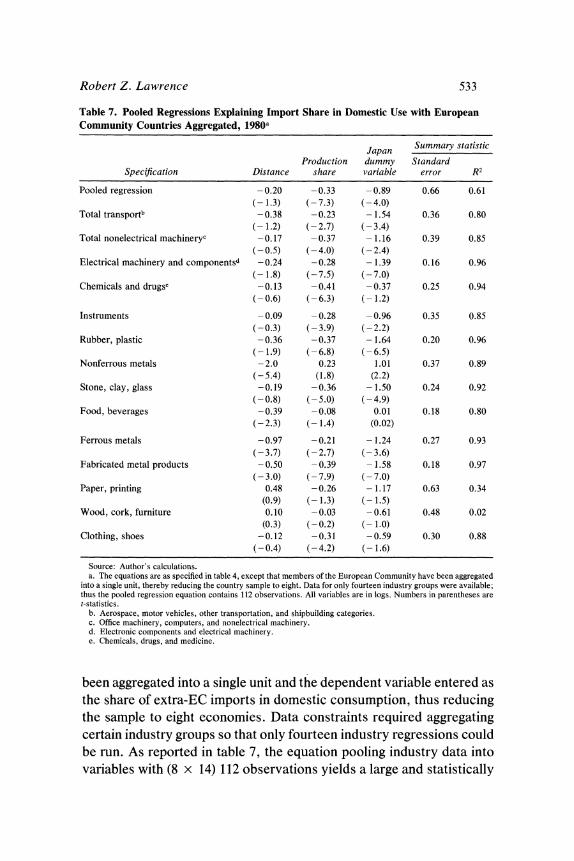
Table 7. Pooled Regressions Explaining Import Share in Domestic Use with European Community Countries Aggregated, 1980a
Japan Summary statistic
Production dummy Standard Specification Distance share variable error R2
Pooled regression -0.20 -0.33 -0.89 0.66 0.61 (-1.3) (-7.3) (-4.0)
Total transportb -0.38 -0.23 -1.54 0.36 0.80 (-1.2) (-2.7) (-3.4)
Source: Author's calculations. a. The equations are as specified in table 4, except that members of the European Community have been aggregated
into a single unit, thereby reducing the country sample to eight. Data for only fourteen industry groups were available; thus the pooled regression equation contains 112 observations. All variables are in logs. Numbers in parentheses are t-statistics.
b. Aerospace, motor vehicles, other transportation, and shipbuilding categories. c. Office machinery, computers, and nonelectrical machinery. d. Electronic components and electrical machinery. e. Chemicals, drugs, and medicine.
been aggregated into a single unit and the dependent variable entered as the share of extra-EC imports in domestic consumption, thus reducing the sample to eight economies. Data constraints required aggregating certain industry groups so that only fourteen industry regressions could be run. As reported in table 7, the equation pooling industry data into variables with (8 x 14) 112 observations yields a large and statistically
534 Brookings Papers on Econonzic Activity, 2:1987
Table 8. Pooled Regressions Explaining Share of Aggregate Manufactured Imports in Domestic Use of Manufactured Goods, 1970, 1980, and 1983a
Japan Production Summary statistic
dummy Production Export Standard Year and equation Distance variable share share error R2
Source: Author's calculations with aggregate industry data. a. Variables are as defined in tables 4 and 5. All variables are in logs. Numbers in parentheses are t-statistics.
significant estimate of Japanese underimporting. Regressions for single industries give results similar to those in table 4.
A second set of summary equations examines aggregate manufactured imports, production, domestic use, and exports. As reported in table 8, these equations yield less precise coefficients but ones similar to those of the pooled disaggregated version. Japanese imports in the 1980 production shares specification were 40 percent lower than predicted.
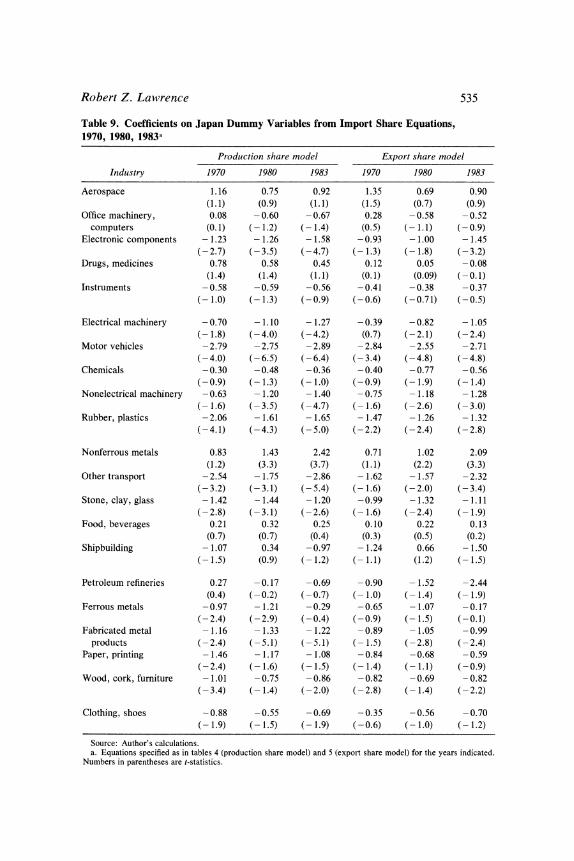
Table 9 reports the results of estimating the equations in tables 4 and 5 for different periods. The estimates of the Japanese dummies in these periods are similar.
Table 10 reports the dummy variables on each other country in the sample when these variables are used in the pooled regressions. In the 1980 production share specification, only Finland and Japan underim- ported significantly.24 In the export share specification, the only two
24. The presence of significant country dummies could indicate heteroskedasticity. As Barbone notes, "This exercise is questionable on econometric grounds. The value of the dummy for each country is in fact to be understood as conditional on the hypothesis that other country dummies are not significantly different from zero, a hypothesis rejected by any other significant value." Barbone, "Is Japan an Underimporter?"
Robert Z. Lawrence 535
Table 9. Coefficients on Japan Dummy Variables from Import Share Equations, 1970, 1980, 1983a
United States 0.24 0.58 0.84 -0.33 -0.31 -0.21 (1.3) (3.4) (4.6) (-1.5) (-1.5) (-1.0)
Source: Author's calculations. a. Regressions pooled as in table 6, with a dummy variable equal to one in the case of EC member countries.
significant underimporters were the United Kingdom and Japan, with the coefficient on the Japanese dummy twice that on the United Kingdom. Only Japan is an underimporter in both specifications.25
INTERPRETATION
These results reject the view that Japanese manufactured imports are not unusually low. They also indicate that the superior quality of Japanese
25. A peculiar overimporteris Australia, which is well known to have highly protective barriers on manufactured goods. The Australian dummy is the result of having Japan, a country of similar distance and much lower import shares, in the sample. When both Japanese and Australian dummies are introduced, however, the Australian observation is no longer significant.
Robert Z. Lawrence 537
products cannot explain Japanese imports. Japanese export volumes are too small to justify Japan's high share of its home market. But the results leave some issues unresolved because they do not indicate the relative importance of export barriers, import barriers, and unusual buyer preferences.
Because, with the exception of Japanese textiles, Japanese exports were not subject to unusual barriers in 1970, it seems reasonable to interpret the 1970 dummy coefficients as reflecting unusual import behavior. The relative stability in the aggregate coefficients in the production share specification between 1970 and 1980 suggests that this behavior persisted. In some industries, though, an upward drift in the coefficients could reflect the imposition of export restraints. To interpret the coefficient on the dummy variables as a reflection of differences in preferences, we must assume that Japan has different tastes and displays an abnormal bias for home products. Since most countries in the sample have similar per capita GDP income levels, with none deviating more than 20 percent from the group mean, nonhomotheticity is an unlikely cause.26
SIMULATED IMPACT OF BARRIERS
How different would Japan's trade structure be if its import behavior were normal given its distance from other producers? The dummy variable coefficients can be used to provide a rough answer.
In 1980, Japanese manufactured goods imports and exports were valued at $31.5 billion and $126 billion, respectively. The coefficient in table 8 indicates that manufactured imports would have been higher in 1980 by 59 percent, or $18.6 billion, in the absence of unusual barriers. Initially, therefore, removing these barriers would reduce the manufac- tured goods trade surplus from $94.5 billion to $75.9 billion.
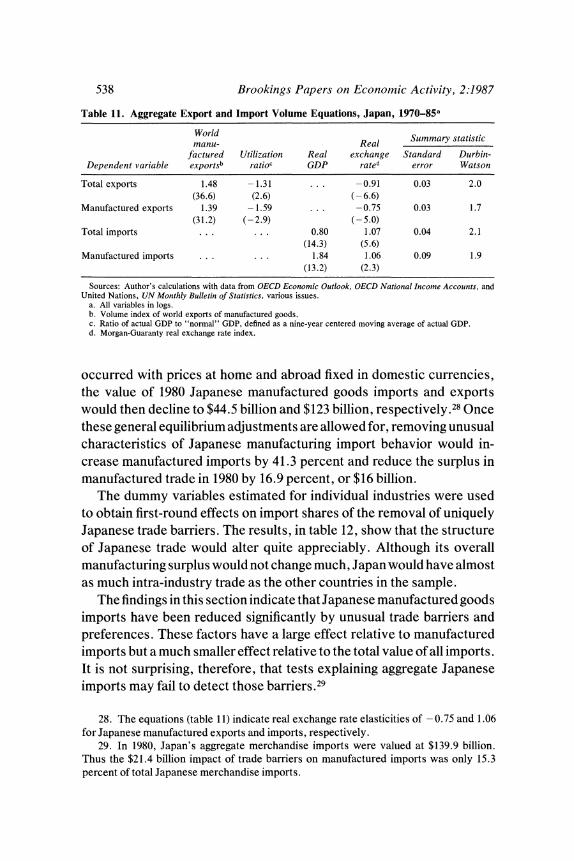
In response to a rise in imports, however, the yen would weaken. As implied by the equation system reported in table 11, to restore the current account to its former level (in yen) with GDP unchanged would require a real yen depreciation of about 10.5 percent.27 If this depreciation
26. Correlating the shares of twenty-two industries in Japanese production and domestic use with shares in the rest of the sample suggests nothing unusual about either Japanese production (correlation 0.91) or use (correlation 0.96).
27. Equations indicate elasticities with respect to the real exchange rate of - 0.91 and 1.07 for exports and imports of goods and services, respectively. See table 11.
538 Brookings Papers on Economic Activity, 2:1987
Table 11. Aggregate Export and Import Volume Equations, Japan, 1970-85a
World Summary statistic manu- Real S
factured Utilization Real exchange Standard Durbin- Dependent variable exportsb ratioc GDP rated error Watson
Sources: Author's calculations with data from OECD Economic Outlook, OECD National Income Accounts, and United Nations, UN Monthly Bulletitn of Statistics, various issues.
a. All variables in logs. b. Volume index of world exports of manufactured goods. c. Ratio of actual GDP to "normal" GDP, defined as a nine-year centered moving average of actual GDP. d. Morgan-Guaranty real exchange rate index.
occurred with prices at home and abroad fixed in domestic currencies, the value of 1980 Japanese manufactured goods imports and exports would then decline to $44.5 billion and $123 billion, respectively.28 Once these general equilibrium adjustments are allowed for, removing unusual characteristics of Japanese manufacturing import behavior would in- crease manufactured imports by 41.3 percent and reduce the surplus in manufactured trade in 1980 by 16.9 percent, or $16 billion.
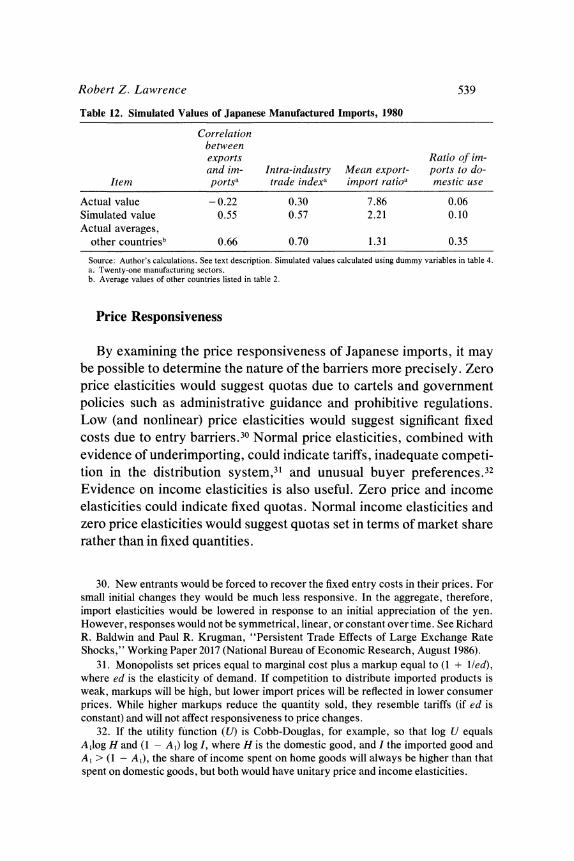
The dummy variables estimated for individual industries were used to obtain first-round effects on import shares of the removal of uniquely Japanese trade barriers. The results, in table 12, show that the structure of Japanese trade would alter quite appreciably. Although its overall manufacturing surplus would not change much, Japan would have almost as much intra-industry trade as the other countries in the sample.
The findings in this section indicate that Japanese manufactured goods imports have been reduced significantly by unusual trade barriers and preferences. These factors have a large effect relative to manufactured imports but a much smaller effect relative to the total value of all imports. It is not surprising, therefore, that tests explaining aggregate Japanese imports may fail to detect those barriers.29
28. The equations (table 11) indicate real exchange rate elasticities of -0.75 and 1.06 for Japanese manufactured exports and imports, respectively.
29. In 1980, Japan's aggregate merchandise imports were valued at $139.9 billion. Thus the $21.4 billion impact of trade barriers on manufactured imports was only 15.3 percent of total Japanese merchandise imports.
Robert Z. Lawrence 539
Table 12. Simulated Values of Japanese Manufactured Imports, 1980
Correlation between exports Ratio of im- and im- Intra-industry Mean export- ports to do-
Item portsa trade indexa import 1.atioa mestic use
Actual value -0.22 0.30 7.86 0.06 Simulated value 0.55 0.57 2.21 0.10 Actual averages,
other countriesb 0.66 0.70 1.31 0.35
Source: Author's calculations. See text description. Simulated values calculated using dummy variables in table 4. a. Twenty-one manufacturing sectors. b. Average values of other countries listed in table 2.
Price Responsiveness
By examining the price responsiveness of Japanese imports, it may be possible to determine the nature of the barriers more precisely. Zero price elasticities would suggest quotas due to cartels and government policies such as administrative guidance and prohibitive regulations. Low (and nonlinear) price elasticities would suggest significant fixed costs due to entry barriers.30 Normal price elasticities, combined with evidence of underimporting, could indicate tariffs, inadequate competi- tion in the distribution system,31 and unusual buyer preferences.32 Evidence on income elasticities is also useful. Zero price and income elasticities could indicate fixed quotas. Normal income elasticities and zero price elasticities would suggest quotas set in terms of market share rather than in fixed quantities.
30. New entrants would be forced to recover the fixed entry costs in their prices. For small initial changes they would be much less responsive. In the aggregate, therefore, import elasticities would be lowered in response to an initial appreciation of the yen. However, responses would not be symmetrical, linear, or constant over time. See Richard R. Baldwin and Paul R. Krugman, "Persistent Trade Effects of Large Exchange Rate Shocks," Working Paper 2017 (National Bureau of Economic Research, August 1986).
31. Monopolists set prices equal to marginal cost plus a markup equal to (1 + l/ed), where ed is the elasticity of demand. If competition to distribute imported products is weak, markups will be high, but lower import prices will be reflected in lower consumer prices. While higher markups reduce the quantity sold, they resemble tariffs (if ed is constant) and will not affect responsiveness to price changes.
32. If the utility function (U) is Cobb-Douglas, for example, so that log U equals Aljog H and (1 - AI) log I, where H is the domestic good, and I the imported good and Al > (1 - Al), the share of income spent on home goods will always be higher than that spent on domestic goods, but both would have unitary price and income elasticities.
O _ . t . . . N . >0 . D g~~~~~~~0
00 00 C O1 O C O
Ce n w0 X X O. o X N o. w. o o = Q Q~~~~~~0 C1 U ; h D ? Y~~~~~~~~~~~~~~~~~~~~~~~~~~~~~~~~~~~~~~~~~~~~~~~~~~1
Zs 4 O*
r. O O O O O C
O0 00- tn m 00 o 00x -s*
t U L' m ~~00 o t:)t: 0 00 t- O) tl ) C1 -\ "It 0 n 1- - 00 CD 0\ OC X~~~~~~ c ?mo to_omXNbmotmN_...
;~~~~~- 6 06 W= e
=
; : : : : : : : o m o o o m U o Q~
= < X 3~~~~~~~~~~~~~~~~~~~ X .? , > ce b o c. b. ? m. $ o oo b S t o~~~~~~~~~~~~~~~~~~~~~~~~~~~~~~~~~~~~~~~~~~~~~1
.s cq~~~ Se.t N ? O ? o N ? - m m 4 ~~~~E Xc | | sE lo s s oe o o ' | <> X2$6~~~~~~~
ex~~~~~~~~~~~~~~~~~~~~~~~~~~~~~~~~~~0 r. U 4= t ~ ~ ~ ; b O_ m O_ O O_ oo O_ t O_ o O_ O O_ m O_ N O_ O O_ C: _ Q~~~~~~~~~~~~~~~~~~~~~~~~~~~~~~~C1
.0 ~~ ~ ~~S 0
_ :zSXt N m m o _ 3..
;>o cq t- ~ ~ ~ ~ ~ ~ ~ ~ ~~ :s r~~~~ E
a I IDA c u I = -Q~~~~~~~~~~~~~~~~~~~~~~~~~~~~~~~~~~~~~~~~~~~~~~~~~~~~~~~~~~~~~~1 = ~~~~~~t' t' c) C) ? C) S e - C i
Robert Z. Lawrence 541
To explore this issue, I have used the matched industrial data compiled by the Commission of the European Community. These data provide consistent import volumes in major industries for Japan and the United States. In addition, I matched import prices (unit values in the case of the United States) to domestic wholesale prices for data on ten industry groups comprising about 80 percent of manufactured imports.
I have estimated import demand functions that explain import quan- tities between 1971 and 1985 by real GNP, relative import prices, and a time trend. Variables are expressed in logarithms so that coefficients indicate elasticities. Specifications using current and lagged income and price terms with and without the trend term were tested. The best fitting estimates are reported in table 13.
Japanese finished manufactured imports appear fairly responsive to price. Indeed, in five of the ten industrial sectors estimated here, they are more responsive than the corresponding imports of the United States.33 The price elasticity estimates and the estimates of the barriers obtained in the previous section do not correspond. Chemicals, in which imports conformed to normal patterns, have the highest price responses (elasticity of - 2.2). Elasticities are between - 1.4 and - 1.5 for under- imported products such as electrical goods, nonmetallic minerals, and metal products. On the other hand, price elasticities are low and not significantly different from zero in three of the largest sectors of Japanese imports, basic metals (28.3 percent of manufactured imports); textiles, footwear, and clothing (7.3 percent of manufactured imports); and food products (13.1 percent).
Theory suggests that low price elasticities might indicate administered protection. In fact, there is substantial evidence of such protection in both textiles and food products. Japan maintains quotas on leather goods. Recession cartels, accompanied by administrative limits on imports (and voluntary export restraints on Korean goods) have been
33. Earlier studies of disaggregated Japanese manufactured imports do not find unusually low import price elasticities. See, for example, Joe A. Stone, "Price Elasticities of Demand for Imports and Exports: Industry Estimates for the U.S., the E.E.C. and Japan," Review of Economics and Statistics, vol. 61 (May 1979), pp. 306-12; William R. Cline and others, Trade Negotiations in the Tokyo Round: A Quantitative Assessment (Brookings, 1978). For a comparison of these results, see Peter A. Petri, Modelling Japanese-American Trade: A Study ofAsymmetric Interdependence (Harvard University Press, 1984), p. 54.
542 Brookings Papers on Economic Activity, 2:1987
implemented in the textiles industry.34 According to Balassa, food products are a principal case of administrative guidance in Japan.35
Japanese manufactured imports are price inelastic in basic metals, motor vehicles, textiles, and food-products amounting to about half the total. They are elastic in sectors that have relatively small import shares. Thus although Japanese products generally have higher price elasticities than U.S. products, when weighted by their shares, Japanese imports have an elasticity of - 0.70 while those of the United States are -1.1.
When the time trends are taken into account, Japanese income elasticities are generally between a quarter and a third those of the United States. This difference is somewhat larger than might be expected from those countries' growth rates. Between 1970 and 1985, Japanese industrial production increased at a 4.5 percent rate, as against 2.7 percent for the United States and 2.6 percent for all industrial countries.
Table 14 reports similar regressions for aggregate manufacturing imports in Japan, the United States, Italy, France, Germany, and the United Kingdom. The equation for Japan gives results similar to the disaggregated version. Indeed, the unitary import price elasticity is fairly close to the weighted average of price elasticities from the disaggregated equations.36 This Japanese import price elasticity lies in the middle of the estimates in table 13.
In sum, therefore, the barriers that inhibit Japanese imports do not, in most cases, prevent fairly normal price responses. These barriers are thus probably limitations in the distribution system and differences in buyer preferences, a conclusion supported by Christelow's finding that the distribution system marks up imports differentially.37
34. For a detailed description of the 1981 recession cartel in textiles and the role of MITI, see Ronald Dore, "Structural Adjustment in Japan 1970-82" (Geneva: International Labor Office).
35. Balassa, "Japan's Trade Policies." 36. Recent estimates of Japanese manufactured goods import price elasticities include
Hooper/Helkie (-0.90), the EPA Model (- 1.2), and Spencer (-0.82). See William L. Helkie and Peter Hooper, "The U.S. External Deficit in the 1980s," in Ralph C. Bryant and others, eds., Empirical Macroeconomics for Interdependent Economies (Brookings, 1988); Naohiro Yashiro, "Exchange Rate Adjustment and Macroeconomic Policy Coor- dination," Discussion Paper 41 (Tokyo: Economic Planning Agency, February 1987); and Grant H. Spencer, "The World Trade Model: Revised Estimates," IMF Staff Papers, vol. 31 (September 1984), pp. 469-98.
37. "A (1985) government survey of distribution markups for domestic and imported products found that for whiskeys, candies, edible oils, men's overcoats, and footwear,
Robert Z. Lawrence 543
Table 14. Equations Explaining Aggregate Real Manufactured Imports, Various Countries, 1971-86a
Relative Summary statistic Real price of Time Standard Durbin-
Country GDP imnports trend error Watson
Franceb 2.69 - 1.11 . . . 0.03 1.8 (22.5) (2.7)
Germanyc 2.77 - 0.54 . .. 0.02 1.5 (40.7) (3.2)
Italy 2.72 -2.13d . . . 0.06 1.5 (16.2) (3.1)
Japanc 1.35 -1.01 ... 0.09 1.9 (5.2) (-2.6)
United Kingdome 2.47 -0.61 0.02 0.02 1.6 (8.0) (3.4) (2.7)
United States 3.36 - 1.95d . . . 0.06 2.0
(19.1) (5.3)
Source: Author's calculations with data from the OECD data base and International Monetary Fund, International Financial Statistics data tape.
a. Annual data. Dependent variable is real manufactured imports in each country. The relative price of imports is the ratio of manufactured import prices to domestic wholesale prices for manufactured goods. All variables are in logs, except for the time trend. Numbers in parentheses are t-statistics.
b. 1973-85. c. Corrected for serial correlation. d. Current and one-pefiod lag. e. 1972-86. f. Current and two-period lags.
Between early 1985 and April 1987, as measured by the multilateral exchange rate model of the International Monetary Fund (MERM), the yen appreciated 44 percent. Over the same period, Japanese relative unit labor costs increased about 22 percent. With the exception of food and textiles, the strong yen should increase the importance of the Japanese market as a revenue source for foreign exporters. Not only will Japan's trade surplus be reduced, but the amount of intra-industry trade should rise. Indeed, in the first five months of 1987, the volume of Japanese manufactured goods imports was 21.5 percent higher than in 1985. Because import unit values were 24.9 percent lower, however, the overall yen value had barely changed. In dollars, manufactured imports increased from $36.4 billion in 1985 to an annual rate of $50.94 billion.38
markups on imports were double those on domestic products." Christelow, "Japan's Intangible Barriers," p. 14.
38. For a detailed analysis of recent Japanese trade, see Bonnie E. Loopesko and Robert A. Johnson, "Realignment of the Yen-Dollar Exchange Rate: Aspects of the Adjustment Process in Japan," International Finance Discussion Paper 311 (Board of Governors of the Federal Reserve System, August 1987).
544 Brookings Papers on Economic Activity, 2:1987
Political Implications of Japan's Trade Structure
Whatever the causes of Japan's unusual trade structure, its effects have been dramatic. Few international meetings go by without heated accusations against Japan and defensive responses. Highly dependent on its trading relationships, Japan has been forced time and again to bend to external political pressures. It has restrained exports of textiles, steel, automobiles, and electronic products and ostentatiously pro- claimed a series of major initiatives to open its markets.
Yet Japan continues to be the target of frequent allegations of unfair trade practices. Current trade legislation drafted by the U.S. Congress is aimed primarily at Japan. Both the House and Senate trade bills passed in 1987 would amend Section 301 of the Trade Act to require the U.S. Trade Representative to identify countries that "maintain a consistent pattern of market distorting trade practices," specifically identifying Japan as such a country.39
Yet from some standpoints, the attention focused on Japan appears peculiar. For its size, Japan is not an extraordinary exporting nation. In 1980, Japanese manufactured exports were 13.2 percent of the exports of the thirteen-country sample used above. By contrast, Japan accounted for 18.7 percent of manufactured goods use within the sample and 19.9 percent of production. Why is the world able to absorb West German manufactured exports with little or no friction when they are larger than those of Japan ($217 billion as against $204 billion in 1986)? Why, in the early 1980s, was the United States able to export more manufactured goods than Japan with little friction? And why have the tensions between the United States and Japan been so heated in recent years, when the decline in the U.S. manufactured goods trade balance with Europe and Canada ($46.5 billion between 1981 and 1986) has been larger than the decline with Japan ($38.4 billion)?40
39. For an analysis, see Robert E. Litan, "Is the United States Turning Protectionist?" Japan Automobile Manufacturers Association Forum, vol. 6 (October 1987), pp. 3-8.
40. Indeed, the decline in the U.S. bilateral balance with Japan has been proportional to its 1981 shares in manufactured goods trade. See Robert Z. Lawrence and Robert E. Litan, "The Protectionist Prescription: Errors in Diagnosis and Cure," BPEA, 1:1987, pp. 289-310.
Robert Z. Lawrence 545
The political implications of its trade structure explain why Japan has been singled out. To be sure, Germany had the advantage of establishing its market share during the period of rapid international postwar growth, while since 1973 Japanese export shares have been growing rapidly in more stagnant markets. Germany also has the benefit of virtually unimpeded access to European Community markets. But a major reason for the better reception of German manufactured exports is the high value of German manufactured imports. Similarly, the mutual inter- penetration of European, Canadian, and American manufactured goods markets is substantial. In 1986, U.S. manufactured goods imports from Europe and Canada were 70 percent and 30 percent more than U.S. exports, respectively.41 By contrast, U.S. manufactured imports from Japan were five times as large as U.S. manufactured goods exports to Japan. Intra-industry trade is conducive to maintaining free trade be- cause it sets up counterweight pressures. Protection of an industry is less likely when participants in that industry have a direct interest in selling in the country against which barriers are being sought. Because Japan imports so little, firms and workers abroad will not come to its defense when protection is sought.
If Japan is to participate fully in the global economy in the decades ahead, it must reduce these protectionist constraints on its trade. Given its high domestic saving rates, Japan will tend to have current account surpluses in the foreseeable future. One response has been to urge the Japanese to spend more of their incomes. But many Japanese argue that the rapid aging of the population compels high present saving. And since developing countries have great demands for capital, it would be useful for Japan to invest its savings abroad. Thus, a superior long-term approach would create the political conditions in which Japan is able to run whatever current account surplus it chooses. Indeed, as Stephen Marris has noted, Great Britain ran a current account surplus that averaged 4 percent of its GNP (quite similar to Japan's surplus in 1986) forfifty years between 1860 and 1910.42 In Britain's creation of a political structure conducive to such surpluses, its empire and powerful naval fleet were not inconsequential. For an economic "Pax Nipponica" in
41. In 1981, the United States ran a surplus of $3.7 billion in manufactured goods trade with Europe and $2.0 billion with Canada. Ibid.
42. Stephen Marris, Deficits and the Dollar: The World Economy at Risk (Washington, D.C.: Institute for International Economics, 1985), p. 92.
546 Brookings Papers on Economic Activity, 2:1987
which it can trade more freely, Japan will have to cultivate a hospitable international environment with more finesse. Even Britain, however, had an open home market that smoothed relations with its trading partners. Indeed, although its current account was in surplus, throughout this period Britain actually ran deficits in merchandise trade, offsetting them by a surplus from services transactions in shipping, insurance, and finance and a large surplus in net foreign earnings.43
A more open domestic market and greater intra-industry trade could help relieve the political pressures faced by Japan. The Japanese have not been unmindful of the need for better political relations. Their strategy so far has been to use direct foreign investment and voluntary export restraints." But voluntary export restraints delay the opening up of Japan, and foreign investment may also provoke political resentment. Ultimately, as the British example suggests, an open Japanese economy will be crucial.
Conclusions
Japanese trade runs into protectionist constraints more frequently than that of other countries, in part because of Japan's unusual trade structure, especially the small value of manufactured goods imports. Overwhelmingly, such imports are low because Japan has a comparative advantage in producing manufactured goods and because it is distant from its trading partners. In addition, however, peculiar features of Japanese trade reduce manufactured imports by a substantial percent- age, but a relatively small absolute value.
In 1980, for example, as equations in this study indicate, unusual barriers and preferences reduced Japanese manufactured goods imports about 40 percent. The removal of such barriers would have increased the value of Japanese manufactured imports about $13 billion dollars and lowered Japan's trade surplus in manufactured goods about $16 billion, or some 17 percent. Japan would have considerably more intra- industry trade.
43. See Albert H. Imlah, Economic Elements in the PaxBritannica (Russel and Russel, 1958).
44. See Kiyohiko Fukushima, "Japan's Real Trade Policy," Foreign Policy, no. 59 (Summer 1985), pp. 22-39.
Robert Z. Lawrence 547
With the exception of basic metals, food, clothing, and textiles, Japanese imports of manufactured goods are fairly responsive to relative price changes. This price responsiveness suggests that the abnormally low level of manufactured imports is due to unofficial impediments such as unusual buyer preferences and lack of competitiveness in the distri- bution system. To be able to export freely, Japan needs to improve its international political environment, open its domestic market, and restructure its trade.
Two complementary elements in such restructuring would be a stronger yen supported by an easier Japanese fiscal policy. Japan could temporarily lower its national saving rate by fiscal measures and initiate a period of lower current account surpluses. Because imports are responsive to relative price changes, manufactured goods imports would increase significantly.
A period of a strong yen could have irreversible effects. Foreigners would establish distribution networks and alter distribution structures, enabling them to hold on to markets even if the yen should reverse itself. And Japanese producers would sink costs into assembly operations abroad to service the domestic market.
But even with the yen above current levels, the Japanese market is likely to remain relatively closed, and the tensions from the unusual intangible barriers to imports are likely to continue. Although import barriers may not have a major impact on the Japanese manufactured goods trade surplus, it is still urgent to remove them. Indeed, Japan cannot afford to have such barriers because its fundamental structure, its need to run large manufactured goods trade surpluses, makes it vulnerable to political pressures.
It often seems expedient, in the face of foreign protectionist pressures, for Japan to limit exports rather than increase imports. But such a response does nothing to create a sustainable structure for the future. Indeed, by avoiding domestic adjustment, it has increased pressures over the long run. Ultimately, a sustainable structure requires an open domestic market. Accordingly, simply allowing the currency to appre- ciate may not be sufficient.45 Japan should take active measures to
45. The welfare implications of opening Japan's economy through a strong yen, which improves Japan's terms of trade, might be quite different from removing import barriers, which would worsen them.
548 Brookings Papers on Economic Activity, 2:1987
increase the competitiveness of its distribution system and to avoid administrative guidance and selective government procurement prac- tices.46
A final consideration has to do with Japan's agricultural trade. If Japan removes agricultural trade barriers, whose existence is not a matter of dispute, and increases its agricultural imports, it will have to shift its spending patterns or, more likely, export more manufactured goods to pay for the imports. Creating a favorable environment for these exports by enhancing two-way trade should be a major policy objective.
46. For an analysis of the protectionist problems associated with Japanese policies toward declining industries, see Robert Z. Lawrence, "A Depressed View of Policies for Depressed Industries," paper prepared for conference on U.S.-Canadian Trade and Investment Relations with Japan (University of Michigan, April 2-3, 1987).
Comments and Discussion
Paul Krugman: Robert Lawrence has produced an important paper- one that offers the seal of approval of the economics establishment to the charge that Japan's markets for manufactures are tacitly closed to imports. His conclusion is that Japan imports about 40 percent fewer manufactures than it would if its markets were as open as those of the average non-Japanese OECD country. That is, with freed markets it would import about 80 percent more. Given the imprecision necessarily involved, let's round it up and say that Japan might, if it would only open its markets, double its manufactures imports. We realize immediately that the paper is saying something very explosive. Let me say at the start that I believe that Lawrence is very probably right, although some of the methods used are a little shaky. I am much less certain about the political economy offered here, which prescribes trade liberalization as the answer to Japan's worsening relations with its trading partners. Before I turn to this question, however, let me review the logic of the economic analysis.
The basic piece of evidence on which the conclusions rest is the estimation of a number of import equations based on a differentiated- products model of trade in manufactured goods. Flatteringly, the paper offers this approach as one based on the monopolistic competition models of trade volume developed by Elhanan Helpman and me. However, Lawrence extrapolates considerably from the highly stylized analysis that Helpman and I offered. We used the assumption of zero transport costs as a fundamental simplifying device; Lawrence, because he is interested in reality, is obliged to modify that approach to take transportation costs into account.
Now the step from the no-transport-cost theoretical model to the realistic transport-cost-inclusive empirical model is not a rigorous one.
549
550 Brookings Papers on Economic Activity, 2:1987
In fact, as anyone who has worked on the problem knows, it is very difficult to derive a tractable multicountry model of the volume of trade in the presence of transport costs. This task is hard in conventional models; it is if anything harder when we allow for increasing returns, because there are all kinds of complicating effects that arise from the fact that countries with large domestic markets tend to be favored locations for industries subject to large economies of scale. So the equations estimated here are inspired by the Helpman-Krugman model rather than derived from it.
What makes this worrisome is that the role of transport costs is crucial in assessing Japan's openness to imports. Japan is the only resource- poor advanced country not in Europe, and the only large industrial nation with no industrial neighbors. We need to answer whether the geographical isolation of Japan is enough to explain its low share of imported manufactures, yet we lack a really well-specified model that lets us assess this issue. The Lawrence paper has what I think is a more plausible test that makes better use of the available data than any other effort to date, but even it is not completely satisfying because the empirical result is not firmly grounded in theory.
In spite of this unease, I agree that the rough estimate that Japan should be importing about twice as many manufactures as it does is plausible. Let me offer two less formal pieces of evidence that seem to support this. First, suppose we compare Japanese imports of manufac- tures with the "nonlocal" manufactures imports of the United States and the European Community. In 1984 the United States imported manufactures from sources other than Canada equal to 4.8 percent of GNP; the EC imported non-EC manufactures equal to 6.5 percent of GNP; Japan's manufactures imports were only 2.9 percent of GNP. Admittedly, Japan is poorer in resources than either the EC or the United States, which should show up in lower manufactures imports as well as higher exports; but Japan is also smaller than the other two economic units, which would lead us to expect a higher import share. So it would not be unreasonable to expect Japan to have a manufactures import share comparable to that of the EC, which would indeed involve a doubling of those imports.
Second, compare U.S. trade with Japan and that with Germany. As Lawrence points out, Germany and Japan are virtual twins in their net trade patterns. In 1984, however, U.S. manufactures exports to Germany
Robert Z. Lawrence 551
were 45 percent of U.S. imports, whereas U.S. manufactures exports to Japan were only 23 percent of U. S. imports. Once again, one can suppose that if the Japanese were as well behaved as the Germans their import share would roughly double.
Let me now turn to the problem of political economy. Suppose we accept that Japan should be importing twice as many manufactures as it now does. What we conclude from this depends critically on two questions, one of which the paper does not answer, the other of which it answers in a way that I find implausible.
The question the paper fails to answer is why Japan imports less than it should. At the beginning of the paper two alternative hypotheses are offered: tacit government policy or the "invisible handshake" of Japan's cartelized industrial structure. It makes a tremendous difference which of these you believe is the truth. If government policy is the villain, then all a liberal-minded Japanese government needs to do is reform itself. Japan's economic glasnost might be hard to sell to its bureaucrats, but we might have some hope that forceful leadership could change the situation quickly. If the problem is instead rooted in industrial structure, then the government presumably would have to engage in a long-term program of antitrust and moral suasion to bring down the barriers. The paper gives us no clue as to which story is the right one, and thus as to how patient Japan's trade partners will have to be. My reading of the anecdotal evidence is that industrial structure is unfortunately very important in the closure of Japan's markets, and thus that even with the best will Japan's government cannot deliver trade liberalization at all rapidly.
The 8.96 million yen question, however, is whether opening of Japanese markets would really ease trade frictions. Here I just do not agree with the paper's premise. What Lawrence does is to compare Japan with Germany, which runs a manufactures trade surplus as large relative to GNP as Japan's, but with seven times as large an import share-and which excites little hostility from the United States. How- ever, even a liberal Japan would not look like Germany-it would still, on the paper's estimate, export three times as much in the way of manufactures as it imports, essentially because Japan is not in the middle of Europe. Furthermore, I cannot believe that lack of friction with Germany can be explained by German manufactures imports. Recall that most of the intra-industry trade of Germany is within Europe. The
552 Brookings Papers on Economic Activity, 2:1987
United States sells Germany only 45 cents' worth of manufactures for every dollar it buys, as compared with Japan's 23 cents. Is it really plausible that the difference in popular perception can be attributed to the fact that the voice of the worker who loses his job to German competition is drowned out by the voices of 0.45 exporters, while his colleague who lost out to Japanese competition has only 0.23 exporters to argue with? I am not convinced.
My own alternative hypothesis is that conflict with Japan is due primarily to a different aspect of its trade performance-the rapid growth of Japanese exports and the rising Japanese market share. Unlike the Germans, the Japanese keep invading new markets that the United States regards as its private preserves. My guess is that this creates tension for both rational reasons, such as the problem of adjustment to increased competition, and irrational ones, such as fear and envy. Of course this is a very pessimistic diagnosis, since it says that the only way for Japan to have more friends is to be less successful. We can only hope that the paper is right, and that a liberal Japan would be able to run current account surpluses in peace. I just wouldn't count on it.
General Discussion
A number of participants questioned Lawrence's choice of model with which to analyze trade differences between Japan and other OECD countries. Martin Baily wondered why the Helpman-Krugman model had been chosen over a model such as Heckscher-Ohlin, in which comparative advantage is critical and specialization occurs in produc- tion. If the Japanese do not have a taste for product diversity, then the latter model is more relevant, and low imports of manufactured goods would be expected because Japan has a comparative advantage in producing manufactured goods. In light of this model, William Branson reasoned that the peculiar thing may be that Japan imports any manufac- tured goods at all. Lawrence conceded that comparative advantage ideally should be integrated into the model. But with differentiated goods, Japan nonetheless would have significant imports of manufac- tured goods according to the Helpman-Krugman model. Hendrik Hout- hakker believed the model's assumption of unitary income elasticities did not apply in Japan for U.S. imports and that the model was too
Robert Z. Lawrence 553
restrictive in this and other respects. He also observed that Japan is not as geographically isolated for purposes of trade as its distance from Europe and the United States would suggest. Geographically Japan's natural trading partners are the newly industrialized countries in the Pacific Basin, so one might examine the volume of imports from those countries for evidence of import restraints.
William Brainard elaborated on Paul Krugman's remark in his formal comment on the paper that the strong conclusions of the Helpman- Krugman model need not apply once transportation costs are introduced. In the presence of such costs, the cross-price elasticities at the product level would be crucial in determining import and export shares. If goods were close substitutes, even minor transportation costs would dominate trade patterns. He therefore questioned whether the regression results presented by Lawrence, even though they allow for transportation costs, provide a test of the Helpman-Krugman model and whether they can identify departures from normal patterns of imports and exports in the presence of transportation costs. Accepting Lawrence's verdict that Japan spent relatively less on imported manufactured goods than other industrial countries, Brainard reasoned that the paper had not persua- sively demonstrated why this was so. In the same vein, Lawrence Summers emphasized that Lawrence's statistical analysis did not pro- vide proof of "trade barriers" in Japan. The low level of imports could be explained by differences in tastes, language, and geographic location.
Marcus Noland questioned whether Lawrence's results demonstrate any greater Japanese import restriction than have previous studies. For example, the study by Bergsten and Cline that Lawrence cites concludes that Japan does not have above-normal protection. Adjusting the Berg- sten-Cline estimates to make them apply to total Japanese trade implies that Japan's import restrictiveness is in the range of $7 billion to $15 billion, which is in Lawrence's range. Noland also questioned the author's reliance on expansionary fiscal policy in Japan to help reduce the trade surplus. He noted that estimates of that effect are small relative to the magnitude of Japan's trade surplus, both globally and with the United States. An analysis by the Bank of Japan concluded that over a two-year period, the government's recently announced plan to provide a $6 trillion yen stimulus package would lower the total Japanese trade surplus by $3 billion to $3.5 billion and lower the bilateral surplus with the United States by about $1 billion. Noland's own estimates were
554 Brookings Papers on Economic Activity, 2:1987
somewhat higher in the first case and around $1.3 billion in the second case. Given such small effects of a fiscal stimulus, Noland concluded that significant reduction of the trade surplus would occur only if a high yen changes the structural features of the Japanese economy, such as the distribution system, that hamper trade.
Charles Schultze questioned whether an increase in intra-industry trade would shield Japan from protectionist measures, as Lawrence hoped. In his view, efforts to obtain protection are not organized along broad industry lines, but rather arise from competitive fears of producers representing fairly specific product categories. Greater intra-industry trade, as measured using SIC codes, would not remove these political pressures to stem foreign competition.