Improved Curve Resolution of Highly Overlapping Bands by Comparison of Fourth-Derivative Curves
G E R H A R D F L E I S S N E R , W O L F G A N G HAGE, A N D R E A S H A L L B R U C K E R , and E R W I N M A Y E R * lnstitut fiir Allgemeine, Anorganische und Theoretische Chemic, Universitiit lnnsbruck, A-6020 Innsbruck, Austria
Curve fitting of highly over lapping bands can be improved by com- parison of the fourth derivat ive of the exper imenta l compos i te band profile with that of the sum of the curve-fitted component bands. Opt imizat ion is achieved with fixed values of one band parameter , a iming thereby for opt imal correspondence between the fourth-de- rivative curves . F T - I R spectra of nitrate's vt band region in ~ 1 M
glassy Ca(NO3)2 solution, and of its v 2 band region in 10 M L i N O 3
solution, in ~0.5 M glassy Mg(NO3)2 solution and in 5 M Ca(NO3) 2 solution, all with DzO as solvent , were used. As a general rule, re- l iable curve fitting of two over lapping bands of u n k n o w n band shape is poss ible only when separat ion of their peak m a x i m a is larger than their average full width at half-height (FWHH) . We show here that by compar i son of fourth-derivat ive curves m a n y mor e over lapped compos i te bands can be rel iably resolved into their component bands, and, for the favorable case of 10 M L i N O 3
solution, separat ion of two bands by only a b o u t a third of their average F W H H is sufficient for rel iable curve fitting. This method requires data with very high s ignal- to-noise ratios. Improved curve fitting of highly over lapping bands is demonstrated for both a sum and a product of Gauss ian and Lorentz ian peak shapes , and a sort of recipe is g iven for both types of curve fitting. Synthet ic spectra of two over lapping bands, where the degree of over lap and their relative intensity were varied in a systemat ic way, are given togeth- er with their fourth-derivat ive curves . This informat ion will be of help for interpret ing fourth-derivat ive curves of exper imenta l high- ly over lapping two-band systems.
Index Headings: Over lapping bands; Curve fitting; Fourth-der iva- tive curves; Deconvolut ion.
I N T R O D U C T I O N
Curve fitting of overlapping bands into their separate components has become increasingly popular mainly be- cause, nowadays, spectra are generally in digitized form and their further handling is easy. 1-~6 Nevertheless, res- olution of overlapping bands into their components is no guarantee that the fit will be unique or meaningful. Van- deginste and De Galan 2 have developed criteria for crit- ical evaluation of curve fitting in infrared spectroscopy (reviewed by Maddams7). Gans and Gill 9 have examined in addition "the effect of signal-to-noise (S/N) ratio of the data on resolvability" and have found that "the min- imum band separation at which acceptable resolutions can be obtained decreases as S/N increases". The degree of overlap is characterized by a parameter ~ which is defined as 2,7
= (v2 - v0-(1/FWHHi + 1/FWHH2)
where vj and v 2 are the peak maxima of two overlapping bands, and FWHH~ and FWHH2, their full widths at half-
Received 4 January 1995; accepted 11 June 1996. * Author to whom correspondence should be sent.
height. For exact description of the individual band shape, an infrared spectrum with N bands and a linear baseline requires 4N + 2 parameters (equation 2 in Ref. 2). For that particular case, Gans and Gill 9 in their study of the influence of S/N ratio concluded that, for known band parameters, reliable resolution of overlapping bands requires ~ > 0.90 for S/N ~ 100 and ~ > 0.50 for S/N -~ 500. When the mathematical model is an approxima- tion, which is the usual case for experimental spectra, good results are supposedly obtained only for ~ > 2; i.e., separation of peak maxima must be larger than the av- erage FWHH, even when the number of bands is known. 2,7 Other criteria for resolvability of overlapping bands have been developed, 2,7,9,~1 but in this paper we use only the "8 criterion", because it can be easily calculated.
We show here that, for strongly overlapping bands of very high S/N ratio, reliable curve fitting can be extended to ~ < 2 by a comparison of fourth-derivative curves of experimental composite bands with those of the sum of their curve-fitted component bands. As test systems we use the v I and v 2 band region of nitrate in aqueous lith- ium, magnesium, and calcium nitrate solution, and we show that for these spectral regions quantitative resolu- tion of the composite band profiles into component bands due to "free" nitrate and the contact-ion pair is possible. The Vl and v2 band regions of nitrate were chosen because of our continuing studies of contact-ion pairing in aque- ous electrolyte solution. ~7,18 This paper is an extension of our previous report where contact-ion pairing in aqueous lithium and calcium nitrate solution was studied for the first time via nitrate's v2 band region. ~9 Here we show in a systematic way how an optimal fit can be obtained by fixing any of the parameters during optimization and con- trolling the various results by comparison of fourth-de- rivative curves. However, we are confident that these re- sults can be generalized and that this study goes beyond evaluation of nitrate's Vl and v2 band region, in that it shows where the limits of reliable curve fitting are for strongly overlapping bands in spectra of high S/N ratio.
Derivative curves for analysis of overlapping spectral bands were used as far back as the early fifties (see Ref. 20 for review). Second- and fourth-derivative curves are now used routinely for the estimation of the number of components in a composite profile, in particular, for stud- ies of biomolecules. 2,4,7-9,11-16,2°-32 Reports by Maddams and co-workers 23-25 can be consulted for detailed studies of second and fourth derivatives of synthetic and exper- imental spectra for peak-finding purposes, as well as their practical limitations. Comparison of second derivatives for reliable curve fitting of overlapping bands has been suggested and applied by Gans 11 and used in our earlier
studies , ~7,18 and the c o m p a r i s o n of f ou r t h -de r i va t i ve curves shown in this study enables an extension to lower 8 values. Friesen and Michaelian m have reported an al- ternative approach where curve fitting was combined with deconvolution. In our experience this comparison does not enable resolution of nitrate's v2 band region in aqueous lithium nitrate solution into its two components. Furthermore, deconvolution requires estimation of the true F W H H in the spectra of condensed-phase samples. This requirement can be a problem because the F W H H of bands caused by different vibrational modes may vary. Incorrect estimation of the F W H H can lead to generation of artifacts in the spectrum after self-deconvolution. 3~
This paper should be seen as a sort of recipe for im- proving the results of curve fitting of strongly overlap- ping bands by comparison of fourth-derivative curves. More sophisticated treatments are probably possible.
Resolution of highly overlapped bands by so-called two-dimensional (2D)-IR spectroscopy originally devel- oped by Marcott, Noda, and co-workers is a basically different approach. 34 37 In their approach, the sample is perturbed externally to induce t ime-dependent fluctua- tions of the infrared signal, In this way dynamic spectra are obtainable, and they can be transformed in two-di- mensional maps by using a correlation analysis. 38
EXPERIMENTAL
Experimental details for preparing the solutions and recording their spectra are given in Refs. 19 and 39. An- hydrous LiNO3 (Ventron), Ca(NO3)z.4H20 (Merck, p.a. quality), and Mg(NO3)2.6H20 (Merck, p.a. quality) were dried over P205, and solutions were made with D20 (Flu- ka, 99.7%). For spectra recorded at ambient temperature, ZnSe windows and a 15-p,m spacer were used. For the spectrum of hyperquenched glassy Mg(NO3) 2 solution in D20 recorded at 78 K (and shown in Fig. 5), a CsI win- dow was used. The FT-IR spectra were recorded in trans- mission mode on Bio-Rad's FTS 45 at 2-cm L resolution (DTGS detector, UDR1; zero-filling factor 2; low-pass filter at 1.12 kHz; triangular apodization) by coadding between 250 and 1000 scans. Peak max ima are given in the figures to 0.1 cm ~ and were found to be reproducible to <0.1 cm ~. Water vapor was subtracted f rom each spectrum. Spectra are shown as recorded without smooth- ing. Spectra and curve fits are from Refs. 19 and 39. Second and fourth derivatives were obtained by using the Sav i tzky-Golay convolution method 4° (quartic/quintic polynomial smooth). Note that second derivatives are shown inverted.
In quantitative analysis of overlapping composi te bands, the first artifact can be caused by subtraction of a background. In the Vl and v2 band region of nitrate so- lutions in D20, intense solvent bands are absent, and the background changes only gradually (see, e.g., figure 1 of Ref. 17). Therefore, the sloping background of the com- posite band profiles in the Vl and v 2 band regions of ni- trate solutions in D20 could be subtracted with a multi- point spline function routine. The effect of baseline cor- rection was controlled by comparing second-derivative curves of the spectra with those of the background-cor- rected composi te band profiles. Setting of the break points was varied until the second-derivative curves were
nearly identical. Only then was subtraction of the sloping background considered acceptable. Close to perfect su- perposition of second-derivative curves does not neces- sarily guarantee that subtraction of sloping background is free of artifact. However, in our experience it can be a good indicator of whether or not part of the band has been cut off by setting break points too close to the band center. But even this comparison has its limits (which is demonstrated in Fig. 3a and 3a'). Break points were gen- erally set close to two F W H H s of the band center for Gaussian bands and three FWHHs for Lorentzian bands. In subtraction of a sloping background, the comparison of fourth derivatives is less useful as an indicator for artifacts than the comparison of second derivatives, be- cause in the former case broad features due to the back- ground become too flattened.
For the v4 band region where the D20 solvent band is intense the comparison of second derivatives was unsat- isfactory, and a spectrum of similar band shape had to be subtracted, as described in detail in Ref. 19. Our pro- cedure of background subtraction is basically different from that developed by Holler et al., z6 who curve fitted the second derivatives of the spectra in order to reduce background problems.
Curve fitting was first attempted with a sum of Gauss- ian and Lorentzian peak shapes (SpectraCalc, "curvef i t" software). 4~ When this did not give a satisfactory fit, a product of Gaussian and Lorentzian peak shapes (Spec- trum Square Associates, "dataf i t" software) 42 was used. Band shape parameters are % Gauss in the first case and Gauss-width and Lorentz-width in the second. "Curve- fit" is a least-squares method, and "datafi t" is a maxi- mum-likel ihood method. As S/N ratio, max imum signal to estimated root mean squared (rms) noise was used. The estimate for errors in the percentage of areas presented in this paper includes only errors by curve fitting, and not additional possible errors caused by subtraction of baseline. The latter was included in our previous esti- mates; ~9 consequently, these values were larger than those given here. Since errors caused by baseline subtraction are more difficult to quantitate than those in curve fitting, they are not included here.
R E S U L T S
We begin with 10 M LiNO3 dissolved in D20. It is instructive first to show curve fitting of nitrate's v4 band region, where separation into two component bands is easy, and thereafter curve fitting of the v2 band region, where the two component bands are most strongly over- lapped because the component bands in the two spectral regions are both from " f ree" and contact-ion-paired ni- trate. Figure 1 a shows the asymmetr ic band characteristic for the v4 band region. 19,43 Curve fitting of this composi te band is possible with only two component bands. These are also shown in Fig. 1 a together with their sum (broken line). In Fig. lb the inverted second derivative of the experimental composi te band (solid line) is compared with that of the sum of the curve-fitted component bands (broken line). The correspondence between the two curves is taken as an indicator of a reliable curve fit. Band parameters of the two curve-fitted component bands are listed in Table I. The 8 value of 1.7 calculated
1236 Volume 50, Number 10, 1996
,T----'3.0--73 a 7 3 4 . 2 / ~
r 7 r b 717.1
735, I -%
770
Wavenumbers [cm -1] FIG. 1. (a) FT-IR spectrum of nitrate's u4 band region of 10.0 M LiNO 3 solution in D20 recorded at 320 K, and the curve-fitted component bands; (b) the comparison of the second derivative of the experimental composite band with that of the sum of the curve-fitted component bands (25-point second-derivative convolution, shown inverted, from Fleissner et al?9). General for Figs. 1-6: FT-IR spectra are shown after subtraction of the sloping background. Solid lines are used for deriva- tives of experimental composite bands; broken lines, for those of the sum of the curve-fitted component bands. The sum of the curve-fitted component bands is also shown by broken lines.
from these parameters indicates that curve fitting is still comparably easy; however, since the value is already <2, further control by comparison of second derivatives is meaningful and sufficient in this particular case.
T A B L E I, Curve-f itt ing analys is of nitrate's v 2 and v4 band region in F T - I R spectra of aqueous 10.0 M L i N O 3 solution in DzO."
% Relat. area and
Band v .... FWHH % assign- regions b (cm -I) (cm i) Gauss ×2 ment
v2 829.3 9.0 '! 10 0.00106 62, F Fit 1 a 825.5 7.7 73 38, B v 2 829.2 9.5 '1 15 0.00075 63, F Fit 2 825.6 7.9 79 37, B vz 829.1 10.0 d 20 0.00062 64, F Fit 3 b, "best" fit ~ 825.8 8.1 88 36, B v2 829.2 10.5 d 19 0.00055 61, F Fit 4 826.0 8.4 88 39, B v 2 829.0 11.0 ~ 21 0.00051 63, F Fit 5 c 826.1 8.4 95 37, B v 4 717.9 14.9 78 4.4"10 6 21, F
734.2 27.5 95 79, B
a For Tables I-IV: v ...... (in cm ~) are the peak frequencies; FWHH is the full width at half-height of the curve-fitted component bands; X 2 and reduced ×2 are the goodness-of-fit parameters of the "curvefit" and "datafit" software. 4~,42 F indicates "free" nitrate; B, bound (i.e., con- tact-ion paired) nitrate. % Gauss are the values obtained when using a sum of Gaussian and Lorentzian peak shapes; G-width and L-width (Gauss-width and Lorentz-width) are the values obtained when using a product function.
t, a, b, and c are from Fig. 2, the parameters for the v4 band region from Fig. 1 (from Ref. 17). "Best" fit based on best match of fourth derivative of sum of calcu- lated bands to the fourth derivative of the original spectrum (see text). Band parameters which were kept fixed during optimization; all other parameters were varied.
~D
-a O
<
a' 829:4 , a ! '
829.3 825.5
b 8 2 9 . 1 - ~ ~ 825.8
I I i C
8 2 9 ' ~ 826'1
b ! 828.9-- I
~ 825,6
, I I --828.0
840 810 840 810
Wavenumbers [ 1/cm] FIG. 2. FT-IR spectrum of nitrate's v2 band region of 10.0 M LiNO3 solution in D20 recorded at 320 K, and the curve-fitted component bandns: a, b, and e are three different curve fits where FWHH of the component band at -~829 cnv ~ was kept fixed at 9.0, 10.0, and 11.0 cm ~; a' , b ' , and e' are the comparison of the fourth derivative of the experimental composite band with that of the sum of the curve-fitted component bands (from Fleissner et al.; ~'~ l 1-point second-derivative convolution was applied twice).
Figure 2a shows the v2 band region of the same LiNO3 solution where band overlap is much more pronounced and band asymmetry of the composite band is barely ob- servable. It requires the fourth derivative to reveal the presence of two component bands (Fig. 2a', solid line); the second derivative is not sufficient. The S/N ratio of the composite band is 25000, and such high values of S/N ratio are a necessary condition for obtaining fourth- derivative curves of sufficient quality. Approximate peak frequencies are obtained from the fourth derivative and entered as initial values in the curve fit.
For this system we demonstrate in the following dis- cussion our method of resolution of highly overlapping bands for the case where a s u m of Gaussian and Lorentz- Jan peak shapes can be used. Here all parameters are varied except for the FWHH of one of the component bands, because small changes in FWHH entered into the curve fit lead to drastic changes in the fourth derivative. In this particular case the FWHH of the band at 2829 cm ~ was kept constant. Figure 2a to 2c shows three curve fits where the FWHH of this component band was
APPLIED SPECTROSCOPY 1237
kept cons tan t at 9.0, 10.0, and 11.0 cm ~ for cu rve fits a to c. The band pa rame te r s o f these cu rve fits are also l i s ted in Table I, toge ther wi th two fur ther cu rve fits o f the v2 band reg ion where the F W H H at -~829 c m -~ was kep t cons tan t at 9.5 and 10.5 c m -1. The X 2 va lues o f the five fits, wh ich are an ind ica to r for g o o d n e s s o f fit, 41 a r e
ve ry s imi la r and do not a l low us to d i f fe ren t ia te be tween the five fits. However , the c o m p a r i s o n o f the four th de- r iva t ive o f the expe r imen t a l c o m p o s i t e band (so l id l ine) wi th that o f the sum o f the two curve- f i t t ed c o m p o n e n t bands (broken line), wh ich is shown in Fig. 2a ' to 2c ' , p rov ides a v isual means o f c h o o s i n g the " b e s t f i t" . This c o m p a r i s o n c lea r ly shows that cu rve fits a and c mus t be wrong because o f the poo r c o r r e s p o n d e n c e b e t w e e n the four th der iva t ives . O p t i m a l c o r r e s p o n d e n c e be tw e e n the four th de r iva t ives is ob t a ined for fit b; therefore , accord- ing to our c r i te r ion this fit is cons ide r ed to be mos t re- l iable . I f X 2 va lues had been used as the sole ind ica tor for g o o d n e s s o f fit, then fit c w o u l d be cons ide r e d the bes t fit (see Table I). The B va lue for the two o v e r l a p p i n g bands o f fit b is 0.74, and this va lue is the lowes t one ob ta inab le for the cu rve fits shown in this paper. We es- t imate f rom the five cu rve fits that the er ror in the per- cen tage o f the areas is <_+2 units.
The fo l l owing tests on the sens i t iv i ty o f the m e t h o d and on the behav io r o f the curve- f i t so f tware were m a d e by us ing one o f the pa rame te r s o f the " b e s t " fit shown in Fig . 2b (Table I) as the ini t ia l f ixed va lue for fur ther c u r v e fits. In these la t ter fits, c o r r e s p o n d e n c e be tween fou r th -de r iva t ive cu rves was c lea r ly in fe r ior to that shown for Fig. 2b: (1) The peak m a x i m u m o f the band cen te red at 825.8 c m -1 was en te red as a f ixed value , and all o ther pa r ame te r s inc lud ing F W H H s of the two c o m - ponen t bands were var ied. (2) Percen t Gauss o f the com- ponen t at 829.1 cm ~ was kept f ixed at 20%, and all o ther pa r ame te r s were var ied . (3) F W H H of the c o m p o n e n t cen te red at 829.1 c m ~ was kep t f ixed at 10.0 cm ~, and in add i t ion % Gauss o f this band was en te red as a f ixed va lue with 40% ins tead o f 20%. (4) The op t ima l cu rve fit was first ob ta ined by en te r ing F W H H of the c o m p o - nent at 829.1 c m -~ as 10 cm-~; thereaf te r the fit was cont inued , but F W H H of the band o f 10.0 cm ~ was en- t e red as a var iable .
We conc lude , first, that en te r ing F W H H of one o f the c o m p o n e n t bands as a f ixed va lue is super io r to f ixing any o f the o ther band pa ramete r s , and, second, that a change in % Gauss f rom the op t ima l va lue o f 20 to 40% is c l ea r ly d i sce rn ib le by the c o m p a r i s o n o f four th -der iv - a t ive curves . Test 4 fur ther shows that the op t ima l fit is lost once F W H H of the band c o m p o n e n t is en te red as a va r i ab le ins tead o f a f ixed value. This means that the fit m o v e s f rom that local m i n i m u m , ob ta ined by op t ima l su- pe rpos i t i on o f fou r th -de r iva t i ve curves , t owards ano ther local m i n i m u m . X z o f the fit whe re all pa rame te r s were va r i ed was lower than that where F W H H was kep t con- stant. This resul t is cons i s t en t wi th the a b o v e conc lus ion that m i n i m a l ×2 va lue as the sole ind ica to r for g o o d n e s s o f fit is in fe r ior to a c o m p a r i s o n o f fou r th -de r iva t ive curves .
Re fe r ence 19 g ives in deta i l the a s s ignmen t o f the two c o m p o n e n t bands at 829.1 and 825.8 cm I to the out -of - p lane m o d e o f " f r e e " and con tac t - ion pa i r ed ni trate , and Refs. 17-19 and 43, the a s s ignmen t o f the two c o m p o -
O
<
' ~ 827.5
I I
I I r
C • 827.l
Y 828'8~t/7 //
I I I
d 829 .0 - - -~ __ 825.6
870 830 790
a i 827.5
I
b'
I
C'
I
d'
870
828.9 7
, I I
828.9--7
830 790 W a v e n u m b e r s [ 1 / cm]
FIG. 3. Effect of noise and baseline correction on the curve fits of a synthetic spectrum. (a) Synthetic spectrum consist ing of two overlap- ping model bands (equal to fit b of Fig. 2) without (solid line) and after baseline correction (broken line) and the baseline; (a ' ) comparison of second derivatives of spectra from a (1 l-point second derivative con- volution); (b) curve-fit (broken) of noise-added (0.1%) synthetic spec- trum (solid, fit b of Fig. 2) and the curve-fitted component bands; (e and d) curve fits (broken) of baseline-corrected spectrum (solid, without noise) and curve-fitted component bands; for e all parameters were op- timized; for d FWHH of the band at ~ 8 2 9 cm ~ was kept fixed at 9.7 cm ~; (b ' , e ' , and d ' ) comparison of the fourth derivatives of the spectra (solid) with that of the sum of the curve-fitted component bands (bro- ken) (l l-point second-derivative convolution was applied twice).
nent bands at 717.9 and 734.2 c m L to thei r de fo rma t ion modes . S ince this pape r is c o n c e r n e d with the genera l i t i e s o f our curve- f i t t ing p rocedure , de ta i l s o f a s s i gnmen t are not g iven here but can be found in the re fe rences g iven above .
We have fur ther tes ted the inf luence o f noise and sub- t rac t ion o f a base l ine wi th respec t to the c o m p a r i s o n of fou r th -de r iva t ive curves . In o rde r that these tests w o u l d be more re l evan t to the pa r t i cu la r curve- f i t t ing p r o b l e m o f n i t ra te ' s vz band region , they were m a d e with a syn- thet ic spec t rum cons i s t ing o f the sum of the two opt i - m a l l y curve- f i t t ed c o m p o n e n t bands ; this synthe t ic spec- t rum is shown in Fig. 2b (broken l ine), and the band pa r a me te r s o f the curve- f i t t ed c o m p o n e n t bands are l i s ted in Table I (fit 3, " b e s t f i t") . F igu re 3a (left) shows the synthe t ic spec t rum cen te red at 827.5 c m - I ( so l id l ine) and a mod i f i ed synthe t ic spec t rum (broken l ine) whe re a
1238 Volume 50, Number 10, 1996
T A B L E II. Curve-fitting analysis of a synthetic spectrum, consist- ing of two peaks.
%
v ...... FWHH % Relat. Fit" (cm I) (cm i) Gauss ×2 area
d, FWHH fixed, 829.0 9.7 ~ 41 9.3.10 4 65 "bes t " fit t' 825.6 8.1 91 35
" Band parameters are those of fit 3 ( "bes t" fit) of Table I; b, c, are band parameters of fits b, c, and d in Fig. 3.
b See Table I. See Table 1.
and d
spline function baseline was subtracted, with break points set at 856.9 and 780.1 cm ~. This baseline subtraction leads to a decrease in area by 10.2%. This modification is not discernible by comparison of the second-derivative curve of the synthetic spectrum with that of the baseline- subtracted modified spectrum (Fig. 3a').
The effect of noise is tested in Fig. 3b, where noise was added to the uncorrected synthetic spectrum to obtain an S/N ratio of 1000. The curve-fitted component bands obtained with all parameters varied are shown in Fig. 3b, and the comparison of fourth derivatives in Fig. 3b'. The optimal superposition of these fourth-derivative curves is, according to our criterion, already an indication of the quality of the curve fit. The band parameters of this fit are listed in Table II. Table II contains, in addition, the band parameters of the curve-fitted component bands of the synthetic spectrum without noise. These two sets of band parameters are identical. The curve fit of the syn- thetic spectrum without noise represents the global min- imum. Addition of noise, up to S/N = 1000, therefore gives a fit which reaches the global minimum.
The effect of baseline correction on the curve fits is shown in Fig. 3c and 3d. For these fits, the synthetic baseline-corrected spectrum shown in a (broken line, without noise) was used. For fit c, all parameters were varied; the comparison of fourth derivatives (Fig. 3c') clearly shows poor correspondence. For fit d, FWHH of the band centered at -~829 cm ~ was kept fixed, and its value varied in steps of 0.3 cm ~ until optimal superpo- sition of the fourth-derivative curves was obtained (Fig. 3d'). The band parameters of fits c and d are also listed in Table II. Comparison of their band parameters with those of the original synthetic spectrum (i.e., without noise and subtraction of a baseline) shows that the band parameters of fit d much more closely approach those of the uncorrected synthetic spectrum than those of fit c. In particular, band areas and peak positions of fit d and the synthetic uncorrected spectrum are nearly identical. Er- rors in the subtraction of a baseline occur in particular for bands of the Lorentzian band because of the pro- nounced tailing of the band wings. These errors often cannot be detected even by a comparison of second-de- rivative curves (see Fig. 3a'). Our test case shown here suggests that this error can lead to erroneous curve fits
Wavenumbers [ 1/cm] FIG. 4. FI ' -IR spectrum of nitrate's v~ band region of glassy -~1 M Ca(NO3) 2 solution in D20 recorded at 78 K, and the curve-fitted com- ponent bands: a, b, and c are three different curve fits where the peak maximum of the component band at low frequency was kept fixed at 1034.8, 1036.3, and 1037.0 cm ~; a ' , b ' , and c' are the comparison of the fourth derivative of the experimental composite band with that of the sum of the curve-fitted component bands (from Fleissner; 3'~ 17-point second-derivative convolution was applied twice).
when all band parameters are varied, but that it can be corrected by keeping one of the parameters fixed and aiming for optimal superposition of the fourth-derivative curves.
Summarizing, we consider these test cases as strong indications that curve fits optimized by comparison of fourth-derivative curves give band parameter values which approach the true values.
We next show a case where a product of Gaussian and Lorentzian peak shapes had to be used because a sum of peak shapes did not give a fit of sufficient quality. This type of function has been used, e.g., for curve fitting stretching band regions of water and liquid ammonia. 44,45 Here it is not meaningful to keep the FWHH of one of the component bands constant, because for each com- ponent band a Gauss-FWHH and a Lorentz-FWHH are obtained, and the values of the two FWHHs can vary over a wide range. Therefore, the peak frequency of one of the component bands was kept constant and all other parameters were varied. Figure 4a shows three curve fits of nitrate's v, band region for glassy ~1 M Ca(NO3)2
APPLIED SPECTROSCOPY 1239
TABLE IlL Curve-fitting analysis of nitrate's vt b a n d region in FT-IR spectra of glassy ~ 1 M Ca(NO3)2 solution in D~O.
%
Relat. area
G-width, and Vm, , F W HH L-width Reduced assign-
Fit" (cm -1) (cm i) (in cm -1) ×2 ment
Fit 1 a 1045.9 13.7 13.7/3.4.1038 0.0110 63, B 1034.8 ~ 14.4 55.5/15.1 37, F
Fit 2 1046.1 13.2 13.2/6.6.105 0.0082 59, B 1035.5 ~ 14.7 53.6/15.6 41, F
Fit 3 b, 1046.4 12.8 12.8/3.4.1038 0.0077 55, B "bes t" tip 1036.3 ~ 15.3 48.3/16.3 45, F
Fit 4 1046.5 12.7 12.7/8.8,106 0.0082 53, B 1036.5 ~ 15.4 46.7/16.6 47, F
Fit 5 c 1046.5 12.3 12.3/1.4'103° 0.0104 49, B 1037.0 ~ 15.9 43.9/17.5 51, F
"Band parameters for a - e are f rom Fig. 4. b See Table I.
See Table I.
solution in D20 recorded at 78 K. 46 The peak frequency of the component band at low wavenumbers was kept constant at 1034.8, 1036.3, and 1037.0 cm -~ for curve fits a to c. The band parameters of these curve fits are listed in Table III, together with two further curve fits of the vl band region, where these peak maxima were kept constant at 1035.5 and 1036.5 cm I. Comparison of the fourth derivative of the experimental composite band (solid line) with that of the sum of the two curve-fitted component bands (broken line), which is shown in Fig. 4a' to 4c' , allows differentiation. This comparison clearly shows that optimal correspondence between the fourth derivatives is obtained for fit b; therefore, this fit is con- sidered to be the most reliable. In this particular case fit b has the lowest reduced ×2 value, which is for "datafit" the goodness-of-fit criterion. 42 However, this result seems to be fortuitous, and we will show in Fig. 6 a case where the best fit does not give the lowest reduced X 2 value. The g value for the two overlapping bands of fit b is 1.5, the error in the percentage of the areas is _+2, and the S/N ratio is -~10000.
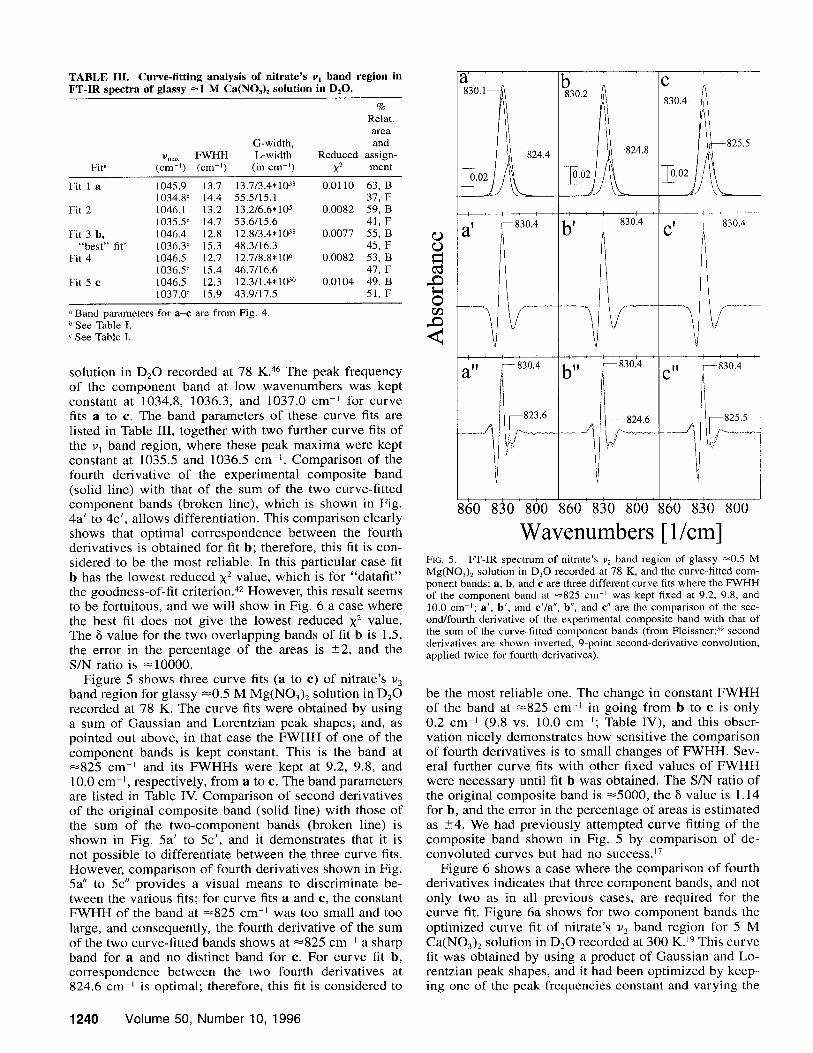
Figure 5 shows three curve fits (a to e) of nitrate's v2 band region for glassy ~0.5 M Mg(NO3)2 solution in D20 recorded at 78 K. The curve fits were obtained by using a sum of Gaussian and Lorentzian peak shapes; and, as pointed out above, in that case the F W H H of one of the component bands is kept constant. This is the band at ~825 cm -t and its FWHHs were kept at 9.2, 9.8, and 10.0 cm -~, respectively, from a to c. The band parameters are listed in Table IV. Comparison of second derivatives of the original composite band (solid line) with those of the sum of the two-component bands (broken line) is shown in Fig. 5a' to 5c' , and it demonstrates that it is not possible to differentiate between the three curve fits. However, comparison of fourth derivatives shown in Fig. 5a" to 5c" provides a visual means to discriminate be- tween the various fits; for curve fits a and c, the constant FWHH of the band at ~825 cm -~ was too small and too large, and consequently, the fourth derivative of the sum of the two curve-fitted bands shows at ~825 cm -~ a sharp band for a and no distinct band for c. For curve fit b, correspondence between the two fourth derivatives at 824.6 cm ~ is optimal; therefore, this fit is considered to
FIG. 5. FT-IR spect rum of nitrate's v2 band region of glassy ~0 .5 M Mg(NO3) 2 solution in D20 recorded at 78 K, and the curve-fitted com- ponent bands: a, b, and e are three different curve fits where the FWHH of the component band at ~825 cm -t was kept fixed at 9.2, 9.8, and 10.0 cm ~; a ' , b ' , and e'/a", b", and e" are the comparison of the sec- ond/fourth derivative of the experimental composite band with that of the sum of the curve-fitted component bands (from Fleissner; 39 second derivatives are shown inverted, 9-point second-derivative convolution, applied twice for fourth derivatives).
be the most reliable one. The change in constant FWHH of the band at ~0825 cm -~ in going from b to e is only 0.2 cm J (9.8 vs. 10.0 cm-~; Table IV), and this obser- vation nicely demonstrates how sensitive the comparison of fourth derivatives is to small changes of FWHH. Sev- eral further curve fits with other fixed values of FWHH were necessary until fit b was obtained. The S/N ratio of the original composite band is ~5000, the g value is 1.14 for b, and the error in the percentage of areas is estimated as _+4. We had previously attempted curve fitting of the composite band shown in Fig. 5 by comparison of de- convoluted curves but had n o s u c c e s s . 17
Figure 6 shows a case where the comparison of fourth derivatives indicates that three component bands, and not only two as in all previous cases, are required for the curve fit. Figure 6a shows for two component bands the optimized curve fit of nitrate's v2 band region for 5 M Ca(NO3) 2 solution in DzO recorded at 300 K. 19 This curve fit was obtained by using a product of Gaussian and Lo- rentzian peak shapes, and it had been optimized by keep- ing one of the peak frequencies constant and varying the
1240 Volume 50, Number 10, 1996
T A B L E IV. Curve-fitting analysis of nitrate's v2 band region in FT-IR spectra of glassy ~ 0 . 5 M Mg(NO3)2 solution and of 5.00 M Ca(NO3) 2 solution, both in D20.
% Gauss (G-width ,
v ...... F W H H L-wid th , X 2 % Relat , area Fit" (cm i ) (cm i) in cm i) ( reduced X 2) and a s s i g n m e n t
~ 0 . 5 M Mg(NO3) 2 so lu t ion
1) 2 830.1 9.2 92 6 . 5 ' 1 0 6 72, F Fi t l 824.4 9.2 c 51 28, B v 2 830.2 9.1 92 1.1"10 ~ 68, F Fi t 2, " b e s t " fit b 824.8 9.8 c 60 32, B v2 830.4 8.9 91 9 . 1 , 1 0 ~ 62, F Fi t 3 825.5 10.0 c 68 38, B
5.00 M Ca(NO3)2 so lu t ion
v2 829.4 11.3 16 4 . 2 , 1 0 5 32, F Fit a 823.3 9.4 91 (0.12) 68, B v 2 830.1 10.6 (3.4* 1038/10.6) (0 .099) 32, F Fi t b, 824.0 9.2 (8.5/554) 53, B " b e s t " fit h 820.3 c 8.7 ( 17.1/9.4) 15, t r ip le t? v2 828.5 t 1.9 (49.9/12.4) (0.020) 35 Fit e 823.5 8.7 (12.8/13.0) 62
820.0 c 4.5 (4.5/3.4,1038) 3
" T h e band pa rame te r s tbr g l a s sy t, See Table I.
See Table I.
~ 0 . 5 M Mg(NO3) 2 so lu t ion are f rom Fig. 5, and those for 5 .00 M Ca(NO3)2 so lu t ion f rom Fig. 6.
fixed frequency in small increments in several curve fits, analogous to the procedure described for Fig. 4. Despite this optimization, it was impossible to obtain acceptable correspondence between the fourth-derivative curves (Fig. 6a'). This result was taken as an indicator that the composite band contains a third component band. Figure 6b shows the optimized curve fit for three component bands; the correspondence between the fourth-derivative curves now is optimal (Fig. 6b'), and therefore, we con- sider it justified to include a third component band in the curve fit. The band parameters are also listed in Table IV. The S/N ratio of the composite band is ~3000; the error in the percentage of band areas is estimated as _+5. For spectra consisting of more than two overlapping bands,
values of neighboring bands are usually given. 9 In this case ~ values are 1.24 (for 830.1/824.0 cm 1) and 0.83 (for 824.0/820.3 cm I).
Figure 6b' further demonstrates that even fourth-deriv- ative curves do not necessarily resolve overlapping bands into their component bands, even in cases where curve fitting still seems to give reliable results. The third com- ponent band centered at 820.3 cm 1 is no longer resolved into a distinct local maximum, but it is indicated in the fourth-derivative curves only by asymmetry and en- hanced intensity at 813.0 cm -1. This asymmetry is less useful as a criterion than the previous comparisons of fourth-derivative curves, and therefore the estimate for the error in percentage of areas of _+5 is larger than in the former examples.
In Fig. 6c we show how a shift of peak maximum of the weak component band at low frequency by 0.3 cm -~ affects the comparison of fourth derivatives (Fig. 6c'). Its optimized peak maximum is 820.3 cm -~ for the fit shown in 6b (Table IV), and a fixed value of 820.0 cm -t was entered for the curve fit shown in Fig. 6c. Correspon- dence of fourth-derivative curves (Fig. 6b' and 6c') is for fit c worse than for fit b, and therefore fit c is less reliable than fit b. When the peak maximum was shifted by 0.3 cm -~ to high frequency and a fixed value of 820.6 cm 1
entered in the curve fit, correspondence between fourth- derivative curves also was worse than that of fit b (not shown). We conclude that comparison of fourth-deriva- tive curves can be a criterion for the goodness of fit even when fourth derivatives cannot resolve the component bands as in Fig. 6. For this particular curve fit, reduced X 2 values are not useful as the only criterion for goodness of fit, because the values are 0.099 for fit b and 0.020 for fit e (Table IV).
Interpreting the fourth derivative of a highly over- lapped composite band can be difficult, and the curves shown in Fig. 6 are a good example. Band contours of overlapping bands and their derivatives have been re- ported before, 2L,22,47 but to our knowledge this has not been done in a systematic way for fourth-derivative curves. Therefore we show in Figs. 7 and 8 synthetic curves of two overlapping bands of Gaussian and Lo- rentzian band shape where the degree of overlap and the relative intensity of the two bands were varied in a sys- tematic way and where below each overlapping synthetic curve its fourth derivative is shown. Overlap was varied in Fig. 7 from 8 = 0.67 to 2.33, and in Fig. 8 from ~ = 0.33 to 2.00. The FWHH of the two synthetic bands was the same throughout. In both figures bands of equal in- tensity are shown as a, and bands with relative intensities of 2:1 and 5:1 as b and e, respectively.
Figure 7a and 7b show that, for bands of Gaussian band shape, separation of the two overlapping bands into two distinct positive lobes by fourth-derivative curves is not possible for 8 = 0.67, but requires S > 0.67. How- ever, for the overlapping bands of Lorentzian band shape shown in Fig. 8a and 8b, separation into two distinct positive lobes is already obtained with 8 = 0.67. This observation is well known, and Refs. 2, 9, and 25 contain a discussion for second- and fourth-derivative curves. For Figs. 7c and 8c, differences in intensity are most pro- nounced; consequently, separation of overlapping bands into their components by fourth derivatives is most dif- f i c u l t - w h i c h is consistent with the many previous stud-
APPLIED SPECTROSCOPY 1241
a • 823.3
I I I
a' ~ 823.6'
8 3 1 . 3 - - J [ - - - 813.0
I I I
b b' • 24.0
" 830,l
' I I I
C C ~ - - 8 2 3 . 5
8 3 1 . 3 ~
I [
1----- 823.6
[ 813.0
823.6
831.3 ~ - ~ ~ 8 1 3 , 0
828.5---~ ' ~
J 800 860 830 800 860 830
Wavenumbers [ 1/cm] FIG. 6. (a, b, and e) FT-IR spectrum of nitrate's v z band region of 5.00 M Ca(NO3) 2 solution in D20 recorded at 300 K, and the curve- fitted component bands: two component bands were used for fit a but three for fit b and c; (a ' , b ' , and c ' ) the comparison o f the fourth derivative of the experimental composi te band with that of the sum of the curve-fitted component bands (from Fleissner et al.; 19 9-point sec- ond-derivative convolution was applied twice).
ies of the effect of relative intensities of overlapping bands on their separability (see, e.g., Refs. 2 and 7). In Fig. 7c the presence of the second component band of low intensity becomes observable in the fourth-derivative curves for ~ ~- 1.33 in the form of asymmet ry of the negative lobes and an additional positive lobe at similar frequency where the band of low intensity is centered. In Fig. 8c the component band of low intensity is already observable for 8 -> 0.33 in the form of asymmet ry of the negative lobes and for ~ >_ 0.67 in the form of a distinct shoulder, which develops for ~ _> 1.33 into a distinct sec- ond positive lobe. Our Fig. 6b represents a curve fit where the relative intensity of the two bands centered at 824.0 and 820.3 cm 1 (Table IV) is similar to those shown in Figs. 7c and 8c and where the presence of the component band at low frequency is also indicated by asymmet ry of the fourth-derivative curves. Clearly, if more bands were to overlap badly, the problem could become less amenable to obtaining a unique fit.
~= 0.67 1.33 1.67 2.00 2.33
a a a
L L
L / i L
FIG. 7. Synthetic curves of two overlapping bands of Gaussian band shape where the degree of overlap is varied from ~ = 0.67 to ~ = 2.33; fourth derivatives are shown below each composite band (13-point sec- ond-derivative convolution was applied twice). F W H H of the two bands is the same throughout. (a) Relative intensity of the two bands is 1:1; (b and c) it is 2:1 and 5:1.
D I S C U S S I O N
In our experimental test cases for improved curve fit- ting by comparison of fourth derivatives shown in Figs. 2 to 6, the number of bands is derived f rom the fourth derivatives, but peak positions, FWHHs, and band shapes are not known. Since the mathematical model usually is an approximation for experimental spectra, the assump- tion of S > 2 as the resolvability limit for bands of un- known band shape should be valid. 2,7 However, because of the combined use of spectra of very high S/N ratio, of between ~3000 and 10000, and the additional com- parison of fourth-derivative curves, reliable curve fitting is possible for strongly overlapping bands with g < 2. The 8 values are 0.74 for Fig. 2b, 1.45 for Fig. 4b, 1.14 for Fig. 5b, and 1.24 and 0.83 for Fig. 6b, and these values clearly indicate the advantage of our approach. Vandeginste and De Galan 2 have pointed out that "a good fit of a composi te band system is a necessary, but cer- tainly not a sufficient condition for a good recovery of quantitative data" . This assumption, seen clearly in Figs. 2-6 , is demonstrated here, for example, in Fig. 2, where it was impossible to differentiate between five curve fits
1242 Volume 50, Number 10, 1996
~= 0.33 0.67 1.33 1.67 2.00
L
FIG. 8. Syn the t ic cu rves of two o v e r l a p p i n g bands of Loren tz i an band shape whe re the degree of ove r l ap is var ied f rom g = 0,33 to g = 2.00; fourth de r iva t ives are s h o w n be low each c o m p o s i t e band (13-point sec- ond -de r iva t ive convo lu t i on was app l i ed twice) . F W H t t of the two bands is the s a m e throughout , (a) Re la t ive in tens i ty of the two bands is 1 : 1; (b and e) it is 2:1 and 5:1.
on the basis of their X 2 values (Table I). By comparison of fourth-derivative curves, a further criterion is intro- duced which allows one to differentiate. This point is supported by curve fits e and d of Fig. 3, where without comparison of fourth-derivative curves one could not ob- tain true band parameter values.
The lowest 8 value of 0.74, where in our opinion a reliable curve fit was obtained (Fig. 2b), seems to indicate a new lower 8 limit for resolvability of overlapping bands of unknown band shape. However, reliable curve fitting of two overlapping bands depends, in addition to the value 2,7 and high S/N ratio, 9 on the ratio of intensities and on differences in F W H H Y .9 The test case used for Fig. 2 is a particularly fortunate one in that the two component bands are of similar intensity. Curve fitting of overlap- ping bands of very different intensity is much more dif- ficult, as indicated by the synthetic curves of Figs. 7 and 8, and the possibility of decomposing the spectrum into its component bands will be less likely than it is for bands of similar intensity, even when fourth-derivative curves
are compared. Therefore, it is not meaningful to give a new lower limit in terms of 8 value where comparison of fourth derivatives can give reliable curve fits.
The comparison of fourth-derivative curves suggested in this paper as a further criterion in curve fitting of strongly overlapping bands is limited to composite bands of spectra with a very high S/N ratio, because an increase in the order of differentiation by 2 leads to a decrease in the S/N ratio by about an order of magnitude. 48 There- fore, the S/N ratio of a fourth derivative is about 1/100 of that of the original band. This condition limits the application to spectroscopic techniques where high S/N ratios are easily obtainable--for example, UV-visible and NMR spectroscopy in addition to FT-IR spectroscopy.
Comparison of fourth-derivative curves can give fur- ther information on the number of component bands even in cases where resolution into their components by fourth derivatives is not possible. This observation is demon- strated by Fig. 6b, where a third component band had to be included to obtain acceptable correspondence of fourth derivatives. This consideration is important, as empha- sized by Gans] ~ because in curve fitting of multiple bands "it is often far from clear in the first place how many components are present". It is good practice to start curve fitting of a highly overlapping band profile with two bands, then add a third one and so on, until the fit can be sufficiently refined. Reliability of a curve fit is then judged on the basis of some goodness-of-fit param- eter. This would not have been a sufficient criterion for our composite band shown in Fig. 6, where the curve fit required three component bands. In this particular case, the curve fits with two and three component bands (Fig. 6a and 6b, Table IV) have similar reduced X 2 values, and only the comparison of fourth derivatives as a further criterion allowed us to differentiate and to select b. The lowest X 2 value was obtained for fit e, and here again only comparison of fourth derivatives allowed us to dis- criminate between fit b and e.
In curve fitting of overlapping bands, multiple minima are possible, because the FWHH parameter enters the Gauss and Lorentz functions as a squared term. Gans ~ gives an analysis of the multiple minima problem for this situation, and he shows that for a given FWHH two local minima are present which are shifted by ± the same frac- tion of FWHH. If there is more than one band present, additional minima occur. 1~ In our experience, gained by the curve fits shown here and by curve fits of many more highly overlapping composite bands contained in Ref. 39, multiple solutions with very similar ×2 values did occur, but the best solution could be selected by comparison of fourth-derivative curves. This is so because even small changes in any of the band parameters of the component bands can clearly be seen in the fourth derivative. Figure 5 serves here as an example because it was possible to differentiate between fits b and e by comparison of fourth derivatives, although the only difference was a fixed FWHH of the band at ~825 cm- ' of 9.8 (b) and 10.0 (c) cm-~ (Table IV).
The next band parameter we discuss is the band center; this parameter is varied when one is using a sum of Gaussian and Lorentzian peak shapes but it is kept fixed when one is using a product. In all highly overlapping band profiles curve fitted so far by comparison of fourth
APPLIED SPECTROSCOPY 1243
derivatives, it was very easy to obtain nearly perfect su- perposition of peak frequencies of the positive lobes of fourth-derivative curves. Therefore we are confident that the peak max ima of the component bands obtained by this curve-fitting procedure approach the " t rue" values.
The largest uncertainty exists with respect to relative amounts of Gaussian and Lorentzian peak shapes. The sum or the product of Gaussian and Lorentzian peak shapes is usually varied during curve fitting, and it is conceivable that the fit moves from one local minimum towards another local min imum by varying the sum or product of Gaussian and Lorentzian peak shapes. In test 3 for Fig. 2b we have shown that a change of % Gauss of the component at 829.1 cm -1 f rom 20 to 40% gives a curve fit which is clearly inferior to the "bes t " fit. It appears that a comparison of fourth-derivative curves also is useful here, because the fourth-derivative curve of a pure Gaussian band is quite different f rom that of a pure Lorentzian band and, therefore, wrong peak shapes can be detected by that comparison (see Figs. 7 and 8).
For the curve fits of Figs. 1-6 only symmetrical band shapes were used. Maddams 7 reviews the problem of symmetrical vs. asymmetrical band profiles, and he con- cludes that "i t is most unwise to curve fit a composi te profile in terms of asymmetr ic peaks unless there is a rational reason for so doing. Experimental evidence, in the form of measured profiles of compounds of the type in question, is required and it is therefore relevant to re- view the published experimental work on the shapes of bands in vibrational spectra". In curve fitting of Raman and infrared band shapes of electrolytes in solution, a symmetric band shape is generally adopted, 49 and we therefore consider a symmet ry of a component band un- likely.
Our examples have been limited to curve fitting of two or, in the case of Fig. 6b, three component bands. How- ever, in practical applications overlapping bands consist- ing of three or four component bands are most frequently encountered, and Maddams 7 has pointed out the need for systematic study of their synthetic band profiles. Here again, comparison of fourth derivatives will be helpful for the case of strong overlap. However, with our present approach, curve fitting of highly overlapped band profiles consisting of three or even four component bands and comparison of their fourth derivatives is tedious and time consuming. We expect that eventually this comparison of fourth-derivative curves will be included in the software of one of the curve-fitting programs, and only then do we plan to go from highly overlapping two-component band profiles to three- or four-component band profiles.
Finally we briefly discuss possible advantages of the fourth-derivative criterion for curve fitting FT-IR spectra of a mult icomponent band system, namely, of the amide I (or amide I ' ) band region of proteins at ~ 1 6 2 0 - 1 6 9 0 cm -~. This system is due almost entirely to the C - O stretching vibration of the peptide linkages that constitute the backbone structure, and it has been the most useful probe for determining the secondary structures of pro- teins in solution. 12-16,28-32,5° For example, Byler and Sus i 12
list in their table II up to 1 1 characteristic frequencies of amide I components. In curve fits of the amide I region an average F W H H of 13 cm -~ is entered. 12 For this FWHH, the separability criterion =; of 8 > 2 requires sep-
aration of neighboring band components by more than 13 cm -~. However, separation between the 11 characteristic frequencies listed in Ref. 12 can be as low as 4 cm 1. This approach then gives a 8 value much less than 2, and additional control of the quality of a curve fit by com- parison of fourth-derivative curves should prove fruitful. This procedure requires fourth derivatives of high S/N ratio, and Haris et al. 3~ show that these can be obtained for solutions in D20 containing only 5% (w/v) protein.
A C K N O W L E D G M E N T
We are grateful for financial support by the ForschungsfOrderungs- fonds of Austria (Project P10404-PHY).
1. J. Pitha and R. N. Jones, Can. J. Chem. ,:14, 3031 (1966); ibid., 45, 2347 (1967); idem, Can. Spectrosc. 11, 14 (1966).
2. B. G. M. Vandeginste and L. De Galan, Anal. Chem. 47, 2124 (1975).
3. R Gans, Coordin. Chem. Rev. 19, 99 (1976). 4. T. C. O'Haver and G. L. Green, Anal. Chem. 48, 312 (1976). 5. R Gans and J. B. Gill, Appl. Spectrosc. 31, 451 (1977). 6. A. Baruya and W. E Maddams, Appl. Spectrosc. 32, 563 (1978). 7. W. E Maddams, Appl. Spectrosc. 34, 245 (1980). 8. B. E. Barker and M. E Fox, Chem. Soc. Rev. 9, 143 (1980). 9. R Gans and J. B. Gill, Anal. Chem. 52, 351 (1980).
10. W. I. Friesen and K. H. Michaelian, Appl. Spectrosc. 45, 50 (1991). 11. R Gans, Data Fitting in the Chemical Sciences (Wiley, New York,
1992), pp. 69, 185. 12. D. M. Byler and H. Susi, Biopolymers 25, 469 (1986). 13. H. Susi and D. M. Bylel; Methods Enzymol. 130, 290 (1986). 14. A. Dong, R Huang, and W. S. Caughey, Biochemistry 29, 3303
(1990). 15. J. L. R. Arrondo, A. Muga, J. Castresana, and E M. Goni, Prog.
Biophys. Molec. Biol. 59, 23 (1993). 16. W. K. Surewicz, H. H. Mantsch, and D. Chapman, Biochemistry
32, 389 (1993). 17. G. Fleissner, A. Hallbrucker, and E. Mayer, J. Phys. Chem. 97, 4806
(1993). 18. G. Fleissner, A. Hallbrucker, and E. Mayer, Chem. Phys. Lett. 218,
93 (1994). 19. G. Fleissner, A. Hallbrucker, and E. Mayer, J. Chem. Soc., Faraday
Trans. 92, 23 (1996). 20. G. Talsky, L. Mayring, and H. Kreuzer, Angew. Chemie 90, 840
(1978). 21. A. T. Giese and C. S. French, Appl. Spectrosc. 9, 78 (1955). 22. J. R. Morrey, Anal. Chem. 40, 905 (1968). 23. W. E Maddams and W. L. Mead, Spectrochim. Acta 38A, 437
(1982). 24. S. Hawkes, W. E Maddams, W. L. Mead, and M. J. Southon, Spec-
trochim. Acta 38A, 445 (1982). 25. W. E Maddams and M. J. Southon, Spectrochim. Acta 38A, 459
(1982). 26. E Holler, D. H. Burns, and J. B. Callis, Appl. Spectrosc. 43, 877
(1989). 27. A. M. Rzhevskii and R P. Mardilovich, Appl. Spectrosc. 48, 13
(1994). 28. H. Susi and D. M. Byler, Biochem. Biophys. Res. Commun. 115,
391 (1983). 29. D. J. Moffatt and H. H. Mantsch, Methods Enzymol. 210, 192
(1992). 30. W. K. Surewicz and H. H. Mantsch, Biochim. Biophys. Acta 952,
115 (1988). 31. P. I. Haris, D. C. Lee, and D. Chapman, Biochim. Biophys. Acta
874, 255 (1986). 32. H. H. Mantsch, H. L. Casal, and R. N. Jones, in Advances in Spec-
troscopy, R. J. H. Clark and R. H. Hester, Eds. (Wiley, New York, 1986), Vol. 13, Chap. 1, p. 1.
33. W.-J. Yang and P. R. Griffiths, Computer Enhanced Spectrosc. 1, 157 (1983).
34. I. Noda, A. E. Dowrey, and C. Marcott, Appl. Spectrosc. 42, 203 (1988).
35. I. Noda, Appl. Spectrosc. 44, 550 (1990).
1244 Volume 50, Number 10, 1996
36. C. Marcott, A. E. Dowrey, and I. Noda, Appl. Spectrosc. 47, 1324 (1993).
37. I. Noda, Appl. Spectrosc. 47, 1329 (1993). 38. A. Singhal and L. J. Fina, Appl. Spectrosc. 49, 1073 (1995). 39. G. Fleissner, Dissertation, Universit~t Innsbruck, Innsbruck (1995). 40. A. Savitzky and M. J. E. Golay, Anal. Chem. 36, 1627 (1964). 41. Users Guide (Galactic Industry Corporation, Salem, New Hamp-
shire, 1990), Curve Fit, Sect. 3, Chap. 2, p. 14. 42. Users Guide (Spectrum Squares Associates, Ithaca, New York,
1992), Data Fit, Maximum Likelihood Peak Fitting. 43. J. D. Riddell, D. J. Lockwood, and D. E. Irish, Can. J. Chem. 50,
2951 (1972).
44. W. E Murphy and H. J. Bernstein, J. Phys. Chem. 76, 1147 (1972). 45. D. J. Gardiner, R. E. Hester, and W. L. Grossman, J. Raman Spec-
trosc. 1, 87 (1973); idem, J. Chem. Phys. 59, 175 (1973). 46. G. Fleissner, A. Hallbrucker, and E. Mayer, J. Phys. Chem. 99, 8401
(1995). 47. J. M. Vandenbelt and C. Henrich, Appl. Spectrosc. 7, 153 (1953). 48. R R. Griffiths and J. A. de Haseth, Fourier Transform Infrared
Spectrometry (Wiley, New York, 1986), Chap. 3, p. 102. 49. D. E. Irish and M. H. Brooker, in Advances in Infrared and Raman
Spectroscopy, R. J. H. Clark and R. E. Hester, Eds. (Heyden, New York, 1976), Vol. 2, Chap. 6, p. 212.
50. E. J. Ambrose and A. Elliott, Proc. Royal Soc. London A208, 75 (1951).