Page 1
28TH
INTERNATIONAL CONGRESS OF THE AERONAUTICAL SCIENCES
1
Abstract
The development and validation of new methods
to simulate the crash response and energy
absorption of composite airframe structures are
described in this paper. The simulation methods
were developed and demonstrated on
representative crush element tests, then larger
sub-elements. Final validation, as reported in
this paper, was conducted using a structure
representative of a helicopter fuselage frame
complete with an energy absorbing sub-floor.
Scaled instrumented structures were tested
quasi-statically and dynamically. The numerical
model developed in PAM-CRASH was capable
of predicting the deformation modes and
provided excellent agreement with the steady
state crushing loads and energy absorption. The
ability to predict the dynamic response of a
composite frame section gives confidence that
numerical models can be used to design the next
generation of crashworthy helicopter structures
using 'virtual' crash tests resulting in lighter,
stronger, safer helicopters.
1 Introduction
The crashworthiness of advanced composite
materials in the aerospace industry has
generated considerable interest resulting from
the increased application in fuselage and other
structures. Well designed composite structures
absorb crash loads in a controlled and
progressive manner through crushing. By
tailoring the fibre type, matrix type, fibre-matrix
interface, fibre stacking sequence and fibre
orientation, composite crashworthy structures
have been shown to have outstanding energy
absorption performance characteristics [1-3].
Modern military helicopters now incorporate
light-weight composite energy absorbers in the
subfloor structures to meet crashworthiness
requirements.
Traditionally, crashworthy composite
structures have been designed using semi-
empirical techniques which rely heavily on a
large database of experimental test data.
Improved design methods are needed to offer
improved crashworthiness in the next generation
of aircraft. This has focused on the use of
explicit FE software commonly employed in the
crashworthy design of cars and other land
transport vehicles. The continual improvement
in computational power means that large and
complex crash problems can now be solved in a
practical period of time.
To predict the crushing characteristics of
composite structures, the physically observed
complex failure modes and the associated
energy absorption need to be accurately
represented. A solution is to model the energy
absorbing structure with a layered or stacked-
shell approach, successfully used recently by
several researchers [2-8]. The stacked-shell
approach has the capability of predicting the
splaying (or petalling) mode associated with the
controlled collapse of composite energy
absorbing structures. A deficiency in the
publicly available research efforts are the
limited range of structures that have been
analysed using the stacked-shell modelling
approach.
IMPROVED DESIGN METHODS FOR CRASHWORTHY COMPOSITE HELICOPTER STRUCTURES
Mathew Joosten*,**,***
, Matthew David****
, Christof Kindervater****
, Rodney Thomson*, **
*Cooperative Research Centre for Advanced Composite Structures, Fishermans Bend,
Victoria, Australia
** Advanced Composite Structures - Australia, Port Melbourne, Victoria, Australia
*** School of Mechanical and Manufacturing Engineering, University of New South
Wales, Sydney, Australia
**** Deutsches Zentrum für Luft- und Raumfahrt, Institute of Structures and Design,
Stuttgart, Germany
[email protected] ; [email protected]
Page 2
M JOOSTEN, M DAVID, C KINDERVATER, R THOMSON
2
In this paper, the outcomes of a
collaborative research project between the
Cooperative Research Centre for Advanced
Composite Structures (CRC-ACS) and the
German Aerospace Center (DLR) are reported.
The aim of the project was to develop improved
design methods and innovative designs of
crashworthy helicopter structures, validated
through experimental testing [9]. A building
block approach was adopted for this purpose
comprising of experimental tests ranging from
material characterisation through to large scale
crash testing [9]. This paper describes the
experimental methodology for large scale crash
testing, coupled with an analysis method
developed in the explicit finite element code
PAM-CRASH to predict the crush behaviour
and energy absorption.
2 Design of Energy Absorbing Composite
Structures
Composite structures can be designed to absorb
significant energy through crushing type
failures. However, poorly designed composite
structures can fail in a brittle global buckling
mode with little or no energy absorption. A
sudden catastrophic structural failure could
result in the transfer of large injurious
accelerations to the occupants, or worse, breach
the integrity of the cabin space.
Prevention of a brittle global buckling
mode is typically achieved through the
incorporation of a well designed triggering
mechanism. The function of the trigger is to
limit the peak load and ensure a progressive
crushing mode is achieved. A lower peak load
reduces the likelihood of the structure buckling.
There are several types of triggering
mechanisms including plug triggers, steeple
triggers, chamfered tips, saw tooth triggers, ply-
drops and offset ply-drops. A schematic
representation of several trigger configurations
is shown in Fig. 1.
Selection of a suitable trigger configuration
is dependent on the structural configuration.
Due to weight restrictions, helicopters do not
have a stand alone crashworthy structure.
Instead, the energy absorbing elements are
integrated into the load carrying structure. Of
the trigger mechanisms shown in Fig. 1, the
offset ply-drop trigger is most easily integrated
into structural elements and capable of carrying
the required loads. For this reason offset ply-
drop triggers are typically incorporated into
energy absorbing keel beams and frames. An
example of a corrugated beam with an offset
ply-drop trigger is shown in Fig. 2.
Fig. 1. Various trigger configurations
(left to right) chamfer, double chamfer, saw-
tooth, steeple, ply-drop and offset ply-drop [4]
Fig. 2. Example of a corrugated beam with an
offset ply-drop trigger [11]
3 Test Program
3.1 Overview
A test program based on the building block
approach was designed to evaluate crashworthy
composite structures and produce experimental
data to validate numerical design methods. The
width of the pyramid, shown in Fig. 3, relates to
the number of specimens tested and the height
relates to the structural complexity. The lower
level experimental tests produced design data
and allowables while the higher level tests
provided insight into the failure of structures of
increasing complexity.
Page 3
3
IMPROVED DESIGN METHODS FOR CRASHWORTHY COMPOSITE
HELICOPTER STRUCTURES
Full scale
Components
Elements
Coupons
Fig. 3. Building block approach [9]
Coupon tests were conducted to obtain
material constants that could be entered into the
numerical material models. Element level tests
were conducted to assess the crushing response
of various design parameters including
thickness, layup, loading rate and geometric
configuration. The experimental test data was
used to develop and validate FE models
described in Section 3 [1-5,9-11].
Component tests were used to assess the
performance of components that included the
additional complexity of structural interaction
and bonding. The component specimens were
representative of a portion of the energy
absorbing section of the Large Test Article
(LTA). Component testing allowed a robust
energy absorbing configuration to be matured
through an evolutionary test program, thereby
validating the structural configuration and the
trigger design. The final configuration consisted
to a corrugated web with a ply-drop trigger,
with the corrugated web sandwiched between
two C-sections. The flanges of the C-sections
were two plies thicker than the web and the
transition of thickness between the web and the
flange was a weak point that functioned as a
triggering mechanism. This configuration was
used to design the energy absorbing section of
the LTA.
3.2 Large Test Article (LTA)
The LTA is representative of the lower half of a
helicopter frame. The structure consists of three
main components:
- Semi-rigid upper frame (survival space)
- Sacrificial energy absorbing subfloor
- Skin
The overall dimensions of the LTA were
450 mm (height) x 700 mm (width) x 200 mm
(depth). A completed LTA is shown in Fig. 4. A
photograph of the energy absorbing section was
taken prior to final assembly of the LTA (right
hand image of Fig. 4). The detailed image
shows the detail of the corrugated core
sandwiched between the two 'C-sections' webs.
The LTA's were manufactured from a carbon
fibre epoxy woven pre-preg fabric, with the sub-
components bonded together. The skin was
mechanically fastened and bonded to the energy
absorbing structure and upper frame.
Fig. 4. LTA and detail view of EA section
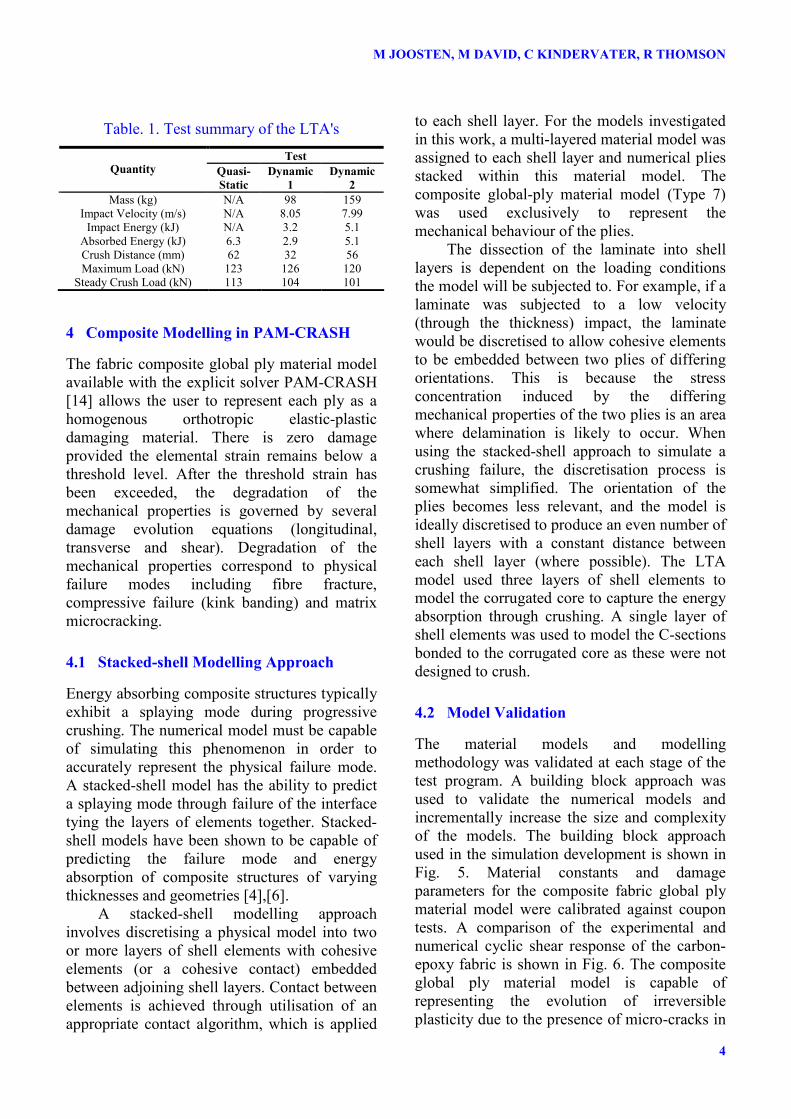
Three LTA's were evaluated and a
summary of the test conditions and
experimental results is shown in Table. 1. The
objective of the quasi-static test was to establish
the baseline performance of the structure to
estimate the crushing loads and energy
absorption. The dynamic tests successively
increased the impact energy equating to 50%
and 80% of the total energy absorbing capacity
of the sacrificial structure. Dynamic testing was
conducted with a vertical impact velocity of 8.0
m/s, in accordance with DEF STAN 00-970
[12] and MIL-STD-1290A [13].
Page 4
M JOOSTEN, M DAVID, C KINDERVATER, R THOMSON
4
Table. 1. Test summary of the LTA's
Test Quantity Quasi-
Static
Dynamic
1
Dynamic
2
Mass (kg) N/A 98 159
Impact Velocity (m/s) N/A 8.05 7.99
Impact Energy (kJ) N/A 3.2 5.1
Absorbed Energy (kJ) 6.3 2.9 5.1
Crush Distance (mm) 62 32 56
Maximum Load (kN) 123 126 120
Steady Crush Load (kN) 113 104 101
4 Composite Modelling in PAM-CRASH
The fabric composite global ply material model
available with the explicit solver PAM-CRASH
[14] allows the user to represent each ply as a
homogenous orthotropic elastic-plastic
damaging material. There is zero damage
provided the elemental strain remains below a
threshold level. After the threshold strain has
been exceeded, the degradation of the
mechanical properties is governed by several
damage evolution equations (longitudinal,
transverse and shear). Degradation of the
mechanical properties correspond to physical
failure modes including fibre fracture,
compressive failure (kink banding) and matrix
microcracking.
4.1 Stacked-shell Modelling Approach
Energy absorbing composite structures typically
exhibit a splaying mode during progressive
crushing. The numerical model must be capable
of simulating this phenomenon in order to
accurately represent the physical failure mode.
A stacked-shell model has the ability to predict
a splaying mode through failure of the interface
tying the layers of elements together. Stacked-
shell models have been shown to be capable of
predicting the failure mode and energy
absorption of composite structures of varying
thicknesses and geometries [4],[6].
A stacked-shell modelling approach
involves discretising a physical model into two
or more layers of shell elements with cohesive
elements (or a cohesive contact) embedded
between adjoining shell layers. Contact between
elements is achieved through utilisation of an
appropriate contact algorithm, which is applied
to each shell layer. For the models investigated
in this work, a multi-layered material model was
assigned to each shell layer and numerical plies
stacked within this material model. The
composite global-ply material model (Type 7)
was used exclusively to represent the
mechanical behaviour of the plies.
The dissection of the laminate into shell
layers is dependent on the loading conditions
the model will be subjected to. For example, if a
laminate was subjected to a low velocity
(through the thickness) impact, the laminate
would be discretised to allow cohesive elements
to be embedded between two plies of differing
orientations. This is because the stress
concentration induced by the differing
mechanical properties of the two plies is an area
where delamination is likely to occur. When
using the stacked-shell approach to simulate a
crushing failure, the discretisation process is
somewhat simplified. The orientation of the
plies becomes less relevant, and the model is
ideally discretised to produce an even number of
shell layers with a constant distance between
each shell layer (where possible). The LTA
model used three layers of shell elements to
model the corrugated core to capture the energy
absorption through crushing. A single layer of
shell elements was used to model the C-sections
bonded to the corrugated core as these were not
designed to crush.
4.2 Model Validation
The material models and modelling
methodology was validated at each stage of the
test program. A building block approach was
used to validate the numerical models and
incrementally increase the size and complexity
of the models. The building block approach
used in the simulation development is shown in
Fig. 5. Material constants and damage
parameters for the composite fabric global ply
material model were calibrated against coupon
tests. A comparison of the experimental and
numerical cyclic shear response of the carbon-
epoxy fabric is shown in Fig. 6. The composite
global ply material model is capable of
representing the evolution of irreversible
plasticity due to the presence of micro-cracks in
Page 5
5
IMPROVED DESIGN METHODS FOR CRASHWORTHY COMPOSITE
HELICOPTER STRUCTURES
the epoxy matrix. Upon unloading, the
numerical shear strain does not return to zero,
rather, the model retains a residual strain
corresponding to that measured in coupon
testing. The PAM-CRASH cohesive fracture
interface model material constants were derived
from the fracture toughness tests and validated
by simulation.
Fig. 5. Building block approach for simulation
validation
0
40
80
120
0 20000 40000 60000 80000
Strain (με)
Str
ess
(M
Pa
)
Experimental Data - Shear
PAM-CRASH - Shear
Fig. 6. Validation of the material model (cyclic-
shear response)
Once the composite global ply material
model and cohesive failure models were
validated, the crushing response of element
level structures was predicted. The element
level models consisted of multiple shell layers,
contact definitions, rigid walls, friction,
boundary conditions and element elimination
criterion. Parametric studies were performed to
identify a robust set of modelling parameters to
enable the models to predict the failure mode,
crushing loads and energy absorption of
structures of varying geometry and thickness. A
comparison of the experimental and numerical
crushing responses of hat-shaped crush elements
of varying thicknesses is shown in Fig. 7. The
numerical models were capable of predicting
the steady state crushing load over a range of
specimen thicknesses using an identical set of
material constants. Similar correlation was
achieved for different element geometries
showing that the modelling methodology can
accurately predict the crushing response of a
range of energy absorbers.
Fig. 7. Validation of the stacked-shell modelling
approach (element level specimens) [4]
4.3 Evolution of the Explicit FE LTA Model
The experimental test setup and FE model
of the LTA are shown in Fig. 8. The grey
arrows indicate the labelling convention for the
impact platform which includes three load cells
(Left, Middle and Right). The local coordinate
frame of the outer plies was aligned with the
direction of the strain gauge(s).
The configuration and boundary conditions
of the numerical model were identical to the
experimental test. A gravitational acceleration
field of 9.81 m/s2 and an initial velocity of 8.05
m/s were applied to the entire model.
The FE model shown in Fig. 8 has been
developed to better represent the transfer of
inertia during the crash simulation. Initially, a
half model of the LTA was created with
symmetrical boundary conditions applied to the
plane of symmetry, as previously reported [9].
The first iteration FE model did not include the
I-beam or the two-rail sled and the mass of these
Page 6
M JOOSTEN, M DAVID, C KINDERVATER, R THOMSON
6
structures was applied directly to the frame as a
lumped nodal mass.
To reflect the mass distribution, centre of
gravity and inertia of the entire system more
precisely, the I-beam and two-rail sled were
included in the revised FE model. The I-beam
(yellow) was fastened to the sled (grey, green
and blue) using point link (PLINK) elements
(black). Eight metallic brackets (light blue) were
used to secure the frame to the I-beam and were
connected using PLINK elements. The half
model was mirrored to create a full FE model.
There were several minor changes to the LTA
model following detailed analysis of the
numerical failure modes and experimental
observations from the high speed video:
- The mass was added to the upper sled to
reflect the test configuration (the increased
bending stiffness of the I-beam and two-rail
sled were effective in reducing any
significant flexural deformation of the I-
beam during the impact).
- The rivet tails between the C-sections and the
skin were meshed and included as rigid
bodies. The fastened connection between the
C-sections and the skin was modelled with
PLINK's as shown in Fig. 9. The rivet tails
were included in the simulation as they
prevented the webs splaying outwards during
crushing and contained the failed material. It
was important to capture this phenomenon in
the model as this containment role of the
webs contributed to the overall crushing
response as observed in the experimental
tests.
- The impact platform was split into three
sections, which allowed the contact force for
the left, middle and right contacts. The loads
obtained from these contacts were directly
compared to the experimental load cell data.
- Slight off-axis loading conditions (0.11° for
DY1 and 0.27° for DY2.) was included to
reflect the experimental impact conditions.
C-Section
Skin
Rivet Tail
(Rigid Body)
PLINK
Fig. 9. Detail view of rivet tail representation
These changes added detail to the model to
more accurately simulate the experimental
impact conditions and allow a more accurate
comparison between the experimental and
numerical results.
FM-L FM-M FM-R
Fig. 8. Comparison of the experimental test setup (left) and numerical model (right)
Page 7
7
IMPROVED DESIGN METHODS FOR CRASHWORTHY COMPOSITE
HELICOPTER STRUCTURES
5 LTA: Comparison of Experimental
Results and FE Predictions
The progressive failure of the FE model was
validated against experimental test data. The
accuracy of the model was assessed
qualitatively and quantitatively. The predicted
load-displacement response, failure behaviour
and strain response were compared. Overall the
FE model correlated very well with the
experimental test data.
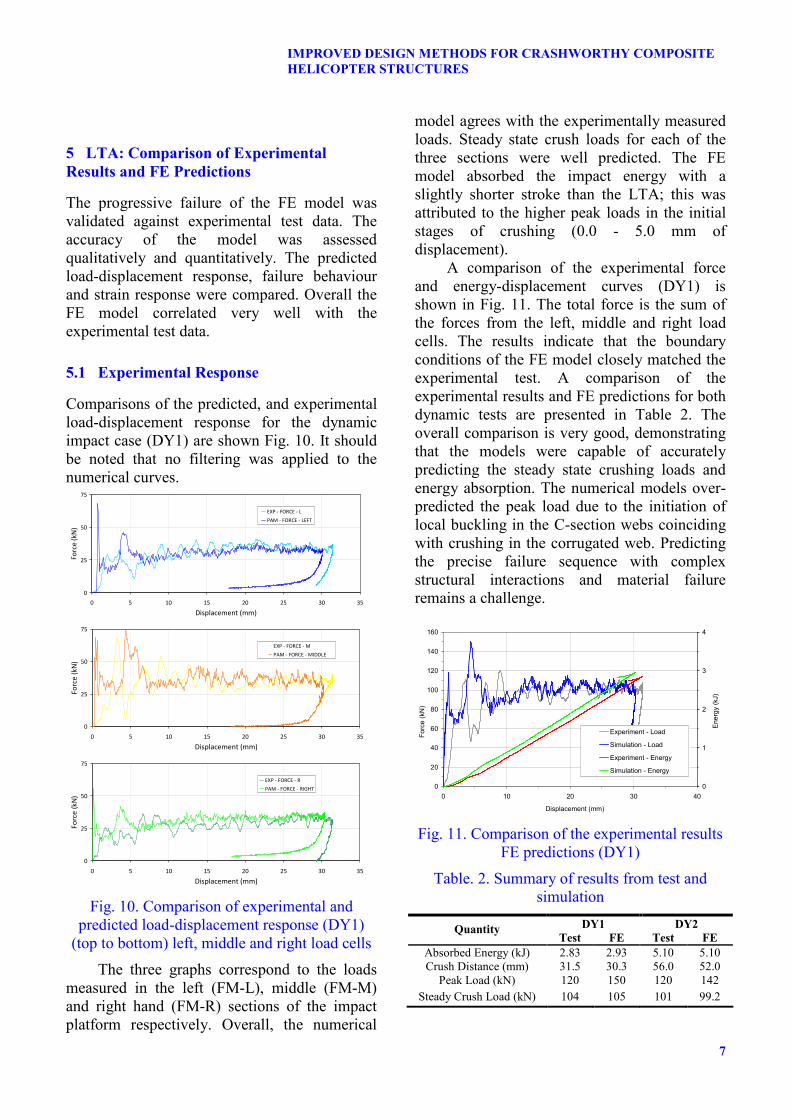
5.1 Experimental Response
Comparisons of the predicted, and experimental
load-displacement response for the dynamic
impact case (DY1) are shown Fig. 10. It should
be noted that no filtering was applied to the
numerical curves.
0
25
50
75
0 5 10 15 20 25 30 35
Displacement (mm)
Fo
rce
(k
N)
EXP - FORCE - L
PAM - FORCE - LEFT
0
25
50
75
0 5 10 15 20 25 30 35
Displacement (mm)
Fo
rce
(k
N)
EXP - FORCE - M
PAM - FORCE - MIDDLE
0
25
50
75
0 5 10 15 20 25 30 35
Displacement (mm)
Fo
rce
(k
N)
EXP - FORCE - R
PAM - FORCE - RIGHT
Fig. 10. Comparison of experimental and
predicted load-displacement response (DY1)
(top to bottom) left, middle and right load cells
The three graphs correspond to the loads
measured in the left (FM-L), middle (FM-M)
and right hand (FM-R) sections of the impact
platform respectively. Overall, the numerical
model agrees with the experimentally measured
loads. Steady state crush loads for each of the
three sections were well predicted. The FE
model absorbed the impact energy with a
slightly shorter stroke than the LTA; this was
attributed to the higher peak loads in the initial
stages of crushing (0.0 - 5.0 mm of
displacement).
A comparison of the experimental force
and energy-displacement curves (DY1) is
shown in Fig. 11. The total force is the sum of
the forces from the left, middle and right load
cells. The results indicate that the boundary
conditions of the FE model closely matched the
experimental test. A comparison of the
experimental results and FE predictions for both
dynamic tests are presented in Table 2. The
overall comparison is very good, demonstrating
that the models were capable of accurately
predicting the steady state crushing loads and
energy absorption. The numerical models over-
predicted the peak load due to the initiation of
local buckling in the C-section webs coinciding
with crushing in the corrugated web. Predicting
the precise failure sequence with complex
structural interactions and material failure
remains a challenge.
0
20
40
60
80
100
120
140
160
0 10 20 30 40
Displacement (mm)
Force (kN)
0
1
2
3
4
Energy (kJ)
Experiment - Load
Simulation - Load
Experiment - Energy
Simulation - Energy
Fig. 11. Comparison of the experimental results
FE predictions (DY1)
Table. 2. Summary of results from test and
simulation
DY1 DY2 Quantity Test FE Test FE
Absorbed Energy (kJ) 2.83 2.93 5.10 5.10
Crush Distance (mm) 31.5 30.3 56.0 52.0
Peak Load (kN) 120 150 120 142
Steady Crush Load (kN) 104 105 101 99.2
Page 8
M JOOSTEN, M DAVID, C KINDERVATER, R THOMSON
8
5.2 Failure Modes
5.2.1 Global Failure Comparison
Sequential images of the structural responses of
the LTA and the revised numerical model are
shown in Fig. 12. The energy absorbing
subfloor was observed to crush down
progressively. As this crushing process
continued, the skin portion was seen to buckle
outwards. Structural failure was only limited to
these portions of the LTA as desired for
occupant survivability. This failure response
was captured successfully in the numerical
model as seen in Fig. 13.
Fig. 12. Comparison of experimental and
predicted failure responses (DY1)
5.2.2 Comparison with HRCT-Scan Images
A detailed analysis of the failure mechanisms of
the LTA was achieved by comparing High
Resolution Computed Tomography (HRCT)
scans with the predictions from the FE
simulations. HRCT-scanning was performed
using a nanotom® CT system. The voxel
resolution employed in the scanning of the LTA
was 70 microns. Total time from the acquisition
phase to the reconstruction of the volumetric
data took approximately three hours. The
HRCT-scan enables the internal failure
mechanisms to be visualised non-destructively.
The integrity of the composite laminates,
bonded joints and fastened joints was
investigated using HRCT-scan images.
A comparison of the failure morphology of
the energy absorbing structure of DY1 is shown
in Fig. 13. The FE model exhibited damage in
the lower 35 mm of the energy absorbing
section where elements were highly damaged.
The FE model is capable of simulating damage
that progresses ahead of the crush front. The
remainder of the energy absorbing section
exhibited insignificant damage and no failure of
the adhesive interfaces was observed. The
failure modes and extent of damage in the FE
model showed excellent agreement with the
HRCT-scan images. It should be noted that the
HRCT-scan was conducted post-test, with the
mass removed from the LTA. The numerical
model of the LTA was returned to the
equilibrium position to facilitate comparison
with the HRCT-scan.
Fig. 13. Comparison of failure modes (DY1):
numerical model (top) and HRCT scan (bottom)
Page 9
9
IMPROVED DESIGN METHODS FOR CRASHWORTHY COMPOSITE
HELICOPTER STRUCTURES
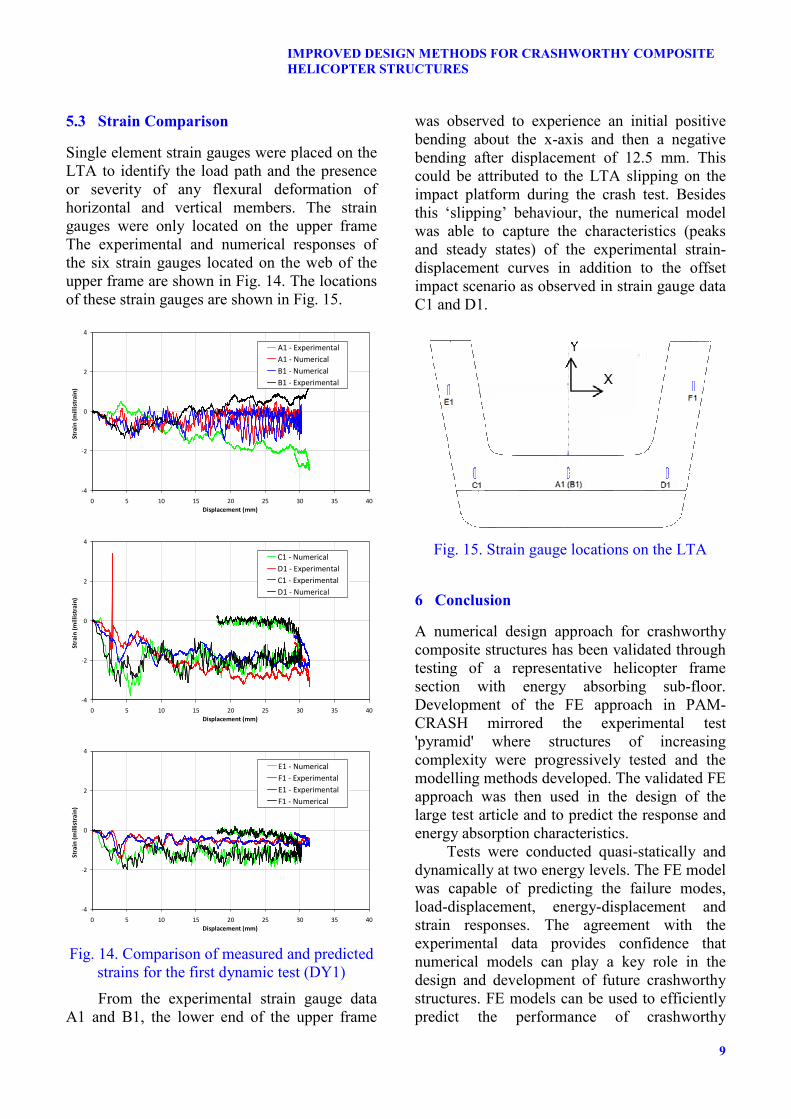
5.3 Strain Comparison
Single element strain gauges were placed on the
LTA to identify the load path and the presence
or severity of any flexural deformation of
horizontal and vertical members. The strain
gauges were only located on the upper frame
The experimental and numerical responses of
the six strain gauges located on the web of the
upper frame are shown in Fig. 14. The locations
of these strain gauges are shown in Fig. 15.
-4
-2
0
2
4
0 5 10 15 20 25 30 35 40
Displacement (mm)
Str
ain
(m
illi
stra
in)
A1 - Experimental
A1 - Numerical
B1 - Numerical
B1 - Experimental
-4
-2
0
2
4
0 5 10 15 20 25 30 35 40
Displacement (mm)
Str
ain
(m
illi
stra
in)
C1 - Numerical
D1 - Experimental
C1 - Experimental
D1 - Numerical
-4
-2
0
2
4
0 5 10 15 20 25 30 35 40
Displacement (mm)
Str
ain
(m
illi
stra
in)
E1 - Numerical
F1 - Experimental
E1 - Experimental
F1 - Numerical
Fig. 14. Comparison of measured and predicted
strains for the first dynamic test (DY1)
From the experimental strain gauge data
A1 and B1, the lower end of the upper frame
was observed to experience an initial positive
bending about the x-axis and then a negative
bending after displacement of 12.5 mm. This
could be attributed to the LTA slipping on the
impact platform during the crash test. Besides
this ‘slipping’ behaviour, the numerical model
was able to capture the characteristics (peaks
and steady states) of the experimental strain-
displacement curves in addition to the offset
impact scenario as observed in strain gauge data
C1 and D1.
Fig. 15. Strain gauge locations on the LTA
6 Conclusion
A numerical design approach for crashworthy
composite structures has been validated through
testing of a representative helicopter frame
section with energy absorbing sub-floor.
Development of the FE approach in PAM-
CRASH mirrored the experimental test
'pyramid' where structures of increasing
complexity were progressively tested and the
modelling methods developed. The validated FE
approach was then used in the design of the
large test article and to predict the response and
energy absorption characteristics.
Tests were conducted quasi-statically and
dynamically at two energy levels. The FE model
was capable of predicting the failure modes,
load-displacement, energy-displacement and
strain responses. The agreement with the
experimental data provides confidence that
numerical models can play a key role in the
design and development of future crashworthy
structures. FE models can be used to efficiently
predict the performance of crashworthy
Page 10
M JOOSTEN, M DAVID, C KINDERVATER, R THOMSON
10
composite structures and optimise the design to
maximise occupant safety. 'Virtual' crash testing
can be used to supplement experimental crash
testing allowing a wider range of crash
scenarios to be investigated.
Acknowledgements
This work was undertaken as part of a CRC-
ACS research program, established and
supported under the Australian Government’s
Cooperative Research Centres Program, in
collaboration with the German Aerospace
Center (DLR), Institute of Structures and
Design. The authors wish to acknowledge the
following contributions: CRC-ACS colleagues
Dr A. Gunnion, Dr B. Veldman, Mr G.
Seymour, Mr D. Holliday, Mr M. Marelli, Mr
V. Bui, Mr W. Hillier; UNSW colleagues Dr Z.
Mikulik, Ms L. Colbran, Prof. D. Kelly, Prof. S.
Dutton and Mr A. Jackson; Pacific ESI
colleagues, Mr D. McGuckin, Dr L. Mulcahy,
Mr A. Chhor and Mr B. Cartwright; and DLR
colleagues Dr A. Johnson, Mr H. Kraft and Mr
H. Abu El-Hija. Gratefully acknowledged is the
ongoing support of this work by ESI Group and
in particular Dr A. Kamoulakos and Dr T.
Kisielewicz.
References
[1] Jackson A., David M., Gunnion A., Kelly D., Dutton
S., Dynamic and quasi-static crush testing of closed
carbon-fibre/epoxy elements, Proc of the 27th
Congress of International Council of the
Aeronautical Sciences (ICAS 2010), Nice, France,
September 19–24, 2010.
[2] Joosten, MW., Dutton, S., Kelly, D., Thomson, R.,
Experimental and numerical investigation of the
crushing response of an open section composite
energy absorbing element, Composite Structures,
Vol. 93, Iss. 2, pp 682-689, 2010.
[3] Johnson, A., David, M., Failure mechanisms in
energy-absorbing composite structures, Philosophical
Magazine, Vol. 90, Iss. 31-32, pp. 4245-4261, 2010.
[4] Joosten M.W., Experimental and numerical
investigation of triggered composite energy
absorbing structures, PhD Thesis, University of New
South Wales, Sydney, 2011.
[5] Johnson, A. David, M., Failure mechanisms and
energy absorption in composite elements under axial
crush, Key Engineering Materials, Vol. 488-489, pp
638-641, 2012.
[6] Palanivelu S., Van Paepegem W., Degrieck J.,
Kakogiannis D., Van Ackeren J., Van Hemelrijck D.,
Wastiels J., Vantomme J., Parametric study of
crushing parameters and failure patterns of pultruded
composite tubes using cohesive elements and seam,
Part I: Central delamination and triggering modelling,
Polymer Testing, Vol. 29, Iss. 6, September 2010, pp
729-741, 2010.
[7] Palanivelu S., Van Paepegem W., Degrieck J.,
Kakogiannis D., Van Ackeren J., Van Hemelrijck D.,
Wastiels J., Vantomme J., Parametric study of
crushing parameters and failure patterns of pultruded
composite tubes using cohesive elements and seam:
Part II – Multiple delaminations and initial geometric
imperfections, Polymer Testing, Vol. 29, Iss. 7, pp
803-814, 2010.
[8] McGregor C., Vaziri R., Xiao X., Finite element
modelling of the progressive crushing of braided
composite tubes under axial impact, International
Journal of Impact Engineering, Vol. 37, Iss. 6, pp
662-672, 2010.
[9] Kindervater C., Thomson R., Johnson A., David M.,
Joosten M., Mikulik Z., Mulcahy L., Veldman S.,
Gunnion A., Jackson A., Dutton S., Validation of
crashworthiness simulation and design methods by
testing of a scaled composite helicopter frame
section, Proc of the AHS international 67th annual
forum and technology display, Virginia Beach,
Virginia, USA., May 3-5, 2011.
[10] Joosten MW., Dutton S., Kelly DW., Thomson RS.,
Evaluation of a predictive stacked-shell analysis
methodology for the analysis of energy absorbing
composite crush elements, Proc of the 14th European
Conference on Composite Materials (ECCM14),
Budapest, Hungary, June 7-10, 2010.
[11] Kohlgrüber, D., Improved simulation methodologies
to model the crash behavior of composite structures,
German Aerospace Center (DLR), Institute of
Structures and Design, 2002.
[12] DEF STAN 00-970, Design and airworthiness
requirements for service aircraft, UK Ministry of
Defence, 1999.
[13] MIL-STD-1290A Notice 2, Military standard - light
fixed and rotary-wing aircraft crash resistance,
United States Department of Defence, 2006.
[14] ESI, PAM-CRASH, Solver notes manual, 2009.
Copyright Statement
The authors confirm that they, and/or their company or
organization, hold copyright on all of the original material
included in this paper. The authors also confirm that they
have obtained permission, from the copyright holder of
any third party material included in this paper, to publish
it as part of their paper. The authors confirm that they
give permission, or have obtained permission from the
copyright holder of this paper, for the publication and
distribution of this paper as part of the ICAS2012
proceedings or as individual off-prints from the
proceedings.