73
Final project report December 2015 Improved grape and wine quality in a challenging environment: An eastern US model for sustainability and economic vitality

Final project report December 2015
Improved grape and wine quality in a challenging environment: An eastern US model for sustainability and economic vitality
2
Table of Contents
Participating institutions ......................................................................................................3
Background on project ....................................................................................................... 4
Executive summary ............................................................................................................ 5
Objective 1a ....................................................................................................................... 9
Objective 1b ..................................................................................................................... 17
Objective 2a ..................................................................................................................... 22
Objective 2b ..................................................................................................................... 36
Objective 3 ....................................................................................................................... 40
Objective 4 ....................................................................................................................... 43
Year 4 Survey summary ....................................................................................................48
Appendix A, Project timeline .......................................................................................... 55
Appendix B, Project personnel ........................................................................................ 56
Appendix C, Publications and presentations ................................................................... 58
3
Participating institutions
USDA / NIFA Specialty Crops Research Initiative
Award Number 2010-51181-21599
4
Background The eastern US wine industry (defined here as eastern seaboard states from New England to north Georgia and extending west to include Pennsylvania, Ohio, Kentucky and Tennessee) witnessed substantial growth and development between 1990 and 2010. The potential for further growth exists as per capita consumption of wine increases, consumers embrace locally produced foods, and agritourism flourishes; however, eastern US wines do not have a monopoly on wine sales. To sustain momentum, the eastern US wine industry must produce quality wines on a cost-competitive basis. Two recurring features of the East’s climate pose considerable challenges to the industry: variable, but often excessive growing season precipitation, and winter cold damage. Abundant soil moisture can translate to excessive vegetative vine growth with attendant increases in canopy management labor, fungal diseases, and decreased fruit and wine quality. Cold damage reduces crop, causes additional vineyard variability, and ultimately erodes profitability. We described these problems in our grant application (January 2010) and proposed applied research and extension solutions that have explicit, long-term goals of: more efficiently and precisely managing vine vegetative growth and vigor with the aim of
promoting increased grape and wine quality, reducing canopy management labor, and reducing the use of herbicide inputs and nitrogen losses from the vineyard;
reducing the occurrence of environmental stresses (including winter cold damage) through better cultivar and vineyard site matching tools;
reducing costs of grape production while improving grape and wine quality; refining wine-making techniques for the eastern US’s unique grape varieties providing learning resources for producers, workforce development, and consumers; establishing a reputation for consistent, high quality grape and wine production in the East
Our vision was the creation, refinement and industry adoption of uniquely eastern US grape and wine production practices that integrate sound viticulture and enology recommendations with key market drivers to achieve a robust and sustainable eastern US wine industry. To achieve this vision we proposed specific research and extension objectives that represented a synthesis of industry changes that our stakeholders desired in the short-term. Those objectives were: 1. Develop applied means of defining, measuring and achieving vine balance under the variable
environmental conditions of the eastern US. 2. Develop research-based recommendations for optimally matching grape cultivars with site-
specific environmental conditions. 3. Understand and capitalize on consumer attitudes towards eastern US wines through market
exploration of consumer perception/demand, willingness to pay, and assessment of product quality-assurance programs.
4. Implement a broad range of innovative learning resources to improve grape and wine quality, inform vineyard site evaluation, decrease production costs, train trainers and workforce labor, and ultimately improve the competitive basis of the eastern US wine industry.
This final project report provides a cumulative summation of our activities, outputs and outcomes from the project as of December 2015.
5
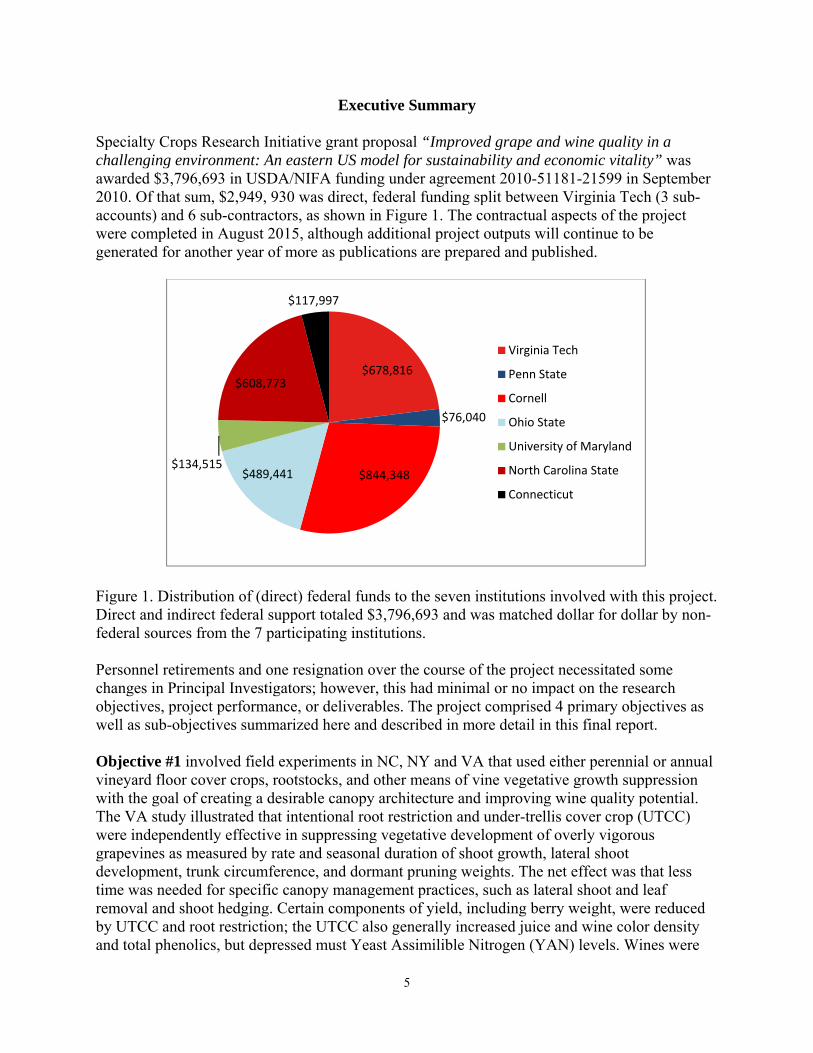
Executive Summary Specialty Crops Research Initiative grant proposal “Improved grape and wine quality in a challenging environment: An eastern US model for sustainability and economic vitality” was awarded $3,796,693 in USDA/NIFA funding under agreement 2010-51181-21599 in September 2010. Of that sum, $2,949, 930 was direct, federal funding split between Virginia Tech (3 sub-accounts) and 6 sub-contractors, as shown in Figure 1. The contractual aspects of the project were completed in August 2015, although additional project outputs will continue to be generated for another year of more as publications are prepared and published.
Figure 1. Distribution of (direct) federal funds to the seven institutions involved with this project. Direct and indirect federal support totaled $3,796,693 and was matched dollar for dollar by non-federal sources from the 7 participating institutions. Personnel retirements and one resignation over the course of the project necessitated some changes in Principal Investigators; however, this had minimal or no impact on the research objectives, project performance, or deliverables. The project comprised 4 primary objectives as well as sub-objectives summarized here and described in more detail in this final report. Objective #1 involved field experiments in NC, NY and VA that used either perennial or annual vineyard floor cover crops, rootstocks, and other means of vine vegetative growth suppression with the goal of creating a desirable canopy architecture and improving wine quality potential. The VA study illustrated that intentional root restriction and under-trellis cover crop (UTCC) were independently effective in suppressing vegetative development of overly vigorous grapevines as measured by rate and seasonal duration of shoot growth, lateral shoot development, trunk circumference, and dormant pruning weights. The net effect was that less time was needed for specific canopy management practices, such as lateral shoot and leaf removal and shoot hedging. Certain components of yield, including berry weight, were reduced by UTCC and root restriction; the UTCC also generally increased juice and wine color density and total phenolics, but depressed must Yeast Assimilible Nitrogen (YAN) levels. Wines were
$678,816
$76,040
$844,348$489,441$134,515
$608,773
$117,997
Virginia Tech
Penn State
Cornell
Ohio State
University of Maryland
North Carolina State
Connecticut

6
made from the various treatments and both preference tests and sensory descriptive analyses revealed modest but positive impacts of improved fruit exposure on finished wines. We have published one peer-reviewed article on this work, a second manuscript has been accepted, and a third paper is in preparation for submission in 2016. Our findings were also presented at industry as well as professional meetings. The comparable vine size management experiment in the Finger Lakes of New York had comparable viticultural and enological goals to the Virginia study, but was engineered to collect soil leachate to assess how vineyard floor management system affected the movement of nitrogen and applied agrochemicals through the soil profile. White clover ground cover was associated with a surprising, bi-modal release of nitrogen in late-winter and again in the autumn of one season, presumably from seasonal decomposition of the legume. Cover cropping in the Finger Lakes project was not as effective in regulating vine size as it was in the Virginia study, possibly due to the shorter seasonal period of competition afforded by the annual cover crops used in New York. The related North Carolina study generally showed a positive correlation between the width of the weed-free area under the trellis and the extent of grapevine vegetative growth, again illustrating some benefits are obtained by decreasing the width of the herbicide strip in terms of canopy management. Expected outcomes with all three experiments include a strategy for predictably managing both the extent and duration of vine vegetative growth, which will directly reduce canopy management labor and have the potential to improve fruit composition and wine quality. We expect to see less soil leaching of nutrients and herbicides with a more comprehensive use of either perennial or annual cover crops. Cover crops also compete with grapevines for essential nutrients, thereby requiring increased attention to the nutrient (especially nitrogen) management program. Separate studies in Virginia involving 2 different graduate students explored various forms, rates, and timings of nitrogen fertilization to grapevines in order to optimize vine nitrogen status and berry YAN in situations where cover crops are used over the entire vineyard floor. This part of the project is still in progress but we expect to refine an emerging strategy of using soil-applied nitrogen to sustain vine capacity (size and fruiting potential) and foliar-applied nitrogen near veraison to increase YAN and ensure rapid, complete alcoholic fermentations. Objective #1 also included field research to define and accurately measure the variability that exists in cluster exposure within grapevine canopies. The definition of variability is an important step towards minimizing that variability. This work demonstrated the potential to reduce required samples sizes by nearly 70% in a vineyard by sampling according to Normalized Difference Vegetation Index (NDVI) imagery, resulting in savings in labor and lab materials. Additional studies of objective 1, also replicated in NY and VA, sought to measure how cluster exposure in a given variety, such as Cabernet franc impacts certain secondary metabolites associated with aroma and other wine sensory attributes. The work in Virginia used Cabernet franc, Cabernet Sauvignon, and Petit Verdot and has shown that generally, the greater the exposure from fruit set through veraison, the greater the color and total phenolics in the juice from harvested grapes. The likelihood of over-heating fruit due to sunlight exposure is far less
7
likely in Virginia than it is in the documented cases of such temperature effects reported in California and central Washington states. A further line of investigation in NY explored means of regulating shoot vigor, again with the overall aim of improving vine “balance”. Increasing shoot number per vine effectively reduced individual shoot (cane) mass; however, canopy division, such as with Scott Henry or Lyre training, might be needed to properly expose all shoots on vines carrying higher shoot numbers. Additionally, shoot vigor has been found to be much more uniform with spur pruning than with cane pruning. These results illustrate several practical means of regulating vine size and vigor. Objective #2, like the first objective, involved several sub-objectives. We used two separate approaches to help match suitable grape varieties with specific vineyard sites in this objective. First, information from a national winegrape variety evaluation (NE-1020) was, and continues to be, reviewed with respect to viticulture performance and enological evaluation of resultant wines. The NE-1020 is a coordinated, national research project that uses uniform research protocols among member institutions to generate an extensive database of grape, grapevine, and wine data (http://www.nimss.org/projects/view/mrp/outline/4034). Provisional, local recommendations were made for novel, elite varieties emerging from those geographically diverse trials. While viticultural and enological performance has yet to be fully evaluated, the relative cold hardiness of some of the NE-1020 varieties has been tested in the lab and under 2013/14 winter field conditions, and has recently been published. An additional component of the variety evaluation explores means of altering tannin concentrations in finished wines with selected white and red grape varieties. A feature of many of the hybrid and American-type red wine varieties used in the eastern US is low tannin concentrations in wine. Conversely, some of the hybrid white cultivars (e.g., Traminette) common in the East, often exhibit somewhat bitter phenolic finishes. The second aim of Objective 2 was to develop a web-based Geographical Information System (GIS) tool that incorporates the variety performance data with climatic, topographic, and edaphic parameters to improve “site-cultivar” selection. The eastern US GIS tool was developed, launched and refined over the life of this project; the current version can be found here: http://www.cgit.vt.edu/vineyards.html. In practice, anyone with internet connectivity can evaluate the potential vineyard suitability of a parcel of land, and obtain general recommendations on varieties that would be expected to perform well at the site. We envision the tool being used as a high-resolution, first step in the vineyard site evaluation process. Objective #3: Perhaps some of the most important questions and problems for the eastern wine industry are those that relate to consumer perceptions of eastern US wines. Multifaceted research at Cornell University and at North Carolina State University explored consumers’ perceptions, motives to purchase, and satisfaction with eastern US wines. Research at Cornell revealed two strong patterns. First, drawing attention to AVAs for wines from emerging regions does not seem to impact consumers’ valuation of the wine, even among consumers that are relatively familiar with wine. However, efforts to highlight AVAs in emerging regions as part of a larger package of information may be a critical component of developing a long-term strategy for building
8
reputations of new wine appellations. Second, point-of-sales information that drew references to well-established regions in France resonated well with buyers, indicating that making such connections to famous wine regions might well be an effective marketing strategy for emerging wine regions, notably among consumers with greater familiarity with wine. A telephonic consumer survey of nearly 3,000 wine consumers was conducted in North Carolina, Virginia and New York in early 2013 under the direction of Charles Safley at North Carolina State University. Survey respondents were asked questions about the wine industry in their respective state, including how they first learned about any local wineries, why they visited the winery, and whether they purchased wines. The data are now being analyzed to develop consumer profiles, wine purchase patterns, prices paid for wine at various market outlets, and consumption habits. The final industry report will present and discuss the survey results, conclusions and recommendations for retailers to improve their market position or take advantage of current trends. Objective #4 was aimed at transforming the knowledge created by this project into commercially sustainable practices using a variety of educational resources. Extension workshops and short courses were the principal means of delivering research based information. These workshops allow for direct contact between investigators and growers/vintners as well as important networking opportunities for the industry. For example, project investigators worked with the Virginia Vineyard Association in 2012 to host a canopy management and vine balance workshop, in which over 140 growers participated. A series of 4 “research summits” was conducted in February 2014 in Virginia, North Carolina, Ohio and New York State. The summits highlighted research findings from this project, with each of the meetings tailored for the state's industries. Educational events for Cooperative Extension agents/educators were also provided. For example, Virginia Tech hosted 31 extension agents from the southeastern US in June 2013 for an in-service training workshop on grapevine canopy assessment and modification. And while the project was not intended to directly train a labor workforce for the wine industry, the project did deliver educational tools, including the online site suitability tool and enhancements to the Wine Grape Production Guide for Eastern North America (Wolf, 2008). A number of the project investigators were involved in the Grape Community of Practice which develops material for eXtension’s grape content: http://eviticulture.org/. The site has seen overwhelming traffic – as of 2014, the grapes component has had 522,770 visitors since going online with an average of two minutes and eight seconds spent per page. The following discussion provides more specific descriptions of each area of the project, as well as outputs and outcomes of some of the more substantive areas of activity. Objectives written in the present tense reflect the fact that some sub-objectives have continued into 2016 or beyond.

9
Objective #1a: Develop applied means of achieving vine balance under variable conditions Team Leader: Tony K. Wolf, Virginia Tech Virginia Experiment 1: Cover crops, rootstocks, and root restriction as means of optimizing vine balance Issue: Variable but often surplus precipitation during the growing season frequently contributes to excess vegetative growth of grapevines. The excessive vegetative growth exacerbates fungal diseases, and is associated with inferior wine quality due to fruit shading and overly vigorous grapevines that require increased canopy management labor. Conversely, drought, poor soil conditions, pest injury and occasionally other factors may constrain vine size. Optimal vine balance is achieved when the extent and duration of vegetative growth match the training/trellising system, crop level, and ultimate wine stylistic goals. The following experiments seek to regulate vine vegetative growth so as to more closely achieve well balanced vines that produce high quality fruit. Research Approach A field experiment was initiated in 2006 at Virginia Tech’s AHS Agricultural Research and Extension Center in Winchester, Virginia to examine techniques that may restrict vegetative development of vines. The experiment uses Cabernet Sauvignon (clone #337), which exhibits a high degree of inherent vigor. The experiment comparisons are (a) complete vineyard floor cover crop compared with (b) a conventional scheme of row-middle only grass combined with an 85-cm under-trellis weed-free (herbicide) strip. Within these main plots three rootstocks are compared as sub-plots: 101-14, 420-A, and riparia Gloire. The rootstock plots are further divided into three sub-sub plots that compare (a) the use of root-restriction bags (RBG); (b) the use of head-training and cane pruning; and (c) no root manipulation (NRM). The root restriction treatment was imposed by planting the vines at standard soil depth within root-restrictive fabric bags of approximately 0.16 m3 volume. The head-training and cane pruning treatment reduces the volume of perennial wood (carbohydrate reserves) maintained on the vine, compared to cordon-training and spur-pruning used with all other treatments. Drip irrigation (0.6 gal/hr in-line emitters at 1-foot intervals) was installed with separate systems for the more frequently watered RBG vines only, or for the entire set of treatments as needed. The vision for this experiment was to pursue a series of questions over a multi-year period, as: Can vegetative growth (and vigor) of vines be predictably regulated? If so, does the modification of vine growth have an impact on resultant wines? How would moisture availability alter the vines’ response to treatment? Do treatments have impacts on vine longevity, nutrition, or pest resistance?
Results After the initial years of this project (2008 and 2009), we reported that both the UTCC and RBG treatments could reduce shoot growth rate, vine canopy development and cane pruning weights (Hatch et al. 2011), as well as contribute to differences in wine quality potential, including color density (Hickey and Wolf, 2013). Subsequent research conducted during the 2010 and 2011 seasons, led by graduate student Cain Hickey, focused on the impact of vine water status on fruit yield components and wine quality
10
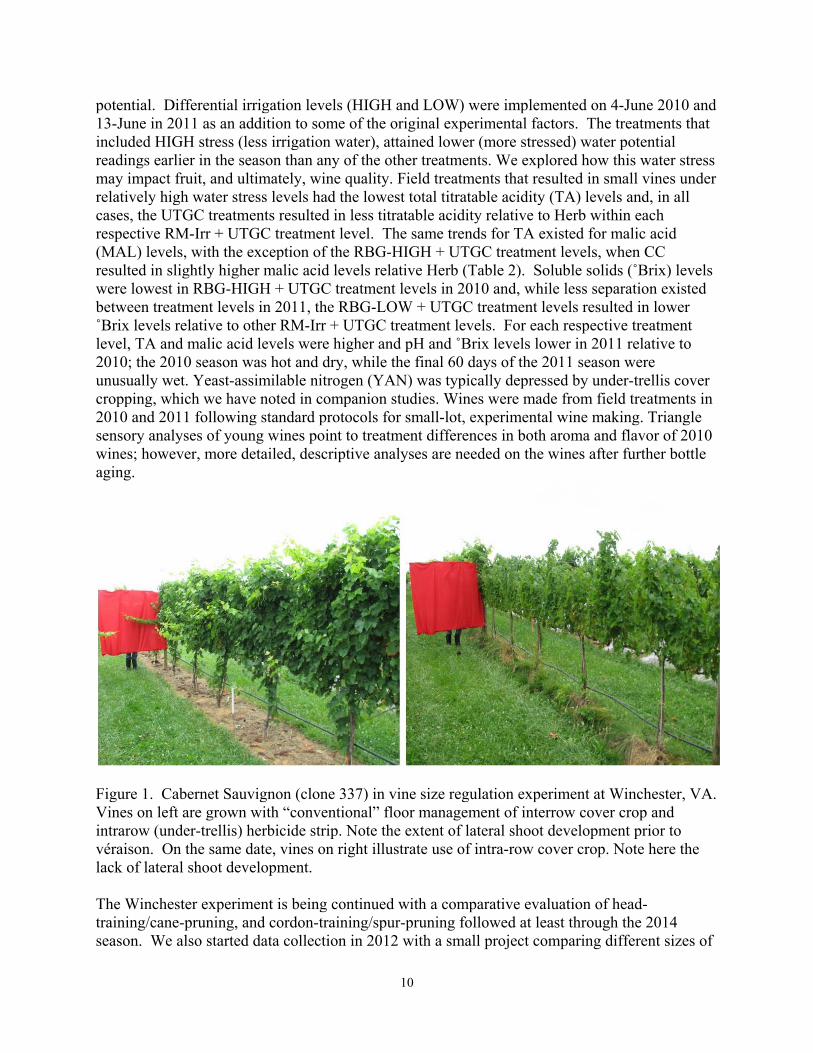
potential. Differential irrigation levels (HIGH and LOW) were implemented on 4-June 2010 and 13-June in 2011 as an addition to some of the original experimental factors. The treatments that included HIGH stress (less irrigation water), attained lower (more stressed) water potential readings earlier in the season than any of the other treatments. We explored how this water stress may impact fruit, and ultimately, wine quality. Field treatments that resulted in small vines under relatively high water stress levels had the lowest total titratable acidity (TA) levels and, in all cases, the UTGC treatments resulted in less titratable acidity relative to Herb within each respective RM-Irr + UTGC treatment level. The same trends for TA existed for malic acid (MAL) levels, with the exception of the RBG-HIGH + UTGC treatment levels, when CC resulted in slightly higher malic acid levels relative Herb (Table 2). Soluble solids (˚Brix) levels were lowest in RBG-HIGH + UTGC treatment levels in 2010 and, while less separation existed between treatment levels in 2011, the RBG-LOW + UTGC treatment levels resulted in lower ˚Brix levels relative to other RM-Irr + UTGC treatment levels. For each respective treatment level, TA and malic acid levels were higher and pH and ˚Brix levels lower in 2011 relative to 2010; the 2010 season was hot and dry, while the final 60 days of the 2011 season were unusually wet. Yeast-assimilable nitrogen (YAN) was typically depressed by under-trellis cover cropping, which we have noted in companion studies. Wines were made from field treatments in 2010 and 2011 following standard protocols for small-lot, experimental wine making. Triangle sensory analyses of young wines point to treatment differences in both aroma and flavor of 2010 wines; however, more detailed, descriptive analyses are needed on the wines after further bottle aging.
Figure 1. Cabernet Sauvignon (clone 337) in vine size regulation experiment at Winchester, VA. Vines on left are grown with “conventional” floor management of interrow cover crop and intrarow (under-trellis) herbicide strip. Note the extent of lateral shoot development prior to véraison. On the same date, vines on right illustrate use of intra-row cover crop. Note here the lack of lateral shoot development. The Winchester experiment is being continued with a comparative evaluation of head-training/cane-pruning, and cordon-training/spur-pruning followed at least through the 2014 season. We also started data collection in 2012 with a small project comparing different sizes of

11
root-restriction bags in an effort to optimize the vine size response to this form of vegetative growth restriction. We plan to analyze the material and establishment costs of root restriction with root bags to determine whether annual savings in dormant pruning and summer canopy management offset the establishment costs of root restriction. Publications and presentations on this effort: Virginia Experiment 2: Efficient nitrogen fertilizer use in vineyards with under-trellis cover crops DeAnna D’Attilio, James Russel Moss and Tony Wolf Issue: Vineyards have turned towards intensive cover cropping as a method to battle excessive vine vigor, reduce soil erosion on steeper slopes, and reduce the need for herbicides. In many situations cover crop establishment has resulted in competition for soil nitrogen and consequently diminished vine nitrogen status and reduced YAN levels in must. This project seeks to determine optimal rates, materials, and timing of annual nitrogen fertilization applications in fully cover-cropped vineyards. Our goal is to recommend a balanced fertilization approach in which growers can capitalize on the known benefits of cover-cropping while also avoiding fertilization practices that contribute to excess cover-crop growth, and the adverse outcome of over-competition for nitrogen. Research approach: This study, initiated in 2011, explores nitrogen fertilization applications at three commercial vineyard sites that have experienced perennial problems of low nitrogen status in the vines and in the grape must. Wine grape varieties include: seven-year-old Petit Manseng, thirteen-year-old Sauvignon Blanc, and ten-year-old Merlot vines. All research plots contain under-trellis cover crops, except in herbicide strip control panels. Progress: This part of the project involved two graduate students, DeAnna D’Attilio (MSc, 2014) and James Russell Moss (dual MSc degrees in horticulture and in food science and technology, anticipated, May 2016). Field experiments were conducted at 3 vineyards in 2011-2013 (D’Attilio) and between 2014-2015 (Moss). Treatments and research plant material varied from experiment to experiment; however, the basic questions addressed related to timing and mode (soil vs. foliar application) of nitrogen fertilization, and what impact nitrogen had on fruit chemistry, including berry juice amino acid profile, and on vine capacity (pruning weights, crop yield components and other measures of vine performance). A short synopsis of the most recent findings follows on the next page as a handout prepared for an industry meeting in January 2016:
12
Evaluation of nitrogen management schemes for intensively cover cropped vineyards
Russell Moss, Sihui Ma, Amanda Stewart, Tony Wolf Introduction
Viticulture in the Eastern U.S. is characterized by excessive vine vigor. Growers have employed cover cropping as a means to counteract some of this growth. Cover cropping has led to issues with nutrient management, namely nitrogen. Many vines are deficient in nitrogen (N) and the fruit from these vines produces musts with low concentrations of yeast assimilable nitrogen (YAN). Low YAN musts are associated with stuck/sluggish fermentation, hydrogen sulfide production, increased volatile acidity and less aromatic intensity in the resulting wine. The purpose of the research was to determine an optimal method to supply the vine with adequate N, while also increasing berry YAN.
Yields Both foilar urea and soil applied N increased total grape yields in the 4th and 5th year of a long-term trial. Soil applied N increased total yields by an average of 28% from the control, whereas foliar applied N increased yields by 14%. N fertilization improved fruit set and increased berry weight. Soil N fertilization provided the best return on investment in relation to crop yield. However, soil N fertilization should be viewed as a medium term investment, as one may not reap the rewards in the first few seasons of N fertilization.
Vine vigor Canopy architecture was not adversly affected by N fertilization in managed vineyards. Soil applied nitrogen lowered the fruit to pruning weight ratio after long term application (starting in year 4). This suggests that the vine accumulates and stores more carbohydrates over winter when N is applied to the soil.
Yeast Assimilable Nitrogen & Amino Acids In most years, soil applied N had very little impact upon total YAN concentrations. Foliar applied N, on average, increased YAN concentrations by 68.4%. Both the organic and inorganic components of YAN increased on average by 75% and 91% respectively. Of the 4 vineyard sites evaluated from 2014-2015, the ammionium:primary amino nitrogen ratio was significantly increased in 2 experiments in 2015. In general, the ratio of inorganic to organic YAN sources was not altered by foliar urea applications. Total amino acid content increased significantly among foliar N applications in most years. Arginine, Threonine, Tyrosine and Serine, on average across all experiments and years, more than doubled in concentration when urea was applied to the foliage. Glutamine showed the most dramatic increase in concentration, averaging a 314% increase among foliar N treatments across all experiments and years. By improving juice N status, as well as increasing amino acid content, foliar urea applications have the potential to improve fermentation kinetics and wine aroma.
Take home message
Publications and presentations on this effort:
If N is deficient, soil applied N (at bloom) has potential to improve yields and vine N tissue N content after several years of application. Soil applied N can increase vine carbohydrate status without adversly affecting the fruit zone light environment. Foliar urea applications (at veraison) can significantly improve juice YAN, thereby positively impacting fermentative kinetics and wine aroma.
13
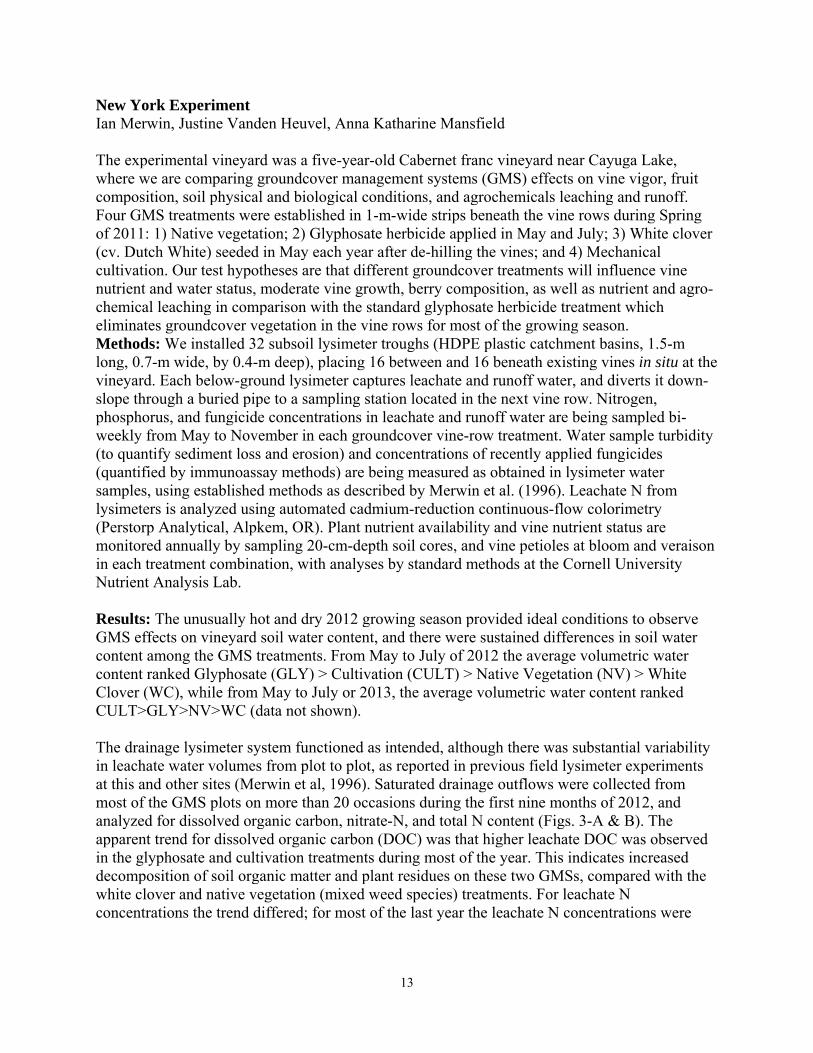
New York Experiment Ian Merwin, Justine Vanden Heuvel, Anna Katharine Mansfield The experimental vineyard was a five-year-old Cabernet franc vineyard near Cayuga Lake, where we are comparing groundcover management systems (GMS) effects on vine vigor, fruit composition, soil physical and biological conditions, and agrochemicals leaching and runoff. Four GMS treatments were established in 1-m-wide strips beneath the vine rows during Spring of 2011: 1) Native vegetation; 2) Glyphosate herbicide applied in May and July; 3) White clover (cv. Dutch White) seeded in May each year after de-hilling the vines; and 4) Mechanical cultivation. Our test hypotheses are that different groundcover treatments will influence vine nutrient and water status, moderate vine growth, berry composition, as well as nutrient and agro-chemical leaching in comparison with the standard glyphosate herbicide treatment which eliminates groundcover vegetation in the vine rows for most of the growing season. Methods: We installed 32 subsoil lysimeter troughs (HDPE plastic catchment basins, 1.5-m long, 0.7-m wide, by 0.4-m deep), placing 16 between and 16 beneath existing vines in situ at the vineyard. Each below-ground lysimeter captures leachate and runoff water, and diverts it down-slope through a buried pipe to a sampling station located in the next vine row. Nitrogen, phosphorus, and fungicide concentrations in leachate and runoff water are being sampled bi-weekly from May to November in each groundcover vine-row treatment. Water sample turbidity (to quantify sediment loss and erosion) and concentrations of recently applied fungicides (quantified by immunoassay methods) are being measured as obtained in lysimeter water samples, using established methods as described by Merwin et al. (1996). Leachate N from lysimeters is analyzed using automated cadmium-reduction continuous-flow colorimetry (Perstorp Analytical, Alpkem, OR). Plant nutrient availability and vine nutrient status are monitored annually by sampling 20-cm-depth soil cores, and vine petioles at bloom and veraison in each treatment combination, with analyses by standard methods at the Cornell University Nutrient Analysis Lab. Results: The unusually hot and dry 2012 growing season provided ideal conditions to observe GMS effects on vineyard soil water content, and there were sustained differences in soil water content among the GMS treatments. From May to July of 2012 the average volumetric water content ranked Glyphosate (GLY) > Cultivation (CULT) > Native Vegetation (NV) > White Clover (WC), while from May to July or 2013, the average volumetric water content ranked CULT>GLY>NV>WC (data not shown). The drainage lysimeter system functioned as intended, although there was substantial variability in leachate water volumes from plot to plot, as reported in previous field lysimeter experiments at this and other sites (Merwin et al, 1996). Saturated drainage outflows were collected from most of the GMS plots on more than 20 occasions during the first nine months of 2012, and analyzed for dissolved organic carbon, nitrate-N, and total N content (Figs. 3-A & B). The apparent trend for dissolved organic carbon (DOC) was that higher leachate DOC was observed in the glyphosate and cultivation treatments during most of the year. This indicates increased decomposition of soil organic matter and plant residues on these two GMSs, compared with the white clover and native vegetation (mixed weed species) treatments. For leachate N concentrations the trend differed; for most of the last year the leachate N concentrations were
14
greater in outflows from the white clover plots compared with the other three GMSs (Fig. 3-B), presumably indicating N release from root nodules and decomposition of this legume cover crop. A subset of the leachate water samples was frozen and archived for subsequent analyses of pesticide residues—specifically the neonicitinoid class of insecticides, that were applied at this vineyard for pest control during mid-summer in 2012. GLY and NV had the highest proportion of plots containing detectable amounts of imidacloprid in leachate (Fig. 4), while CULT had the lowest. Yield per vine differed among GMSs in 2012, with vines in the GLY treatment producing approximately 2 kg/vine more fruit than other treatments (more clusters and more berries per cluster). Fruit composition did not differ among treatments. We collected a great deal of data on soil characteristics (porosity, bulk density, penetration resistance, saturated infiltration rate, saturated hydraulic conductivity, soil respiration rate, and soil nutrient status, but found only few differences among treatments in 2011 and 2012. Figures 3-A and B. Leachate concentrations of dissolved organic carbon (Fig. 3A), and total nitrogen content (Fig. 3B), observed for between-vine drainage lysimeter samples under four GMSs during the 2012 growing season. Legend: WC = white clover cover crop, GLY = glyphosate herbicide, NV= native vegetation, CULT = cultivation.
‐20
0
20
40
60
80
100
9/14/11 12/23/11 4/1/12 7/10/12 10/18/12 1/26/13 5/6/13 8/14/13
Tot
al N
itrog
en (
mg
N/l)
in
leac
hate
wat
er
Fig. 3B: Total N in drainage leachate water (+/‐ SD bars)
CULT
GLY
NV
WC

15
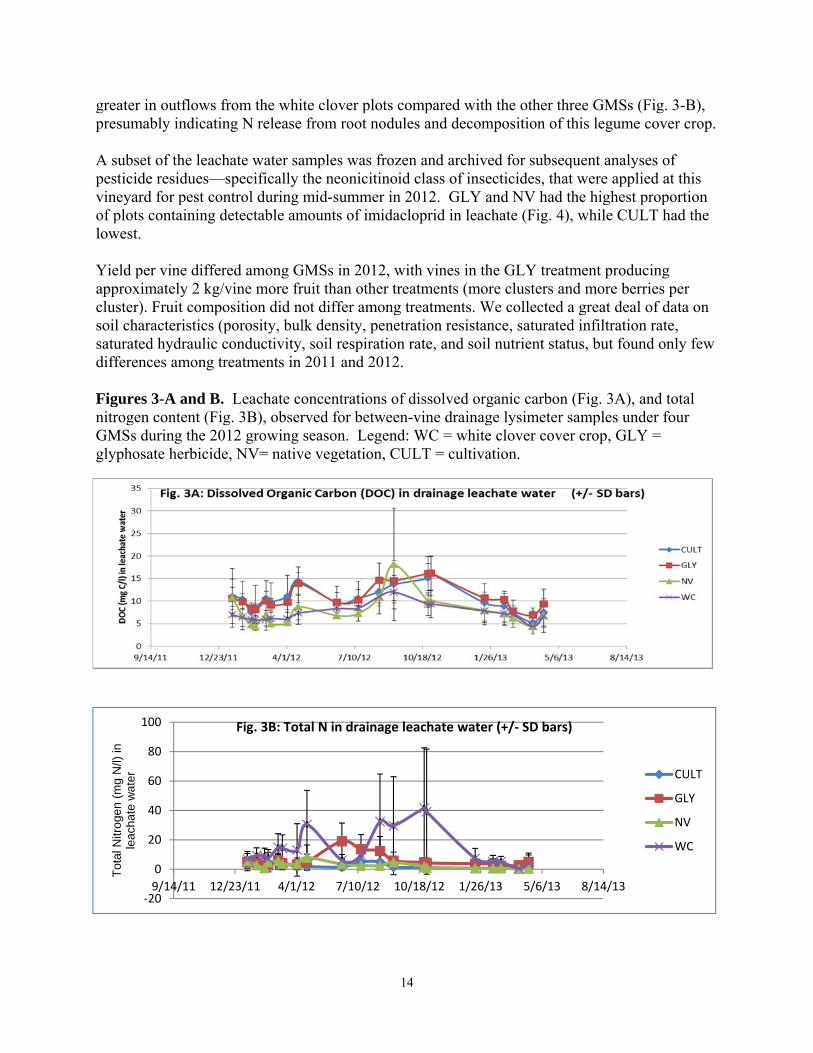
Publications and presentations on this effort: North Carolina Experiment Team members: Nicholas T. Basinger (graduate student), Katherine M. Jennings, David W. Monks, Wayne E. Mitchem, and Sara E. Spayd Issue: Preliminary research in North Carolina has demonstrated that weed competition and herbicide strip width can influence grape vine growth and yield. However, NC growers are concerned about alternate hosts for Pierce's Disease within the vineyard, so this potential threat needs to be evaluated in the context of vineyard floor management as a means of achieving a desirable vine balance. Methods: The objectives of this study were to determine the optimal under-vine vegetation-free strip width and the effect of late season weed competition on vine growth, berry composition, and yield of Vitis vinifera L. cv. Cabernet Franc cl. 312 on 101-14 MGT rootstock. . To meet these objectives, a study was conducted at a commercial vineyard in the Yadkin Valley region of North Carolina from 2011 to 2014. The vineyard floor was sown to Kentucky 31 fescue after grape harvest in 2010. In Spring 2011, vegetation-free strip widths (VFSW) of 0, 30, 60, 120 and 240 cm were established beneath the vines using herbicides and maintained continuously all four years. At veraison, herbicide application in half of each plot ceased and native vegetation was allowed to establish. Results/major findings: Late season weeds were non-competitive with grapevines, and did not affect grapevine vegetative growth, yield, or berry components relative to the weed-free sub-plots 2011 to 2014. Cane pruning weights decreased as VFSW decreased in all four years. Lateral shoot number decreased as VFSW decreased in 2012 and 2013. Yield and shoot number increased as VFSW increased in 2011and 2014. Cluster weight and berries/cluster were lowest in narrow VFSW across all four year. Brix increased with decreasing VFSW and titratable acidity decreased as VFSW decreased when combined across years.
16

17
Conclusions: The narrowest (≤60 cm) weed-free in-row strip reduced vegetative growth and had a slight but positive impact on berry composition. Publications and presentations on this effort: Summary comments for Objective #1a: Objective #1a comprised field experiments in NC, NY and VA that were designed to evaluate practical means of creating a more favorable vine balance of vegetative growth and quality fruit production. The research explored the use of vineyard floor cover crops, rootstocks, and other means of vine vegetative growth suppression. Expected outcomes include a strategy for predictably managing both the extent and duration of vine vegetative growth, which will directly reduce canopy management labor and have the potential to improve fruit composition and wine quality. We expect to see less soil leaching of nutrients and herbicides with a more comprehensive use of either perennial or annual cover crops. Cover crops also compete with grapevines for essential nutrients, thereby requiring an increased nutrient management program. The research in Virginia explored various forms, rates, and timings of nitrogen application to grapevines in order to optimize vine N status and berry YAN. The direct benefits of this research include practical measures to create a more optimal vine balance and canopy architecture which reduces the need for canopy management labor and reduces the potential for soil erosion on steep vineyard slopes. The expected indirect benefits include reduced fungal disease pressure, increased fruit and wine quality attributes, and possibly improved soil quality. The cost of using cover crops more extensively will include a more intensive monitoring of vine water status over the growing season, the potential need for irrigation to supplement vine water needs during drought, and the need to adjust fertilization practices to minimize the nutrient competition of living ground covers. Objective #1b: Develop canopy and crop management metrics to achieve consistent vine balance and canopy microclimate Issue: Research intended to improve grape quality generally tests treatment effects on fruit composition, but results are often confounded by variability in canopy density, cluster shading, or crop load. In addition, descriptions of canopy characteristics and crop load often lack the quantitative precision needed for unambiguous interpretation. We propose to develop and apply additional quantitative methods for the description of canopy structure, light/temperature microclimate, and crop load to both standardize our research approach, and also to produce tools that growers can use in their vineyards to optimize canopy and crop management.
Experiment 1: Canopy description and development of tools for determining canopy metrics Team Leader: Dr. Justine Vanden Heuvel, Cornell University We recently developed a set of grower tools for use in determining descriptive canopy metrics and defining appropriate canopy architecture (Meyers and Vanden Heuvel, 2008). These tools, which easily determine the cluster and leaf exposure levels, have demonstrated that small differences in fruit exposure can impact fruit chemistry (Meyers et al., 2009). In years 1 and 2 of

18
this study, additional field measurement and analysis tools were developed to improve grower decision-making through a focus on four guiding principles: precision, efficiency, utility, and operational priority. Building upon Enhanced Point Quadrat Analysis (EPQA) and Exposure Mapping (EM) (Meyers & Vanden Heuvel, 2008), these new tools will expand canopy field measurements beyond the fruiting zone to better quantify light and temperature environments within whole vines. Expanded statistical analysis functionality will quantify both block-level and canopy-level variability with a minimal number of field measurements, through the use of spatially explicit sampling protocols and computational models that can be tuned for each grower’s vineyard based on EPQA results. These protocols will guide growers/winemakers in selecting clusters that best represent variability within their vineyards, and instruct them on the potential consequences of measured vine variability on fruit quality and wine flavor/aroma profiles.
Summary of research accomplishments
Modeling and tools: A new approach for establishing canopy metrics was published (Meyers et al. AJEV 63:1) that helps growers to find optimal quantitative canopy architecture targets that balance competing production objectives. This was developed as a general model which will utilize response curves arising from Experiment 2 to determine specific canopy targets.
A cluster temperature model, designed to estimate hourly berry temperature by deriving cluster conditions from local weather data and vineyard conditions, as described by Cola, et al. (Agricultural and Forest Meteorology, 149) has been partially implemented as an Excel spreadsheet and is being tested against 2012 season temperature data, as well as berry temperature data gather by PhD graduate student Cain Hickey in Virginia. This study is still in progress but should be completed by May 2016
Publications and presentations on this effort: Experiment 2: Impacts of light and temperature variation in canopies on specific flavor/aroma compounds in Cabernet franc across different geographic regions Research Approach: Field experiments with Cabernet franc in NY, VA and NC were initiated in 2012 to evaluate the impact of vineyard macroclimate and vine microclimate on fruit composition and wine quality attributes. Experimental units of each cultivar were selected based on measured natural variation in cluster exposure to ensure a broad range of exposures. Canopy architecture will be quantified using EPQA (Meyers and Vanden Heuvel, 2008) with ceptometer readings at berry set and véraison. Spatial and temporal variability in berry temperature was estimated through a simulation model (Cola et al., 2009), which was validated using data from temperature monitoring in clusters of east and west exposure and in the shaded interior in the differing climates of NY and NC. Our model will be adapted to integrate both EPQA-measured canopy variability and local weather information. At harvest, fruit from varying exposure treatments in the NY study was separately pressed, and light and temperature response curves will be generated using Cabernet franc/Cabernet sauvignon must for isobutylmethoxypyrazine

19
(green bell pepper aroma), catechin and epicatechin (bitterness, astringency), quercetin and myricetin (bitterness, astringency, color stabilization), anthocyanins (color), and B-damascenone (amplifies fruit aromas) using either UV-vis HPLC or GCxGC-TOF-MS where appropriate. We had originally proposed that response curves would be compared across regions (NY, NC, VA) to determine the impact of local climate and vineyard conditions on juice flavor and aroma profiles; however, due to variations in methodology and instrumentation, we chose not to make gross comparisons of wines made in each of the three regions. Progress (New York experiment used as example): In 2011 a canopy assessment protocol was defined for quantifying cluster exposure via point quadrat measurements and ceptometer readings. In 2012 four treatments were defined for influencing cluster exposure: 1) Control, laterals removed from first five nodes; 2) Severity 1, laterals removed from nodes 0-5, leaves removed from nodes 0-2; 3) Severity 2, laterals removed from nodes 0-5, leaves removed from nodes 0-3; 4) Severity 3, laterals removed from nodes 0-5, leaves removed from nodes 0-5. Specific protocols were defined in 2012 for harvest, destemming, crushing, stabilizing, macerating harvested fruit, and for quantifying phenolics in must including anthocyanins, hydroxycinnamtes, flavonols, tannins, and polymeric color. Macerating juice was sampled at five time points (3, 24, 48, 72, and 120 hours) in 2012. Results: Preliminary analyses of the New York 2012 response data showed that leaf pulling treatments were effective in altering canopy architecture, measured by enhanced point quadrat analysis (EPQA). Treatments resulted in the intended statistically significant effect on cluster exposure metrics without affecting yield components. Treatments resulted in significant responses of Brix, pH, TA, malic acid. Maceration timing treatments were effective in establishing a range of response in phenolic concentrations. A preliminary analysis of quantitative light responses (linear fitting at R2 > 0.5) suggests that combined quantitative responses to cluster exposure flux availability (CEFA) found that responses to cluster exposure were generally strongest in the 48-hour maceration timing. The 48-hour maceration timing indicated positive responses of total flavonols to CEFA at fruit set and véraison, and polymeric color to CEFA fruit set and véraison. A negative y-intercept for polymeric color response at fruit set suggests that a non-linear model may be justified, pending further analysis. 48 hour maceration timing indicated a negative response of fructose to CEFA (R2 = 0.5). Study 2 (North Carolina): Issue: What effect does leaf removal have on fruit temperature and composition in Southeastern US particularly with regard to phenolic compounds in grape berries? Methods: The study was established at a commercial vineyard in Lexington, North Carolina using Vitis vinifera cv Cabernet Franc. In 2013 and 2014, three different leaf removal treatments (control, medium, high) were applied to the grapevines at beginning of bunch closure. Treatments ranged from no leaf removal (control), to removing five leaves per shoot on east and west sides of the canopy (medium), to removing seven leaves per shoot on east and west sides of the canopy (high). Canopy density, light penetration, fruiting zone temperature, and internal berry temperature were measured throughout the growing season. Berry samples were assayed

20
for: SCC, pH, titratable acidity, color by spectrophotometry, and phenolic composition and concentration by the Harbertson-Adams assay. Results/major findings: Basal leaf removal increased sunlight exposure resulting in berry temperatures that were 1.4°C warmer after noon than berries from control vines. The concentration of total skin phenolics and total color (TC520) were significantly higher in fruit from leaf removal vines in one out of two years. Content and concentration of tannin and individual anthocyanins and flavonols were unaffected by either leaf removal treatment. Exposure to elevated temperatures may be responsible for the lack of consistent differences in the phenolic concentration of more exposed fruit. Conclusions/Grower Industry Recommendations: The influence of leaf removal on grape composition in North Carolina may be less profound than that observed in cooler climates. Leaf removal for improved air circulation to reduce disease pressure should be practiced. In the two years of this study no detrimental effect was observed by removing leaves from west-exposed canopies. Publications and presentations on this effort: Experiment 3: Estimating climate-specific vineyard capacity for balancing crop levels Team Leader: Dr. Alan Lakso, Cornell University Cabernet Franc/101-14 vines at 2.1x2.7 m (7x9 feet) on a deep, silt loam soil have been excessively vigorous. To create more balanced vines, we used the combined approach of: • balance-pruning to 40 shoots/kg (16/lb) of pruning weight to regulate average shoot length to a
target of about 1.2 m (4 feet) in length and 30 grams/cane winter pruning weight • shoot spacing of 15/m of trellis (4-5 shoots/foot) to avoid dense canopies • providing adequate trellis length by horizontally dividing the canopy into a Lyre training
system to accommodate the need for more shoots. The Lyre used spur pruning to fill the total trellis length which also promotes uniformity of shoot vigor.

21
Figure 1 (right). Relationship of shoot number per vine and mean individual cane weights of Cabernet franc grapevines trained either to VSP or to divided-canopy, Lyre. The shaded bar indicates the desired range of cane weight. Compared to the normal VSP-trained vines, with 35-40 shoots/vine, the higher numbers of shoots per vine with Lyre training in 2012 showed: (1) greatly reduced shoot vigor with average canes weights very close to the ideal 30 grams/cane (approximately 4 foot shoots), and (2) the balanced pruning gave much better vine-to-vine uniformity in shoot vigor than did the VSP.
We determined the relationship of shoot numbers per vine (2.1 m or 7 foot spacing in row) to final average cane weight (Fig. 1). This showed that in this soil, a minimum of 50 shoots per vine were needed to control shoot growth. Balanced pruning reduced variability of shoot vigor. The 2012 season was long (due to early bud break), warm, and dry and vines were irrigated twice. The VSP vines needed 2 toppings with a significant amount of regrowth and many laterals in the canopy. The Lyre vines were only topped once, showed no regrowth, had few laterals, and required very little management beyond shoot positioning. We repeated in 2012 the crop load study with four crop levels in each system from which wines were made in the Cornell Vinification and Brewing Lab. VSP had crops of 4.5, 6.5, 12.4 and 15.3 tonnes/ha (2.0, 2.9, 5.4 and 6.8 tons/acre) compared to 5.7, 10.7, 14.0 and 19.3 tonnes/ha (2.6, 4.8, 6.2 and 8.5/acre). Due to the warm long season in 2012, all crop levels gave a minimum of 23˚ Brix, with the Lyre system giving the lowest standard deviation in Brix due to the balanced pruning. Extractable anthocyanin concentrations were essentially the same for both systems at any crop level. The evaluation of the wines is not yet complete. Publications and presentations on this effort:
0
10
20
30
40
50
60
70
20 30 40 50 60 70 80
Mean
can
e W
eight (g)
Shoots/Vine
VSP
22
Objective 2. Develop research-based recommendations for optimally matching grape cultivars with site-specific environmental conditions Objective 2a: Evaluation of viticultural and enological performances of novel wine grape cultivars (linkage with NE-1020 project) Issue: Cultivar and clone evaluation is an on-going, dynamic exercise in the Eastern U.S. wine industry. The dynamics are caused by introduction of novel cultivars through breeding programs, wine-maker preferences for certain clones, phytosanitation efforts that eliminate pathogens from otherwise desirable clones, climate change, and the novelty of grape and wine production in specific parts of the region. The acclaim of a wine region frequently hinges on the relative success of one or two fortuitous matches of cultivar to local conditions, such as Pinot noir in the Willamette Valley of Oregon, or Sauvignon blanc in Marlborough, New Zealand. Consumer recognition of "signature" grape cultivars associated with specific states or sub-regions in the East remains elusive. Cultivar evaluation provides a sound footing for developing such cultivar recognition.
Research Approach: We have linked this objective with the existing USDA/NIFA (formerly CSREES) Research Project, NE-1020 (“Multi-state evaluation of wine grape cultivars and clones”) of which many of the PIs and collaborators are members. The NE-1020 is a national project for grape cultivar and clone evaluation, the goals of which are recognized as a high priority with the National Grape and Wine Initiative (http://www.ngwi.org/). The historical justification, goals, and membership of the NE-1020 project are at the NE-1020 web site (http://www.nimss.umd.edu/homepages/outline.cfm?trackID=4034). The entire NE-1020 project membership comprises researchers in 29 states. Our effort involves the following member institutions (alphabetically) and associated Principal Investigators of this project: Connecticut Agricultural Experiment Station (Dr. Bill Nail) University of Maryland (Dr. Joe Fiola) North Carolina State University (Dr. Sara Spayd) Cornell University (Dr. Justine Vanden Heuvel The Ohio State University (Dr. Imed Dami) The Pennsylvania State University (Dr. Robert Crassweller)
Viticulture progress: All cultivars are maintained and managed under similar viticultural practices as outlined by the NE-1020 protocol (lgu.umd.edu/lgu_v2/homepages/saes.cfm?trackID=4034). The viticultural data collected are based on the NE-1020 guidelines as described in objective #1, and include the following: recording phenology (bud break, bloom, véraison, ripening, and leaf fall based on development stages scale by Eichhorn and Lorenz (1977), computing crop loads (years 1-5), and determining vine size, fruitfulness, yield components and fruit composition at harvest. The data are compiled in a web-based relational database available to NE-1020 PIs. Enology Progress: Wines were produced at Penn State from three cultivars grown at the Biglerville site (Cabernet Franc, Chambourcin, and Merlot) and five grown at the Erie site (Cabernet Franc, Chambourcin, Gruner Veltiner, Pinot grigio and Vidal blanc.) Cornell’s

23
Vinification and Brewing lab produced wines from 9 cultivars grown in Geneva, NY, and 12 cultivars grown at the CT research station for a third and second year, respectively. Industry and research tastings across sites were conducted in the summer of 2013, and are planned for the national NE 1020 meeting held in Nebraska in November 2013. A final year of winemaking will be completed this fall. For a second year, the phenolic profile was assessed for wines produced from locally sourced Riesling, Gewürztraminer, and Traminette with pre-fermentation skin contact time ranging from 2 – 48 hours. Concentrations of key phenolic compounds varied significantly by cultivar and skin contact time, with lesser variation by year. Initial screening by a consumer panel suggested that increased perception of bitterness and astringency coincides with different levels of skin contact time for each cultivar. To further explore this theory, a detailed sensory evaluation with a trained panel was performed during summer 2013. A final year of winemaking will be completed this fall. Objective 2a: Evaluation of viticultureal and enological performances of novel wine grape cultivars (linkage with NE-1020 project) Cornell Team: Anna Katharine Mansfield, David Manns, Alex Fredrickson, Diane Schmitt
Issue 1: Extraction and retention of phenolic compounds in red hybrid wines. Evaluate the effect of processing parameters on the phenolic profile of hybrid red wines. Data collected in year 1 suggested that common processing methods have little impact on phenolic concentrations in hybrid red wines, and related work at Cornell suggests that compounds extracted during winemaking may be lost to concurrent sorption by insoluble must components. In response to these findings, experiments were conducted to assess the impact of addition time on the retention of commercially available tannins in red hybrids Maréchal Foch, Corot noir, and Arandell.
Issue 2: Impact of processing parameters on the phenolic profiles of aromatic white wines. Issue 2: Evaluate the impact of processing parameters on the phenolic profiles of aromatic white wines. For a second year, the phenolic profile was assessed for wines produced from locally sourced Riesling, Gewürztraminer, and Traminette with pre-fermentation skin contact time ranging from 2 – 48 hours. Concentrations of key phenolic compounds varied significantly by cultivar and skin contact time, with lesser variation by year. Initial screening by a consumer panel suggested that increased perception of bitterness and astringency coincides with different levels of skin contact time for each cultivar. HPLC analysis of year-2 wines point to increased retention and larger mean degree of polymerization (mDP) with later tannin additions. Expected outputs of Objective 2a: We will identify pros and cons of cultivars newly released or new to the East from the NE1020 project. Of paramount importance is their cold hardiness, the most limiting factor of clone success. We will also develop a coordinated database of several
Figure. Replicate lots of Maréchal Foch must are fermented using different tannin addition Photo by A.K. Mansfield.
24
quality attributes, in particular the amount of YAN and phenolics in fruit and wine. The best fruit processing and vinification practices will also be identified to optimize phenolics in white and red wines.
Publications and presentations on this effort:
North Carolina project: A trial of red wine grape (Vitis vinifera L.) cultivars/rootstock combinations were assessed for viticultural performance in Dobson, North Carolina. The study was established in 2008 as a randomized complete block design. Cabernet Sauvignon clone 8 and Merlot clone 3 were used as sentinel cultivars. Non-traditional cultivars evaluated were Aglianico cl. FPS01 (FPS = Foundation Plant Service), Carmenere cl. VCR702, Grignolino FPS03, Lemberger cl. 1, Nebbiolo cl. FPS03, Tinta Cao cl. FPS03, and Touriga Nacional cl. FPS01 all grafted to 101-14 Mgt rootstock. Vine yield, fruit composition, and vigor were measured from 2010 to 2014. Cold damage was assessed for the 2013/2014 winter. Average annual growing degree days for the site were 2167 (base 10°C) with an average of 1125 mm of precipitation. Results/major findings: Cultivars varied in yield (0.90 to 4.59 kg/vine), yield/pruning weight (0.8 to 9.5), soluble solids concentration (17.8 to 21.9%), titratable acidity (3.8 to 7.2 g/L tartaric acid), and pH (3.56 to 4.09). The cultivars Carmenere and Nebbiolo had unacceptably low yields (< 1.3 tons per acre). Both cultivars are known to have higher fruit production on cane pruned systems in other areas. When switched from spur to cane pruning, no improvement in yield was observed. Carmenere, Grignolino, Nebbiolo, Tinta Cao, and Touriga Nacional had the highest soluble sugar concentration at harvest. Aglianico, Grignolino, and Nebbiolo had the most desirable titratable acidity and pH. Grignolino did not develop full red color, but may provide an option for rosé, blush or blanc-noir wine styles. Touriga Nacional and Tinta Cao were most affected by the cold and Lemberger was least affected. Conclusions/Grower Industry Recommendations: Perhaps as important as what to grow, we learned what not to grow. Carmenere and Nebbiolo do not produce sufficient yields under North Carolina conditions to provide a sound economic yield. The warm-hot climate cultivars Touriga Nacional and Tinta Cao looked promising from the stand point of yield and fruit quality. However, they are more prone to cold injury than the two standard industry cultivars. Aglianico looks promising for red wine production.
Ohio project: Research Accomplishments: Weather and phenology: Data collection for the 2013 growing season was complete
including phenology, yield components, fruit composition, and cold hardiness. The winter of 2014 was extremely cold and worst in 20 years for grape production in Ohio. An industry survey showed the following damage: 30% in American grapes, 60% in hybrids, and nearly 100% in vinifera (Dami and Lewis 2014). In the NE1020 trial sites, the lowest temperatures
25
recorded were: -12F in Wooster and -15F in Kingsville. In both sites, we had nearly 100% bud damage of 20+ cultivars. Subsequent assessment during the summer showed trunk damage and even vine die-back or complete vine death.
Excessive rain in late season led to disease outbreaks primarily down mildew and bunch rot.
Our research vineyards had little to no diseases due to good canopy management and tight spray schedule. During harvest, the major challenges were sour rot, yellow jackets (most seen in 10 years) and spotted wing drosophila (SWD). Not only SWD were trapped in our vineyard, but they caused damage to the fruit. Yellow jackets perforated berries which led to secondary infection such as sour rot. We started picking grapes on August 26 with Siegerrebe in Wooster and had a full crop in both locations and the fruit quality was very good to excellent.
Diane Kinney, Research Assistant is in charge of data collection from both sites. Wines were made from selected varieties in 2013. A sensory evaluation of selected wines by an accredited laboratory was conducted for two vintages.
Cold hardiness: canes were collected from both sites to measure cold hardiness (LT50)
during the 2013-2014 dormant seasons of more than 20 varieties. Shouxin Li, MS candidate conducted freezing test until December.
Winter Damage Survey: Dami prepared a survey in collaboration with Dr. Deborah Lewis to
gather information on crop loss state-wide, develop research and outreach strategies to assist growers, and timely communication of objective data to state and federal agencies in case it is needed for assistance or disaster relief programs. This survey was sent out on February 6. Results are published in a report and shared with growers, educators, and media. Below is a summary of the survey.
Extension Accomplishments: Presented project findings at the annual Ohio Grape & Wine Conference (250 attendees) in
2014.
Co-organized, hosted, and presented at the SCRI Research Summit held jointly with OGWC (200 attendees). The purpose of the summit was to share updates on the SCRI project. Tony Wolf, Mr. Peter Sforza, Todd Steiner, and Imed Dami were the summit speakers.
Following the extreme minimum lows brought by the polar vortex in January and February 2014 across Ohio, many vineyards were affected and vines sustained extensive vine damage. Dami and his group assessed damage by evaluating more than 10,000 buds in the 2 research vineyards in Wooster and Kingsville. Information was then timely shared with growers via
26
the newsletter, OGEN. Second, Dami in collaboration with the Grape Team organized 3 workshops across Ohio and presented at the Ohio Grape & Wine Conference with the purpose to train how to assess bud damage and how to prune damaged vines; nearly 300 attended these educational events. Third, due to the unknown magnitude of the damage, Dami and Lewis developed an-online survey to help estimate the extent of crop loss; to develop research and outreach strategies for managing damaged vines; and to communicate the results to growers, educators, decision makers, and state and federal agencies in case it is needed for assistance or disaster relief programs.
Co-organized and presented at a mini-conference titled: “OSU Research Advances in
Viticulture and Enology” at OARDC-Wooster. Dami and Steiner presented findings on new NE1020 varieties with sensory evaluation of the 2013 wines.
Organized and conducted a Twilight Vineyard Tour at OARDC in Wooster. Dami organized
this event, invited Dr Sabbatini and gave a presentation. The focus was on the NE1020 varieties and the tour was conducted at the Wooster vineyard. Attendees had the opportunity to see the varieties and taste the fruit and wines.
Timely dissemination of information on new varieties: In an effort to enhance our
communication and streamline research information to our industry members, we added a research update section in OGEN with the purpose to update on research projects. We started posting articles on the NE1020 winegrape varieties. The purpose is to provide another method of outreach deliverables to our industry in addition to our annual reports and the regular educational events such as the OGWC, field days, and workshops. Further, since variety evaluation is a long-term project, we wanted to provide timely recommendations of certain varieties as soon as we’re confident of their good performances in the vineyard and the cellar. Thus far, we posted 3 articles in OGEN featuring varieties that we recommend including: Gamay noir, Regent, and Arneis.
Publications and presentations on this effort: Maryland project: The aim of this research was to evaluate both the viticultural as well enological merits of historical and newly developed wine grape varieties in Maryland’s diverse winegrowing regions, including: Assess vineyard performance and wine quality of existing and newly planted Italian, Spanish,
Portuguese, and French varieties in Western, Southern, and Eastern Shores (Obj. 2a). Assess vineyard performance and wine quality existing and newly planted advanced
selections from the Soviet Union at University and Commercial sites in Eastern Maryland (Obj. 2a).
Experiments:
27
Planting of varieties and clones of varieties with high potential for Mountain Maryland and the Piedmont Plateau (WMREC, Keedysville, MD). Clones of varieties that are grown in other warm summer/cold winter climates (zone 6b) of the world such as Northern areas of Italy, Spain, Portugal, and France were tested in Washington County (mountain) Maryland. These varieties are included in the NE1020 National Variety Trial.
Advanced trails of that have been imported from Italy and warm climate areas. Varieties that are grown in other hot climates of the world such as Southern areas of Italy, Spain, Portugal, and France were tested in replicated experiments at University and Commercial sites in the Southern and Eastern Shores (zones 7a, 7b).
Advanced trials of varieties that have been imported from the Soviet Union. Advance selected varieties that have shown promise in Keedysville were tested at a University site in Eastern Maryland.
Advanced commercial and replicated trails of ‘Linae,’ a proprietary variety owned by the University of Maryland. Wine from the ‘Linae’ variety has won wine awards in national competitions and has sparked commercial interest. Vines were propagated and disseminated to selected commercial farms and planted in replicated cultural trials at University R&D vineyards.
Standard data collection was used and included: monitoring of growth characteristics, monitoring the pest complex, fruit sampling and harvest components (yield, cluster size, berry weight), basic fruit chemistry analyses (pH, Brix%, TA). Small batch fermentations will be conducted on each treatment within each experiment, over multiple years. Summary of Major Research Accomplishments and Results by Objective (2013-2014 results only)
The 2013 growing season can best be described as “average” or “normal” from a temperature standpoint, which does not seem to happen too frequently. The limiting factor for production in 2013 was a late frost (May 14) which took place when growth had already begun and significantly reduced yields. The majority of the vinifera cropping was on secondary shoots. Otherwise, phenological development and weather conditions were in line with the averages for the various regions. The eastern and southern shore did receive above average rainfall for June and early July but that pattern quickly reversed in August and through the fall. Overall great weather during the harvest season produced one of the best vintages in recent history. Long slow ripening allowed full ripening and chronological separation of varieties. Lack of fall rains allowed grapes to fully ripen and be harvested when ripe (rather than before a hurricane!). Harvest dates in 2014 were extended relative to those of the warm of 2010 and 2012 which tended to compress the season. Overall, the 2013 was a very good vintage for most varieties, especially the reds which experienced good ripening do to excellent ripening conditions in the fall. Small batch winemaking was conducted on all varieties and preliminary wine evaluation revealed a high level of varied of quality, good color, and minimal green/herbaceous aromas. Varietal highlights in the Western vineyard included Teroldego, Garanoir, Black Malvesia, and Chambourcin. The old world white varieties (Marsanne, Roussanne, Colombard, Albarino,

28
Souza, and Verdejo) performed very well on the Eastern shore in commercial observation plots. Linae is one of the first varieties harvested in mid-August so it fared well in quality in university trials. Mountain Maryland and the Piedmont Plateau (WMREC, Keedysville, MD). As described above, the 2013 grape quality was comparable to the warm growing seasons of 2010 and 2012, due to very good ripening weather. The limiting factor for production in 2013 was a late frost (May 23) which took place when growth had already begun. Many young shoots and cluster were damaged or killed by the event, which significantly reduced yields across varieties. Except for that overall the growing condition were very good in the western mountains with adequate spring moisture followed by a relatively good warm and dry growing season. Temperatures were slightly below “normal” for the majority of the growing season with a very few short periods of extreme (93F to 100F) temperatures. All varieties were harvested around normal or average dates for the varieties, later than has been the experience over the last few years. Because grape quality was very good, an effort was made to ferment as many replicated, guard and demonstration varieties. Small batch winemaking was conducted on all varieties and preliminary wine evaluation revealed high quality among varieties, very good color, ripe tannin structure, and ripe aromas. Varietal highlights in the Western vineyard included Garanoir, Teroldego, and Black Malvesia. Southern Maryland (CMREC, Upper Marlboro, MD). The southern shore is characterized by the highest average temperatures in the state. The oldest vineyard planting was in its 13th leaf and the newest planting was in its 8th leaf. As described previously, the limiting factor for production in 2013 was a late frost (May 23) which reduced yields across varieties but not as significantly as in western Maryland. Overall in 2013 temperatures were slightly lower than “normal” for the majority of the growing season, with a few short periods of extreme (98F to 106F) temperatures but not long enough to greatly impact development. There was normal spring precipitation but this region experienced significant rainfall throughout June and into mid/late July, but then it tapered off quickly. We were able to control powdery and downy mildew early in the season until the June rains began and started slow degradation and some late varieties had reduced effective canopy area. Timing of harvest was about average for most varieties. Fruit ripened reasonably well and all varieties achieved full ripening (see table below). The bird predation again started very early, so yield of early varieties was lower than normal as netting was not as effective as previous years, even when amended during the season. Early harvested white varieties were very good quality and the mid-to-late and late varieties, although of good quality, were severely quantity challenged by birds and stinging insect predation. Preliminary wine evaluation revealed good color and minimal under-ripe aromas. Varietal highlights in the Southern vineyard included Sauvignon Blanc, Chardonel, Traminette, Negro Amaro, and Petit Manseng. Hybrids continue to perform best in this stressful environment. Eastern Maryland (WREC, Queenstown, MD; GRV, Sudlersville, MD). This region is characterized by the moderately high average temperatures. As described previously, the late
29
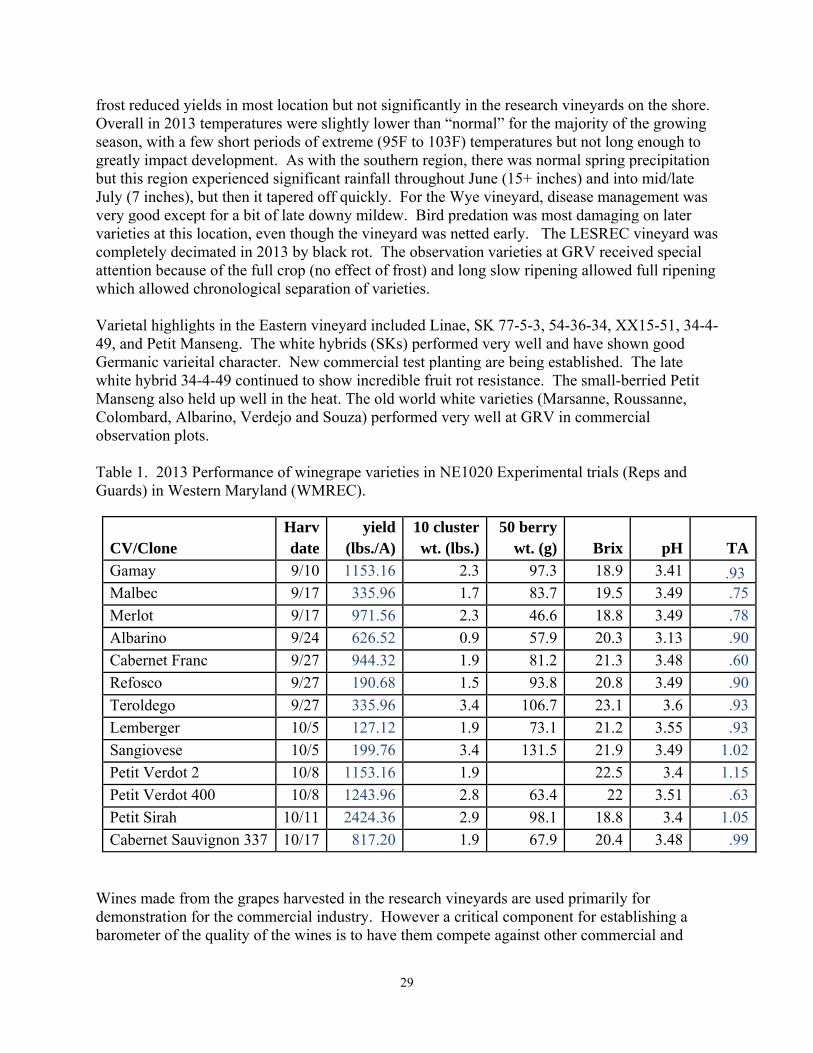
frost reduced yields in most location but not significantly in the research vineyards on the shore. Overall in 2013 temperatures were slightly lower than “normal” for the majority of the growing season, with a few short periods of extreme (95F to 103F) temperatures but not long enough to greatly impact development. As with the southern region, there was normal spring precipitation but this region experienced significant rainfall throughout June (15+ inches) and into mid/late July (7 inches), but then it tapered off quickly. For the Wye vineyard, disease management was very good except for a bit of late downy mildew. Bird predation was most damaging on later varieties at this location, even though the vineyard was netted early. The LESREC vineyard was completely decimated in 2013 by black rot. The observation varieties at GRV received special attention because of the full crop (no effect of frost) and long slow ripening allowed full ripening which allowed chronological separation of varieties. Varietal highlights in the Eastern vineyard included Linae, SK 77-5-3, 54-36-34, XX15-51, 34-4-49, and Petit Manseng. The white hybrids (SKs) performed very well and have shown good Germanic varieital character. New commercial test planting are being established. The late white hybrid 34-4-49 continued to show incredible fruit rot resistance. The small-berried Petit Manseng also held up well in the heat. The old world white varieties (Marsanne, Roussanne, Colombard, Albarino, Verdejo and Souza) performed very well at GRV in commercial observation plots. Table 1. 2013 Performance of winegrape varieties in NE1020 Experimental trials (Reps and Guards) in Western Maryland (WMREC).
CV/Clone Harv date
yield (lbs./A)
10 cluster wt. (lbs.)
50 berry wt. (g) Brix pH TA
Gamay 9/10 1153.16 2.3 97.3 18.9 3.41 .93 Malbec 9/17 335.96 1.7 83.7 19.5 3.49 .75
Merlot 9/17 971.56 2.3 46.6 18.8 3.49 .78
Albarino 9/24 626.52 0.9 57.9 20.3 3.13 .90
Cabernet Franc 9/27 944.32 1.9 81.2 21.3 3.48 .60
Refosco 9/27 190.68 1.5 93.8 20.8 3.49 .90
Teroldego 9/27 335.96 3.4 106.7 23.1 3.6 .93
Lemberger 10/5 127.12 1.9 73.1 21.2 3.55 .93
Sangiovese 10/5 199.76 3.4 131.5 21.9 3.49 1.02
Petit Verdot 2 10/8 1153.16 1.9 22.5 3.4 1.15
Petit Verdot 400 10/8 1243.96 2.8 63.4 22 3.51 .63
Petit Sirah 10/11 2424.36 2.9 98.1 18.8 3.4 1.05
Cabernet Sauvignon 337 10/17 817.20 1.9 67.9 20.4 3.48 .99
Wines made from the grapes harvested in the research vineyards are used primarily for demonstration for the commercial industry. However a critical component for establishing a barometer of the quality of the wines is to have them compete against other commercial and
30
noncommercial wines. In fall 2013, wines were entered in the American Wine Societies’ Non-Commercial Wine Competition. The following is the list of entries and results. Of 9 wine entered, 8 won medals. Vintage Wine Category Award 2010 Cabernet Sauvignon WMREC Dry Double Gold 2011 54-36-34 (Albarino) Wye Dry Gold 2011 Chardonnay WMREC Dry Silver 2011 Colombard GRV Dry Silver 2010 Linae Ice Wye Dessert Silver 2010 Linae (oak) Wye Dry Bronze 2010 XX15-51 (Chenin) Wye Dessert Bronze 2011 Himrod UMREC off-Dry Bronze Publications and presentations from the Maryland work: Connecticut project: Two vineyards were established and maintained: Hamden CT (760 vines 32 cultivars, including guards) and Windsor CT (138 vines - 9 cultivars, including guards). The past 5 years of data has provided valuable information on mortality rates for the more cold-sensitive vinifera cultivars (Cabernet Sauvignon, Gamay and Merlot). Each year of data presents more information as to the consistency of yield and quality of the wine produced for all of these cultivars. Please contact the Principal Investigator, Dr. Francis Ferrandino directly to obtain specific results and recommendations: [email protected]) http://www.ct.gov/caes/cwp/view.asp?a=2812&q=345108 Pennsylvania project: Summary of Major Research Accomplishments and Results: Wine grape variety plantings were established in 2008 at the Lake Erie Regional Grape Research and Extension Center in North East, PA, and the other at the Fruit Research and Extension Center (FREC) in Biglerville, PA. Viticultural data were collected as prescribed in the NE-1020 protocol. The 2014 winter season has left the two vineyards in a state of disrepair as some vines were killed back to the scion and others completed killed. For the 2014 vintage, V. vinifera grapes are not expected for fermentation due to results from winter injury. The results presented here are from the 2013 season and are presented by site. From a winemaking perspective, the 2013 growing season was ideal (dry, warm harvest) for both North East, PA and Biglerville, PA vineyard sites. The plantings consist of 20 and 15 cultivars respectively. Viticultural Results: Dormant pruning weights for 2013 were greatest on Cabernet Franc and Traminette at LERGREC and least on Muscat Ottonel and Chambourcin (Table 1). At the FREC
31
site, Cabernet Sauvingnon and Cabernet Franc had the greatest dormant pruning weights and Chancellor and Chambourcin had the lowest in 2013. Average yield per vine was greatest on Chancellor followed by Chambourcin; and lowest on Pinot noir and Pinot grigio at LERGREC. Chambourcin was again the highest yielding cultivar at FREC and Malbec was the lowest yielding cultivar. Cluster weights were much lower at LERGREC than at FREC. Highest cluster weights were Traminette and Chambourcin for LERGREC and FREC, respectively. Winter injury: The winter of 2013 - 2014 will be remembered as one of the harshest for Pennsylvania grape growers since 1994. To begin with, the polar vortex that brought the ‘arctic’ to Pennsylvania in early January, caused severe damage to many wine grape varieties, especially cultivars of Vitis vinifera. During that event, temperatures in the Lake Erie region of Pennsylvania fell from 47 F to below zero within 16 hours. Temperatures bottomed out at about -12 F (-24 C) and remained below zero (F) for about 20 hours. This was followed by steadily rising temperatures over the next several days, warming back up into the 50s. But the rollercoaster ride didn’t end there; several more severe cold events occurred over the next 8 weeks as wave after wave of frigid air flowed through Pennsylvania vineyards. Weather station located at the PSU Lake Erie Regional Grape Research and Extension Center enabled us to track daily low temperatures through the period of the most intense cold (Figure 1). Bud injury assessment: Bud mortality was assessed after bud-break to evaluate the impact of winter cold temperature injury on the 17 grapevine varieties established at the Lake Erie station. Bud mortality was calculated as the ratio between dead buds and total number of buds per vine left post pruning. As expected, there was tremendous variation in bud mortality among the 17 grapevine varieties (Figure 2). Reducing Bunch Rot on Tight-Clustered Varieties: Bunch rot occurs late in the growing season due to a complex of many organisms but exacerbated by the compactness of the grape cluster. There are chemicals available that can control the disease but care must be taken to prevent the development of resistance to these compounds. An alternative non-chemical method is the removal of leaves early in the season to improve aeration and light penetration around the clusters. The leaf removal provides an early limitation of carbohydrates resulting in reduced yield but increased stretching of the clusters and less rot. The most effective timing for leaf removal is at trace bloom stage of development. Another potential method being evaluated include application of oils to reduce photosynthesis. Enology Summary (October 1, 2013 – September 30, 2014): In the 2013 vintage year, 6 varieties between the North East (Erie) and Biglerville plots were harvested and fermented into wine (Table 3). Three separate yeast trials were conducted on Cabernet Sauvignon and Cabernet Franc from Biglerville, in addition to Vidal Blanc harvest from Erie. Wines were tasted for industry members during Extension events. Industry members were particularly concerned with the Bordeaux varieties (Merlot, Cabernet Sauvignon, and Cabernet Franc) viticulture practices due to reflected juice chemistries and sensory perceptions of the wines. Therefore, vineyard management practices were to be altered for the 2014 growing season. Additionally, Chambourcin harvested from Erie was used for a co-inoculation study. In this experiment, the Chambourcin grapes were set up into two treatments of three replicates per
32
treatment: co-inoculation of yeast and malolactic bacteria during primary fermentation versus sequential fermentations. These wines were analyzed for wine chemistry attributes in addition to microbial populations during primary and malolactic fermentations. Final wines were also analyzed by a consumer-based sensory panel to determine if perceptible differences existed between treatments. Finally, an undergraduate (FD SCI 413) and graduate (FD SCI 597) level enology class used an additional 10 varieties provided from both vineyard plots to teach harvest techniques and winemaking techniques. Additionally, several students used these varieties for independent research projects.

33
Table 1. Dormant pruning weight, yield/vine and average cluster weight of wine grape cultivars planted at two locations in Pennsylvania in 2013.
Lake Erie Region Grape Research & Extension Center (LERGREC)
Cultivar Pruning wt.
kg/vine Yield / Vine, Kg. Avg. Cluster
wt, g Cabernet Franc* 1.24 e** 7.34 cd 104 bc Chambourcin 0.34 ab 9.05 def 197 d Chancellor 0.72 bcd 10.56 efg 110 c Gruner Veltliner 0.74 bcd 6.45 bcd 181 d La Crescent 0.68 abcd 7.86 de 72 ab Marquette 0.90 cde 8.26 def 74 abc MN 1235 0.74 bcd 8.10 de 79 abc Muscat Ottonel 0.31 a 3.01 a 79 abc Norton 0.89 cde 4.40 abc 48 a NY 81.0315.17 0.50 abc 11.50 fg 100 bc Pinot Grigio 0.51 abc 3.22 a 86 bc Pinot Noir 0.55 abc 3.17 a 81 abc Syrah 0.58 abc 4.01 ab 199 d Traminette 1.08 de 3.33 ab 82 abc Vidal 0.47 ab 12.25 g 187 d P-Value 0.0001 0.0001 0.0001
Fruit Research and Extension Center (FREC)
Cultivar Pruning wt.
kg/vine Yield / Vine, kg. Avg. Cluster
wt, g Albarino 1.70 bcde 2.17 abc 145 abc Barbera 2.18 bcde 5.35 def 309 cdef Cabernet Franc 2.38 de 6.52 ef 283 bcdef Cabernet Sauvingnon 2.54 e 4.85 cdef 217 abcde Chambourcin 0.78 a 11.66 g 477 f Chancellor 0.75 a 4.23 bcde 161 abc Gruner Veltliner 1.91 bcde 5.62 def 276 abcdef Lemberger 1.55 abcd 3.95 bcde 223 abcde Malbec 2.08 bcde 0.88 a 103 ab Merlot 1.99 bcde 4.85 cdef 221 abcde Muscat Ottonel 2.11 bcde 2.87 abcde 249 abcdef Petit Manseng 1.94 bcde 1.95 abc 103 ab Petit Verdot 2.24 cde 3.47 abcde 148 abc Pinot Grigio 1.89 bcde 2.14 abc 112 ab Pinot Noir 2.04 bcde 1.73 ab 88 a

34
Sangiovese 2.32 de 7.63 f 381 ef Syrah 1.91 bcde 2.26 abc 151 abc Tannat 1.84 bcde 1.47 ab 370 def Traminette 1.29 ab 2.77 abcde 235 abcde Viognier 1.38 abc 1.37 ab 185 abcd P-Value 0.0001 0.0001 0.0001
*Shaded cultivars are planted in both locations for comparisons **Letters within columns and within sites refer to Tukey-Kramer mean separation, P=0.05 Table 3. Harvest data and juice chemistry results for the cultivars fermented in 2013. Grape Must (Juice)
Variety Location Harvest Date in 2013
Total Grape Yield (lb.)
Brix Adjusted
Brix
TA (g/L Tartaric Acid)
pH YAN (mg/L N)
Albarino FREC 4‐Oct 89.6 21.2 NA 4.22 3.59 239
Cabernet Franc (GRE)
FREC 11‐Oct 288.9 20.3 NA 4.78 3.95 187
Cabernet Franc FREC 11‐Oct ‐ ‐ ‐ ‐ ‐ ‐
(ES 488)
Cabernet Franc FREC 11‐Oct ‐ ‐ ‐ ‐ ‐ ‐
(EZ Ferm 44)
Cabernet Sauvignon (GRE)
FREC 11‐Oct 209 20.2 NA 8.53 3.64 221
Cabernet Sauvignon
FREC 11‐Oct ‐ ‐ ‐ ‐ ‐ ‐
(ES 488)
Chambourcin (Sequential, Rep
1) LERGREC 21‐Oct 850.86 20.8 NA 9.01 3.35 283
Chambourcin (Sequential, Rep
2) LERGREC 21‐Oct ‐ 20.4 NA 9.19 3.37 290
Chambourcin (Sequential, Rep
3) LERGREC 21‐Oct ‐ 20.8 NA 7.76 3.32 313
Chambourcin LERGREC 21‐Oct ‐ 21.4 NA 9.01 3.35 256
(Co‐Inoc, Rep 1)
Chambourcin LERGREC 21‐Oct ‐ 20.9 NA 9.1 3.34 260
(Co‐Inoc, Rep 2)
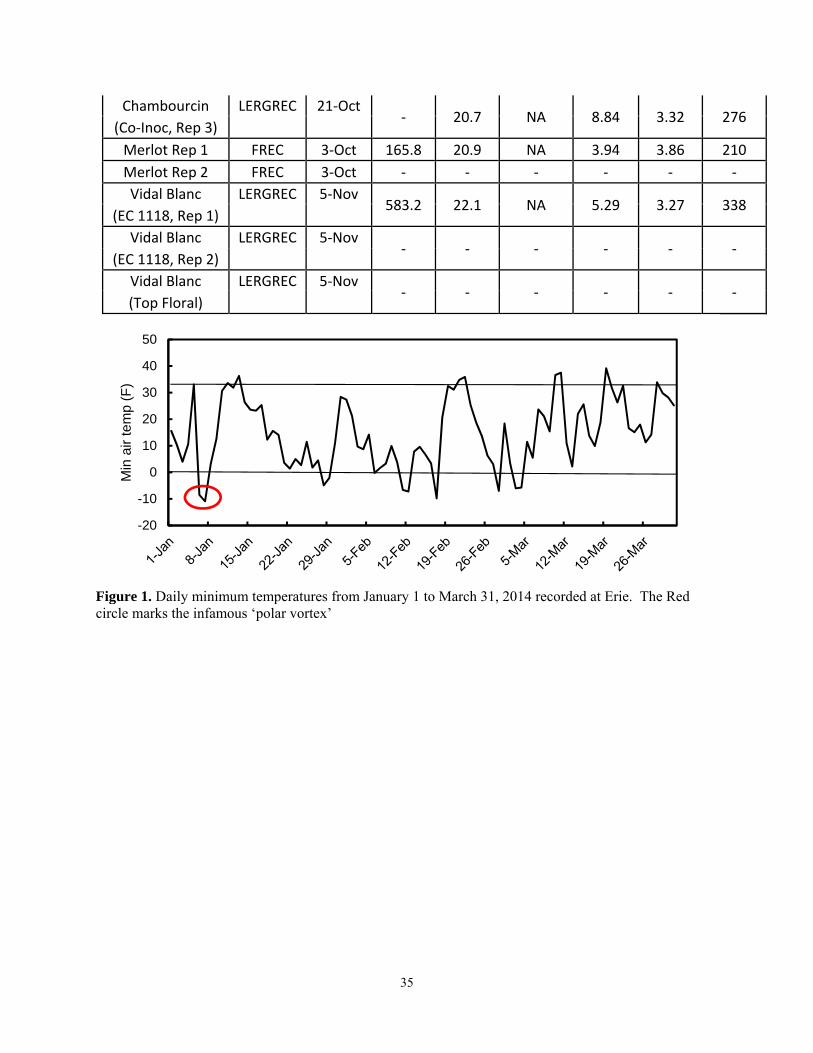
35
Chambourcin LERGREC 21‐Oct ‐ 20.7 NA 8.84 3.32 276
(Co‐Inoc, Rep 3)
Merlot Rep 1 FREC 3‐Oct 165.8 20.9 NA 3.94 3.86 210
Merlot Rep 2 FREC 3‐Oct ‐ ‐ ‐ ‐ ‐ ‐
Vidal Blanc LERGREC 5‐Nov 583.2 22.1 NA 5.29 3.27 338
(EC 1118, Rep 1)
Vidal Blanc LERGREC 5‐Nov ‐ ‐ ‐ ‐ ‐ ‐
(EC 1118, Rep 2)
Vidal Blanc LERGREC 5‐Nov ‐ ‐ ‐ ‐ ‐ ‐
(Top Floral)
Figure 1. Daily minimum temperatures from January 1 to March 31, 2014 recorded at Erie. The Red circle marks the infamous ‘polar vortex’
-20
-10
0
10
20
30
40
50
Min
air
tem
p (F
)
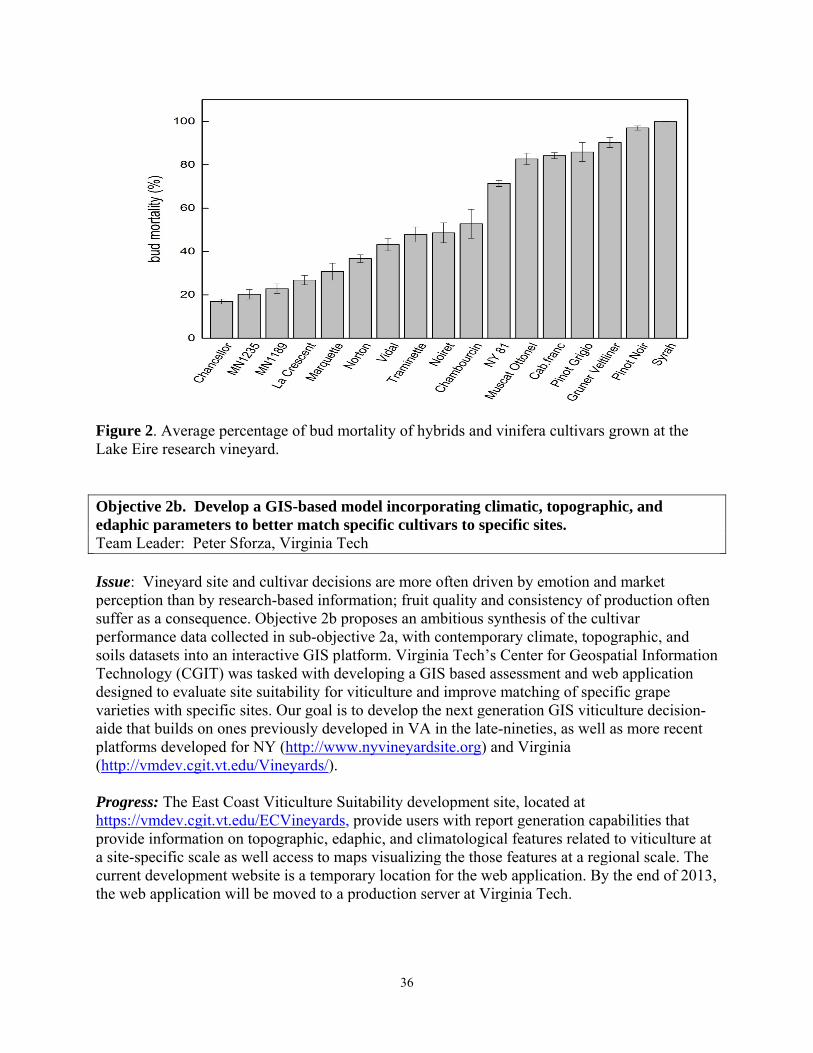
36
Figure 2. Average percentage of bud mortality of hybrids and vinifera cultivars grown at the Lake Eire research vineyard.
Objective 2b. Develop a GIS-based model incorporating climatic, topographic, and edaphic parameters to better match specific cultivars to specific sites. Team Leader: Peter Sforza, Virginia Tech Issue: Vineyard site and cultivar decisions are more often driven by emotion and market perception than by research-based information; fruit quality and consistency of production often suffer as a consequence. Objective 2b proposes an ambitious synthesis of the cultivar performance data collected in sub-objective 2a, with contemporary climate, topographic, and soils datasets into an interactive GIS platform. Virginia Tech’s Center for Geospatial Information Technology (CGIT) was tasked with developing a GIS based assessment and web application designed to evaluate site suitability for viticulture and improve matching of specific grape varieties with specific sites. Our goal is to develop the next generation GIS viticulture decision-aide that builds on ones previously developed in VA in the late-nineties, as well as more recent platforms developed for NY (http://www.nyvineyardsite.org) and Virginia (http://vmdev.cgit.vt.edu/Vineyards/). Progress: The East Coast Viticulture Suitability development site, located at https://vmdev.cgit.vt.edu/ECVineyards, provide users with report generation capabilities that provide information on topographic, edaphic, and climatological features related to viticulture at a site-specific scale as well access to maps visualizing the those features at a regional scale. The current development website is a temporary location for the web application. By the end of 2013, the web application will be moved to a production server at Virginia Tech.

37
In the last year, the Report Generation Tool has been replaced with one that has capabilities to provide site-specific data for all of the states in the East Coast Region (previously it only supported Virginia) and now reports correct data for topographic and basic climatologic parameters.
A screen shot of the website in its current state.
A major task that has experienced a lot of progress in this past year was processing the SSURGO and STATSGO soils data at a regional scale for incorporation into the report generation tool. This is a complex process, especially for such a large region because it is a substantial dataset stored in a large number of relational tables. However, we have developed parameter aggregation scripts that automate the summarization of a list of viticulturally-relevant soil parameters and processed the majority of the study area at this point. The report generation code pertaining to soil properties was made available in July, 2013. Major improvements and additions have been made to the suite of Climate-related tools utilized in this study. An update on the existing tools is listed in the list below. Tools that are new within the past year are denoted by *.
NCDC Import Tool: Improved the NCDC fetching mechanism to include the new versions of weather data, and to connect to the NCDC Web Service for any type of weather data.
NCDC Generator: Only maintenance was completed on this recently. This tool is used to process NCDC data so that it is easily useable in the ArcGIS environment.
*Daily Surface Statistics Tool: This tool allows for the calculation of duration and frequency of specific weather events over a given study period.
CAI Model Calculator: This tool was mostly completed in the previous year, however was implemented this year to generate climatologically-aided interpolated rasters and feature classes based on NCDC stations and PRISM data. The tool allows for Krig or IDW interpolations.
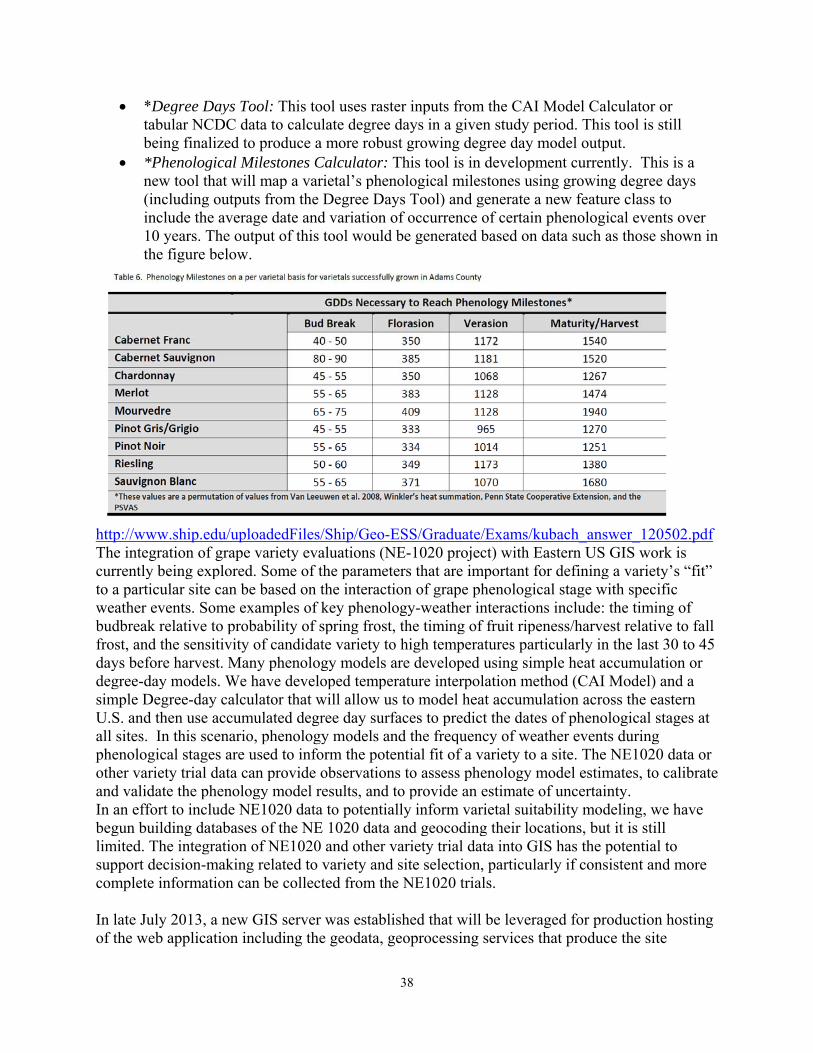
38
*Degree Days Tool: This tool uses raster inputs from the CAI Model Calculator or tabular NCDC data to calculate degree days in a given study period. This tool is still being finalized to produce a more robust growing degree day model output.
*Phenological Milestones Calculator: This tool is in development currently. This is a new tool that will map a varietal’s phenological milestones using growing degree days (including outputs from the Degree Days Tool) and generate a new feature class to include the average date and variation of occurrence of certain phenological events over 10 years. The output of this tool would be generated based on data such as those shown in the figure below.
http://www.ship.edu/uploadedFiles/Ship/Geo-ESS/Graduate/Exams/kubach_answer_120502.pdf The integration of grape variety evaluations (NE-1020 project) with Eastern US GIS work is currently being explored. Some of the parameters that are important for defining a variety’s “fit” to a particular site can be based on the interaction of grape phenological stage with specific weather events. Some examples of key phenology-weather interactions include: the timing of budbreak relative to probability of spring frost, the timing of fruit ripeness/harvest relative to fall frost, and the sensitivity of candidate variety to high temperatures particularly in the last 30 to 45 days before harvest. Many phenology models are developed using simple heat accumulation or degree-day models. We have developed temperature interpolation method (CAI Model) and a simple Degree-day calculator that will allow us to model heat accumulation across the eastern U.S. and then use accumulated degree day surfaces to predict the dates of phenological stages at all sites. In this scenario, phenology models and the frequency of weather events during phenological stages are used to inform the potential fit of a variety to a site. The NE1020 data or other variety trial data can provide observations to assess phenology model estimates, to calibrate and validate the phenology model results, and to provide an estimate of uncertainty. In an effort to include NE1020 data to potentially inform varietal suitability modeling, we have begun building databases of the NE 1020 data and geocoding their locations, but it is still limited. The integration of NE1020 and other variety trial data into GIS has the potential to support decision-making related to variety and site selection, particularly if consistent and more complete information can be collected from the NE1020 trials. In late July 2013, a new GIS server was established that will be leveraged for production hosting of the web application including the geodata, geoprocessing services that produce the site

39
analysis and report. A service level agreement with the Enterprise GIS group will help ensure that there is a specific period (to be determined) of hosting and storage available for the application during the funded project, and potentially longer. Our approach in developing the data and logic behind the application is to automate steps that will likely be repeated in the future using scripts. There will be a need for occasional maintenance and updates to the data and software application beyond the period of the project.
Summary comments for Objective #2b:
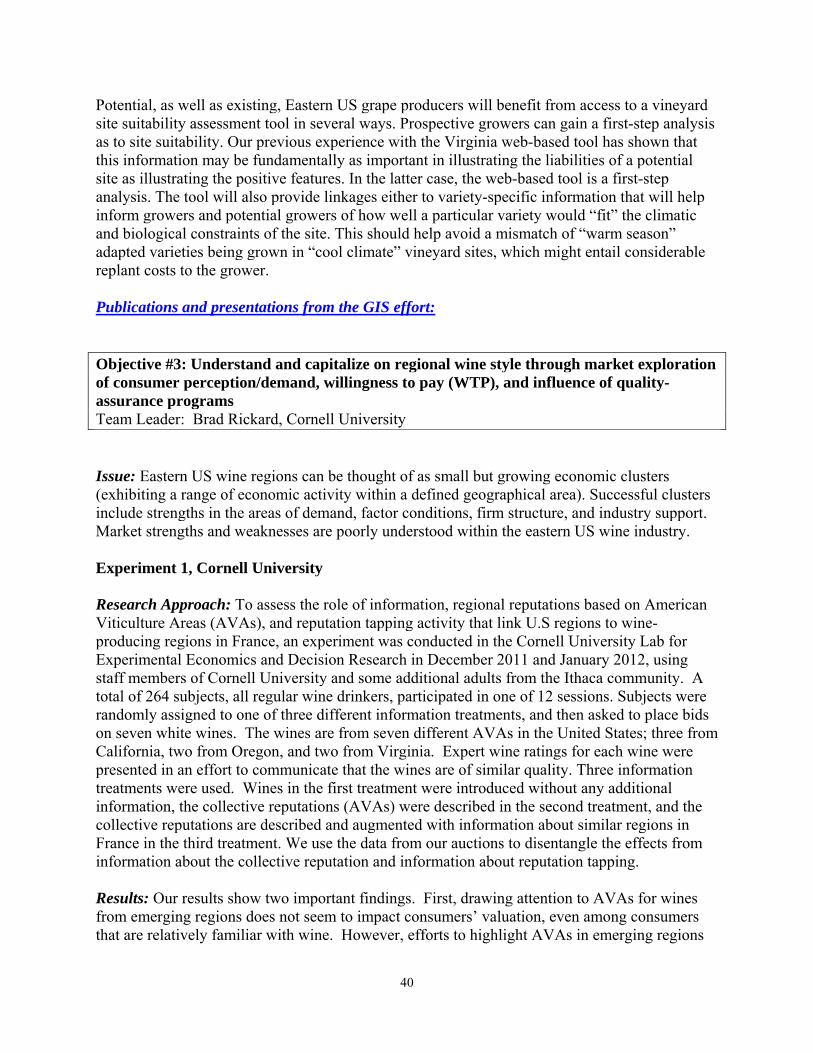
40
Potential, as well as existing, Eastern US grape producers will benefit from access to a vineyard site suitability assessment tool in several ways. Prospective growers can gain a first-step analysis as to site suitability. Our previous experience with the Virginia web-based tool has shown that this information may be fundamentally as important in illustrating the liabilities of a potential site as illustrating the positive features. In the latter case, the web-based tool is a first-step analysis. The tool will also provide linkages either to variety-specific information that will help inform growers and potential growers of how well a particular variety would “fit” the climatic and biological constraints of the site. This should help avoid a mismatch of “warm season” adapted varieties being grown in “cool climate” vineyard sites, which might entail considerable replant costs to the grower. Publications and presentations from the GIS effort: Objective #3: Understand and capitalize on regional wine style through market exploration of consumer perception/demand, willingness to pay (WTP), and influence of quality-assurance programs Team Leader: Brad Rickard, Cornell University Issue: Eastern US wine regions can be thought of as small but growing economic clusters (exhibiting a range of economic activity within a defined geographical area). Successful clusters include strengths in the areas of demand, factor conditions, firm structure, and industry support. Market strengths and weaknesses are poorly understood within the eastern US wine industry. Experiment 1, Cornell University Research Approach: To assess the role of information, regional reputations based on American Viticulture Areas (AVAs), and reputation tapping activity that link U.S regions to wine-producing regions in France, an experiment was conducted in the Cornell University Lab for Experimental Economics and Decision Research in December 2011 and January 2012, using staff members of Cornell University and some additional adults from the Ithaca community. A total of 264 subjects, all regular wine drinkers, participated in one of 12 sessions. Subjects were randomly assigned to one of three different information treatments, and then asked to place bids on seven white wines. The wines are from seven different AVAs in the United States; three from California, two from Oregon, and two from Virginia. Expert wine ratings for each wine were presented in an effort to communicate that the wines are of similar quality. Three information treatments were used. Wines in the first treatment were introduced without any additional information, the collective reputations (AVAs) were described in the second treatment, and the collective reputations are described and augmented with information about similar regions in France in the third treatment. We use the data from our auctions to disentangle the effects from information about the collective reputation and information about reputation tapping. Results: Our results show two important findings. First, drawing attention to AVAs for wines from emerging regions does not seem to impact consumers’ valuation, even among consumers that are relatively familiar with wine. However, efforts to highlight AVAs in emerging regions
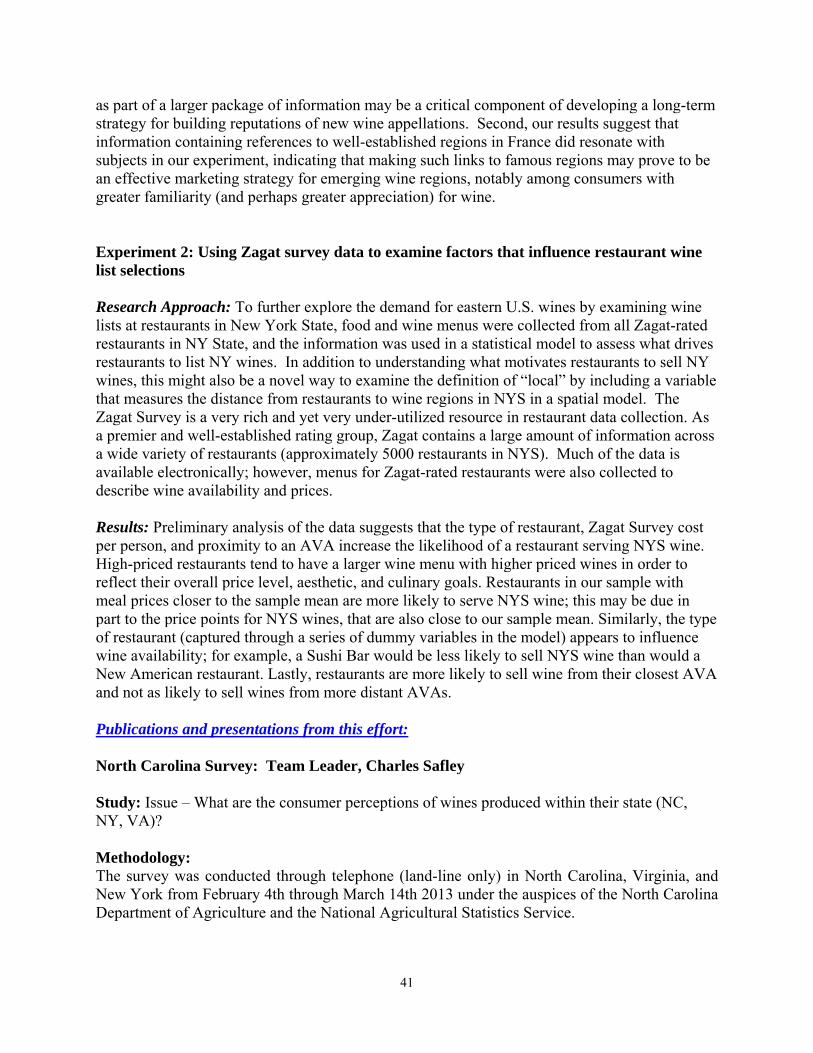
41
as part of a larger package of information may be a critical component of developing a long-term strategy for building reputations of new wine appellations. Second, our results suggest that information containing references to well-established regions in France did resonate with subjects in our experiment, indicating that making such links to famous regions may prove to be an effective marketing strategy for emerging wine regions, notably among consumers with greater familiarity (and perhaps greater appreciation) for wine. Experiment 2: Using Zagat survey data to examine factors that influence restaurant wine list selections Research Approach: To further explore the demand for eastern U.S. wines by examining wine lists at restaurants in New York State, food and wine menus were collected from all Zagat-rated restaurants in NY State, and the information was used in a statistical model to assess what drives restaurants to list NY wines. In addition to understanding what motivates restaurants to sell NY wines, this might also be a novel way to examine the definition of “local” by including a variable that measures the distance from restaurants to wine regions in NYS in a spatial model. The Zagat Survey is a very rich and yet very under-utilized resource in restaurant data collection. As a premier and well-established rating group, Zagat contains a large amount of information across a wide variety of restaurants (approximately 5000 restaurants in NYS). Much of the data is available electronically; however, menus for Zagat-rated restaurants were also collected to describe wine availability and prices. Results: Preliminary analysis of the data suggests that the type of restaurant, Zagat Survey cost per person, and proximity to an AVA increase the likelihood of a restaurant serving NYS wine. High-priced restaurants tend to have a larger wine menu with higher priced wines in order to reflect their overall price level, aesthetic, and culinary goals. Restaurants in our sample with meal prices closer to the sample mean are more likely to serve NYS wine; this may be due in part to the price points for NYS wines, that are also close to our sample mean. Similarly, the type of restaurant (captured through a series of dummy variables in the model) appears to influence wine availability; for example, a Sushi Bar would be less likely to sell NYS wine than would a New American restaurant. Lastly, restaurants are more likely to sell wine from their closest AVA and not as likely to sell wines from more distant AVAs. Publications and presentations from this effort: North Carolina Survey: Team Leader, Charles Safley Study: Issue – What are the consumer perceptions of wines produced within their state (NC, NY, VA)? Methodology: The survey was conducted through telephone (land-line only) in North Carolina, Virginia, and New York from February 4th through March 14th 2013 under the auspices of the North Carolina Department of Agriculture and the National Agricultural Statistics Service.
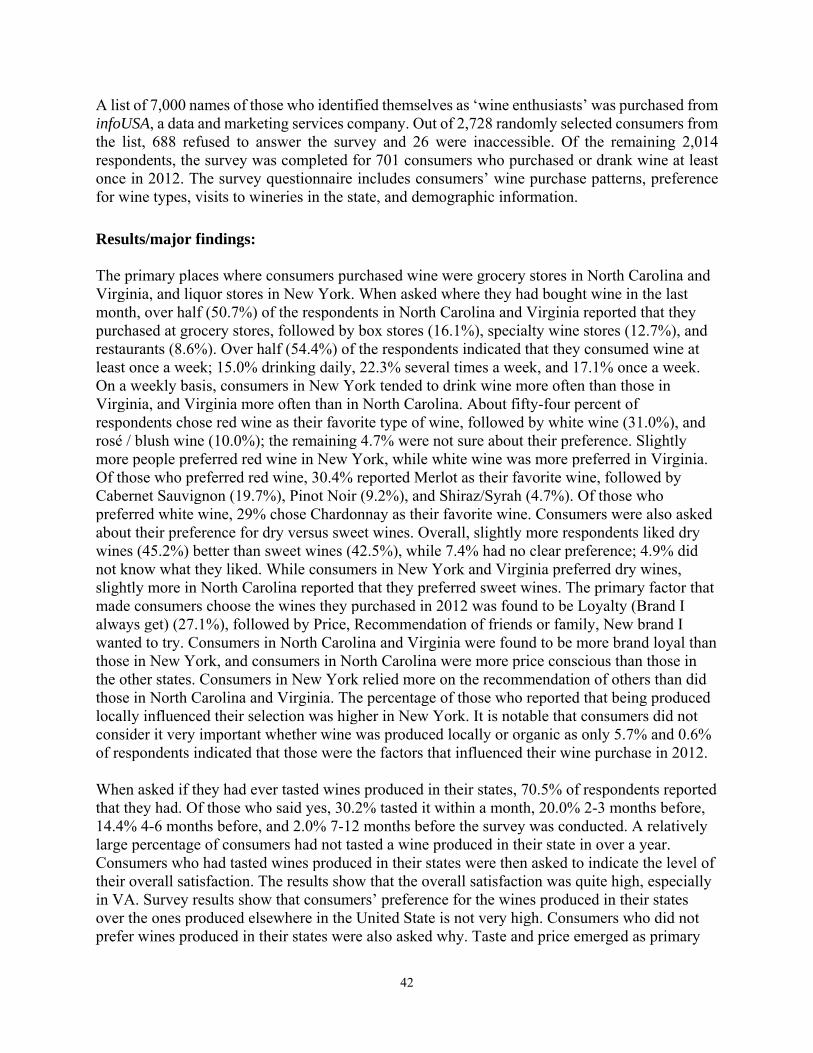
42
A list of 7,000 names of those who identified themselves as ‘wine enthusiasts’ was purchased from infoUSA, a data and marketing services company. Out of 2,728 randomly selected consumers from the list, 688 refused to answer the survey and 26 were inaccessible. Of the remaining 2,014 respondents, the survey was completed for 701 consumers who purchased or drank wine at least once in 2012. The survey questionnaire includes consumers’ wine purchase patterns, preference for wine types, visits to wineries in the state, and demographic information.
Results/major findings: The primary places where consumers purchased wine were grocery stores in North Carolina and Virginia, and liquor stores in New York. When asked where they had bought wine in the last month, over half (50.7%) of the respondents in North Carolina and Virginia reported that they purchased at grocery stores, followed by box stores (16.1%), specialty wine stores (12.7%), and restaurants (8.6%). Over half (54.4%) of the respondents indicated that they consumed wine at least once a week; 15.0% drinking daily, 22.3% several times a week, and 17.1% once a week. On a weekly basis, consumers in New York tended to drink wine more often than those in Virginia, and Virginia more often than in North Carolina. About fifty-four percent of respondents chose red wine as their favorite type of wine, followed by white wine (31.0%), and rosé / blush wine (10.0%); the remaining 4.7% were not sure about their preference. Slightly more people preferred red wine in New York, while white wine was more preferred in Virginia. Of those who preferred red wine, 30.4% reported Merlot as their favorite wine, followed by Cabernet Sauvignon (19.7%), Pinot Noir (9.2%), and Shiraz/Syrah (4.7%). Of those who preferred white wine, 29% chose Chardonnay as their favorite wine. Consumers were also asked about their preference for dry versus sweet wines. Overall, slightly more respondents liked dry wines (45.2%) better than sweet wines (42.5%), while 7.4% had no clear preference; 4.9% did not know what they liked. While consumers in New York and Virginia preferred dry wines, slightly more in North Carolina reported that they preferred sweet wines. The primary factor that made consumers choose the wines they purchased in 2012 was found to be Loyalty (Brand I always get) (27.1%), followed by Price, Recommendation of friends or family, New brand I wanted to try. Consumers in North Carolina and Virginia were found to be more brand loyal than those in New York, and consumers in North Carolina were more price conscious than those in the other states. Consumers in New York relied more on the recommendation of others than did those in North Carolina and Virginia. The percentage of those who reported that being produced locally influenced their selection was higher in New York. It is notable that consumers did not consider it very important whether wine was produced locally or organic as only 5.7% and 0.6% of respondents indicated that those were the factors that influenced their wine purchase in 2012. When asked if they had ever tasted wines produced in their states, 70.5% of respondents reported that they had. Of those who said yes, 30.2% tasted it within a month, 20.0% 2-3 months before, 14.4% 4-6 months before, and 2.0% 7-12 months before the survey was conducted. A relatively large percentage of consumers had not tasted a wine produced in their state in over a year. Consumers who had tasted wines produced in their states were then asked to indicate the level of their overall satisfaction. The results show that the overall satisfaction was quite high, especially in VA. Survey results show that consumers’ preference for the wines produced in their states over the ones produced elsewhere in the United State is not very high. Consumers who did not prefer wines produced in their states were also asked why. Taste and price emerged as primary

43
factors that affected their preference. 65.3% indicated that taste was the reason why they preferred wines produced elsewhere, while 16.7% indicated that price was the reason. Conclusions/Grower Industry Recommendations: The results should provide information to the wineries as to the demographics of their in-state wine consumers with regard to varietal preferences, purchase patterns, source of information (advertising) driving them to the wines and/or wineries for a visit. Publications and presentations from this work:
Objective #4: Develop a range of resources including decision-assisting tools to encourage implementation of production practices that improve grape and wine quality, decrease production costs, and improve the competitiveness of the Eastern US wine industry. Team Leader: Tremain Hatch, Virginia Tech Goals: The goal of the research component of this project is to provide solutions to fundamental constraints to grape and quality wine production in the East. The goal of the Extension component is the informed transformation of those solutions by industry members into sustainable practices for the production of high quality, regionally branded wines that compete favorably in the market. We continue to pursue the Extension component of this project through manifold approaches: 1) Annual meetings of project staff and the Project Advisory Council: We assembled a Project Advisory Council (PAC) to provide input and to monitor the project’s progress. Members of the PAC attended the PI meeting in Mystic CT in November 2012 and summarized their impression of progress and recommendations in a follow-up letter. Two PAC members were specifically invited to attend an interim PI meeting in Winston-Salem NC in July 2013, following the Eastern Section meeting of the ASEV. One PAC member, Mr. Jim Benefiel, was interviewed as part of a Virginia Tech news story on the development of the Eastern US viticultural GIS tool (http://www.vt.edu/spotlight/innovation/2013-09-16-grapes/gis.html). PAC members will be invited to attend one of four regional “Research Summits” now planned for February 2014, to be held in concert with industry annual meetings in NC, VA, OH and NY. 2) Panel Survey of Eastern grape wine growers in Years 1 and 4: Dr. Jayaratne, the project evaluator, collected input from other participants in the SCRI and developed a baseline survey instrument to determine the status of knowledge of the eastern US grape industry in year one (see year-one report). Concept awareness questions focused on grapevine canopy management strategies, winemaking issues, site and cultivar interaction, and wine marketing issues. This survey study was conducted with 1,094 wine grape growers and wine makers in 13 states in eastern US. The target audience was selected from membership lists of grower associations and wineries in sub-regions, and will reflect the demographics, grape varietal mix, and market objectives of each group. The survey instrument was executed through the VT Survey Center and results returned to Dr. Jayratne for evaluation. The survey will be repeated in year 4, including additional questions regarding respondent exposure to and use of information provided
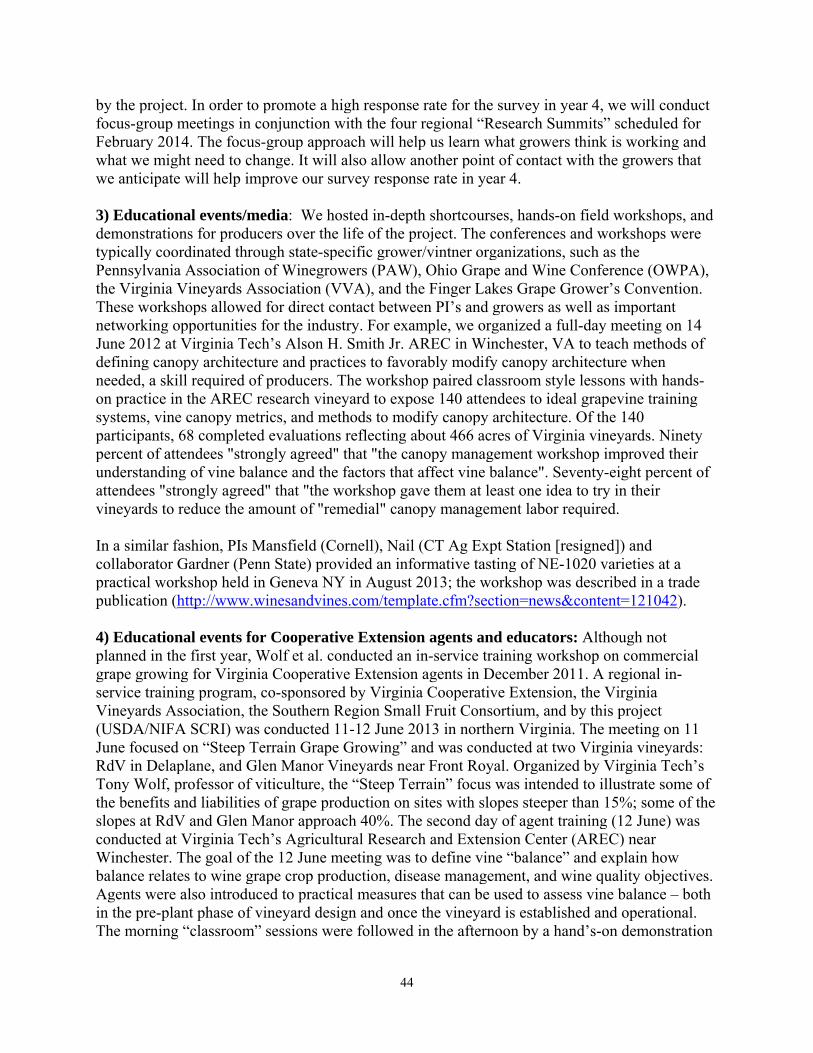
44
by the project. In order to promote a high response rate for the survey in year 4, we will conduct focus-group meetings in conjunction with the four regional “Research Summits” scheduled for February 2014. The focus-group approach will help us learn what growers think is working and what we might need to change. It will also allow another point of contact with the growers that we anticipate will help improve our survey response rate in year 4. 3) Educational events/media: We hosted in-depth shortcourses, hands-on field workshops, and demonstrations for producers over the life of the project. The conferences and workshops were typically coordinated through state-specific grower/vintner organizations, such as the Pennsylvania Association of Winegrowers (PAW), Ohio Grape and Wine Conference (OWPA), the Virginia Vineyards Association (VVA), and the Finger Lakes Grape Grower’s Convention. These workshops allowed for direct contact between PI’s and growers as well as important networking opportunities for the industry. For example, we organized a full-day meeting on 14 June 2012 at Virginia Tech’s Alson H. Smith Jr. AREC in Winchester, VA to teach methods of defining canopy architecture and practices to favorably modify canopy architecture when needed, a skill required of producers. The workshop paired classroom style lessons with hands-on practice in the AREC research vineyard to expose 140 attendees to ideal grapevine training systems, vine canopy metrics, and methods to modify canopy architecture. Of the 140 participants, 68 completed evaluations reflecting about 466 acres of Virginia vineyards. Ninety percent of attendees "strongly agreed" that "the canopy management workshop improved their understanding of vine balance and the factors that affect vine balance". Seventy-eight percent of attendees "strongly agreed" that "the workshop gave them at least one idea to try in their vineyards to reduce the amount of "remedial" canopy management labor required. In a similar fashion, PIs Mansfield (Cornell), Nail (CT Ag Expt Station [resigned]) and collaborator Gardner (Penn State) provided an informative tasting of NE-1020 varieties at a practical workshop held in Geneva NY in August 2013; the workshop was described in a trade publication (http://www.winesandvines.com/template.cfm?section=news&content=121042). 4) Educational events for Cooperative Extension agents and educators: Although not planned in the first year, Wolf et al. conducted an in-service training workshop on commercial grape growing for Virginia Cooperative Extension agents in December 2011. A regional in-service training program, co-sponsored by Virginia Cooperative Extension, the Virginia Vineyards Association, the Southern Region Small Fruit Consortium, and by this project (USDA/NIFA SCRI) was conducted 11-12 June 2013 in northern Virginia. The meeting on 11 June focused on “Steep Terrain Grape Growing” and was conducted at two Virginia vineyards: RdV in Delaplane, and Glen Manor Vineyards near Front Royal. Organized by Virginia Tech’s Tony Wolf, professor of viticulture, the “Steep Terrain” focus was intended to illustrate some of the benefits and liabilities of grape production on sites with slopes steeper than 15%; some of the slopes at RdV and Glen Manor approach 40%. The second day of agent training (12 June) was conducted at Virginia Tech’s Agricultural Research and Extension Center (AREC) near Winchester. The goal of the 12 June meeting was to define vine “balance” and explain how balance relates to wine grape crop production, disease management, and wine quality objectives. Agents were also introduced to practical measures that can be used to assess vine balance – both in the pre-plant phase of vineyard design and once the vineyard is established and operational. The morning “classroom” sessions were followed in the afternoon by a hand’s-on demonstration
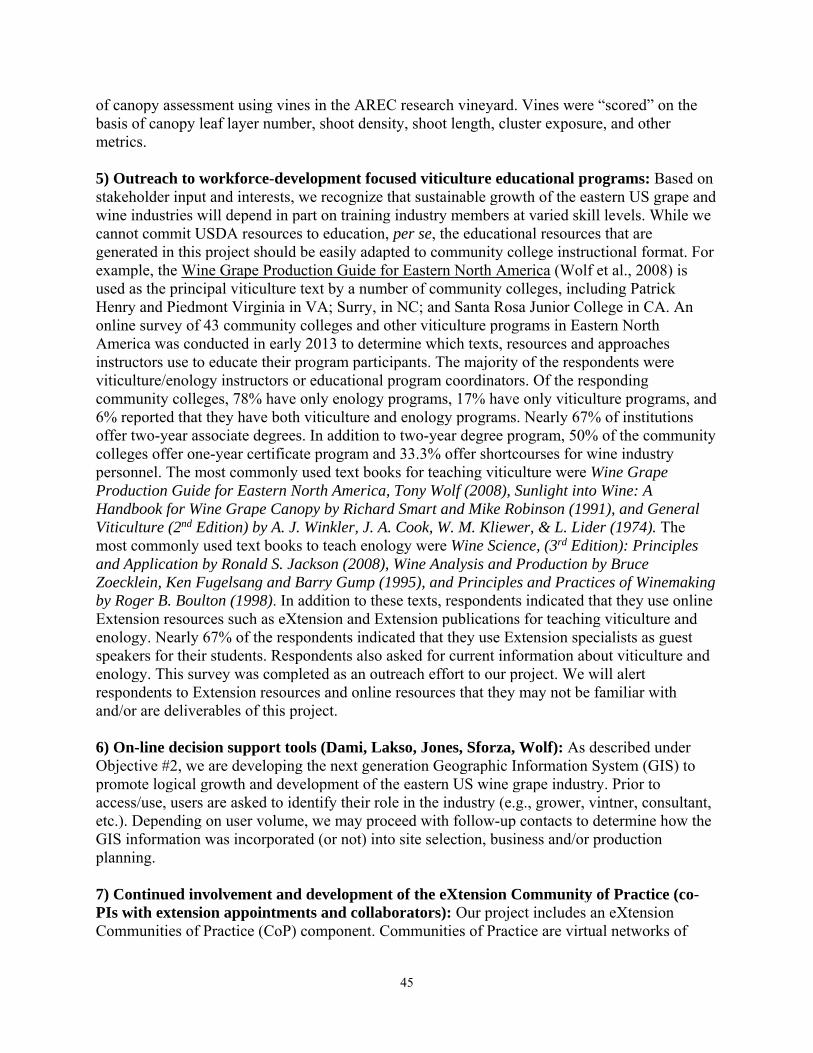
45
of canopy assessment using vines in the AREC research vineyard. Vines were “scored” on the basis of canopy leaf layer number, shoot density, shoot length, cluster exposure, and other metrics. 5) Outreach to workforce-development focused viticulture educational programs: Based on stakeholder input and interests, we recognize that sustainable growth of the eastern US grape and wine industries will depend in part on training industry members at varied skill levels. While we cannot commit USDA resources to education, per se, the educational resources that are generated in this project should be easily adapted to community college instructional format. For example, the Wine Grape Production Guide for Eastern North America (Wolf et al., 2008) is used as the principal viticulture text by a number of community colleges, including Patrick Henry and Piedmont Virginia in VA; Surry, in NC; and Santa Rosa Junior College in CA. An online survey of 43 community colleges and other viticulture programs in Eastern North America was conducted in early 2013 to determine which texts, resources and approaches instructors use to educate their program participants. The majority of the respondents were viticulture/enology instructors or educational program coordinators. Of the responding community colleges, 78% have only enology programs, 17% have only viticulture programs, and 6% reported that they have both viticulture and enology programs. Nearly 67% of institutions offer two-year associate degrees. In addition to two-year degree program, 50% of the community colleges offer one-year certificate program and 33.3% offer shortcourses for wine industry personnel. The most commonly used text books for teaching viticulture were Wine Grape Production Guide for Eastern North America, Tony Wolf (2008), Sunlight into Wine: A Handbook for Wine Grape Canopy by Richard Smart and Mike Robinson (1991), and General Viticulture (2nd Edition) by A. J. Winkler, J. A. Cook, W. M. Kliewer, & L. Lider (1974). The most commonly used text books to teach enology were Wine Science, (3rd Edition): Principles and Application by Ronald S. Jackson (2008), Wine Analysis and Production by Bruce Zoecklein, Ken Fugelsang and Barry Gump (1995), and Principles and Practices of Winemaking by Roger B. Boulton (1998). In addition to these texts, respondents indicated that they use online Extension resources such as eXtension and Extension publications for teaching viticulture and enology. Nearly 67% of the respondents indicated that they use Extension specialists as guest speakers for their students. Respondents also asked for current information about viticulture and enology. This survey was completed as an outreach effort to our project. We will alert respondents to Extension resources and online resources that they may not be familiar with and/or are deliverables of this project. 6) On-line decision support tools (Dami, Lakso, Jones, Sforza, Wolf): As described under Objective #2, we are developing the next generation Geographic Information System (GIS) to promote logical growth and development of the eastern US wine grape industry. Prior to access/use, users are asked to identify their role in the industry (e.g., grower, vintner, consultant, etc.). Depending on user volume, we may proceed with follow-up contacts to determine how the GIS information was incorporated (or not) into site selection, business and/or production planning. 7) Continued involvement and development of the eXtension Community of Practice (co-PIs with extension appointments and collaborators): Our project includes an eXtension Communities of Practice (CoP) component. Communities of Practice are virtual networks of
46
individuals who share common interests, and learn together by sharing experiences and knowledge. The majority of our PI’s are involved in the Grape Community of Practice which develops material for eXtension’s grape content: eViticulture. The site has seen substantial traffic – the grapes component has had 522,770 visitors since going online, with an average of two minutes and eight seconds spent per page. Check out the eViticulture portal at: http://eviticulture.org/. This SCRI project director and coordinator hosted the annual eViticulture and NVEELC meeting in Richmond VA 11 March 2013, and will do so again in March 2016. Seventeen members of the Grape Community of Practice (GCoP) attended from 13 institutions across the US and Canada. 8) Development of vineyard capacity assessment resources (Lakso and Wolf) and additional canopy architecture metrics (Vanden Heuvel): A practical method to estimate vineyard capacities as well as cluster light environment will be developed as a deliverable for the project using the methods discussed in Objective #1b. The grower will be guided to 1) take dimensions of their vineyard (spacing, trellis height, canopy thickness) to find the estimate of potential light interception on a graph; 2) estimate their trellis fill by choosing a photograph that most closely represents their vineyard; and 3) entering the potential and the trellis fill values into a simple equation in a spreadsheet or on a website. The calculated value will estimate the largest crop that can be ripened. Although each unique set of vineyard and weather conditions will vary, this quantitative method will provide a beginning point for site-specific management. The vineyard capacity estimation process and canopy architecture determination metrics will be explained and demonstrated at winter meetings, in small group sessions and via the web tutorials. The project will assess grower use of these grower tools through end-of-session feedback tools. 9) Leadership development and knowledge transfer (all co-PIs): We consider the training of graduate students to be an important outcome of this research, as these students will be needed to assume vital industry and academic roles in the future to sustain the growth and development of the Eastern wine-grape industry. A number of graduate students and two post-doctoral research associates are supported on this project, including (PI advisor in parentheses): Cornell: Joe Perla, MSc candidate (Rickard) Dr. David C. Manns, post-doctoral research associate (Mansfield) Céline Coquard Lenerz, MSc degree (5/12) (Mansfield) Diane M. Schmitt, MSc candidate (Mansfield) Dr. James Meyers, post-doctoral research associate (Vanden Heuvel) Ms. Rebecca Sirianni, MSc degree, “Vineyard floor management effects on vine balance, soil quality and onsite retention of nutrients” (Vanden Heuvel) Mr. Adam Karl, MSc candidate (Vanden Heuvel) North Carolina State University: Mr. Nick Basinger, projected completion 5/15 (Jennings, Monks) Mr. Kevin Elder, projected completion 5/15 (Spayd) Jeonghoi Heo (Safley) Ohio State University:
47
Dr. Yi Zhang, PhD, aspects of NE-1020 variety evaluation Shouxin Li, MSc continuation of Zhang work with NE-1020 Ms. Abigail Gerdes, MSc candidate in GIS Virginia Tech: Mr. Cain Hickey, MSc degree (2012), now PhD student, projected completion 6/16 (Wolf) Mr. James Russell Moss, dual MSc degrees in horticulture and food science, 5/2016 Ms. DeAnna D’Attilio, MSc candidate, projected completion 2/14 (Wolf) Mr. Kyle Schutt, MSc candidate, Computer Science (2016) Ms. Jayashree Surendrababu, MSc, Geography (2014)
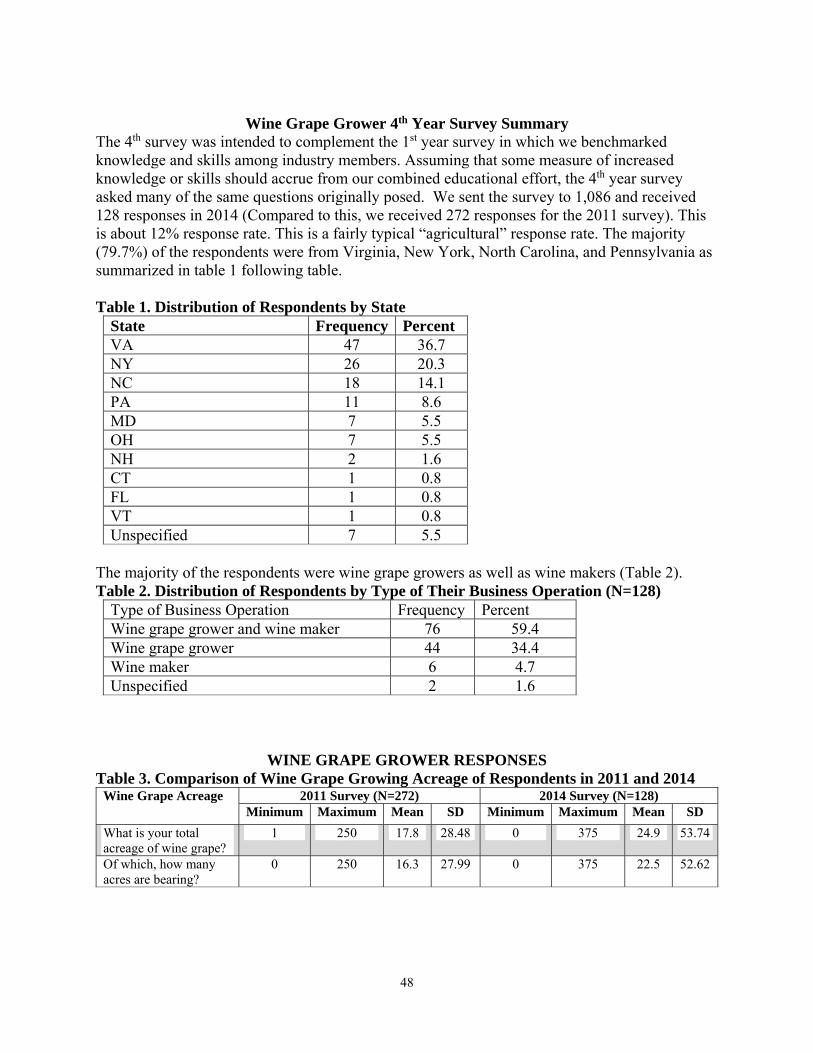
48
Wine Grape Grower 4th Year Survey Summary
The 4th survey was intended to complement the 1st year survey in which we benchmarked knowledge and skills among industry members. Assuming that some measure of increased knowledge or skills should accrue from our combined educational effort, the 4th year survey asked many of the same questions originally posed. We sent the survey to 1,086 and received 128 responses in 2014 (Compared to this, we received 272 responses for the 2011 survey). This is about 12% response rate. This is a fairly typical “agricultural” response rate. The majority (79.7%) of the respondents were from Virginia, New York, North Carolina, and Pennsylvania as summarized in table 1 following table. Table 1. Distribution of Respondents by State
State Frequency Percent VA 47 36.7 NY 26 20.3 NC 18 14.1 PA 11 8.6 MD 7 5.5 OH 7 5.5 NH 2 1.6 CT 1 0.8 FL 1 0.8 VT 1 0.8 Unspecified 7 5.5
The majority of the respondents were wine grape growers as well as wine makers (Table 2). Table 2. Distribution of Respondents by Type of Their Business Operation (N=128)
Type of Business Operation Frequency Percent Wine grape grower and wine maker 76 59.4 Wine grape grower 44 34.4 Wine maker 6 4.7 Unspecified 2 1.6
WINE GRAPE GROWER RESPONSES Table 3. Comparison of Wine Grape Growing Acreage of Respondents in 2011 and 2014
Wine Grape Acreage 2011 Survey (N=272) 2014 Survey (N=128) Minimum Maximum Mean SD Minimum Maximum Mean SD
What is your total acreage of wine grape?
1 250 17.8 28.48 0 375 24.9 53.74
Of which, how many acres are bearing?
0 250 16.3 27.99 0 375 22.5 52.62

49
Comparison of Grape Growers’ Knowledge about Related Topics in 2011 and 2014 Comparison of grape growers’ responses for 2011 and 2014 surveys indicates grape growers’ increased levels of knowledge related to all the topics except two as summarized in table 4. Please circle the appropriate number to indicate your level of knowledge about the following topics. The Scale used for rating:
1. Very Low = Don’t know anything about this topic. 2. Low = Know very little about this topic 3. Moderate = Know about this topic but there are more things to learn 4. High = Have good knowledge but there are things to learn 5. Very High = Know almost everything about this topic Table 4. Comparison of Grape Growers’ Responses to Knowledge Assessment Questions in 2011 and 2014
How do you rate your knowledge about: 2011 (N=232) 2014 (N=118) Mean Difference (Change in Knowledge) Mean SD Mean SD
Assessing grapevine canopy characteristics associated
with high fruit quality?
3.50 0.894 3.77 0.767 0.27
Practical measures to regulate vine vegetative development to achieve optimal canopy characteristics?
3.35 0.913 3.52 0.834 0.17
The relationship between fruit/wine quality and crop level in vineyards that exhibit variable vine size and vigor?
3.39 0.926 3.64 0.843 0.25
Vine balance and how to measure it. 3.19 0.924 3.46 0.927 0.27
The most efficient methods of assessing vine nitrogen
status?
2.85 0.941 2.92 0.907 0.07
The key factors determining the selection of varieties in relation to site characteristics?
3.22 0.922 3.41 0.970 0.19
Competitiveness of weeds and ground cover with
grapevines?
3.57 0.845 3.52 0.877 -0.05
Specific canopy management practices that can help
manage fungal diseases?
3.63 0.970 3.85 0.883 0.22
The effect of planting decisions (site, cultivar, spacing, and clone) on subsequent disease management needs?
3.40 0.922 3.53 0.906 0.13
Cold hardiness of grapevines (i.e. cold acclimation, dormancy) and cold injury protection methods.
3.37 0.925 3.41 0.933 0.04
Grape and wine information resources such as Extension, associations etc. in your state.
3.80 0.906 4.01 0.886 0.21
Viticultural Communities of Practice (CoP) on the
USDA’s eXtension website?
2.06 0.933 2.04 0.977 -0.02
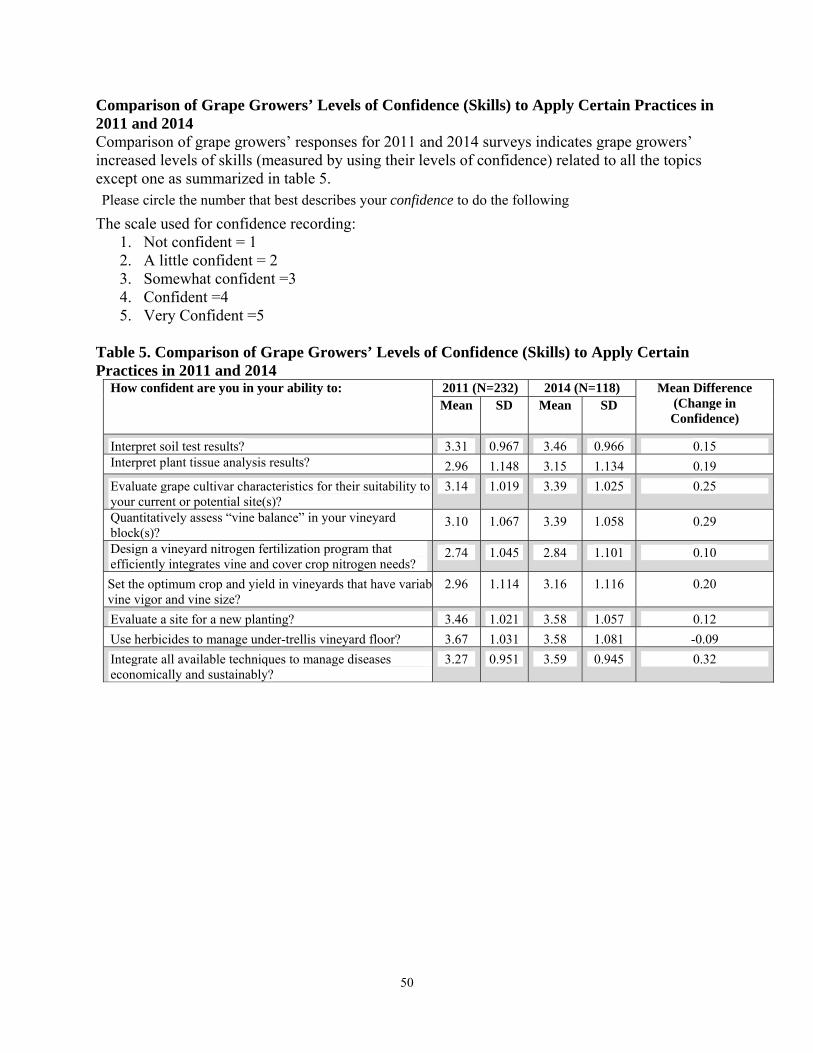
50
Comparison of Grape Growers’ Levels of Confidence (Skills) to Apply Certain Practices in 2011 and 2014 Comparison of grape growers’ responses for 2011 and 2014 surveys indicates grape growers’ increased levels of skills (measured by using their levels of confidence) related to all the topics except one as summarized in table 5. Please circle the number that best describes your confidence to do the following
The scale used for confidence recording: 1. Not confident = 1 2. A little confident = 2 3. Somewhat confident =3 4. Confident =4 5. Very Confident =5
Table 5. Comparison of Grape Growers’ Levels of Confidence (Skills) to Apply Certain Practices in 2011 and 2014
How confident are you in your ability to: 2011 (N=232) 2014 (N=118) Mean Difference (Change in Confidence)
Mean SD Mean SD
Interpret soil test results? 3.31 0.967 3.46 0.966 0.15 Interpret plant tissue analysis results? 2.96 1.148 3.15 1.134 0.19
Evaluate grape cultivar characteristics for their suitability to your current or potential site(s)?
3.14 1.019 3.39 1.025 0.25
Quantitatively assess “vine balance” in your vineyard block(s)?
3.10 1.067 3.39 1.058 0.29
Design a vineyard nitrogen fertilization program that efficiently integrates vine and cover crop nitrogen needs?
2.74 1.045 2.84 1.101 0.10
Set the optimum crop and yield in vineyards that have variabvine vigor and vine size?
2.96 1.114 3.16 1.116 0.20
Evaluate a site for a new planting? 3.46 1.021 3.58 1.057 0.12
Use herbicides to manage under-trellis vineyard floor? 3.67 1.031 3.58 1.081 -0.09
Integrate all available techniques to manage diseases economically and sustainably?
3.27 0.951 3.59 0.945 0.32
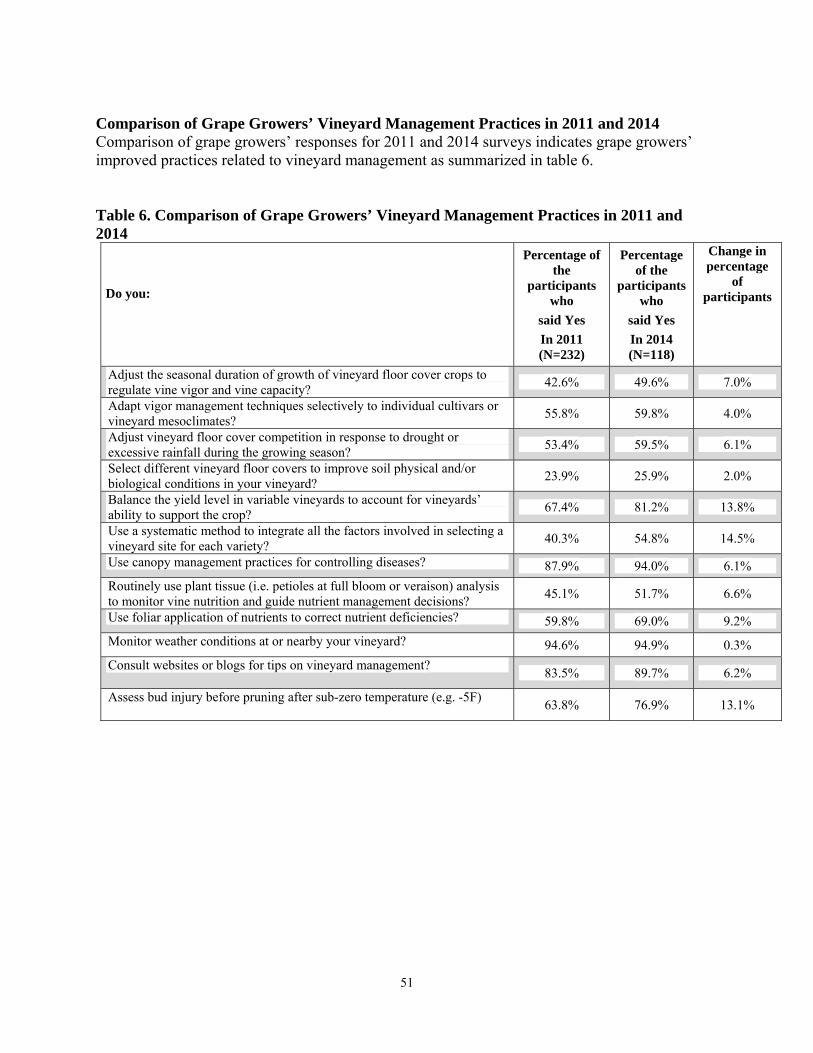
51
Comparison of Grape Growers’ Vineyard Management Practices in 2011 and 2014 Comparison of grape growers’ responses for 2011 and 2014 surveys indicates grape growers’ improved practices related to vineyard management as summarized in table 6. Table 6. Comparison of Grape Growers’ Vineyard Management Practices in 2011 and 2014
Do you:
Percentage of the
participants who
said Yes
In 2011 (N=232)
Percentage of the
participants who
said Yes
In 2014 (N=118)
Change in percentage
of participants
Adjust the seasonal duration of growth of vineyard floor cover crops to regulate vine vigor and vine capacity?
42.6% 49.6% 7.0%
Adapt vigor management techniques selectively to individual cultivars or vineyard mesoclimates?
55.8% 59.8% 4.0%
Adjust vineyard floor cover competition in response to drought or excessive rainfall during the growing season?
53.4% 59.5% 6.1%
Select different vineyard floor covers to improve soil physical and/or biological conditions in your vineyard?
23.9% 25.9% 2.0%
Balance the yield level in variable vineyards to account for vineyards’ ability to support the crop?
67.4% 81.2% 13.8%
Use a systematic method to integrate all the factors involved in selecting a vineyard site for each variety?
40.3% 54.8% 14.5%
Use canopy management practices for controlling diseases? 87.9% 94.0% 6.1%
Routinely use plant tissue (i.e. petioles at full bloom or veraison) analysis to monitor vine nutrition and guide nutrient management decisions?
45.1% 51.7% 6.6%
Use foliar application of nutrients to correct nutrient deficiencies? 59.8% 69.0% 9.2%
Monitor weather conditions at or nearby your vineyard? 94.6% 94.9% 0.3%
Consult websites or blogs for tips on vineyard management? 83.5% 89.7% 6.2%
Assess bud injury before pruning after sub-zero temperature (e.g. -5F) 63.8% 76.9% 13.1%
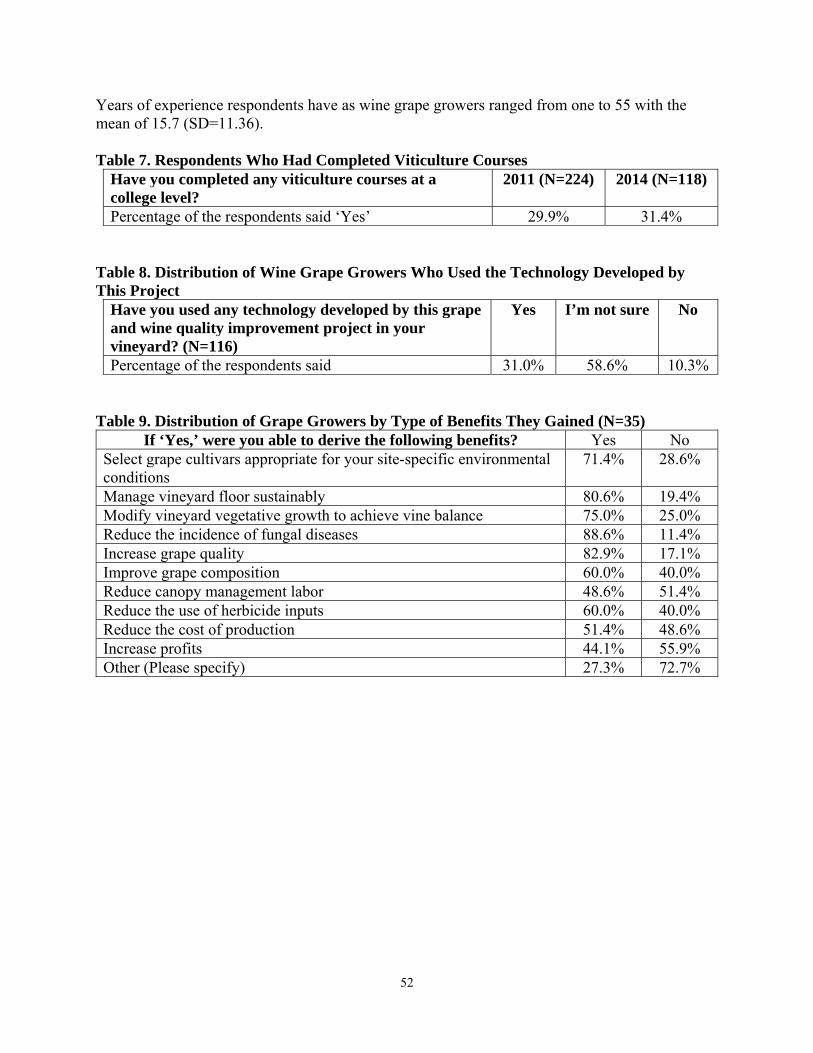
52
Years of experience respondents have as wine grape growers ranged from one to 55 with the mean of 15.7 (SD=11.36). Table 7. Respondents Who Had Completed Viticulture Courses
Have you completed any viticulture courses at a college level?
2011 (N=224) 2014 (N=118)
Percentage of the respondents said ‘Yes’ 29.9% 31.4% Table 8. Distribution of Wine Grape Growers Who Used the Technology Developed by This Project
Have you used any technology developed by this grape and wine quality improvement project in your vineyard? (N=116)
Yes I’m not sure No
Percentage of the respondents said 31.0% 58.6% 10.3% Table 9. Distribution of Grape Growers by Type of Benefits They Gained (N=35)
If ‘Yes,’ were you able to derive the following benefits? Yes No Select grape cultivars appropriate for your site-specific environmental conditions
71.4% 28.6%
Manage vineyard floor sustainably 80.6% 19.4% Modify vineyard vegetative growth to achieve vine balance 75.0% 25.0% Reduce the incidence of fungal diseases 88.6% 11.4% Increase grape quality 82.9% 17.1% Improve grape composition 60.0% 40.0% Reduce canopy management labor 48.6% 51.4% Reduce the use of herbicide inputs 60.0% 40.0% Reduce the cost of production 51.4% 48.6% Increase profits 44.1% 55.9% Other (Please specify) 27.3% 72.7%

53
Project Outcomes Revealed by the Results of Benchmark Survey and the 4th Year Survey We conducted two surveys with wine makers and grape growers in the eastern U. S. to determine the outcomes of the USDA funded “Improved grape and wine quality in a challenging environment: An eastern US model for sustainability and economic vitality” grant project. The first survey was conducted in 2011 to benchmark the level of knowledge, skills, and practices of the eastern U. S. wine makers and grape growers. The fourth year survey was conducted to determine the extent to which those outcome indicators (knowledge, skills, and practices) changed after implementing the research and outreach activities of this project in the region in 2014. Both of these surveys were sent to 1,086 winemakers/grape growers in the region. The first-year survey received 272 responses (25% response rate) while the fourth year survey received 128 responses (12% response rate). The majority of the responses received for both surveys from Virginia, New York, North Carolina, Maryland, and Pennsylvania. About 58% of the respondents were wine makers as well as grape growers. About 35% of the respondents were grape growers.
Outcomes on Grape Growers
Thirty-one percent of the respondents said they had used the technology developed by this project. Of them, the majority reported they used the developed technology to ‘reduce the incidence of fungal diseases;’ ‘increase grape quality;’ ‘manage vineyard floor sustainably;’ ‘modify vineyard vegetative growth to achieve vine balance;’ ‘select grape cultivars appropriate for their site-specific environmental conditions;’ ‘improve grape composition;’ ‘reduce the use of herbicide inputs;’ and ‘reduce the cost of production.’ Knowledge Improvement
The comparison of the first year and fourth year survey results indicates grape growers have improved their knowledge about ‘assessing grapevine canopy characteristics associated with high fruit quality;’ ‘practical measures to regulate vine vegetative development to achieve optimal canopy characteristics;’ ‘the relationship between fruit/wine quality and crop level in vineyards that exhibit variable vine size and vigor;’ ‘vine balance and how to measure it;’ ‘the key factors determining the selection of varieties in relation to site characteristics;’ ‘specific canopy management practices that can help manage fungal diseases;’ ‘the effect of planting decisions (site, cultivar, spacing, and clone) on subsequent disease management needs;’ and ‘grape and wine information resources such as Extension, associations etc. in their state.’ Skill Development
The comparison of the results of two surveys shows grape growers were able to develop their ability to ‘interpret soil test results and plant tissue analysis results;’ ‘evaluate grape cultivar characteristics for their suitability to current or potential sites;’ ‘quantitatively assess vine balance in their vineyard blocks;’ ‘design a vineyard nitrogen fertilization program that efficiently integrates vine and cover crop nitrogen needs;’ ‘set the optimum crop and yield in vineyards that have variable vine vigor and vine size;’ ‘evaluate a site for a new planting;’ and ‘integrate all available techniques to manage diseases economically and sustainably.’
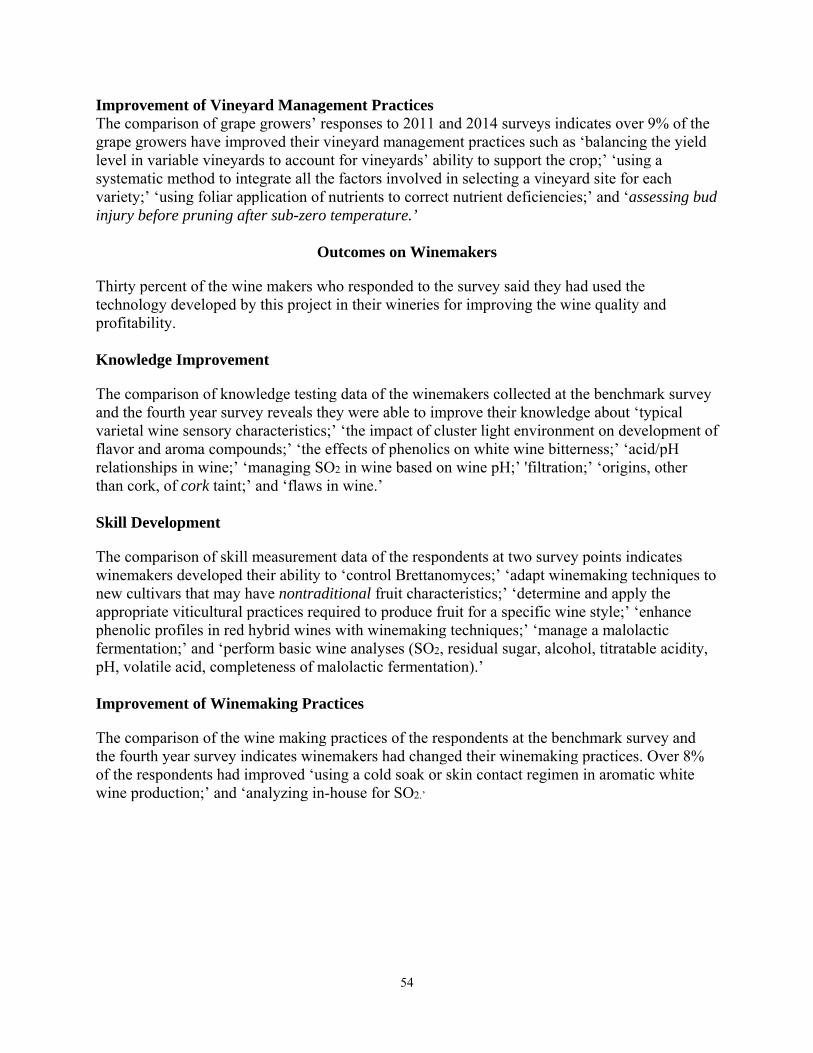
54
Improvement of Vineyard Management Practices The comparison of grape growers’ responses to 2011 and 2014 surveys indicates over 9% of the grape growers have improved their vineyard management practices such as ‘balancing the yield level in variable vineyards to account for vineyards’ ability to support the crop;’ ‘using a systematic method to integrate all the factors involved in selecting a vineyard site for each variety;’ ‘using foliar application of nutrients to correct nutrient deficiencies;’ and ‘assessing bud injury before pruning after sub-zero temperature.’
Outcomes on Winemakers
Thirty percent of the wine makers who responded to the survey said they had used the technology developed by this project in their wineries for improving the wine quality and profitability. Knowledge Improvement
The comparison of knowledge testing data of the winemakers collected at the benchmark survey and the fourth year survey reveals they were able to improve their knowledge about ‘typical varietal wine sensory characteristics;’ ‘the impact of cluster light environment on development of flavor and aroma compounds;’ ‘the effects of phenolics on white wine bitterness;’ ‘acid/pH relationships in wine;’ ‘managing SO2 in wine based on wine pH;’ 'filtration;’ ‘origins, other than cork, of cork taint;’ and ‘flaws in wine.’ Skill Development
The comparison of skill measurement data of the respondents at two survey points indicates winemakers developed their ability to ‘control Brettanomyces;’ ‘adapt winemaking techniques to new cultivars that may have nontraditional fruit characteristics;’ ‘determine and apply the appropriate viticultural practices required to produce fruit for a specific wine style;’ ‘enhance phenolic profiles in red hybrid wines with winemaking techniques;’ ‘manage a malolactic fermentation;’ and ‘perform basic wine analyses (SO2, residual sugar, alcohol, titratable acidity, pH, volatile acid, completeness of malolactic fermentation).’ Improvement of Winemaking Practices
The comparison of the wine making practices of the respondents at the benchmark survey and the fourth year survey indicates winemakers had changed their winemaking practices. Over 8% of the respondents had improved ‘using a cold soak or skin contact regimen in aromatic white wine production;’ and ‘analyzing in-house for SO2.’
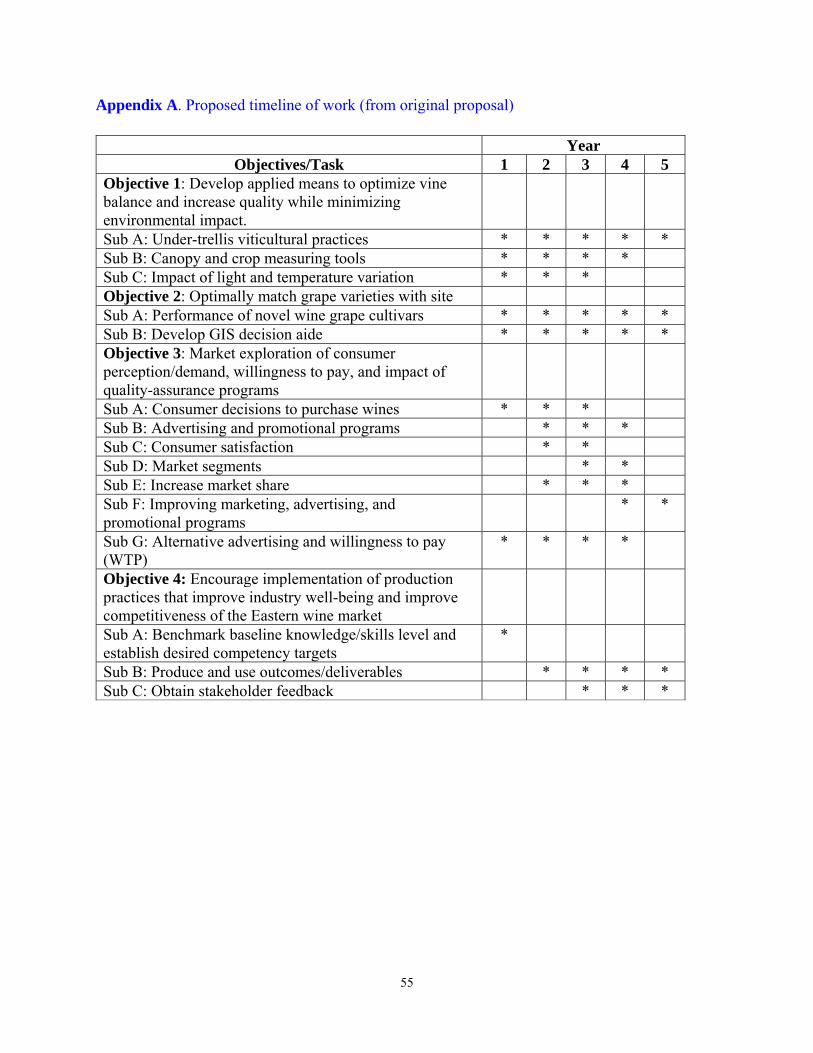
55
Appendix A. Proposed timeline of work (from original proposal) Year
Objectives/Task 1 2 3 4 5 Objective 1: Develop applied means to optimize vine balance and increase quality while minimizing environmental impact.
Sub A: Under-trellis viticultural practices * * * * * Sub B: Canopy and crop measuring tools * * * * Sub C: Impact of light and temperature variation * * * Objective 2: Optimally match grape varieties with site Sub A: Performance of novel wine grape cultivars * * * * * Sub B: Develop GIS decision aide * * * * * Objective 3: Market exploration of consumer perception/demand, willingness to pay, and impact of quality-assurance programs
Sub A: Consumer decisions to purchase wines * * * Sub B: Advertising and promotional programs * * * Sub C: Consumer satisfaction * * Sub D: Market segments * * Sub E: Increase market share * * * Sub F: Improving marketing, advertising, and promotional programs
* *
Sub G: Alternative advertising and willingness to pay (WTP)
* * * *
Objective 4: Encourage implementation of production practices that improve industry well-being and improve competitiveness of the Eastern wine market
Sub A: Benchmark baseline knowledge/skills level and establish desired competency targets
*
Sub B: Produce and use outcomes/deliverables * * * * Sub C: Obtain stakeholder feedback * * *
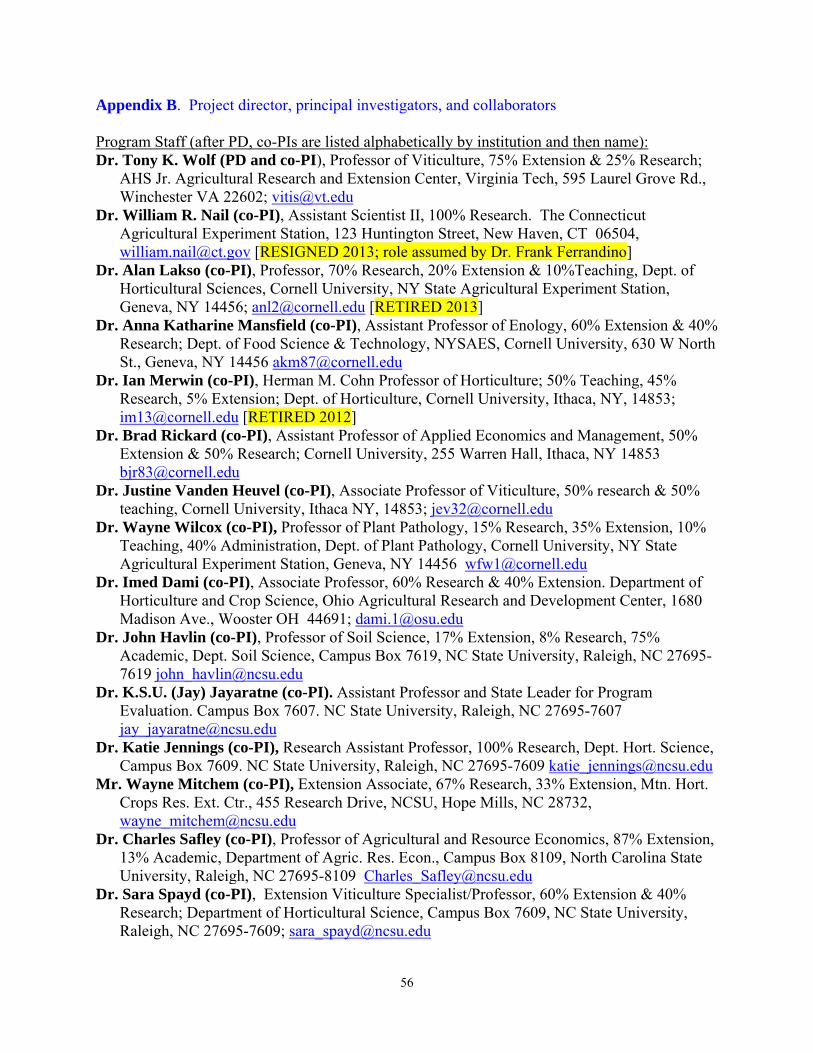
56
Appendix B. Project director, principal investigators, and collaborators Program Staff (after PD, co-PIs are listed alphabetically by institution and then name): Dr. Tony K. Wolf (PD and co-PI), Professor of Viticulture, 75% Extension & 25% Research;
AHS Jr. Agricultural Research and Extension Center, Virginia Tech, 595 Laurel Grove Rd., Winchester VA 22602; [email protected]
Dr. William R. Nail (co-PI), Assistant Scientist II, 100% Research. The Connecticut Agricultural Experiment Station, 123 Huntington Street, New Haven, CT 06504, [email protected] [RESIGNED 2013; role assumed by Dr. Frank Ferrandino]
Dr. Alan Lakso (co-PI), Professor, 70% Research, 20% Extension & 10%Teaching, Dept. of Horticultural Sciences, Cornell University, NY State Agricultural Experiment Station, Geneva, NY 14456; [email protected] [RETIRED 2013]
Dr. Anna Katharine Mansfield (co-PI), Assistant Professor of Enology, 60% Extension & 40% Research; Dept. of Food Science & Technology, NYSAES, Cornell University, 630 W North St., Geneva, NY 14456 [email protected]
Dr. Ian Merwin (co-PI), Herman M. Cohn Professor of Horticulture; 50% Teaching, 45% Research, 5% Extension; Dept. of Horticulture, Cornell University, Ithaca, NY, 14853; [email protected] [RETIRED 2012]
Dr. Brad Rickard (co-PI), Assistant Professor of Applied Economics and Management, 50% Extension & 50% Research; Cornell University, 255 Warren Hall, Ithaca, NY 14853 [email protected]
Dr. Justine Vanden Heuvel (co-PI), Associate Professor of Viticulture, 50% research & 50% teaching, Cornell University, Ithaca NY, 14853; [email protected]
Dr. Wayne Wilcox (co-PI), Professor of Plant Pathology, 15% Research, 35% Extension, 10% Teaching, 40% Administration, Dept. of Plant Pathology, Cornell University, NY State Agricultural Experiment Station, Geneva, NY 14456 [email protected]
Dr. Imed Dami (co-PI), Associate Professor, 60% Research & 40% Extension. Department of Horticulture and Crop Science, Ohio Agricultural Research and Development Center, 1680 Madison Ave., Wooster OH 44691; [email protected]
Dr. John Havlin (co-PI), Professor of Soil Science, 17% Extension, 8% Research, 75% Academic, Dept. Soil Science, Campus Box 7619, NC State University, Raleigh, NC 27695-7619 [email protected]
Dr. K.S.U. (Jay) Jayaratne (co-PI). Assistant Professor and State Leader for Program Evaluation. Campus Box 7607. NC State University, Raleigh, NC 27695-7607 [email protected]
Dr. Katie Jennings (co-PI), Research Assistant Professor, 100% Research, Dept. Hort. Science, Campus Box 7609. NC State University, Raleigh, NC 27695-7609 [email protected]
Mr. Wayne Mitchem (co-PI), Extension Associate, 67% Research, 33% Extension, Mtn. Hort. Crops Res. Ext. Ctr., 455 Research Drive, NCSU, Hope Mills, NC 28732, [email protected]
Dr. Charles Safley (co-PI), Professor of Agricultural and Resource Economics, 87% Extension, 13% Academic, Department of Agric. Res. Econ., Campus Box 8109, North Carolina State University, Raleigh, NC 27695-8109 [email protected]
Dr. Sara Spayd (co-PI), Extension Viticulture Specialist/Professor, 60% Extension & 40% Research; Department of Horticultural Science, Campus Box 7609, NC State University, Raleigh, NC 27695-7609; [email protected]
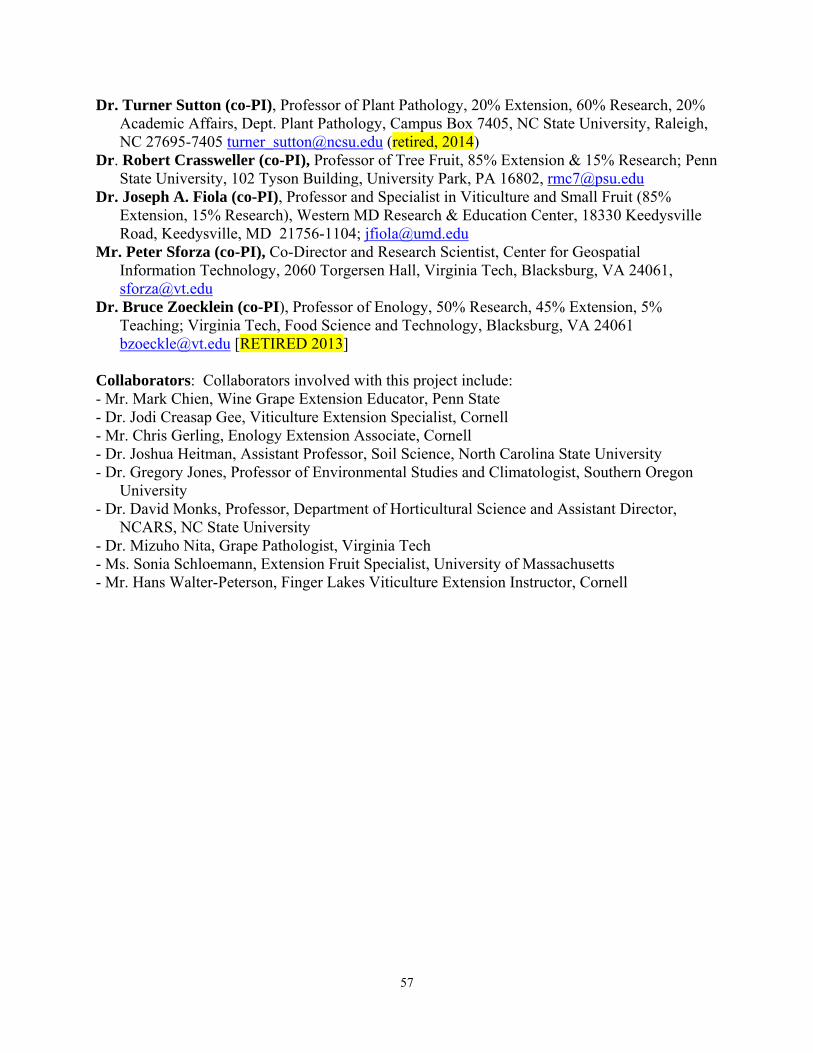
57
Dr. Turner Sutton (co-PI), Professor of Plant Pathology, 20% Extension, 60% Research, 20% Academic Affairs, Dept. Plant Pathology, Campus Box 7405, NC State University, Raleigh, NC 27695-7405 [email protected] (retired, 2014)
Dr. Robert Crassweller (co-PI), Professor of Tree Fruit, 85% Extension & 15% Research; Penn State University, 102 Tyson Building, University Park, PA 16802, [email protected]
Dr. Joseph A. Fiola (co-PI), Professor and Specialist in Viticulture and Small Fruit (85% Extension, 15% Research), Western MD Research & Education Center, 18330 Keedysville Road, Keedysville, MD 21756-1104; [email protected]
Mr. Peter Sforza (co-PI), Co-Director and Research Scientist, Center for Geospatial Information Technology, 2060 Torgersen Hall, Virginia Tech, Blacksburg, VA 24061, [email protected]
Dr. Bruce Zoecklein (co-PI), Professor of Enology, 50% Research, 45% Extension, 5% Teaching; Virginia Tech, Food Science and Technology, Blacksburg, VA 24061 [email protected] [RETIRED 2013]
Collaborators: Collaborators involved with this project include: - Mr. Mark Chien, Wine Grape Extension Educator, Penn State - Dr. Jodi Creasap Gee, Viticulture Extension Specialist, Cornell - Mr. Chris Gerling, Enology Extension Associate, Cornell - Dr. Joshua Heitman, Assistant Professor, Soil Science, North Carolina State University - Dr. Gregory Jones, Professor of Environmental Studies and Climatologist, Southern Oregon
University - Dr. David Monks, Professor, Department of Horticultural Science and Assistant Director,
NCARS, NC State University - Dr. Mizuho Nita, Grape Pathologist, Virginia Tech - Ms. Sonia Schloemann, Extension Fruit Specialist, University of Massachusetts - Mr. Hans Walter-Peterson, Finger Lakes Viticulture Extension Instructor, Cornell
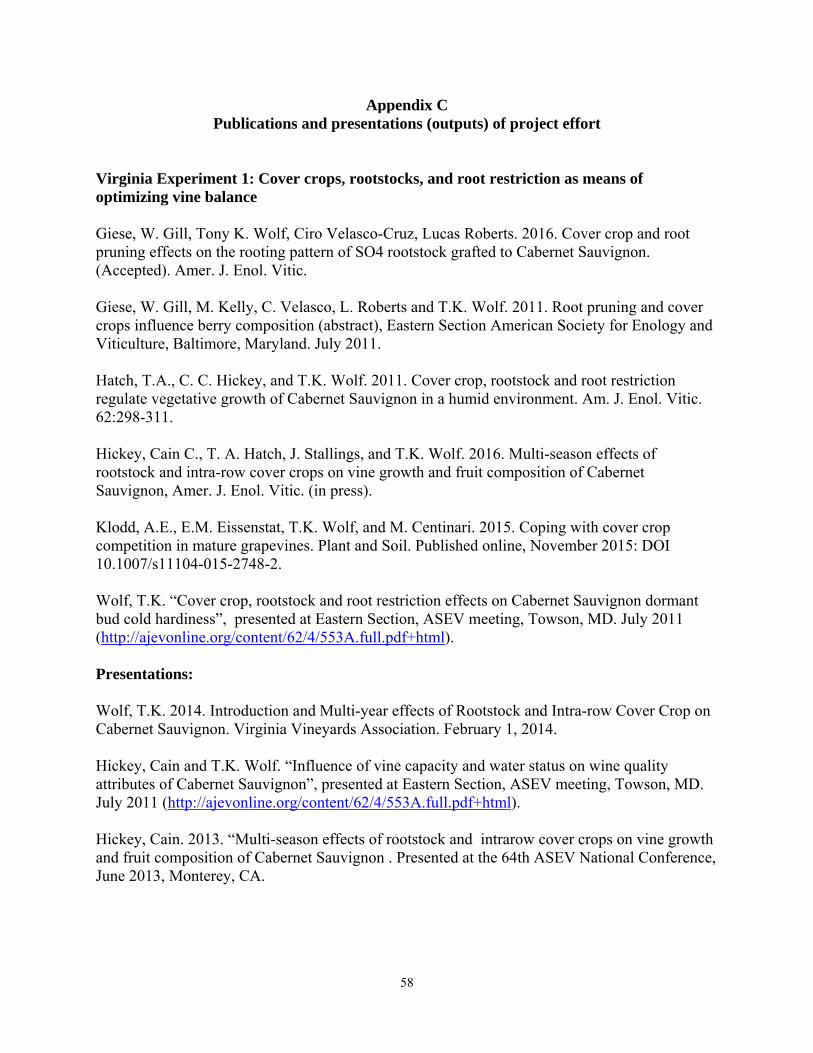
58
Appendix C Publications and presentations (outputs) of project effort
Virginia Experiment 1: Cover crops, rootstocks, and root restriction as means of optimizing vine balance Giese, W. Gill, Tony K. Wolf, Ciro Velasco-Cruz, Lucas Roberts. 2016. Cover crop and root pruning effects on the rooting pattern of SO4 rootstock grafted to Cabernet Sauvignon. (Accepted). Amer. J. Enol. Vitic. Giese, W. Gill, M. Kelly, C. Velasco, L. Roberts and T.K. Wolf. 2011. Root pruning and cover crops influence berry composition (abstract), Eastern Section American Society for Enology and Viticulture, Baltimore, Maryland. July 2011. Hatch, T.A., C. C. Hickey, and T.K. Wolf. 2011. Cover crop, rootstock and root restriction regulate vegetative growth of Cabernet Sauvignon in a humid environment. Am. J. Enol. Vitic. 62:298-311. Hickey, Cain C., T. A. Hatch, J. Stallings, and T.K. Wolf. 2016. Multi-season effects of rootstock and intra-row cover crops on vine growth and fruit composition of Cabernet Sauvignon, Amer. J. Enol. Vitic. (in press). Klodd, A.E., E.M. Eissenstat, T.K. Wolf, and M. Centinari. 2015. Coping with cover crop competition in mature grapevines. Plant and Soil. Published online, November 2015: DOI 10.1007/s11104-015-2748-2. Wolf, T.K. “Cover crop, rootstock and root restriction effects on Cabernet Sauvignon dormant bud cold hardiness”, presented at Eastern Section, ASEV meeting, Towson, MD. July 2011 (http://ajevonline.org/content/62/4/553A.full.pdf+html). Presentations: Wolf, T.K. 2014. Introduction and Multi-year effects of Rootstock and Intra-row Cover Crop on Cabernet Sauvignon. Virginia Vineyards Association. February 1, 2014. Hickey, Cain and T.K. Wolf. “Influence of vine capacity and water status on wine quality attributes of Cabernet Sauvignon”, presented at Eastern Section, ASEV meeting, Towson, MD. July 2011 (http://ajevonline.org/content/62/4/553A.full.pdf+html). Hickey, Cain. 2013. “Multi-season effects of rootstock and intrarow cover crops on vine growth and fruit composition of Cabernet Sauvignon . Presented at the 64th ASEV National Conference, June 2013, Monterey, CA.
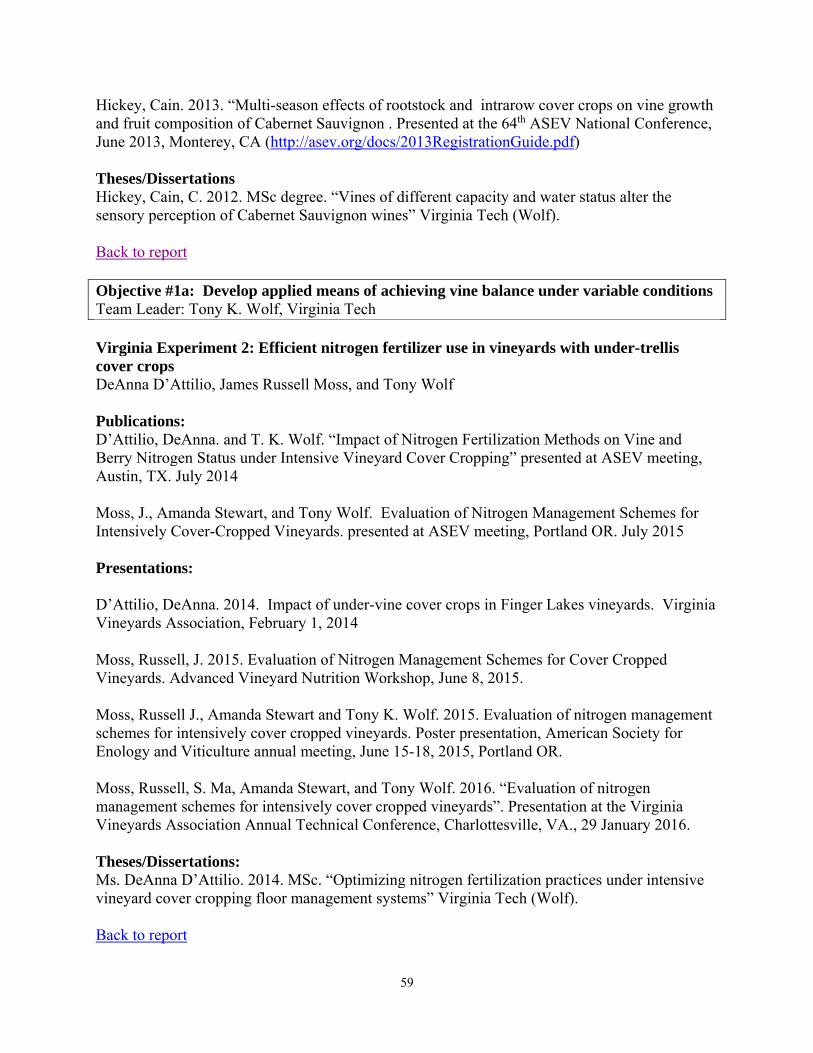
59
Hickey, Cain. 2013. “Multi-season effects of rootstock and intrarow cover crops on vine growth and fruit composition of Cabernet Sauvignon . Presented at the 64th ASEV National Conference, June 2013, Monterey, CA (http://asev.org/docs/2013RegistrationGuide.pdf) Theses/Dissertations Hickey, Cain, C. 2012. MSc degree. “Vines of different capacity and water status alter the sensory perception of Cabernet Sauvignon wines” Virginia Tech (Wolf). Back to report Objective #1a: Develop applied means of achieving vine balance under variable conditions Team Leader: Tony K. Wolf, Virginia Tech Virginia Experiment 2: Efficient nitrogen fertilizer use in vineyards with under-trellis cover crops DeAnna D’Attilio, James Russell Moss, and Tony Wolf Publications: D’Attilio, DeAnna. and T. K. Wolf. “Impact of Nitrogen Fertilization Methods on Vine and Berry Nitrogen Status under Intensive Vineyard Cover Cropping” presented at ASEV meeting, Austin, TX. July 2014 Moss, J., Amanda Stewart, and Tony Wolf. Evaluation of Nitrogen Management Schemes for Intensively Cover-Cropped Vineyards. presented at ASEV meeting, Portland OR. July 2015 Presentations: D’Attilio, DeAnna. 2014. Impact of under-vine cover crops in Finger Lakes vineyards. Virginia Vineyards Association, February 1, 2014 Moss, Russell, J. 2015. Evaluation of Nitrogen Management Schemes for Cover Cropped Vineyards. Advanced Vineyard Nutrition Workshop, June 8, 2015. Moss, Russell J., Amanda Stewart and Tony K. Wolf. 2015. Evaluation of nitrogen management schemes for intensively cover cropped vineyards. Poster presentation, American Society for Enology and Viticulture annual meeting, June 15-18, 2015, Portland OR. Moss, Russell, S. Ma, Amanda Stewart, and Tony Wolf. 2016. “Evaluation of nitrogen management schemes for intensively cover cropped vineyards”. Presentation at the Virginia Vineyards Association Annual Technical Conference, Charlottesville, VA., 29 January 2016. Theses/Dissertations: Ms. DeAnna D’Attilio. 2014. MSc. “Optimizing nitrogen fertilization practices under intensive vineyard cover cropping floor management systems” Virginia Tech (Wolf). Back to report
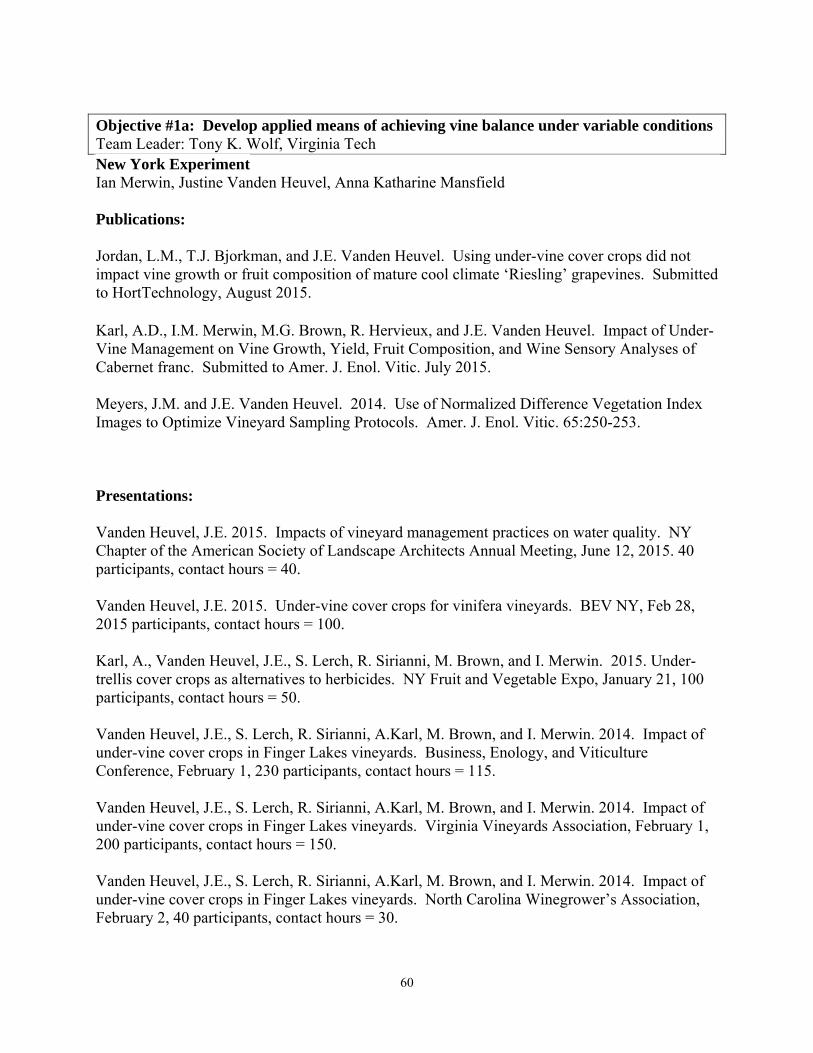
60
Objective #1a: Develop applied means of achieving vine balance under variable conditions Team Leader: Tony K. Wolf, Virginia Tech New York Experiment Ian Merwin, Justine Vanden Heuvel, Anna Katharine Mansfield Publications: Jordan, L.M., T.J. Bjorkman, and J.E. Vanden Heuvel. Using under-vine cover crops did not impact vine growth or fruit composition of mature cool climate ‘Riesling’ grapevines. Submitted to HortTechnology, August 2015. Karl, A.D., I.M. Merwin, M.G. Brown, R. Hervieux, and J.E. Vanden Heuvel. Impact of Under-Vine Management on Vine Growth, Yield, Fruit Composition, and Wine Sensory Analyses of Cabernet franc. Submitted to Amer. J. Enol. Vitic. July 2015. Meyers, J.M. and J.E. Vanden Heuvel. 2014. Use of Normalized Difference Vegetation Index Images to Optimize Vineyard Sampling Protocols. Amer. J. Enol. Vitic. 65:250-253. Presentations: Vanden Heuvel, J.E. 2015. Impacts of vineyard management practices on water quality. NY Chapter of the American Society of Landscape Architects Annual Meeting, June 12, 2015. 40 participants, contact hours = 40. Vanden Heuvel, J.E. 2015. Under-vine cover crops for vinifera vineyards. BEV NY, Feb 28, 2015 participants, contact hours = 100. Karl, A., Vanden Heuvel, J.E., S. Lerch, R. Sirianni, M. Brown, and I. Merwin. 2015. Under-trellis cover crops as alternatives to herbicides. NY Fruit and Vegetable Expo, January 21, 100 participants, contact hours = 50. Vanden Heuvel, J.E., S. Lerch, R. Sirianni, A.Karl, M. Brown, and I. Merwin. 2014. Impact of under-vine cover crops in Finger Lakes vineyards. Business, Enology, and Viticulture Conference, February 1, 230 participants, contact hours = 115. Vanden Heuvel, J.E., S. Lerch, R. Sirianni, A.Karl, M. Brown, and I. Merwin. 2014. Impact of under-vine cover crops in Finger Lakes vineyards. Virginia Vineyards Association, February 1, 200 participants, contact hours = 150. Vanden Heuvel, J.E., S. Lerch, R. Sirianni, A.Karl, M. Brown, and I. Merwin. 2014. Impact of under-vine cover crops in Finger Lakes vineyards. North Carolina Winegrower’s Association, February 2, 40 participants, contact hours = 30.
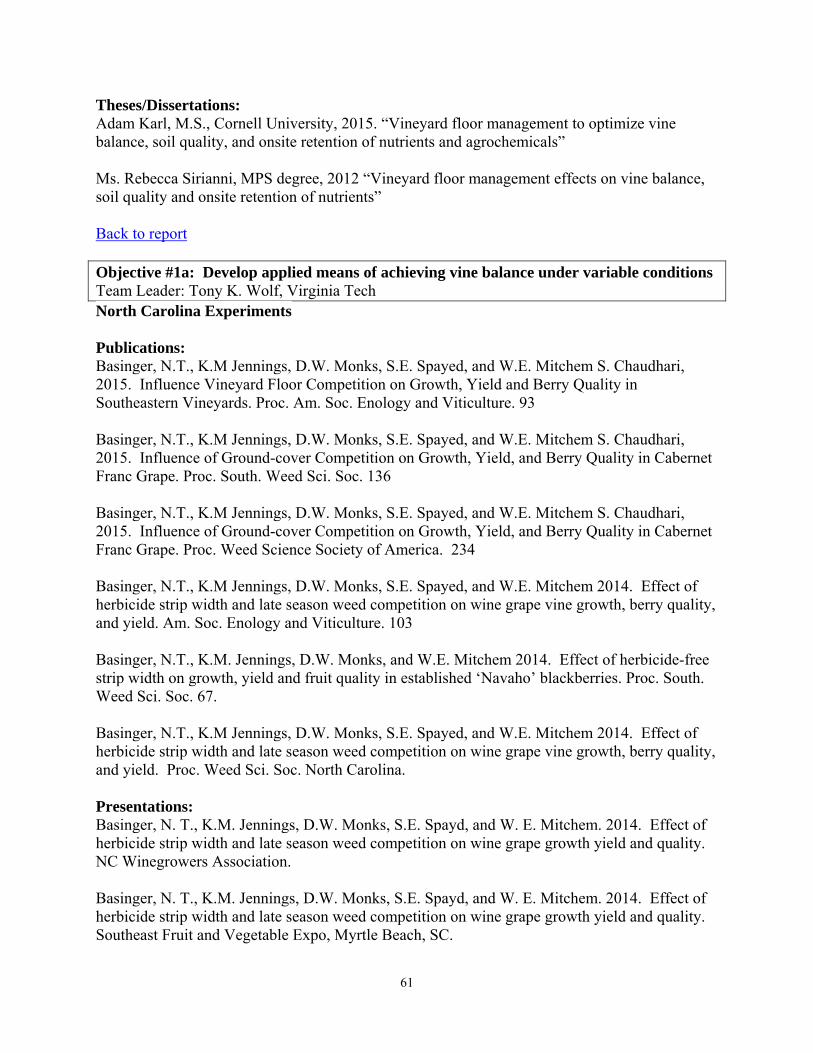
61
Theses/Dissertations: Adam Karl, M.S., Cornell University, 2015. “Vineyard floor management to optimize vine balance, soil quality, and onsite retention of nutrients and agrochemicals” Ms. Rebecca Sirianni, MPS degree, 2012 “Vineyard floor management effects on vine balance, soil quality and onsite retention of nutrients” Back to report Objective #1a: Develop applied means of achieving vine balance under variable conditions Team Leader: Tony K. Wolf, Virginia Tech North Carolina Experiments Publications: Basinger, N.T., K.M Jennings, D.W. Monks, S.E. Spayed, and W.E. Mitchem S. Chaudhari, 2015. Influence Vineyard Floor Competition on Growth, Yield and Berry Quality in Southeastern Vineyards. Proc. Am. Soc. Enology and Viticulture. 93 Basinger, N.T., K.M Jennings, D.W. Monks, S.E. Spayed, and W.E. Mitchem S. Chaudhari, 2015. Influence of Ground-cover Competition on Growth, Yield, and Berry Quality in Cabernet Franc Grape. Proc. South. Weed Sci. Soc. 136 Basinger, N.T., K.M Jennings, D.W. Monks, S.E. Spayed, and W.E. Mitchem S. Chaudhari, 2015. Influence of Ground-cover Competition on Growth, Yield, and Berry Quality in Cabernet Franc Grape. Proc. Weed Science Society of America. 234 Basinger, N.T., K.M Jennings, D.W. Monks, S.E. Spayed, and W.E. Mitchem 2014. Effect of herbicide strip width and late season weed competition on wine grape vine growth, berry quality, and yield. Am. Soc. Enology and Viticulture. 103 Basinger, N.T., K.M. Jennings, D.W. Monks, and W.E. Mitchem 2014. Effect of herbicide-free strip width on growth, yield and fruit quality in established ‘Navaho’ blackberries. Proc. South. Weed Sci. Soc. 67. Basinger, N.T., K.M Jennings, D.W. Monks, S.E. Spayed, and W.E. Mitchem 2014. Effect of herbicide strip width and late season weed competition on wine grape vine growth, berry quality, and yield. Proc. Weed Sci. Soc. North Carolina.
Presentations: Basinger, N. T., K.M. Jennings, D.W. Monks, S.E. Spayd, and W. E. Mitchem. 2014. Effect of herbicide strip width and late season weed competition on wine grape growth yield and quality. NC Winegrowers Association. Basinger, N. T., K.M. Jennings, D.W. Monks, S.E. Spayd, and W. E. Mitchem. 2014. Effect of herbicide strip width and late season weed competition on wine grape growth yield and quality. Southeast Fruit and Vegetable Expo, Myrtle Beach, SC.

62
Basinger, N. T., K.M. Jennings, D.W. Monks and W. E. Mitchem. 2015. Effect of Herbicide Strip Width on Navaho Blackberry Growth, Berry Quality, and Yield. Southeast Fruit and Vegetable Expo, Savannah, GA. Effective weed identification and management in Southeastern vineyards, Shadow Springs Vineyard, May 3, 2014 Presentation and demonstration on muscadine varieties and pruning, Adams Vineyard, March, 2014 Back to report Objective #1b: Develop canopy and crop management metrics to achieve consistent vine balance and canopy microclimate Experiment 1: Canopy description and development of tools for determining canopy metrics Team Leader: Dr. Justine Vanden Heuvel, Cornell University Publications:
Meyers, J.M., G.L. Sacks, and J.E. Vanden Heuvel. (2012). A Computational Approach for Balancing Competing Objectives in Winegrape Production. Am J Enol Vitic. 63(2):296-300.
Back to report Objective #1b: Develop canopy and crop management metrics to achieve consistent vine balance and canopy microclimate Experiment 2: Impacts of light and temperature variation in canopies on specific flavor/aroma compounds in Cabernet franc across different geographic regions Publications: Meyers, J.M., A.K. Mansfield, and J.E. Vanden Heuvel. Light response curves for phenolic compounds in Cabernet franc wine grapes. In preparation for Amer. J. Enol. Vitic. Back to report Objective #1b: Develop canopy and crop management metrics to achieve consistent vine balance and canopy microclimate Experiment 3: Estimating climate-specific vineyard capacity for balancing crop levels Team Leader: Dr. Alan Lakso, Cornell University

63
Publications: Lakso, A. N. 2013. Untangling the concepts of vine size, capacity, crop level, vigor, and vine balance. Grapes 101 in Appellation Cornell, No. 13, March 2013. (http://grapesandwine.cals.cornell.edu/cals/grapesandwine/appellation-cornell/issue-13/vine-size.cfm) Intrigliolo, D.S., T.A. Abd El-Mageed, M.A. Abdelfatah, H. Medrano, and A.N. Lakso. 2013. Improving vine performance by modifying daily light interception patterns in vertically shoot positioned grapevines. Submitted to Acta Hort. Shaposhnikova, O., A.T. DeGaetano, and A.N. Lakso. 2015. Modeling Landscapes and Climates for Vineyard Site Selection in Two Marginal Climates. Acta Hort. 1068:141-146. Presentations: Lakso, A. “Vine Size, Vigor and Balance” to Eastern Winery Expo, Lancaster, PA March, 2013 Lakso, A. “Climate and Site Selection for Grapes” to the Viticulture Management class at The Finger Lakes Community College, Geneva, NY February 2014 Lakso, A. “Regulating shoot vigor in Cabernet franc with balanced pruning and Lyre training” to the NY Business, Enology and Viticulture Meeting Waterloo, NY March 2014. Lakso, A. “Thoughts on the future vineyard” to the NY Business, Enology and Viticulture Meeting Waterloo, NY March 2014. Lakso, A. “Finding Balance: Vine Size, Capacity, Vigor and Vine Balance”. Presentation to growers at the Southeast Grape and Wine Symposium, Dobson, NC, November 2014. Lakso, A. “Finding Balance: Vine Size, Capacity, Vigor and Vine Balance”. Presentation to growers at the Mid-Atlantic Fruit and Vegetable Convention, January 2015 Lakso, A. Brief presentation of crop load studies and presentation of comparative wines at a Winemakers Twilight Meeting at Lakewood Vineyards, August 2015. Back to report Objective 2. Develop research-based recommendations for optimally matching grape cultivars with site-specific environmental conditions Objective 2a: Evaluation of viticultural and enological performances of novel wine grape cultivars (linkage with NE-1020 project) New York Work:
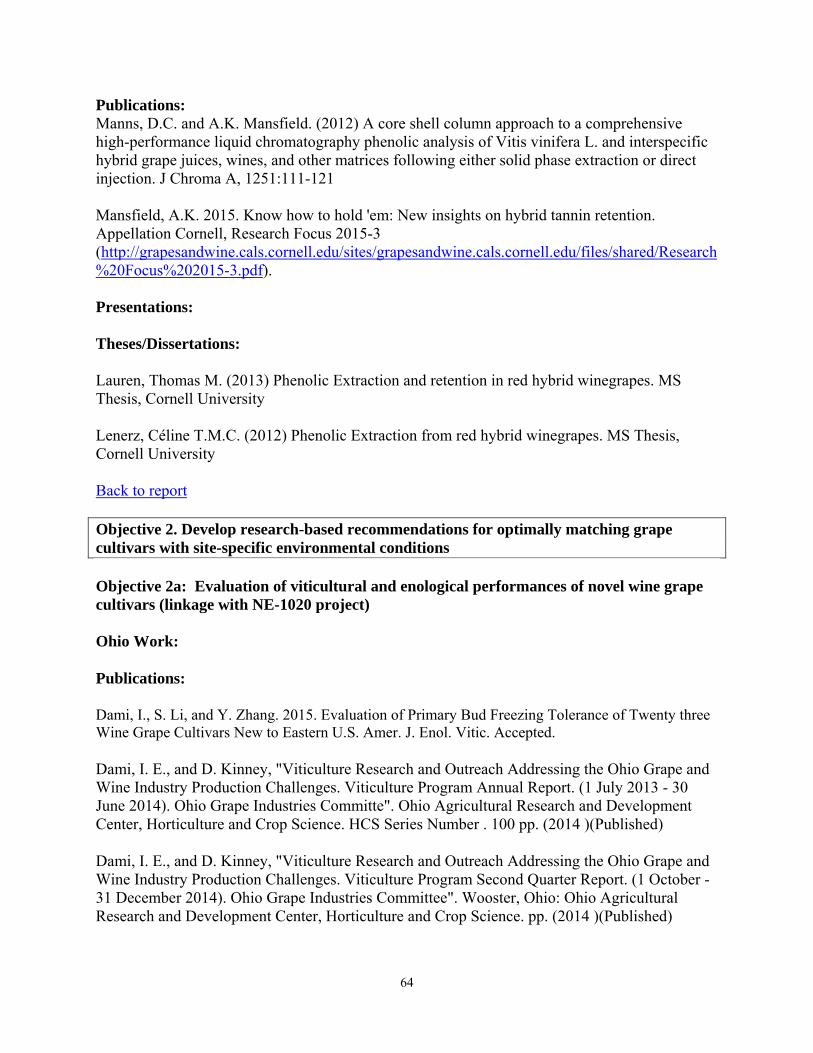
64
Publications: Manns, D.C. and A.K. Mansfield. (2012) A core shell column approach to a comprehensive high-performance liquid chromatography phenolic analysis of Vitis vinifera L. and interspecific hybrid grape juices, wines, and other matrices following either solid phase extraction or direct injection. J Chroma A, 1251:111-121 Mansfield, A.K. 2015. Know how to hold 'em: New insights on hybrid tannin retention. Appellation Cornell, Research Focus 2015-3 (http://grapesandwine.cals.cornell.edu/sites/grapesandwine.cals.cornell.edu/files/shared/Research%20Focus%202015-3.pdf). Presentations: Theses/Dissertations: Lauren, Thomas M. (2013) Phenolic Extraction and retention in red hybrid winegrapes. MS Thesis, Cornell University Lenerz, Céline T.M.C. (2012) Phenolic Extraction from red hybrid winegrapes. MS Thesis, Cornell University Back to report Objective 2. Develop research-based recommendations for optimally matching grape cultivars with site-specific environmental conditions Objective 2a: Evaluation of viticultural and enological performances of novel wine grape cultivars (linkage with NE-1020 project) Ohio Work:
Publications:
Dami, I., S. Li, and Y. Zhang. 2015. Evaluation of Primary Bud Freezing Tolerance of Twenty three Wine Grape Cultivars New to Eastern U.S. Amer. J. Enol. Vitic. Accepted.
Dami, I. E., and D. Kinney, "Viticulture Research and Outreach Addressing the Ohio Grape and Wine Industry Production Challenges. Viticulture Program Annual Report. (1 July 2013 - 30 June 2014). Ohio Grape Industries Committe". Ohio Agricultural Research and Development Center, Horticulture and Crop Science. HCS Series Number . 100 pp. (2014 )(Published)
Dami, I. E., and D. Kinney, "Viticulture Research and Outreach Addressing the Ohio Grape and Wine Industry Production Challenges. Viticulture Program Second Quarter Report. (1 October - 31 December 2014). Ohio Grape Industries Committee". Wooster, Ohio: Ohio Agricultural Research and Development Center, Horticulture and Crop Science. pp. (2014 )(Published)
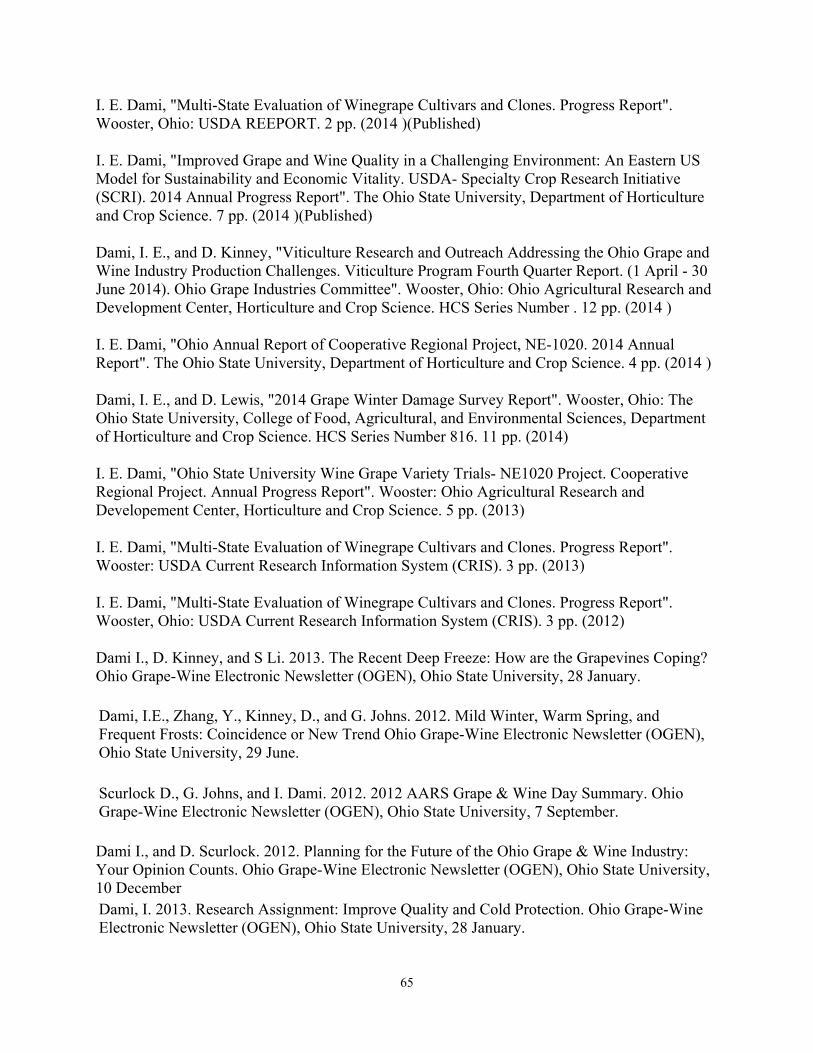
65
I. E. Dami, "Multi-State Evaluation of Winegrape Cultivars and Clones. Progress Report". Wooster, Ohio: USDA REEPORT. 2 pp. (2014 )(Published)
I. E. Dami, "Improved Grape and Wine Quality in a Challenging Environment: An Eastern US Model for Sustainability and Economic Vitality. USDA- Specialty Crop Research Initiative (SCRI). 2014 Annual Progress Report". The Ohio State University, Department of Horticulture and Crop Science. 7 pp. (2014 )(Published)
Dami, I. E., and D. Kinney, "Viticulture Research and Outreach Addressing the Ohio Grape and Wine Industry Production Challenges. Viticulture Program Fourth Quarter Report. (1 April - 30 June 2014). Ohio Grape Industries Committee". Wooster, Ohio: Ohio Agricultural Research and Development Center, Horticulture and Crop Science. HCS Series Number . 12 pp. (2014 )
I. E. Dami, "Ohio Annual Report of Cooperative Regional Project, NE-1020. 2014 Annual Report". The Ohio State University, Department of Horticulture and Crop Science. 4 pp. (2014 )
Dami, I. E., and D. Lewis, "2014 Grape Winter Damage Survey Report". Wooster, Ohio: The Ohio State University, College of Food, Agricultural, and Environmental Sciences, Department of Horticulture and Crop Science. HCS Series Number 816. 11 pp. (2014)
I. E. Dami, "Ohio State University Wine Grape Variety Trials- NE1020 Project. Cooperative Regional Project. Annual Progress Report". Wooster: Ohio Agricultural Research and Developement Center, Horticulture and Crop Science. 5 pp. (2013)
I. E. Dami, "Multi-State Evaluation of Winegrape Cultivars and Clones. Progress Report". Wooster: USDA Current Research Information System (CRIS). 3 pp. (2013)
I. E. Dami, "Multi-State Evaluation of Winegrape Cultivars and Clones. Progress Report". Wooster, Ohio: USDA Current Research Information System (CRIS). 3 pp. (2012)
Dami I., D. Kinney, and S Li. 2013. The Recent Deep Freeze: How are the Grapevines Coping? Ohio Grape-Wine Electronic Newsletter (OGEN), Ohio State University, 28 January. Dami, I.E., Zhang, Y., Kinney, D., and G. Johns. 2012. Mild Winter, Warm Spring, and Frequent Frosts: Coincidence or New Trend Ohio Grape-Wine Electronic Newsletter (OGEN), Ohio State University, 29 June.
Scurlock D., G. Johns, and I. Dami. 2012. 2012 AARS Grape & Wine Day Summary. Ohio Grape-Wine Electronic Newsletter (OGEN), Ohio State University, 7 September. Dami I., and D. Scurlock. 2012. Planning for the Future of the Ohio Grape & Wine Industry: Your Opinion Counts. Ohio Grape-Wine Electronic Newsletter (OGEN), Ohio State University, 10 December Dami, I. 2013. Research Assignment: Improve Quality and Cold Protection. Ohio Grape-Wine Electronic Newsletter (OGEN), Ohio State University, 28 January.
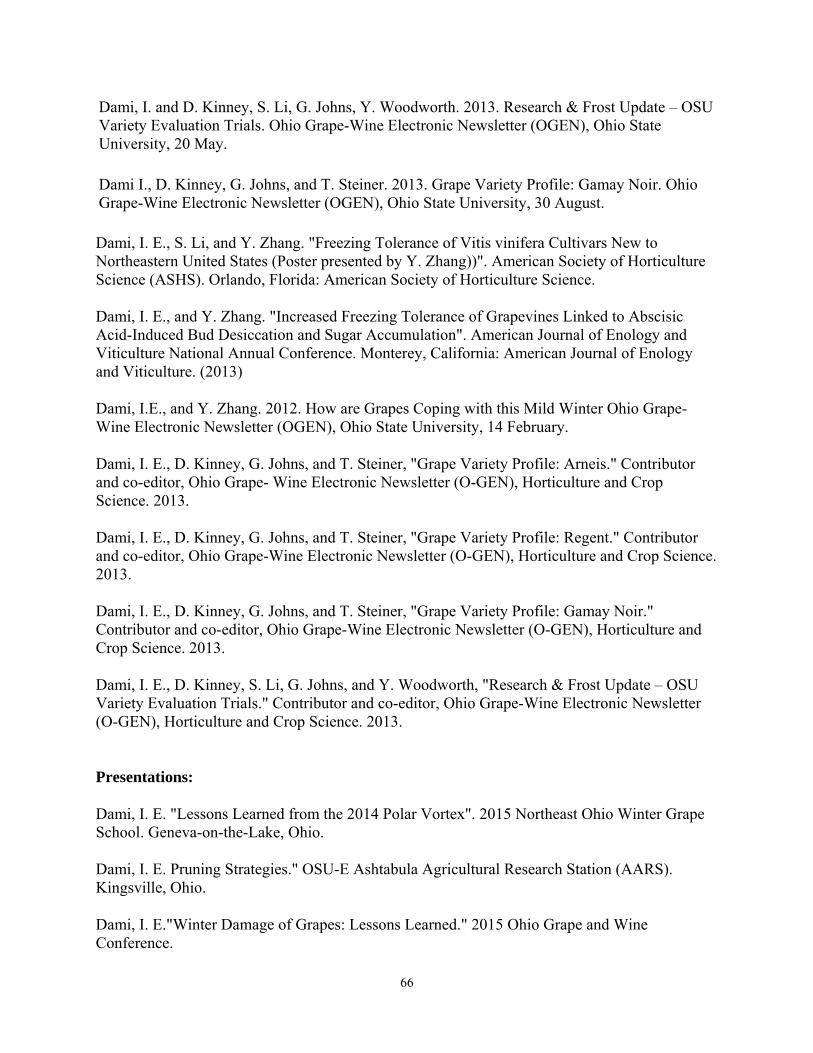
66
Dami, I. and D. Kinney, S. Li, G. Johns, Y. Woodworth. 2013. Research & Frost Update – OSU Variety Evaluation Trials. Ohio Grape-Wine Electronic Newsletter (OGEN), Ohio State University, 20 May.
Dami I., D. Kinney, G. Johns, and T. Steiner. 2013. Grape Variety Profile: Gamay Noir. Ohio Grape-Wine Electronic Newsletter (OGEN), Ohio State University, 30 August.
Dami, I. E., S. Li, and Y. Zhang. "Freezing Tolerance of Vitis vinifera Cultivars New to Northeastern United States (Poster presented by Y. Zhang))". American Society of Horticulture Science (ASHS). Orlando, Florida: American Society of Horticulture Science.
Dami, I. E., and Y. Zhang. "Increased Freezing Tolerance of Grapevines Linked to Abscisic Acid-Induced Bud Desiccation and Sugar Accumulation". American Journal of Enology and Viticulture National Annual Conference. Monterey, California: American Journal of Enology and Viticulture. (2013)
Dami, I.E., and Y. Zhang. 2012. How are Grapes Coping with this Mild Winter Ohio Grape-Wine Electronic Newsletter (OGEN), Ohio State University, 14 February.
Dami, I. E., D. Kinney, G. Johns, and T. Steiner, "Grape Variety Profile: Arneis." Contributor and co-editor, Ohio Grape- Wine Electronic Newsletter (O-GEN), Horticulture and Crop Science. 2013.
Dami, I. E., D. Kinney, G. Johns, and T. Steiner, "Grape Variety Profile: Regent." Contributor and co-editor, Ohio Grape-Wine Electronic Newsletter (O-GEN), Horticulture and Crop Science. 2013.
Dami, I. E., D. Kinney, G. Johns, and T. Steiner, "Grape Variety Profile: Gamay Noir." Contributor and co-editor, Ohio Grape-Wine Electronic Newsletter (O-GEN), Horticulture and Crop Science. 2013.
Dami, I. E., D. Kinney, S. Li, G. Johns, and Y. Woodworth, "Research & Frost Update – OSU Variety Evaluation Trials." Contributor and co-editor, Ohio Grape-Wine Electronic Newsletter (O-GEN), Horticulture and Crop Science. 2013.
Presentations:
Dami, I. E. "Lessons Learned from the 2014 Polar Vortex". 2015 Northeast Ohio Winter Grape School. Geneva-on-the-Lake, Ohio.
Dami, I. E. Pruning Strategies." OSU-E Ashtabula Agricultural Research Station (AARS). Kingsville, Ohio.
Dami, I. E."Winter Damage of Grapes: Lessons Learned." 2015 Ohio Grape and Wine Conference.
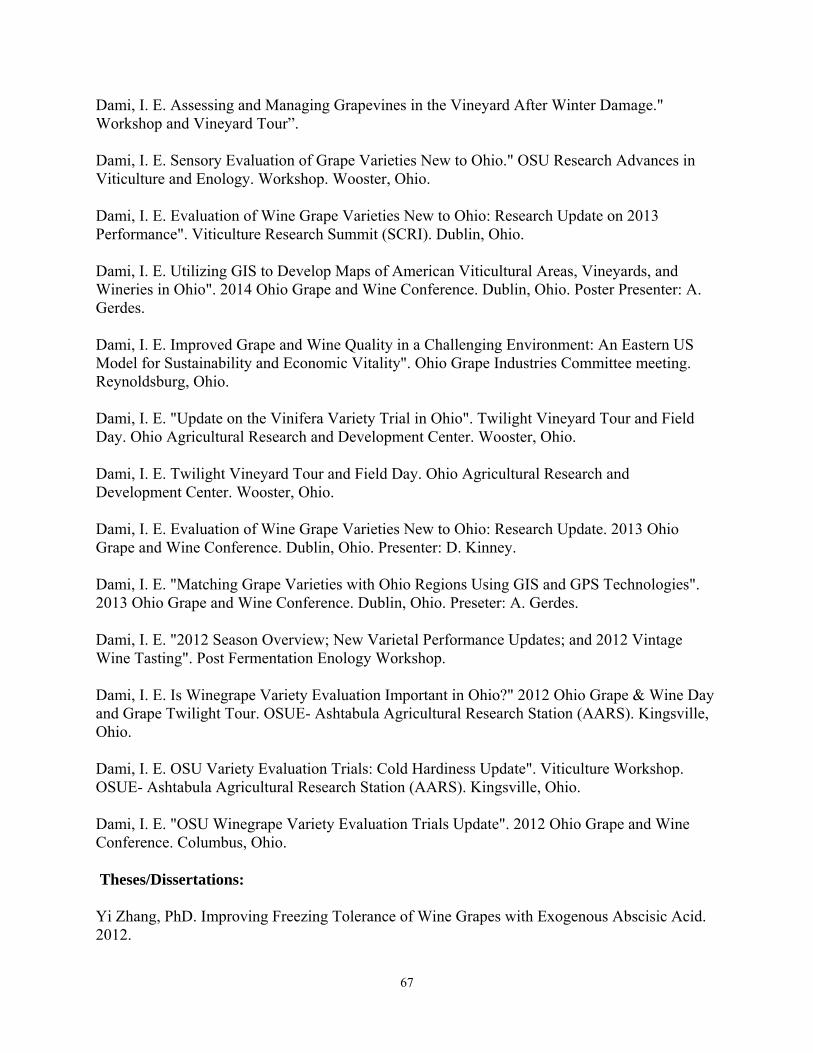
67
Dami, I. E. Assessing and Managing Grapevines in the Vineyard After Winter Damage." Workshop and Vineyard Tour”.
Dami, I. E. Sensory Evaluation of Grape Varieties New to Ohio." OSU Research Advances in Viticulture and Enology. Workshop. Wooster, Ohio.
Dami, I. E. Evaluation of Wine Grape Varieties New to Ohio: Research Update on 2013 Performance". Viticulture Research Summit (SCRI). Dublin, Ohio.
Dami, I. E. Utilizing GIS to Develop Maps of American Viticultural Areas, Vineyards, and Wineries in Ohio". 2014 Ohio Grape and Wine Conference. Dublin, Ohio. Poster Presenter: A. Gerdes.
Dami, I. E. Improved Grape and Wine Quality in a Challenging Environment: An Eastern US Model for Sustainability and Economic Vitality". Ohio Grape Industries Committee meeting. Reynoldsburg, Ohio.
Dami, I. E. "Update on the Vinifera Variety Trial in Ohio". Twilight Vineyard Tour and Field Day. Ohio Agricultural Research and Development Center. Wooster, Ohio.
Dami, I. E. Twilight Vineyard Tour and Field Day. Ohio Agricultural Research and Development Center. Wooster, Ohio.
Dami, I. E. Evaluation of Wine Grape Varieties New to Ohio: Research Update. 2013 Ohio Grape and Wine Conference. Dublin, Ohio. Presenter: D. Kinney.
Dami, I. E. "Matching Grape Varieties with Ohio Regions Using GIS and GPS Technologies". 2013 Ohio Grape and Wine Conference. Dublin, Ohio. Preseter: A. Gerdes.
Dami, I. E. "2012 Season Overview; New Varietal Performance Updates; and 2012 Vintage Wine Tasting". Post Fermentation Enology Workshop.
Dami, I. E. Is Winegrape Variety Evaluation Important in Ohio?" 2012 Ohio Grape & Wine Day and Grape Twilight Tour. OSUE- Ashtabula Agricultural Research Station (AARS). Kingsville, Ohio.
Dami, I. E. OSU Variety Evaluation Trials: Cold Hardiness Update". Viticulture Workshop. OSUE- Ashtabula Agricultural Research Station (AARS). Kingsville, Ohio.
Dami, I. E. "OSU Winegrape Variety Evaluation Trials Update". 2012 Ohio Grape and Wine Conference. Columbus, Ohio.
Theses/Dissertations:
Yi Zhang, PhD. Improving Freezing Tolerance of Wine Grapes with Exogenous Abscisic Acid. 2012.

68
Shouxin Li, MS. Evaluation and Improvement of Freezing Tolerance in cold Sensitive Grape Genotypes. 2014
Abigail Gerdes, MS. A Study of Ohio American Viticultural Areas. 2015
Back to report Objective 2. Develop research-based recommendations for optimally matching grape cultivars with site-specific environmental conditions Objective 2a: Evaluation of viticultural and enological performances of novel wine grape cultivars (linkage with NE-1020 project) Maryland Work: Publications: Fiola, J.A. 2015. Massive Strides in Maryland – Joe Fiola, Russian varieties, add spark to state’s wine business. Vineyard and Winery Management 41(5): 29-33. Fiola, J.A. 2015. Recommended Winegrape Variety for Maryland. Contributed variety recommendations which are annually updated and posted on the MGGA website. Presentations: Fiola, J.A. New Grape Growers Workshop. Statewide program with University of Maryland Extension Educators David Myers, Ben Beale, Shannon Dill, Herb Reed, Sudeep Mathew and David Martin. February. Towson, MD. 45 participants in 2015. Fiola, J.A. 2012. Grape Varieties for the Diverse Regions of Maryland. New Grape Growers Workshop. Oxon Hill, Maryland. (45 participants) Fiola, J.A. 2012. What Are We Learning About Regional Grape Variety Performance from Our R&D Vineyards in Maryland? and Evaluation of Wines of Promising Experimental Varieties. MGGA/MWA/UME Annual Meeting. Oxon Hill, Maryland. Fiola, J.A. 2012. Chambourcin – “The” Grape Variety for the Mid-Atlantic. Eastern Wineries Exposition - Red Hybrids Session. Lancaster, Pennsylvania. (125 participants) Fiola, J.A. 2012. Grape Varieties for the Mid-Atlantic. New Grape Growers Workshop. Lancaster, Pennsylvania. (75 participants) Fiola, J.A. 2012. Grape Varieties for Hot Climates – Vine Performance and Wine Evaluation. VESTA Regional Grape Symposium. Surry, North Carolina. (75 participants)

69
Fiola, J.A. 2012. Varieties recommendations for Western Maryland. UME Twilight Meeting. Rohrersville, Maryland. (47 participants) Fiola, J.A. 2012. Grape Variety Performance from UME R&D Vineyards on the Eastern Shore of Maryland. MGGA/MWA/UME Summer Field Day. Vienna, Maryland. Fiola, J.A. 2012. Grape Variety Performance from WREC Vineyards on the Eastern Shore of Maryland and Evaluation of Wines of Promising Experimental Varieties from WREC and other Eastern Shore R&D vineyards. UME Summer Field Day. Chestertown, Maryland. Fiola, J.A. 2012. Grape Variety Performance of UME R&D Vineyards on the Eastern Shore of Maryland and Evaluation of Wines of Promising Experimental Varieties from Eastern Shore R&D vineyards. MGGA/UME Summer Twilight Meeting. Sudlersville, Maryland. Fiola, J.A. 2012. Experimental Varieties Performance in Southern Maryland and Evaluation of Wines of Promising Experimental Varieties from CMREC R&D vineyard. CMREC Twilight Meeting. Upper Marlboro, Maryland. Fiola, J.A. 2012. Evaluating Wine from the Same Varieties Grown in Multiple Locations at the UME R&D Vineyards. MWA Winemaker’s Workshop. Annapolis, Maryland. Fiola, J.A. 2011. What We Learning About Regional Grape Variety Performance from Our CMREC Vineyards. University of Maryland College Park Scholars Field Day. Largo, Maryland. (70 participants) Fiola, J.A. 2012 Recommended Winegrape Variety for Maryland. Contributed variety recommendations which are annually updated and posted on the MGGA website. Fiola, J.A. 2013. Tasting of Promising Imported Varieties from Italy growing in Maryland. The grapes of Delight – New and Old Italian Grape Cultivars for New Jersey. November. Upper Deerfield, NJ. Fiola, J.A. 2014. Grape Varieties for the Diverse Regions of Michigan. Wine Grape Vineyard establishment conference. East Lansing, Michigan. (90 participants)
Fiola, J.A. 2014. UME Red Wines from Dry to Dessert – Wine Styles, Food Matching and Health Benefits. Re Wine and Chocolate for Heart Health Seminar. February. Hagerstown, Maryland. (165 participants) Fiola, J.A. 2014. Promising varieties from NE-1020 variety evaluations (w/ tasting). SCRI Research Summit - “Improved Grape and Wine Quality in a Challenging Environment….” February. Charlottesville, VA. Fiola, J.A. 2014. Grape Varieties for the Diverse Regions of Maryland. New Grape Growers Workshop. February. Baltimore, Maryland. (45 participants)
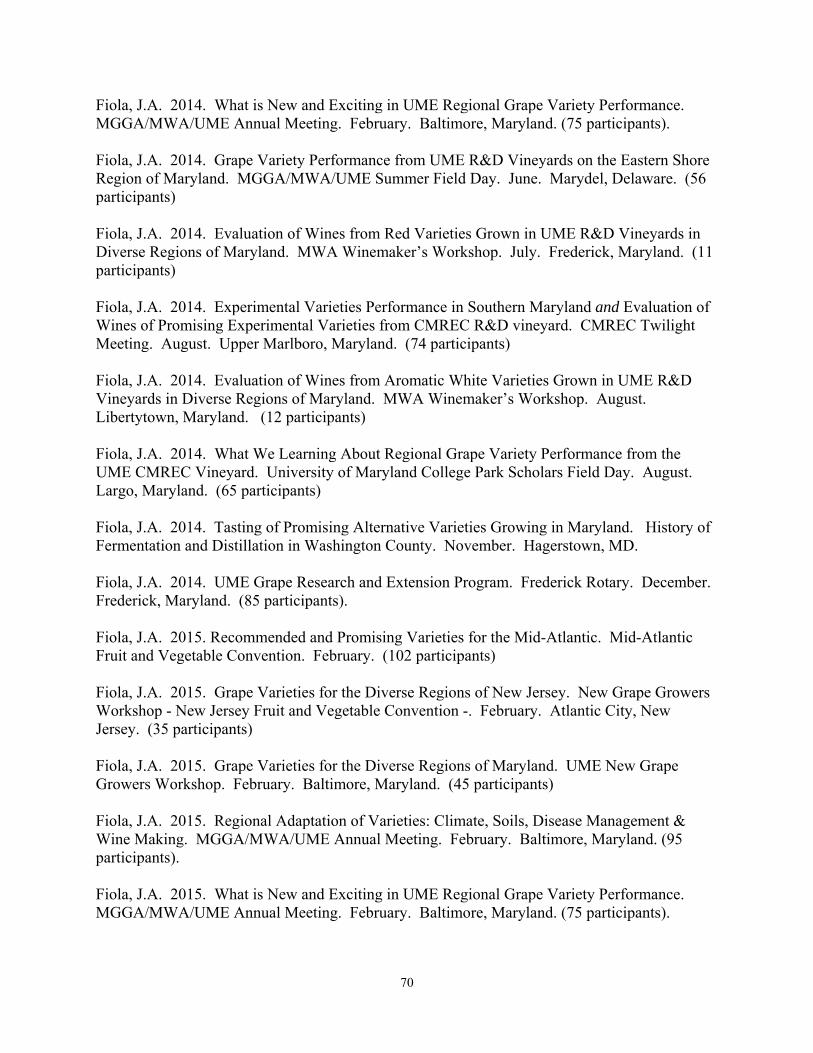
70
Fiola, J.A. 2014. What is New and Exciting in UME Regional Grape Variety Performance. MGGA/MWA/UME Annual Meeting. February. Baltimore, Maryland. (75 participants). Fiola, J.A. 2014. Grape Variety Performance from UME R&D Vineyards on the Eastern Shore Region of Maryland. MGGA/MWA/UME Summer Field Day. June. Marydel, Delaware. (56 participants) Fiola, J.A. 2014. Evaluation of Wines from Red Varieties Grown in UME R&D Vineyards in Diverse Regions of Maryland. MWA Winemaker’s Workshop. July. Frederick, Maryland. (11 participants) Fiola, J.A. 2014. Experimental Varieties Performance in Southern Maryland and Evaluation of Wines of Promising Experimental Varieties from CMREC R&D vineyard. CMREC Twilight Meeting. August. Upper Marlboro, Maryland. (74 participants) Fiola, J.A. 2014. Evaluation of Wines from Aromatic White Varieties Grown in UME R&D Vineyards in Diverse Regions of Maryland. MWA Winemaker’s Workshop. August. Libertytown, Maryland. (12 participants) Fiola, J.A. 2014. What We Learning About Regional Grape Variety Performance from the UME CMREC Vineyard. University of Maryland College Park Scholars Field Day. August. Largo, Maryland. (65 participants) Fiola, J.A. 2014. Tasting of Promising Alternative Varieties Growing in Maryland. History of Fermentation and Distillation in Washington County. November. Hagerstown, MD. Fiola, J.A. 2014. UME Grape Research and Extension Program. Frederick Rotary. December. Frederick, Maryland. (85 participants). Fiola, J.A. 2015. Recommended and Promising Varieties for the Mid-Atlantic. Mid-Atlantic Fruit and Vegetable Convention. February. (102 participants) Fiola, J.A. 2015. Grape Varieties for the Diverse Regions of New Jersey. New Grape Growers Workshop - New Jersey Fruit and Vegetable Convention -. February. Atlantic City, New Jersey. (35 participants) Fiola, J.A. 2015. Grape Varieties for the Diverse Regions of Maryland. UME New Grape Growers Workshop. February. Baltimore, Maryland. (45 participants) Fiola, J.A. 2015. Regional Adaptation of Varieties: Climate, Soils, Disease Management & Wine Making. MGGA/MWA/UME Annual Meeting. February. Baltimore, Maryland. (95 participants). Fiola, J.A. 2015. What is New and Exciting in UME Regional Grape Variety Performance. MGGA/MWA/UME Annual Meeting. February. Baltimore, Maryland. (75 participants).
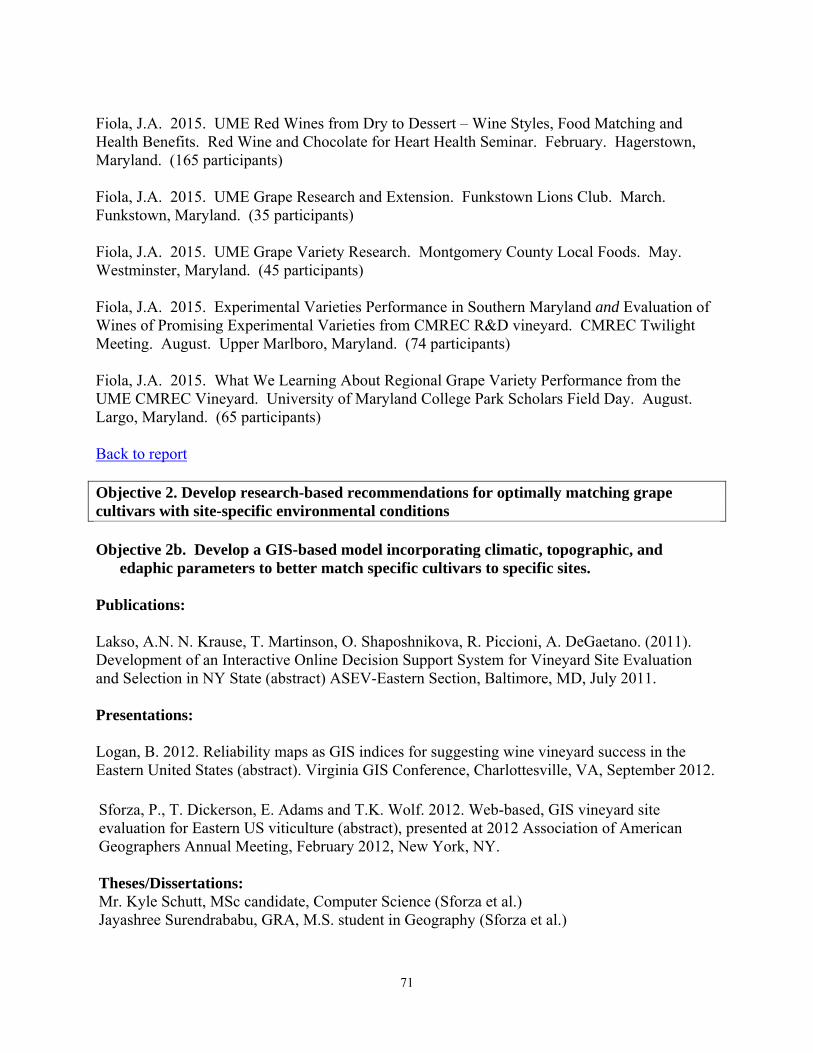
71
Fiola, J.A. 2015. UME Red Wines from Dry to Dessert – Wine Styles, Food Matching and Health Benefits. Red Wine and Chocolate for Heart Health Seminar. February. Hagerstown, Maryland. (165 participants) Fiola, J.A. 2015. UME Grape Research and Extension. Funkstown Lions Club. March. Funkstown, Maryland. (35 participants) Fiola, J.A. 2015. UME Grape Variety Research. Montgomery County Local Foods. May. Westminster, Maryland. (45 participants) Fiola, J.A. 2015. Experimental Varieties Performance in Southern Maryland and Evaluation of Wines of Promising Experimental Varieties from CMREC R&D vineyard. CMREC Twilight Meeting. August. Upper Marlboro, Maryland. (74 participants) Fiola, J.A. 2015. What We Learning About Regional Grape Variety Performance from the UME CMREC Vineyard. University of Maryland College Park Scholars Field Day. August. Largo, Maryland. (65 participants) Back to report Objective 2. Develop research-based recommendations for optimally matching grape cultivars with site-specific environmental conditions Objective 2b. Develop a GIS-based model incorporating climatic, topographic, and
edaphic parameters to better match specific cultivars to specific sites.
Publications: Lakso, A.N. N. Krause, T. Martinson, O. Shaposhnikova, R. Piccioni, A. DeGaetano. (2011). Development of an Interactive Online Decision Support System for Vineyard Site Evaluation and Selection in NY State (abstract) ASEV-Eastern Section, Baltimore, MD, July 2011. Presentations: Logan, B. 2012. Reliability maps as GIS indices for suggesting wine vineyard success in the Eastern United States (abstract). Virginia GIS Conference, Charlottesville, VA, September 2012. Sforza, P., T. Dickerson, E. Adams and T.K. Wolf. 2012. Web-based, GIS vineyard site evaluation for Eastern US viticulture (abstract), presented at 2012 Association of American Geographers Annual Meeting, February 2012, New York, NY. Theses/Dissertations: Mr. Kyle Schutt, MSc candidate, Computer Science (Sforza et al.) Jayashree Surendrababu, GRA, M.S. student in Geography (Sforza et al.)
72
Back to report Objective #3: Understand and capitalize on regional wine style through market exploration of consumer perception/demand, willingness to pay (WTP), and influence of quality-assurance programs Team Leader: Brad Rickard, Cornell University New York work: Publications: Rickard, B.J., J.J. McClusky, and R.W. Patterson. (2012) Reputation Tapping. AAWE Working Paper No. 119. 29pp. http://www.wineeconomics.org/workingpapers/AAWE_WP119.pdf Perla, J.M., B.J. Rickard, and T.M. Schmit. (2013) Do restaurants cater to locapours? Using Zagat survey data to examine factors that influence wine list selections. AAWE Working Paper No. 140. 31pp. http://www.wineeconomics.org/workingpapers/AAWE_WP140.pdf Presentations: Rickard, B.J., J.J. McCluskey, and R.W. Patterson. Examining consumer response to information about wine varietals and wine regions. Presented at the Wine Industry Workshop, Waterloo, NY. March 2012. Rickard, B.J., J.J. McCluskey, and R.W. Patterson. Examining consumer response to information about wine varietals and wine regions. Presented as a seminar in the Horticulture Department, Cornell University, March 2012. Rickard, B.J., J.J. McCluskey, and R.W. Patterson. Reputation Spillovers: Consumer Response to Wine Appellation Information. Presented at the Annual Meeting of the American Association of Wine Economists, Princeton, NJ, June 2012. Perla, J.M., B.J. Rickard, and T.M. Schmit. Do restaurants cater to locapours? Using Zagat survey data to examine factors that influence wine list selections. Presented at the Annual Meeting of the American Association of Wine Economists, Princeton, NJ, June 2012. Rickard, B.J., J.J. McCluskey, and R.W. Patterson. Reputation Spillovers. Presented at the Annual Meeting of the American Applied Economics Association, Seattle, WA, August 2012. Perla, J.M., B.J. Rickard, and T.M. Schmit. Do restaurants cater to locapours? Using Zagat survey data to examine factors that influence wine list selections. Presented at Viticulture 2013, Rochester, NY, February 2013. Perla, J.M., B.J. Rickard, and T.M. Schmit. Do restaurants cater to locapours? Using Zagat survey data to examine factors that influence wine list selections. Presented at the Northeastern
73
Agricultural and Resource Economics Association Annual Conference and Workshop, Ithaca, NY, June 2013. Back to report Objective #3: Understand and capitalize on regional wine style through market exploration of consumer perception/demand, willingness to pay (WTP), and influence of quality-assurance programs Team Leader: Brad Rickard, Cornell University North Carolina Work: Publications Heo, J., W.L. Walden, C.D. Safley, and S.E. Spayd. 201_. Wine consumer survey in North Carolina, Virginia, and New York. HortTechnology or Am. J. Enol. Vitic. (Ready for department review). Heo, J. and M. Wohlgenant. 201_. Estimating Demand for Wine: A Comparison Between Continuous and Count Data Models. In preparation Heo, J. and M. Wohlgenant. 201_. Demand for Wine Tourism In preparation Heo, J. and M. Wohlgenant. 201_. Demand for Wine by North Carolina and Virginia Consumers: An Application of Truncated Distribution Model In preparation Presentation: Heo, J. and C. Safley. 2014. North Carolina Consumer Wine Survey. North Carolina Winegrowers Association, Annual Conference, Winston Salem, NC, January 31 – February 2. Theses/Dissertations Heo, J. 2015. Ph.D. Three Essays on the Demand for Wine and Winery Tourism. Dept. Agr. Economics, NC State University, Raleigh. Back to report


