34
Progress report October 2013 Improved grape and wine quality in a challenging environment: An eastern US model for sustainability and economic vitality

Progress report
October 2013
Improved grape and wine quality in a
challenging environment: An eastern US model for sustainability and economic vitality

2
Participating institutions
USDA / NIFA Specialty Crops Research Initiative
Award Number 2010-51181-21599

3
Background
The eastern US wine industry (defined here as eastern seaboard states from New England to
north Georgia and extending west to include Pennsylvania, Ohio, Kentucky and Tennessee) has seen appreciable development over the past 20 years. The potential for further growth exists as per capita consumption of wine increases and consumers embrace locally produced foods;
however, eastern US wines do not have a monopoly on wine sales. To sustain further growth, eastern US wine grapes and wines must be of consistently high quality and they must be
produced on a cost-competitive basis. Two recurring features of the East’s climate – variable, but often excessive growing season precipitation, and winter cold damage – pose significant challenges to sustainable and profitable wine grape production. Abundant soil moisture can
translate to excessive vegetative vine growth with attendant increases in canopy management labor, fungal diseases, and decreased fruit and wine quality. Cold damage reduces crop, causes
additional vineyard variability, and ultimately erodes profitability. We described these problems in our grant application (January 2010) and proposed research and
extension solutions that have explicit, long-term goals of: more efficiently and precisely managing vine vegetative growth and vigor with the aim of
promoting increased grape and wine quality, reducing canopy management labor, and reducing the use of herbicide inputs and nitrogen losses from the vineyard;
reducing the occurrence of environmental stresses (including winter cold damage) through
better cultivar and vineyard site matching tools; reducing costs of grape production while improving grape and wine quality;
providing learning resources for producers, workforce development, and consumers; establishing a reputation for consistent, high quality grape and wine production in the East
Our vision was the creation, refinement and industry adoption of uniquely eastern US grape and wine production practices that integrate sound viticulture and enology recommendations with
key market drivers to achieve a robust and sustainable eastern US wine industry. To achieve this vision we proposed specific research and extension objectives that represented a synthesis of industry changes that our stakeholders desired in the short-term. Those objectives were:
1. Develop applied means of defining, measuring and achieving vine balance under the variable
environmental conditions of the eastern US. 2. Develop research-based recommendations for optimally matching grape cultivars with site-
specific environmental conditions.
3. Understand and capitalize on consumer attitudes towards eastern US wines through market exploration of consumer perception/demand, willingness to pay, and assessment of product
quality-assurance programs. 4. Implement a broad range of innovative learning resources to improve grape and wine quality,
inform vineyard site evaluation, decrease production costs, train trainers and workforce labor,
and ultimately improve the competitive basis of the eastern US wine industry.
This report focuses on activities from the 2012 and 2013 seasons (through much of Year 3) while providing a cumulative summation for some objectives.

4
Executive Summary (2010-2013)
Funding for this five-year project was awarded in September 2010 and we recently completed the third fiscal year of performance. Research is on track with the originally proposed timeline.
Personnel retirements and one resignation over the past 12 months have necessitated some changes in Principal Investigators, but this has had minimal or no impact on the research objectives or deliverables. Project expenses at the prime, and six sub-contracting institutions, is
essentially on track with proposed budgets.
Objective #1a involves field experiments in NC, NY and VA that use either perennial or annual vineyard floor cover crops, rootstocks, and other means of vine vegetative growth suppression to create a desirable canopy architecture and improve wine quality potential. The VA study has
shown that root restriction and under-trellis cover crop (UTCC) were independently effective in suppressing vegetative development of vines as measured by rate and seasonal duration of shoot
growth, lateral shoot development, trunk circumference, and dormant pruning weights. The net effect was that less time was needed for specific canopy management practices, such as lateral shoot and leaf removal and shoot hedging. Certain components of yield, including berry weight,
were reduced by vineyard floor management and root restriction; the UTCC also generally increased juice and wine color density and total phenolics, but depressed must Yeast Assimilible
Nitrogen (YAN) levels. Wines have been made from the various treatments and both preference tests and sensory descriptive analyses have revealed modest but positive impacts of improved fruit exposure on finished wines. We have published one peer-reviewed article on this work and
have two additional manuscripts in preparation. Initial findings have been presented at industry as well as professional meetings.
The comparable vine size management experiment in the Finger Lakes of NY was engineered to collect soil leachate to assess how vineyard floor management system affected the movement of
nitrogen and applied agrochemicals through the soil profile. White clover ground cover was associated with a surprising, bi-modal release of nitrogen in late-winter and again in autumn,
2012, presumably from seasonal decomposition of the legume. A subset of soil solution samples will be analyzed for neoniconitoid insecticides applied to vines at the site in 2012.
The related NC study has generally shown a positive correlation between the width of the weed-free area under the trellis and the extent of grapevine vegetative growth, again illustrating some
benefits are obtained by decreasing the width of the herbicide strip in terms of canopy management. Expected outcomes with all three experiments include a strategy for predictably managing both the extent and duration of vine vegetative growth, which will directly reduce
canopy management labor and have the potential to improve fruit composition and wine quality. We expect to see less soil leaching of nutrients and herbicides with a more comprehensive use of
either perennial or annual cover crops. Cover crops also compete with grapevines for essential nutrients, thereby requiring increased
attention to the nutrient management program. The research in Virginia is exploring various forms, rates, and timings of nitrogen application to grapevines in order to optimize vine N status
and berry YAN in situations where cover crops are used over the entire vineyard floor. The
5
expected outcomes of this work will be a strategy to more efficiently use nitrogen fertilizer to benefit the vine (and fermentation).
Objective #1 also includes field research to define and accurately measure the variability that
exists in cluster exposure within grapevine canopies. The definition of variability is an important step towards reducing variability. This work demonstrated the potential to reduce required samples sizes by nearly 70% in a vineyard by sampling according to Normalized Difference
Vegetation Index (NDVI) imagery, resulting in savings in labor and lab materials.
Additional studies of objective 1, also replicated in NY, VA and NC, seek to discover how cluster exposure in a given variety (Cabernet franc) impacts certain secondary metabolites associated with aroma and other wine sensory attributes. This work commenced in 2012, is being
repeated in 2013, and some aspects will likely be conducted in the 2014 growing season as well.
An additional line of investigation in NY explores means of regulating shoot vigor, again with the overall aim of improving vine “balance”. Increasing shoot number per vine effectively reduced individual shoot (cane) mass; however, canopy division, such as Scott Henry or Lyre
training, might be needed to properly expose all shoots on vines carrying higher shoot numbers. Additionally, shoot vigor has been found to be much more uniform with spur pruning
than with cane pruning. These results illustrate several practical means of regulating vine size and vigor.
Objective #2, like the first objective, involves several sub-objectives. We are using two approaches to help match suitable grape varieties with specific vineyard sites in this objective.
First, information from a national winegrape variety evaluation (NE-1020) will be analyzed with respect to viticulture performance and enological evaluation of resultant wines. The NE-1020 is a coordinated, national research project that uses uniform research protocols among member
institutions to generate an extensive database of grape, grapevine, and wine data. An additional component of the variety evaluation explores means of altering tannin concentrations in finished
wines with selected white and red grape varieties. A feature of many of the hybrid and American-type red wine varieties used in the eastern US is low tannin concentrations in wine. Conversely, some of the hybrid white cultivars (e.g., Traminette) common in the East, often
exhibit somewhat bitter phenolic finishes.
The second aim of Objective 2 is to develop a web-based Geographical Information System (GIS) tool that incorporates the variety performance data with climatic, topographic, and edaphic parameters to improve “site-cultivar” selection. The eastern US GIS tool, which we expect to
launch in early 2014, will build upon state-specific tools that our research teams have deployed in Virginia and New York. In practice, anyone with internet connectivity will be able to evaluate
the potential vineyard suitability of a parcel of land, and obtain general recommendations on varieties that would be expected to perform well at the site. We envision the tool as a high-resolution, first step in the vineyard site evaluation process.
Perhaps some of the most important questions and problems for the eastern wine industry are
those that relate to consumer perceptions of eastern US wines. Multifaceted research at Cornell University and at North Carolina State University seeks to explore consumers’ perceptions,

6
motives to purchase, and satisfaction with eastern US wines in Objective #3. Research at Cornell has shown two important findings. First, drawing attention to AVAs for wines from emerging
regions does not seem to impact consumers’ valuation, even among consumers that are relatively familiar with wine. However, efforts to highlight AVAs in emerging regions as part of a larger
package of information may be a critical component of developing a long-term strategy for building reputations of new wine appellations. Second, point-of-sales information that drew references to well-established regions in France resonated well with buyers, indicating that
making such links to famous regions may prove to be an effective marketing strategy for emerging wine regions, notably among consumers with greater familiarity with wine.
A telephonic consumer survey of nearly 3,000 wine consumers was conducted in North Carolina, Virginia and New York in early 2013 under the direction of Charles Safley at North Carolina
State University. Survey respondents were asked questions about the wine industry in their respective state, including how they first learned about any local wineries, why they visited the
winery, and whether they purchased wines. The data are now being analyzed to develop consumer profiles, wine purchase patterns, prices paid for wine at various market outlets, and consumption habits. The final industry report will present and discuss the survey results,
conclusions and recommendations for retailers to improve their market position or take advantage of current trends. Finally, we will conduct demand analysis for wine cultivars and
brands with the goal of enhancing managers’ decisions. The solutions and resources created by this project have the potential to improve the profitability
and sustainability of the eastern wine industry. However, those solutions must be transformed into practices and delivered to the eastern wine industry in order to realize this potential.
Objective #4 is aimed at transforming the knowledge created by this project into commercially sustainable practices using a variety of resources. Extension workshops and short courses are principal means of delivering research based information. These workshops allow for direct
contact between investigators and growers/vintners as well as important networking opportunities for the industry. For example, project investigators worked with the Virginia
Vineyard Association in 2012 to host a canopy management and vine balance workshop, in which over 140 growers participated. A series of 4 “research summits” is now planned for February 2014. These summits will highlight research that is coming to fruition and will be
conducted in concert with industry meetings in North Carolina, Virginia, Ohio and New York.
Educational events for Cooperative Extension agents/educators will also be provided under the auspices of this project. For example, Virginia Tech hosted 31 extension agents from the southeastern US on 12 June 2013 for an in-service training workshop on grapevine canopy
assessment and modification. And while the project is not intended to directly train a labor workforce for the wine industry, the project will deliver educational tools useful to that goal.
Examples include the online site suitability tool and the Wine Production Guide for Eastern North America (Wolf, 2008). The majority of project investigators are involved in the Grape Community of Practice which develops material for eXtension’s grape content:
http://eviticulture.org/. The site has seen overwhelming traffic – the grapes component has had 522,770 visitors since going online with an average of two minutes and eight seconds spent per
page.

7
Objective #1a: Develop applied means of achieving vine balance under variable conditions
Team Leader: Tony K. Wolf, Virginia Tech
Virginia Experiment 1: Cover crops, rootstocks, and root restriction as means of
optimizing vine balance
Tony Wolf and Cain Hickey
Issue: Variable but often surplus precipitation during the growing season frequently contributes to excess vegetative growth of grapevines. This exacerbates fungal diseases, and is associated
with inferior wine quality due to fruit shading and overly vigorous grapevines that require increased canopy management labor. Conversely, drought, poor soil conditions, pest injury and occasionally other factors may constrain vine size. Optimal vine balance is achieved when the
extent and duration of vegetative growth match the training/trellising system, crop level, and ultimate wine stylistic goals. The following experiments seek to regulate vine vegetative growth
so as to more closely achieve well balanced vines that produce high quality fruit. Research Approach A field experiment was initiated in 2006 at Virginia Tech’s AHS
Agricultural Research and Extension Center in Winchester, Virginia to examine techniques that may restrict vegetative development of vines. The experiment uses Cabernet Sauvignon (clone
#337), which exhibits a high degree of inherent vigor. The experiment comparisons are (a) complete vineyard floor cover crop compared with (b) a conventional scheme of row-middle only grass combined with an 85-cm under-trellis weed-free (herbicide) strip. Within these main
plots three rootstocks are compared as sub-plots: 101-14, 420-A, and riparia Gloire. The rootstock plots are further divided into three sub-sub plots that compare (a) the use of root-
restriction bags (RBG); (b) the use of head-training and cane pruning; and (c) no root manipulation (NRM). The root restriction treatment was imposed by planting the vines at standard soil depth within root-restrictive fabric bags of approximately 0.16 m3 volume. The
head-training and cane pruning treatment reduces the volume of perennial wood (carbohydrate reserves) maintained on the vine, compared to cordon-training and spur-pruning used with all
other treatments. Drip irrigation (0.6 gal/hr in-line emitters at 1-foot intervals) was installed with separate systems for the more frequently watered RBG vines only, or for the entire set of treatments as needed. The vision for this experiment was to pursue a series of questions over a
multi-year period, as: Can vegetative growth (and vigor) of vines be predictably regulated?
If so, does the modification of vine growth have an impact on resultant wines? How would moisture availability alter the vines’ response to treatment? Do treatments have impacts on vine longevity, nutrition, or pest resistance?
Results
After the initial years of this project (2008 and 2009), we reported that both the UTCC and RBG treatments could reduce shoot growth rate, vine canopy development and cane pruning weights (Hatch et al. 2011), as well as contribute to differences in wine quality potential, including color
density (Hickey and Wolf, 2013).
Subsequent research conducted during the 2010 and 2011 seasons, led by graduate student Cain Hickey, focused on the impact of vine water status on fruit yield components and wine quality

8
potential. Differential irrigation levels (HIGH and LOW) were implemented on 4-June 2010 and 13-June in 2011 as an addition to some of the original experimental factors. The treatments that
included HIGH stress (less irrigation water), attained lower (more stressed) water potential readings earlier in the season than any of the other treatments. We explored how this water stress
may impact fruit, and ultimately, wine quality. Field treatments that resulted in small vines under relatively high water stress levels had the lowest total titratable acidity (TA) levels and, in all cases, the UTGC treatments resulted in less titratable acidity relative to Herb within each
respective RM-Irr + UTGC treatment level. The same trends for TA existed for malic acid (MAL) levels, with the exception of the RBG-HIGH + UTGC treatment levels, when CC
resulted in slightly higher malic acid levels relative Herb (Table 2). Soluble solids (˚Brix) levels were lowest in RBG-HIGH + UTGC treatment levels in 2010 and, while less separation existed between treatment levels in 2011, the RBG-LOW + UTGC treatment levels resulted in lower
˚Brix levels relative to other RM-Irr + UTGC treatment levels. For each respective treatment level, TA and malic acid levels were higher and pH and ˚Brix levels lower in 2011 relative to
2010; the 2010 season was hot and dry, while the final 60 days of the 2011 season were unusually wet. Yeast-assimilable nitrogen (YAN) was typically depressed by under-trellis cover cropping, which we have noted in companion studies. Wines were made from field treatments in
2010 and 2011 following standard protocols for small-lot, experimental wine making. Triangle sensory analyses of young wines point to treatment differences in both aroma and flavor of 2010
wines; however, more detailed, descriptive analyses are needed on the wines after further bottle aging.
Figure 1. Cabernet Sauvignon (clone 337) in vine size regulation experiment at Winchester, VA. Vines on left are grown with “conventional” floor management of interrow cover crop and intrarow (under-trellis) herbicide strip. Note the extent of lateral shoot development prior to
véraison. On the same date, vines on right illustrate use of intra-row cover crop. Note here the lack of lateral shoot development.
The Winchester experiment is being continued with a comparative evaluation of head-training/cane-pruning, and cordon-training/spur-pruning followed at least through the 2014
season. We also started data collection in 2012 with a small project comparing different sizes of

9
root-restriction bags in an effort to optimize the vine size response to this form of vegetative growth restriction. We plan to analyze the material and establishment costs of root restriction
with root bags to determine whether annual savings in dormant pruning and summer canopy management offset the establishment costs of root restriction.
Virginia Experiment 2: Efficient nitrogen fertilizer use in vineyards with under-trellis
cover crops
DeAnna D’Attilio and Tony Wolf
Issue: Vineyards have turned towards intensive cover cropping as a method to battle excessive vine vigor, reduce soil erosion on steeper slopes, and reduce the need for herbicides. In many situations cover crop establishment has resulted in competition for soil nitrogen and
consequently diminished vine nitrogen status and reduced YAN levels in must. This project seeks to determine optimal rates, materials, and timing of annual nitrogen fertilization
applications in fully cover-cropped vineyards. Our goal is to recommend a balanced fertilization approach in which growers can capitalize on the known benefits of cover-cropping while also avoiding fertilization practices that contribute to excess cover-crop growth, and the adverse
outcome of over-competition for nitrogen.
Research approach: This study, initiated in 2011, explores nitrogen fertilization applications at three commercial vineyard sites that have experienced perennial problems of low nitrogen status in the vines and in the grape must. Wine grape varieties include: seven-year-old Petit Manseng,
thirteen-year-old Sauvignon Blanc, and ten-year-old Merlot vines. All research plots contain under-trellis cover crops, except in herbicide strip control panels. Treatment rates, application
time, and method of application for one such site (Glen Manor) are provided in “Table 3”, below.
Progress: Nutrition analysis for nitrogen status has been measured by petiole and blade samples, chlorophyll content index, and berry YAN. Soil samples were also collected to consider the
confounding role of soil fertility on other measured parameters. Ceptometer readings were recorded to assess light exposure and an enhanced point-quadrat-analysis (EPQA) was conducted to describe general canopy architecture. Components of yield and primary fruit chemistry (Brix,
TA, YAN) data were collected at harvest. Berry samples were pressed and the juice was analyzed for certain amino acids using Ultra Performance Liquid Chromatography (UPLC).
Cane prunings were collected to assess treatment effects on vine size. It is premature to draw conclusions from initial results of this project; however, we anticipate presenting preliminary findings to industry and at professional meetings in 2014.

10
Publications and presentations on this effort: Hatch, T.A., C. C. Hickey, and T.K. Wolf. 2011. Cover crop, rootstock and root restriction
regulate vegetative growth of Cabernet Sauvignon in a humid environment. Am. J. Enol. Vitic. 62:298-311.
Hickey, Cain and T.K. Wolf. “Influence of vine capacity and water status on wine quality
attributes of Cabernet Sauvignon”, presented at Eastern Section, ASEV meeting, Towson,
MD. July 2011 (http://ajevonline.org/content/62/4/553A.full.pdf+html).
Wolf, T.K. “Cover crop, rootstock and root restriction effects on Cabernet Sauvignon dormant bud cold hardiness”, presented at Eastern Section, ASEV meeting, Towson, MD. July 2011 (http://ajevonline.org/content/62/4/553A.full.pdf+html).
Hickey, Cain. 2013. “Multi-season effects of rootstock and intrarow cover crops on vine growth
and fruit composition of Cabernet Sauvignon . Presented at the 64th ASEV National Conference, June 2013, Monterey, CA (http://asev.org/docs/2013RegistrationGuide.pdf)
Hickey, Cain, T.A. Hatch and T. K. Wolf. Multi-season effects of rootstock and intra-row cover crops on vine growth and fruit composition of Cabernet Sauvignon. (in preparation).
New York Experiment
Ian Merwin, Justine Vanden Heuvel, Anna Katharine Mansfield
The experimental vineyard is a five-year-old Cabernet franc vineyard near Cayuga Lake, where
we are comparing groundcover management systems (GMS) effects on vine vigor, fruit composition, soil physical and biological conditions, and agrochemicals leaching and runoff.
Four GMS treatments were established in 1-m-wide strips beneath the vine rows during Spring of 2011: 1) Native vegetation; 2) Glyphosate herbicide applied in May and July; 3) White clover (cv. Dutch White) seeded in May each year after de-hilling the vines; and 4) Mechanical
cultivation. Our test hypotheses are that different groundcover treatments will influence vine nutrient and water status, moderate vine growth, berry composition, as well as nutrient and agro-
chemical leaching in comparison with the standard glyphosate herbicide treatment which eliminates groundcover vegetation in the vine rows for most of the growing season.
Table 3 – Glen Manor: Primary fruit chemistry and fruit yeast assimilable nitrogen (YAN) by treatment.
pH TA (g/L) °Brix YAN (mg/L)
Treatment 2011 2012 2011 2012 2011 2012 2011 2012
Control 3.42 3.28 6.42 4.56 21.9 21.4 119.1 157 b
30 kg/ha N soil (bloom)
3.43 3.28 6.05 4.80 21.5 21.5 138.2 175 b
30 + 30 kg/ha N soil (bloom + véraison)
3.43 3.27 6.13 5.57 21.8 21.4 153.9 174 b
35 kg/ha N foliar (7 applications)
3.44 3.31 6.14 4.75 22.2 21.4 154.6 228 a

11
Methods: We installed 32 subsoil lysimeter troughs (HDPE plastic catchment basins, 1.5-m long, 0.7-m wide, by 0.4-m deep), placing 16 between and 16 beneath existing vines in situ at the
vineyard. Each below-ground lysimeter captures leachate and runoff water, and diverts it down-slope through a buried pipe to a sampling station located in the next vine row. Nitrogen,
phosphorus, and fungicide concentrations in leachate and runoff water are being sampled bi-weekly from May to November in each groundcover vine-row treatment. Water sample turbidity (to quantify sediment loss and erosion) and concentrations of recently applied fungicides
(quantified by immunoassay methods) are being measured as obtained in lysimeter water samples, using established methods as described by Merwin et al. (1996). Leachate N from
lysimeters is analyzed using automated cadmium-reduction continuous-flow colorimetry (Perstorp Analytical, Alpkem, OR). Plant nutrient availability and vine nutrient status are monitored annually by sampling 20-cm-depth soil cores, and vine petioles at bloom and veraison
in each treatment combination, with analyses by standard methods at the Cornell University Nutrient Analysis Lab.
Results: Only selected highlights from the past year will be included in this progress report. The unusually hot and dry 2012 growing season provided ideal conditions to observe GMS effects on
vineyard soil water content, and there were sustained differences in soil water content among the GMS treatments. From May to July of 2012 the average volumetric water content ranked
Glyphosate (GLY) > Cultivation (CULT) > Native Vegetation (NV) > White Clover (WC), while from May to July or 2013, the average volumetric water content ranked CULT>GLY>NV>WC (data not shown).
The drainage lysimeter system functioned as intended, although there was substantial variability
in leachate water volumes from plot to plot, as reported in previous field lysimeter experiments at this and other sites (Merwin et al, 1996). Saturated drainage outflows were collected from most of the GMS plots on more than 20 occasions during the first nine months of 2012, and
analyzed for dissolved organic carbon, nitrate-N, and total N content (Figs. 3-A & B). The apparent trend for dissolved organic carbon (DOC) was that higher leachate DOC was observed
in the glyphosate and cultivation treatments during most of the year. This indicates increased decomposition of soil organic matter and plant residues on these two GMSs, compared with the white clover and native vegetation (mixed weed species) treatments. For leachate N
concentrations the trend differed; for most of the last year the leachate N concentrations were greater in outflows from the white clover plots compared with the other three GMSs (Fig. 3-B),
presumably indicating N release from root nodules and decomposition of this legume cover crop. A subset of the leachate water samples was frozen and archived for subsequent analyses of
pesticide residues—specifically the neonicitinoid class of insecticides, that were applied at this vineyard for pest control during mid-summer in 2012. GLY and NV had the highest proportion
of plots containing detectable amounts of imidacloprid in leachate (Fig. 4), while CULT had the lowest.
Yield per vine differed among GMSs in 2012, with vines in the GLY treatment producing approximately 2 kg/vine more fruit than other treatments (more clusters and more berries per
cluster). Fruit composition did not differ among treatments. We collected a great deal of data on soil characteristics (porosity, bulk density, penetration resistance, saturated infiltration rate,

12
-20
0
20
40
60
80
100
9/14/11 12/23/11 4/1/12 7/10/12 10/18/12 1/26/13 5/6/13 8/14/13
To
tal N
itro
ge
n (m
g N
/l)
in
lea
ch
ate
wa
ter
Fig. 3B: Total N in drainage leachate water (+/- SD bars)
CULT
GLY
NV
WC
saturated hydraulic conductivity, soil respiration rate, and soil nutrient status, but found only few differences among treatments in 2011 and 2012.
Figures 3-A and B. Leachate concentrations of dissolved organic carbon (Fig. 3A), and total
nitrogen content (Fig. 3B), observed for between-vine drainage lysimeter samples under four GMSs during the 2012 growing season. Legend: WC = white clover cover crop, GLY = glyphosate herbicide, NV= native vegetation, CULT = cultivation.

13
North Carolina Experiment
Sara Spayd
Issue: Preliminary research in North Carolina has demonstrated that weed competition and
herbicide strip width can influence grape vine growth and yield. However, NC growers are concerned about alternate hosts for Pierce's Disease within the vineyard, so this potential threat needs to be evaluated in the context of vineyard floor management as a means of achieving a
desirable vine balance.
Research Approach: A study was implemented in a mature Cabernet franc vineyard over a five-year period beginning in 2011. Treatments were applied to 5-vine plots, each replicated four times. The treatment design is a 2 x 5 factorial, with one factor being duration of weed
suppression: (weed-free through June or completely weed-free through harvest), the second factor being herbicide strip width (0, 30, 60, 90, 120 cm).The following data was collected for all
treatments: crop components of yield, dormant pruning weights, trunk circumference at bloom, primary fruit chemistry and YAN at harvest, cover crop and weed stand, and canopy density. The weed-free cover crop treatment evaluations include: leaf petiole N, P, and K at bloom and
véraison; soil chemistry (NO3, NH4, organic matter, pH, P, and K); N, P, and K of fruit at harvest; stem water potential; and soil moisture. For the 0, 60, 120 cm weed-free cover crop
treatments the incidence of summer bunch rot diseases and Pierce’s disease is evaluated. If the incidence of downy mildew or powdery mildew was >5% in control plots, the incidence and severity of these diseases was evaluated in all plots.
Progress: Studies were initiated at RayLen Vineyards and Winery in Mocksville, NC to
determine the impact of varying vegetation-free in-row strip width on wine grape yield and quality. Cabernet Franc grapes were planted in 2001. Treatments included 0, 1, 2, 4, and 8 ft wide strip widths. Plots were divided into a weed-free and a weedy subplot. The weed-free
subplot was maintained weed-free using a nonselective post-emergence herbicide throughout the entire time. The weeds were allowed to establish in the weedy subplots and grow July 2011
through September 2011 (harvest). Weed pressure was relatively low and visually there was little difference between the weed-free and the weedy subplots. Strip width treatments were established in March 2011 and weeds were removed with subsequent herbicide sprays
(glyphosate, glufosinate, or paraquat) or hand removed as needed. Vegetative measurements including vine cross sectional area (Feb. 2011 and Feb. 2012), pre-pruning weight (Feb. 2012),
and lateral counts (Feb. 2012) were determined. Fruit measurements included crop yield, individual berry weight, cluster count, pH, acidity, and Brix. Production practices for wine grapes were according to North Carolina recommendations. Experimental design was a split-
plot design with 6 replications. Number of shoots per vine did not differ between strip widths. Vines with no vegetation-free in-row strip had fewer laterals per vine and per shoot than those
with an 8’ vegetation-free in-row strip. Weed stand had no effect on number of shoots/vine, laterals/vine, and laterals/shoot.
Summary comments for Objective #1a:
Objective #1a involves field experiments in NC, NY and VA that are intended to evaluate practical means of creating a more favorable vine balance of vegetative growth and quality fruit

14
production. The research explores the use of vineyard floor cover crops, rootstocks, and other means of vine vegetative growth suppression. Expected outcomes include a strategy for
predictably managing both the extent and duration of vine vegetative growth, which will directly reduce canopy management labor and have the potential to improve fruit composition and wine
quality. We expect to see less soil leaching of nutrients and herbicides with a more comprehensive use of either perennial or annual cover crops. Cover crops also compete with grapevines for essential nutrients, thereby requiring an increased nutrient management program.
The research in Virginia is exploring various forms, rates, and timings of nitrogen application to grapevines in order to optimize vine N status and berry YAN. The direct benefits of this research
include practical measures to create a more optimal vine balance and canopy architecture which reduces the need for canopy management labor and reduces the potential for soil erosion on steep vineyard slopes. The expected indirect benefits include reduced fungal disease pressure,
increased fruit and wine quality attributes, and possibly improved soil quality. The cost of using cover crops more extensively will include a more intensive monitoring of vine water status over
the growing season, the potential need for irrigation to supplement vine water needs during drought, and the need to adjust fertilization practices to minimize the nutrient competition of living ground covers.
Objective #1b: Develop canopy and crop management metrics to achieve consistent vine
balance and canopy microclimate
Issue: Research intended to improve grape quality generally tests treatment effects on fruit
composition, but results are often confounded by variability in canopy density, cluster shading,
or crop load. In addition, descriptions of canopy characteristics and crop load often lack the
quantitative precision needed for unambiguous interpretation. We propose to develop and apply
additional quantitative methods for the description of canopy structure, light/temperature
microclimate, and crop load to both standardize our research approach, and also to produce tools
that growers can use in their vineyards to optimize canopy and crop management.
Experiment 1: Canopy description and development of tools for determining canopy metrics
Team Leader: Dr. Justine Vanden Heuvel, Cornell University
We recently developed a set of grower tools for use in determining descriptive canopy metrics
and defining appropriate canopy architecture (Meyers and Vanden Heuvel, 2008). These tools,
which easily determine the cluster and leaf exposure levels, have demonstrated that small
differences in fruit exposure can impact fruit chemistry (Meyers et al., 2009). In years 1 and 2 of
this study, additional field measurement and analysis tools will be developed to improve grower
decision-making through a focus on four guiding principles: precision, efficiency, utility, and
operational priority. Building upon Enhanced Point Quadrat Analysis (EPQA) and Exposure
Mapping (EM) (Meyers & Vanden Heuvel, 2008), these new tools will expand canopy field
measurements beyond the fruiting zone to better quantify light and temperature environments
within whole vines. Expanded statistical analysis functionality will quantify both block-level and
canopy-level variability with a minimal number of field measurements, through the use of

15
spatially explicit sampling protocols and computational models that can be tuned for each
grower’s vineyard based on EPQA results. These protocols will guide growers/winemakers in
selecting clusters that best represent variability within their vineyards, and instruct them on the
potential consequences of measured vine variability on fruit quality and wine flavor/aroma
profiles.
Summary of research accomplishments as of December 2012
Modeling and tools: A new approach for establishing canopy metrics was published (Meyers et
al. AJEV 63:1) that helps growers to find optimal quantitative canopy architecture targets that
balance competing production objectives. This was developed as a general model which will
utilize response curves arising from Experiment 2 to determine specific canopy targets.
A cluster temperature model, designed to estimate hourly berry temperature by deriving cluster
conditions from local weather data and vineyard conditions, as described by Cola, et al.
(Agricultural and Forest Meteorology, 149) has been partially implemented as an Excel
spreadsheet and is being tested against 2012 season temperature data.
Experimental methods: In 2012, experimental methods for the measurement of cluster interior
temperatures was expanded to more thoroughly cover canopy locations, cluster exposure, and
temporal differences. Clusters in four leaf-removal treatments (described in detail in status for
Objective 1b experiment 2) were measured via thermocouples, placed inside cluster along rachis,
and logged continuously. Within each treatment, three clusters were selected to represent east
side, canopy center, and west side. In addition, light measurements were expanded to more
thoroughly cover canopy spatial variation and temporal changes by deploying LICOR LI-191
line quantum sensors were deployed into fruiting zone of each treatment. A Leaf area
measurement, two shoots per vine at harvest, was added to harvesting protocol to investigate
operational crop load.
Publications:
Meyers, J.M., G.L. Sacks, and J.E. Vanden Heuvel. (2012). A Computational Approach for
Balancing Competing Objectives in Winegrape Production. Am J Enol Vitic. 63(2):296-300.
Experiment 2: Impacts of light and temperature variation in canopies on specific
flavor/aroma compounds in Cabernet franc across different geographic regions
Research Approach: Field experiments with Cabernet franc in NY, VA and NC commenced in
2012 to evaluate the impact of vineyard macroclimate and vine microclimate on fruit composition and wine quality attributes. Twenty panels of each cultivar will be selected based on measured natural vineyard variation in cluster exposure to ensure a broad range of exposures.
Canopy architecture will be quantified using EPQA (Meyers and Vanden Heuvel, 2008) with ceptometer readings at berry set and véraison. Spatial and temporal variability in berry

16
temperature will be estimated through a simulation model (Cola et al., 2009), which will be validated using data from temperature monitoring in clusters of east and west exposure and in the
shaded interior in the differing climates of NY and NC. Our model will be adapted to integrate both EPQA-measured canopy variability and local weather information. At harvest, fruit from
varying exposure treatments will be pressed separately, and light and temperature response curves will be generated using Cabernet franc/Cabernet sauvignon must for isobutylmethoxypyrazine (green bell pepper aroma), catechin and epicatechin (bitterness,
astringency), quercetin and myricetin (bitterness, astringency, color stabilization), anthocyanins (color), and B-damascenone (amplifies fruit aromas) using either UV-vis HPLC or GCxGC-
TOF-MS where appropriate. Response curves will be compared across regions (NY, NC, VA) to determine the impact of local climate and vineyard conditions on juice flavor and aroma profiles. Small-lot wine-making is being done to evaluate treatment impact on wine sensory analyses.
Progress (New York experiment used as example): In 2011 a canopy assessment protocol was
defined for quantifying cluster exposure via point quadrat measurements and ceptometer readings. In 2012 four treatments were defined for influencing cluster exposure: 1) Control, laterals removed from first five nodes; 2) Severity 1, laterals removed from nodes 0-5, leaves
removed from nodes 0-2; 3) Severity 2, laterals removed from nodes 0-5, leaves removed from nodes 0-3; 4) Severity 3, laterals removed from nodes 0-5, leaves removed from nodes 0-5.
Specific protocols were defined in 2012 for harvest, destemming, crushing, stabilizing, macerating harvested fruit, and for quantifying phenolics in must including anthocyanins, hydroxycinnamtes, flavonols, tannins, and polymeric color. Macerating juice was sampled at five
time points (3, 24, 48, 72, and 120 hours) in 2012.
Results: Preliminary analyses of the New York 2012 response data showed that leaf pulling treatments were effective in altering canopy architecture, measured by enhanced point quadrat analysis (EPQA). Treatments resulted in the intended statistically significant effect on cluster
exposure metrics without affecting yield components. Treatments resulted in significant responses of Brix, pH, TA, malic acid. Maceration timing treatments were effective in
establishing a range of response in phenolic concentrations. A preliminary analysis of quantitative light responses (linear fitting at R2 > 0.5) suggests that combined quantitative responses to cluster exposure flux availability (CEFA) found that responses to cluster exposure
were generally strongest in the 48-hour maceration timing. The 48-hour maceration timing indicated positive responses of total flavonols to CEFA at fruit set and véraison, and polymeric
color to CEFA fruit set and véraison. A negative y-intercept for polymeric color response at fruit set suggests that a non-linear model may be justified, pending further analysis. 48 hour maceration timing indicated a negative response of fructose to CEFA (R2 = 0.5).
Experiment 3: Estimating climate-specific vineyard capacity for balancing crop levels
Team Leader: Dr. Alan Lakso, Cornell University
Cabernet Franc/101-14 vines at 2.1x2.7 m (7x9 feet) on a deep, silt loam soil have been
excessively vigorous. To create more balanced vines, we used the combined approach of: • balance-pruning to 40 shoots/kg (16/lb) of pruning weight to regulate average shoot length to a
target of about 1.2 m (4 feet) in length and 30 grams/cane winter pruning weight • shoot spacing of 15/m of trellis (4-5 shoots/foot) to avoid dense canopies

17
0
10
20
30
40
50
60
70
20 30 40 50 60 70 80
Me
an c
ane
We
igh
t (g
)
Shoots/Vine
VSP
• providing adequate trellis length by horizontally dividing the canopy into a Lyre training system to accommodate the need for more shoots. The Lyre used spur pruning to fill the total
trellis length which also promotes uniformity of shoot vigor.
Figure 1 (right). Relationship of shoot number per vine and
mean individual cane weights of Cabernet franc grapevines
trained either to VSP or to divided-canopy, Lyre. The shaded bar indicates the desired
range of cane weight.
Compared to the normal VSP-
trained vines, with 35-40 shoots/vine, the higher numbers
of shoots per vine with Lyre training in 2012 showed: (1) greatly reduced shoot vigor
with average canes weights very close to the ideal 30 grams/cane (approximately 4 foot shoots), and (2) the balanced pruning
gave much better vine-to-vine uniformity in shoot vigor than did the VSP.
We determined the relationship of shoot numbers per vine (2.1 m or 7 foot spacing in row) to
final average cane weight (Fig. 1). This showed that in this soil, a minimum of 50 shoots per vine were needed to control shoot growth. Balanced pruning reduced variability of shoot vigor.
The 2012 season was long (due to early bud break), warm, and dry and vines were irrigated twice. The VSP vines needed 2 toppings with a significant amount of regrowth and many laterals in the canopy. The Lyre vines were only topped once, showed no regrowth, had few laterals, and
required very little management beyond shoot positioning.
We repeated in 2012 the crop load study with four crop levels in each system from which wines were made in the Cornell Vinification and Brewing Lab. VSP had crops of 4.5, 6.5, 12.4 and 15.3 tonnes/ha (2.0, 2.9, 5.4 and 6.8 tons/acre) compared to 5.7, 10.7, 14.0 and 19.3 tonnes/ha
(2.6, 4.8, 6.2 and 8.5/acre). Due to the warm long season in 2012, all crop levels gave a minimum of 23˚ Brix, with the Lyre system giving the lowest standard deviation in Brix due to
the balanced pruning. Extractable anthocyanin concentrations were essentially the same for both systems at any crop level. The evaluation of the wines is not yet complete.

18
Objective 2. Develop research-based recommendations for optimally matching grape
cultivars with site-specific environmental conditions
Objective 2a: Evaluation of viticultural and enological performances of novel wine grape
cultivars (linkage with NE-1020 project)
Team Leaders: Imed Dami, The Ohio State University (Viticulture) and Anna Katharine Mansfield, Cornell University (Enology)
Issue: Cultivar and clone evaluation is an on-going, dynamic exercise in the Eastern U.S. wine
industry. The dynamics are caused by introduction of novel cultivars through breeding programs, wine-maker preferences for certain clones, phytosanitation efforts that eliminate pathogens from otherwise desirable clones, climate change, and the novelty of grape and wine production in
specific parts of the region. The acclaim of a wine region frequently hinges on the relative success of one or two fortuitous matches of cultivar to local conditions, such as Pinot noir in the
Willamette Valley of Oregon, or Sauvignon blanc in Marlborough, New Zealand. Consumer recognition of "signature" grape cultivars associated with specific states or sub-regions in the East remains elusive. Cultivar evaluation provides a sound footing for developing such cultivar
recognition.
Research Approach: We have linked this objective with the existing USDA/NIFA (formerly CSREES) Research Project, NE-1020 (“Multi-state evaluation of wine grape cultivars and
clones”) of which many of the PIs and collaborators are members. The NE-1020 is a national project for grape cultivar and clone evaluation, the goals of which are recognized as a high priority with the National Grape and Wine Initiative (http://www.ngwi.org/). The historical
justification, goals, and membership of the NE-1020 project are at the NE-1020 web site (http://www.nimss.umd.edu/homepages/outline.cfm?trackID=4034). The entire NE-1020 project
membership comprises researchers in 29 states. Our effort involves the following member institutions (alphabetically) and associated Principal Investigators of this project:
Connecticut Agricultural Experiment Station (Dr. Bill Nail) University of Maryland (Dr. Joe Fiola)
North Carolina State University (Dr. Sara Spayd) Cornell University (Dr. Justine Vanden Heuvel The Ohio State University (Dr. Imed Dami)
The Pennsylvania State University (Dr. Robert Crassweller)
Viticulture progress: All cultivars are maintained and managed under similar viticultural practices as outlined by the NE1020 protocol (lgu.umd.edu/lgu_v2/homepages/saes.cfm?trackID=4034). The viticultural data collected are
based on the NE-1020 guidelines as described in objective #1, and include the following: recording phenology (bud break, bloom, véraison, ripening, and leaf fall based on development
stages scale by Eichhorn and Lorenz (1977), computing crop loads (years 1-5), and determining vine size, fruitfulness, yield components and fruit composition at harvest. The data are compiled in a web-based relational database available to NE-1020 PIs.

19
Enology Progress: Wines were produced at Penn State from three cultivars grown at the Biglerville site (Cabernet Franc, Chambourcin, and Merlot) and five grown at the Erie site
(Cabernet Franc, Chambourcin, Gruner Veltiner, Pinot grigio and Vidal blanc.) Cornell’s Vinification and Brewing lab produced wines from 9 cultivars grown in Geneva, NY, and 12
cultivars grown at the CT research station for a third and second year, respectively. Industry and research tastings across sites were conducted in the summer of 2013, and are planned for the national NE 1020 meeting held in Nebraska in November 2013. A final year of winemaking will
be completed this fall. For a second year, the phenolic profile was assessed for wines produced from locally sourced Riesling, Gewürztraminer, and Traminette with pre-fermentation skin
contact time ranging from 2 – 48 hours. Concentrations of key phenolic compounds varied significantly by cultivar and skin contact time, with lesser variation by year. Initial screening by a consumer panel suggested that increased perception of bitterness and astringency coincides
with different levels of skin contact time for each cultivar. To further explore this theory, a detailed sensory evaluation with a trained panel was performed during summer 2013. A final
year of winemaking will be completed this fall. Evaluate the impact of processing parameters on the phenolic profiles of white wines. For a
second year, the phenolic profile was assessed for wines produced from locally sourced Riesling, Gewürtraminer, and Traminette with pre-fermentation skin contact time ranging from 2 – 48
hours. Concentrations of key phenolic compounds varied significantly by cultivar and skin contact time, with lesser variation by year. Initial screening by a consumer panel suggested that increased perception of bitterness and astringency coincides with different levels of skin contact
time for each cultivars. To further explore this theory, a detailed sensory evaluation with a trained panel will be performed during summer 2013. A final year of winemaking will be
completed this fall. (Mansfield).
Evaluate the effect of processing parameters on the
phenolic profile of hybrid red wines. Data collected in year 1 suggested that common processing methods have
little impact on phenolic concentrations in hybrid red wines, and related work at Cornell suggests that compounds extracted during winemaking may be lost to
concurrent sorption by insoluble must components. In response to these findings, this experiment was
redesigned to assess the impact of addition time on the retention of commercially available enological tannins in red hybrids Maréchal Foch, Corot noir, and Arandell.
Replicate lots of Maréchal Foch must
are fermented using different tannin addition Photo by A.K. Mansfield.
HPLC analysis of year-2 wines point to increased retention and larger mean degree of polymerization (mDP) with later tannin additions. Year 2 wines will be evaluated by a sensory
panel during summer 2013 to assess the practical impact of these additions. A final year of winemaking will be completed this fall. (Mansfield)

20
Expected outputs of Objective 2a: We will identify pros and cons of cultivars newly released or
new to the East from the NE1020 project. Of paramount importance is their cold hardiness, the most limiting factor of clone success. We will also develop a coordinated database of several
quality attributes, in particular the amount of YAN and phenolics in fruit and wine. The best fruit processing and vinification practices will also be identified to optimize phenolics in white and red wines.
Presentations and publications on this effort:
Fiola, J.A. 2012. Grape Varieties for the Diverse Regions of Maryland. New Grape Growers
Workshop. Oxon Hill, Maryland. (45 participants) Fiola, J.A. 2012. What We Are Learning About Regional Grape Variety Performance from Our
R&D Vineyards in Maryland. MGGA/MWA/UME Annual Meeting. Oxon Hill, Maryland. (42 participants)
Fiola, J.A. 2012. Chambourcin – “The” Grape Variety for the Mid-Atlantic. Eastern Wineries Exposition - Red Hybrids Session. Lancaster, Pennsylvania. (125 participants)
Fiola, J.A. 2012. Grape Varieties for the Mid-Atlantic. New Grape Growers Workshop.
Lancaster, Pennsylvania. (75 participants) Fiola, J.A. 2012. Grape Varieties for Hot Climates – Vine Performance and Wine Evaluation.
VESTA Regional Grape Symposium. Surry, North Carolina. (75 participants)
Fiola, J.A. 2012. Wine grape variety recommendations for Maryland. [Six separate presentations within Maryland during 2012; participation ranged from 30 to 75/meeting].
Dami, I. and Y. Zhang. 2011. OSU Grape Variety Trial Update. Ohio Grape-Wine Electronic Newsletter (OGEN), Ohio State University, 31 August.
Dami, I., S. Ennahli, Y. Zhang, and G. Johns. 2011.Sub-Zero Temperatures in 2011…Not 2009 again! Ohio Grape-Wine Electronic Newsletter (OGEN), Ohio State University, 10 February.
Dami, I. OSU Grape Variety Trials – NE1020 Project. Field Day. Ashtabula Agricultural
Research Station - Ohio State University, Kingsville. 19 August 2011.
Objective 2b. Develop a GIS-based model incorporating climatic, topographic, and
edaphic parameters to better match specific cultivars to specific sites .
Team Leader: Peter Sforza, Virginia Tech
Issue: Vineyard site and cultivar decisions are more often driven by emotion and market perception than by research-based information; fruit quality and consistency of production often

21
suffer as a consequence. Objective 2b proposes an ambitious synthesis of the cultivar performance data collected in sub-objective 2a, with contemporary climate, topographic, and
soils datasets into an interactive GIS platform. Virginia Tech’s Center for Geospatial Information Technology (CGIT) was tasked with developing a GIS based assessment and web application
designed to evaluate site suitability for viticulture and improve matching of specific grape varieties with specific sites. Our goal is to develop the next generation GIS viticulture decision-aide that builds on ones previously developed in VA in the late-nineties, as well as more recent
platforms developed for NY (http://www.nyvineyardsite.org) and Virginia (http://vmdev.cgit.vt.edu/Vineyards/).
Progress: The East Coast Viticulture Suitability development site, located at
https://vmdev.cgit.vt.edu/ECVineyards, provide users with report generation capabilities that provide information on topographic, edaphic, and climatological features related to viticulture at a site-specific scale as well access to maps visualizing the those features at a regional scale. The
current development website is a temporary location for the web application. By the end of 2013, the web application will be moved to a production server at Virginia Tech.
In the last year, the Report Generation Tool has been replaced with one that has capabilities to provide site-specific data for all of the states in the East Coast Region (previously it only
supported Virginia) and now reports correct data for topographic and basic climatologic parameters.
A screen shot of the website in its current state.
A major task that has experienced a lot of progress in this past year was processing the SSURGO
and STATSGO soils data at a regional scale for incorporation into the report generation tool. This is a complex process, especially for such a large region because it is a substantial dataset
stored in a large number of relational tables. However, we have developed parameter aggregation scripts that automate the summarization of a list of viticulturally-relevant soil parameters and
22
processed the majority of the study area at this point. The report generation code pertaining to soil properties was made available in July, 2013.
Major improvements and additions have been made to the suite of Climate-related tools utilized
in this study. An update on the existing tools is listed in the list below. Tools that are new within the past year are denoted by *.
NCDC Import Tool: Improved the NCDC fetching mechanism to include the new
versions of weather data, and to connect to the NCDC Web Service for any type of weather data.
NCDC Generator: Only maintenance was completed on this recently. This tool is used to process NCDC data so that it is easily useable in the ArcGIS environment.
*Daily Surface Statistics Tool: This tool allows for the calculation of duration and frequency of specific weather events over a given study period.
CAI Model Calculator: This tool was mostly completed in the previous year, however was implemented this year to generate climatologically-aided interpolated rasters and
feature classes based on NCDC stations and PRISM data. The tool allows for Krig or IDW interpolations.
*Degree Days Tool: This tool uses raster inputs from the CAI Model Calculator or
tabular NCDC data to calculate degree days in a given study period. This tool is still being finalized to produce a more robust growing degree day model output.
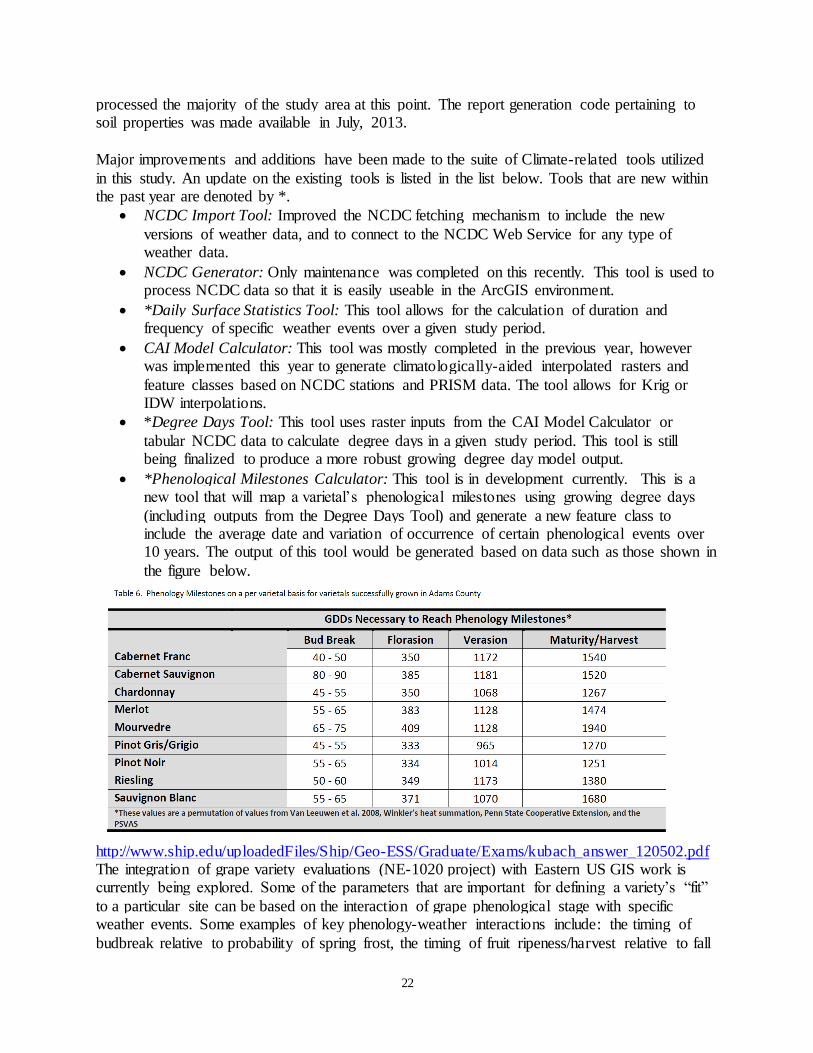
*Phenological Milestones Calculator: This tool is in development currently. This is a new tool that will map a varietal’s phenological milestones using growing degree days
(including outputs from the Degree Days Tool) and generate a new feature class to include the average date and variation of occurrence of certain phenological events over 10 years. The output of this tool would be generated based on data such as those shown in
the figure below.
http://www.ship.edu/uploadedFiles/Ship/Geo-ESS/Graduate/Exams/kubach_answer_120502.pdf The integration of grape variety evaluations (NE-1020 project) with Eastern US GIS work is currently being explored. Some of the parameters that are important for defining a variety’s “fit”
to a particular site can be based on the interaction of grape phenological stage with specific weather events. Some examples of key phenology-weather interactions include: the timing of
budbreak relative to probability of spring frost, the timing of fruit ripeness/harvest relative to fall

23
frost, and the sensitivity of candidate variety to high temperatures particularly in the last 30 to 45 days before harvest. Many phenology models are developed using simple heat accumulation or
degree-day models. We have developed temperature interpolation method (CAI Model) and a simple Degree-day calculator that will allow us to model heat accumulation across the eastern
U.S. and then use accumulated degree day surfaces to predict the dates of phenological stages at all sites. In this scenario, phenology models and the frequency of weather events during phenological stages are used to inform the potential fit of a variety to a site. The NE1020 data or
other variety trial data can provide observations to assess phenology model estimates, to calibrate and validate the phenology model results, and to provide an estimate of uncertainty.
In an effort to include NE1020 data to potentially inform varietal suitability modeling, we have began building databases of the NE 1020 data and geocoding their locations, but it is still limited. The integration of NE1020 and other variety trial data into GIS has the potential to support
decision-making related to variety and site selection, particularly if consistent and more complete information can be collected from the NE1020 trials.
In late July 2013, a new GIS server was established that will be leveraged for production hosting of the web application including the geodata, geoprocessing services that produce the site
analysis and report. A service level agreement with the Enterprise GIS group will help ensure that there is a specific period (to be determined) of hosting and storage available for the
application during the funded project, and potentially longer. Our approach in developing the data and logic behind the application is to automate steps that will likely be repeated in the future using scripts. There will be a need for occasional maintenance and updates to the data and
software application beyond the period of the project.
Summary comments for Objective #2b: Potential, as well as existing, Eastern US grape producers will benefit from access to a vineyard
site suitability assessment tool in several ways. Prospective growers can gain a first-step analysis as to site suitability. Our previous experience with the Virginia web-based tool has shown that
this information may be fundamentally as important in illustrating the liabilities of a potential site as illustrating the positive features. In the latter case, the web-based tool is a first-step analysis. The tool will also provide linkages either to variety-specific information that will help
inform growers and potential growers of how well a particular variety would “fit” the climatic and biological constraints of the site. This should help avoid a mismatch of “warm season”
adapted varieties being grown in “cool climate” vineyard sites, which might entail considerable replant costs to the grower.
Objective #3: Understand and capitalize on regional wine style through market exploration
of consumer perception/demand, willingness to pay (WTP), and influence of quality-
assurance programs
Team Leader: Brad Rickard, Cornell University
Issue: Eastern US wine regions can be thought of as small but growing economic clusters (exhibiting a range of economic activity within a defined geographical area). Successful clusters
24
include strengths in the areas of demand, factor conditions, firm structure, and industry support. Market strengths and weaknesses are poorly understood within the eastern US wine industry.
Experiment 1, Cornell University
Research Approach: To assess the role of information, regional reputations based on American Viticulture Areas (AVAs), and reputation tapping activity that link U.S regions to wine-
producing regions in France, an experiment was conducted in the Cornell University Lab for Experimental Economics and Decision Research in December 2011 and January 2012, using
staff members of Cornell University and some additional adults from the Ithaca community. A total of 264 subjects, all regular wine drinkers, participated in one of 12 sessions. Subjects were randomly assigned to one of three different information treatments, and then asked to place bids
on seven white wines. The wines are from seven different AVAs in the United States; three from California, two from Oregon, and two from Virginia. Expert wine ratings for each wine were
presented in an effort to communicate that the wines are of similar quality. Three information treatments were used. Wines in the first treatment were introduced without any additional information, the collective reputations (AVAs) were described in the second treatment, and the
collective reputations are described and augmented with information about similar regions in France in the third treatment. We use the data from our auctions to disentangle the effects from
information about the collective reputation and information about reputation tapping. Results: Our results show two important findings. First, drawing attention to AVAs for wines
from emerging regions does not seem to impact consumers’ valuation, even among consumers that are relatively familiar with wine. However, efforts to highlight AVAs in emerging regions
as part of a larger package of information may be a critical component of developing a long-term strategy for building reputations of new wine appellations. Second, our results suggest that information containing references to well-established regions in France did resonate with
subjects in our experiment, indicating that making such links to famous regions may prove to be an effective marketing strategy for emerging wine regions, notably among consumers with
greater familiarity (and perhaps greater appreciation) for wine. Experiment 2: Using Zagat survey data to examine factors that influence restaurant wine
list selections
Research Approach: To further explore the demand for eastern U.S. wines by examining wine lists at restaurants in New York State, food and wine menus were collected from all Zagat-rated restaurants in NY State, and the information was used in a statistical model to assess what drives
restaurants to list NY wines. In addition to understanding what motivates restaurants to sell NY wines, this might also be a novel way to examine the definition of “local” by including a variable
that measures the distance from restaurants to wine regions in NYS in a spatial model. The Zagat Survey is a very rich and yet very under-utilized resource in restaurant data collection. As a premier and well-established rating group, Zagat contains a large amount of information across
a wide variety of restaurants (approximately 5000 restaurants in NYS). Much of the data is available electronically; however, menus for Zagat-rated restaurants were also collected to
describe wine availability and prices.

25
Results: Preliminary analysis of the data suggests that the type of restaurant, Zagat Survey cost per person, and proximity to an AVA increase the likelihood of a restaurant serving NYS wine.
High-priced restaurants tend to have a larger wine menu with higher priced wines in order to reflect their overall price level, aesthetic, and culinary goals. Restaurants in our sample with
meal prices closer to the sample mean are more likely to serve NYS wine; this may be due in part to the price points for NYS wines, that are also close to our sample mean. Similarly, the type of restaurant (captured through a series of dummy variables in the model) appears to influence
wine availability; for example, a Sushi Bar would be less likely to sell NYS wine than would a New American restaurant. Lastly, restaurants are more likely to sell wine from their closest AVA
and not as likely to sell wines from more distant AVAs. Publications on this effort:
Rickard, B.J., J.J. McClusky, and R.W. Patterson. (2012) Reputation Tapping. AAWE Working
Paper No. 119. 29pp. http://www.wineeconomics.org/workingpapers/AAWE_WP119.pdf Perla, J.M., B.J. Rickard, and T.M. Schmit. (2013) Do restaurants cater to locapours? Using
Zagat survey data to examine factors that influence wine list selections. AAWE Working Paper No. 140. 31pp. http://www.wineeconomics.org/workingpapers/AAWE_WP140.pdf
Rickard, B.J., J.J. McCluskey, and R.W. Patterson. Examining consumer response to information about wine varietals and wine regions. Presented at the Wine Industry Workshop,
Waterloo, NY. March 2012.
Rickard, B.J., J.J. McCluskey, and R.W. Patterson. Examining consumer response to information about wine varietals and wine regions. Presented as a seminar in the Horticulture Department, Cornell University, March 2012.
Rickard, B.J., J.J. McCluskey, and R.W. Patterson. Reputation Spillovers: Consumer Response
to Wine Appellation Information. Presented at the Annual Meeting of the American Association of Wine Economists, Princeton, NJ, June 2012.
Perla, J.M., B.J. Rickard, and T.M. Schmit. Do restaurants cater to locapours? Using Zagat survey data to examine factors that influence wine list selections. Presented at the Annual
Meeting of the American Association of Wine Economists, Princeton, NJ, June 2012. Rickard, B.J., J.J. McCluskey, and R.W. Patterson. Reputation Spillovers. Presented at the
Annual Meeting of the American Applied Economics Association, Seattle, WA, August 2012.
Perla, J.M., B.J. Rickard, and T.M. Schmit. Do restaurants cater to locapours? Using Zagat survey data to examine factors that influence wine list selections. Presented at Viticulture 2013, Rochester, NY, February 2013.
Perla, J.M., B.J. Rickard, and T.M. Schmit. Do restaurants cater to locapours? Using Zagat
survey data to examine factors that influence wine list selections. Presented at the Northeastern

26
Agricultural and Resource Economics Association Annual Conference and Workshop, Ithaca, NY, June 2013.
North Carolina Survey: Team Leader, Charles Safley
A survey tool was implemented in January-February 2013 to determine consumer attitudes regarding wines produced in NC, VA, and NY in cooperation with NCDA/USDA NASS
(contracted) New York, Virginia and North Carolina. Individuals indicating a willingness to participate in a telephone survey and who indicated that they like wine were selected from a
purchased list. Seven hundred useable surveys were obtained with 263 from NC, 180 from NY and 258 from VA. Between 50 and 63% of respondents were female. Population age was fairly uniformly distributed between four age categories: 25-44, 45-54, 55-64 and 65 or older. Less
than 2% of the respondents were age 21-24. With the exception of NC, at least 50% of the respondents indicated a household income of $50,000 or more. Forty-four percent of the
respondents reported incomes in that range. At least 60% of the respondents at least attended college, while 20-23% of the respondents indicated an education level of high school diploma or less. At least 70% of the respondents in all states were white and 15 to 22% of the respondents
were African-American, depending upon state.
Overall, 98% of the respondents purchased at least one bottle of wine in 2012. In the month prior to the survey, in NC and VA, most wine was purchase at a grocery store. Wine cannot be sold in grocery stores in NY. So, most wine in NY was purchased at a state controlled liquor store or a
specialty wine store. In NC and VA, box stores were sites of the second for wine purchases. Restaurant sales of wine were significantly greater in NY than in NY and NC. Mail order, though permitted in all three states, was a very low proportion of wines purchased.
All respondents indicated that either they or someone in their household consumed wine in 2012.
Overall, 22.3% of the respondents indicated that they consume wine several times a week, while 20.8% indicated they consumed wine less than once a month. This proportion differed between states. NY and VA had a larger proportion than NC of respondents indicating wine consumption
as several times a week, while the reverse was true for those indicating wine consumption as less than once per month. Respondents indicated a preference for red wine with Merlot the preferred
varietal. Chardonnay was the preferred white varietal wine and White Zinfandel the preferred rosé wine. Choice of wine to purchase had three main drivers, in order: brand loyalty, price and recommendation of friends or family. These reasons constituted over 50% of reasons for
purchasing a particular wine. The fourth driver for selecting a particular wine was that it was a new brand that the respondent wanted to try.
Of the small percentage of respondents that purchased wine on-line or by mail order in 2012, most respondents purchased more than 5 bottles. There were more respondents who purchased
12-17 bottles in this manner than those who purchased 6-11 bottles. In NY and VA, 35-38% of the respondents indicated they purchased 24 or more bottles in this manner in 2012. Bottle price
of wine purchased either on-line or by mail varied by state. Forty one percent of respondents from NY buying wine in this manned indicated that they spent $20 or more per bottle, while only 19% of respondents from NC and VA spent that amount.
For grocery store purchases in NC and VA, about 30% of the respondents purchased from 1-5 bottles in 2012. In NC 26.6% and in VA 34.4% of the respondents purchased 24 or more bottles

27
of wine in the grocery store in 2012. A majority of respondents from both states spent less than $15/bottle on wine purchased from the grocery. More respondents purchased wine costing $20
or more per bottle from grocery stores in VA (6.9%) than in NC (2.8%).
Purchase patterns for those respondents who bought wine in specialty stores in 2012 differed by state, with more wine purchased from those stores in NY than VA and NC. This was not unexpected since wine is not sold in grocery stores in NY. More respondents bought 24 or more
bottles of wine at specialty stores in NY than in NC or VA. More respondents bought wines at the $10.00 to $14.99 price point in all three states than at lower or higher price points.
A majority of respondents in NC and VA who purchased wine at wineries in 2012 purchased 1-5 Over 60% of the respondents purchased wine in restaurants or bars in 2012. Most respondents
purchased 11 or fewer glasses of wine in 2012 at a restaurant or bar. However, roughly 25% of respondents purchased 24 or more glasses of wine at a restaurant or bar in 2012.
Roughly 70% had tasted wine produced in their state and about 30% of the respondents tasted wines produced in their state within the last month. However, about another 30% of the
respondents had not tasted wine produced in their state in a year or more. Overall, 55% of respondents indicated that they bought a wine from a winery in their state because it was produced in their state. A majority of VA respondents (57.4%) were very satisfied with the
quality of wine produced in VA, while slightly less than a majority of respondents in NC (48.3%) and NY (49.4) were very satisfied. Of 701 respondents, not just those who bought wine
at a winery, across all three states, 344 (49.1%) respondents indicated that they prefer wines produced elsewhere in the US to wines produced in their own state. Only 128 respondents (18.2%) indicated that they prefer wines produced in their own state, the remainder indicated that
they did not know. Of those respondents who prefer dry wine 62% indicated that they prefer wines from other states. Across all states for respondents preferring sweet wines, 37.3 preferred
out-of-state produced wines. However, this preference differed by state. NY and VA followed the overall-trend. More NC respondents (35.6%) preferred NC produced sweet wines than out-of-state (26.1%) produced sweet wines. This pattern may reflect a portion of the consumer base
in NC that has a preference for sweet muscadine wines. Of those respondents who preferred wines produced in their state, 61.3% of NC respondents indicated their preference was due to the
taste of the wine, perhaps also reflecting a preference for muscadine based wines. NY (38.9%) and VA (46.3%) respondents indicated a taste preference. Preference based on “locally grown products are healthier” varied by state (NC 13.3%, NY 27.8%, VA 31.3%). Less than 10% of the
respondents in all three states indicated their preference was due to either state loyalty or reduced environmental/carbon footprint. For those respondents who preferred wines from other states,
the taste was by far the major consideration (65.3%) whether the wines were sweet or dry.
Winery billboards (19.3%) and books/magazines (18.3%) were where respondents, regardless of
whether or not they went to a winery, found/seen information about wineries in their state. Family/friends/neighbors (19.3%) and the newspaper (11.5%) were also sources for information. Individually, other print materials (brochures), wine festivals websites, wine clubs and other
media resources accounted for less than 5% of the information base about in-state wineries for respondents. When asked why they visited a winery a larger proportion of respondents indicated
that it was for something to do (32.9%) or to learn about the winery (wine tasting, 25.7%).

28
Objective #4: Develop a range of resources including decision-assisting tools to encourage
implementation of production practices that improve grape and wine quality, decrease
production costs, and improve the competitiveness of the Eastern US wine industry.
Team Leader: Tremain Hatch, Virginia Tech
Goals: The goal of the research component of this project is to provide solutions to fundamental constraints to grape and quality wine production in the East. The goal of the Extension
component is the informed transformation of those solutions by industry members into sustainable practices for the production of high quality, regionally branded wines that compete
favorably in the market. We continue to pursue the Extension component of this project through manifold approaches:
1) Annual meetings of project staff and the Project Advisory Council: We assembled a Project Advisory Council (PAC) to provide input and to monitor the project’s progress. Members
of the PAC attended the PI meeting in Mystic CT in November 2012 and summarized their impression of progress and recommendations in a follow-up letter. Two PAC members were specifically invited to attend an interim PI meeting in Winston-Salem NC in July 2013,
following the Eastern Section meeting of the ASEV. One PAC member, Mr. Jim Benefiel, was interviewed as part of a Virginia Tech news story on the development of the Eastern US
viticultural GIS tool (http://www.vt.edu/spotlight/innovation/2013-09-16-grapes/gis.html). PAC members will be invited to attend one of four regional “Research Summits” now planned for February 2014, to be held in concert with industry annual meetings in NC, VA, OH and NY.
2) Panel Survey of Eastern grape wine growers in Years 1 and 4: Dr. Jayaratne, the project
evaluator, collected input from other participants in the SCRI and developed a baseline survey instrument to determine the status of knowledge of the eastern US grape industry in year one (see year-one report). Concept awareness questions focused on grapevine canopy management
strategies, winemaking issues, site and cultivar interaction, and wine marketing issues. This survey study was conducted with 1,094 wine grape growers and wine makers in 13 states in
eastern US. The target audience was selected from membership lists of grower associations and wineries in sub-regions, and will reflect the demographics, grape varietal mix, and market objectives of each group. The survey instrument was executed through the VT Survey Center
and results returned to Dr. Jayratne for evaluation. The survey will be repeated in year 4, including additional questions regarding respondent exposure to and use of information provided
by the project. In order to promote a high response rate for the survey in year 4, we will conduct focus-group meetings in conjunction with the four regional “Research Summits” scheduled for February 2014. The focus-group approach will help us learn what growers think is working and
what we might need to change. It will also allow another point of contact with the growers that we anticipate will help improve our survey response rate in year 4.
3) Educational events/media: We will provide in-depth shortcourses, hands-on field workshops, and demonstrations for producers. The structure for annual workshops and industry
meetings is largely in place and typically coordinated through state-specific grower/vintner organizations, such as the Pennsylvania Association of Winegrowers (PAW), Ohio Grape and
Wine Conference (OWPA), the Virginia Vineyards Association (VVA), and the Finger Lakes Grape Grower’s Convention. Extension workshops and short courses are principal means of
29
delivering research-based information to the wine industry. These workshops allow for direct contact between PI’s and growers as well as important networking opportunities for the industry.
For example, we organized a full-day meeting on 14 June 2012 at Virginia Tech’s Alson H. Smith Jr. AREC in Winchester, VA to teach methods of defining canopy architecture and
practices to favorably modify canopy architecture when needed, a skill required of producers. The workshop paired classroom style lessons with hands-on practice in the AREC research vineyard to expose 140 attendees to ideal grapevine training systems, vine canopy metrics, and
methods to modify canopy architecture. Of the 140 participants, 68 completed evaluations reflecting about 466 acres of Virginia vineyards. Ninety percent of attendees "strongly agreed"
that "the canopy management workshop improved their understanding of vine balance and the factors that affect vine balance". Seventy-eight percent of attendees "strongly agreed" that "the workshop gave them at least one idea to try in their vineyards to reduce the amount of "remedial"
canopy management labor required.
In a similar fashion, PIs Mansfield (Cornell), Nail (CT Ag Expt Station) and collaborator Gardner (Penn State) provided an informative tasting of NE-1020 varieties at a practical workshop held in Geneva NY in August 2013; the workshop was described in a trade publication
(http://www.winesandvines.com/template.cfm?section=news&content=121042).
4) Educational events for Cooperative Extension agents and educators: Although not planned in the first year, Wolf et al. conducted an in-service training workshop on commercial grape growing for Virginia Cooperative Extension agents in December 2011. A regional in-
service training program, co-sponsored by Virginia Cooperative Extension, the Virginia Vineyards Association, the Southern Region Small Fruit Consortium, and by this project
(USDA/NIFA SCRI) was conducted 11-12 June 2013 in northern Virginia. The meeting on 11 June focused on “Steep Terrain Grape Growing” and was conducted at two Virginia vineyards: RdV in Delaplane, and Glen Manor Vineyards near Front Royal. Organized by Virginia Tech’s
Tony Wolf, professor of viticulture, the “Steep Terrain” focus was intended to illustrate some of the benefits and liabilities of grape production on sites with slopes steeper than 15%; some of the
slopes at RdV and Glen Manor approach 40%. The second day of agent training (12 June) was conducted at Virginia Tech’s Agricultural Research and Extension Center (AREC) near Winchester. The goal of the 12 June meeting was to define vine “balance” and explain how
balance relates to wine grape crop production, disease management, and wine quality objectives. Agents were also introduced to practical measures that can be used to assess vine balance – both
in the pre-plant phase of vineyard design and once the vineyard is established and operational. The morning “classroom” sessions were followed in the afternoon by a hand’s-on demonstration of canopy assessment using vines in the AREC research vineyard. Vines were “scored” on the
basis of canopy leaf layer number, shoot density, shoot length, cluster exposure, and other metrics.
5) Outreach to workforce-development focused viticulture educational programs: Based on stakeholder input and interests, we recognize that sustainable growth of the eastern US grape and
wine industries will depend in part on training industry members at varied skill levels. While we cannot commit USDA resources to education, per se, the educational resources that are
generated in this project should be easily adapted to community college instructional format. For example, the Wine Grape Production Guide for Eastern North America (Wolf et al., 2008) is
30
used as the principal viticulture text by a number of community colleges, including Patrick Henry and Piedmont Virginia in VA; Surry, in NC; and Santa Rosa Junior College in CA. An
online survey of 43 community colleges and other viticulture programs in Eastern North America was conducted in early 2013 to determine which texts, resources and approaches
instructors use to educate their program participants. The majority of the respondents were viticulture/enology instructors or educational program coordinators. Of the responding community colleges, 78% have only enology programs, 17% have only viticulture programs, and
6% reported that they have both viticulture and enology programs. Nearly 67% of institutions offer two-year associate degrees. In addition to two-year degree program, 50% of the community
colleges offer one-year certificate program and 33.3% offer shortcourses for wine industry personnel. The most commonly used text books for teaching viticulture were Wine Grape Production Guide for Eastern North America, Tony Wolf (2008), Sunlight into Wine: A
Handbook for Wine Grape Canopy by Richard Smart and Mike Robinson (1991), and General Viticulture (2nd Edition) by A. J. Winkler, J. A. Cook, W. M. Kliewer, & L. Lider (1974). The
most commonly used text books to teach enology were Wine Science, (3rd Edition): Principles and Application by Ronald S. Jackson (2008), Wine Analysis and Production by Bruce Zoecklein, Ken Fugelsang and Barry Gump (1995), and Principles and Practices of Winemaking
by Roger B. Boulton (1998). In addition to these texts, respondents indicated that they use online Extension resources such as eXtension and Extension publications for teaching viticulture and
enology. Nearly 67% of the respondents indicated that they use Extension specialists as guest speakers for their students. Respondents also asked for current information about viticulture and enology. This survey was completed as an outreach effort to our project. We will alert
respondents to Extension resources and online resources that they may not be familiar with and/or are deliverables of this project.
6) On-line decision support tools (Dami, Lakso, Jones, Sforza, Wolf): As described under Objective #2, we are developing the next generation Geographic Information System (GIS) to
promote logical growth and development of the eastern US wine grape industry. Prior to access/use, users will be asked their top 2-3 reasons for using the site. Immediately after using
the site, users will be asked about their satisfaction with their experience with the site and their intended uses of the information. Depending on volume, we may proceed with follow-up contacts to determine how the GIS information was incorporated (or not) into site selection,
business and/or production planning.
7) Continued involvement and development of the eXtension Community of Practice (co-
PIs with extension appointments and collaborators): Our project includes an eXtension Communities of Practice (CoP) component. Communities of Practice are virtual networks of
individuals who share common interests, and learn together by sharing experiences and knowledge. The majority of our PI’s are involved in the Grape Community of Practice which
develops material for eXtension’s grape content: eViticulture. The site has seen substantial traffic – the grapes component has had 522,770 visitors since going online, with an average of two minutes and eight seconds spent per page. Check out the eViticulture portal at:
http://eviticulture.org/. This SCRI project director and coordinator hosted the annual eViticulture and NVEELC meeting in Richmond VA 11 March 2013. Seventeen members of the Grape
Community of Practice (GCoP) attended from 13 institutions across the US and Canada.

31
8) Development of vineyard capacity assessment resources (Lakso and Wolf) and
additional canopy architecture metrics (Vanden Heuvel): A practical method to estimate
vineyard capacities as well as cluster light environment will be developed as a deliverable for the project using the methods discussed in Objective #1b. The grower will be guided to 1) take
dimensions of their vineyard (spacing, trellis height, canopy thickness) to find the estimate of potential light interception on a graph; 2) estimate their trellis fill by choosing a photograph that most closely represents their vineyard; and 3) entering the potential and the trellis fill values into
a simple equation in a spreadsheet or on a website. The calculated value will estimate the largest crop that can be ripened. Although each unique set of vineyard and weather conditions will vary,
this quantitative method will provide a beginning point for site-specific management. The vineyard capacity estimation process and canopy architecture determination metrics will be explained and demonstrated at winter meetings, in small group sessions and via the web tutorials.
The project will assess grower use of these grower tools through end-of-session feedback tools.
9) Leadership development and knowledge transfer (all co-PIs): We consider the training of graduate students to be an important outcome of this research, as these students will be needed to assume vital industry and academic roles in the future to sustain the growth and development of
the Eastern wine-grape industry. A number of graduate students and two post-doctoral research associates are supported on this project, including (PI advisor in parentheses):
Cornell:
Joe Perla, MSc candidate (Rickard)
Dr. David C. Manns, post-doctoral research associate (Mansfield) Céline Coquard Lenerz, MSc degree (5/12) (Mansfield)
Diane M. Schmitt, MSc candidate (Mansfield) Dr. James Meyers, post-doctoral research associate (Vanden Heuvel) Ms. Rebecca Sirianni, MSc degree, “Vineyard floor management effects on vine balance, soil
quality and onsite retention of nutrients” (Vanden Heuvel) Mr. Adam Karl, MSc candidate (Vanden Heuvel)
North Carolina State University:
Mr. Nick Basinger, projected completion 5/15 (Jennings, Monks)
Mr. Kevin Elder, projected completion 5/15 (Spayd) Jeonghoi Heo (Safley)
Ohio State University:
Dr. Yi Zhang, PhD, aspects of NE-1020 variety evaluation
Shouxin Li, MSc continuation of Zhang work with NE-1020 Ms. Abigail Gerdes, MSc candidate in GIS
Virginia Tech:
Mr. Cain Hickey, MSc degree (2012), now PhD student, projected completion 6/15 (Wolf)
Ms. DeAnna D’Attilio, MSc candidate, projected completion 2/14 (Wolf) Mr. Kyle Schutt, MSc candidate, Computer Science (Sforza et al.)
Jayashree Surendrababu, GRA, M.S. student in Geography

32
Appendix A. Proposed timeline of work (from original proposal)
Year
Objectives/Task 1 2 3 4 5
Objective 1: Develop applied means to optimize vine balance and increase quality while minimizing environmental impact.
Sub A: Under-trellis viticultural practices * * * * *
Sub B: Canopy and crop measuring tools * * * *
Sub C: Impact of light and temperature variation * * *
Objective 2: Optimally match grape varieties with site
Sub A: Performance of novel wine grape cultivars * * * * *
Sub B: Develop GIS decision aide * * * * *
Objective 3: Market exploration of consumer perception/demand, willingness to pay, and impact of
quality-assurance programs
Sub A: Consumer decisions to purchase wines * * *
Sub B: Advertising and promotional programs * * *
Sub C: Consumer satisfaction * *
Sub D: Market segments * *
Sub E: Increase market share * * *
Sub F: Improving marketing, advertising, and promotional programs
* *
Sub G: Alternative advertising and willingness to pay (WTP)
* * * *
Objective 4: Encourage implementation of production practices that improve industry well-being and improve
competitiveness of the Eastern wine market
Sub A: Benchmark baseline knowledge/skills level and establish desired competency targets
*
Sub B: Produce and use outcomes/deliverables * * * *
Sub C: Obtain stakeholder feedback * * *

33
Appendix B. Project director, principal investigators, and collaborators
Program Staff (after PD, co-PIs are listed alphabetically by institution and then name): Dr. Tony K. Wolf (PD and co-PI), Professor of Viticulture, 75% Extension & 25% Research;
AHS Jr. Agricultural Research and Extension Center, Virginia Tech, 595 Laurel Grove Rd., Winchester VA 22602; [email protected]
Dr. William R. Nail (co-PI), Assistant Scientist II, 100% Research. The Connecticut
Agricultural Experiment Station, 123 Huntington Street, New Haven, CT 06504, [email protected] [RESIGNED 2013; role assumed by Dr. Frank Ferrandino]
Dr. Alan Lakso (co-PI), Professor, 70% Research, 20% Extension & 10%Teaching, Dept. of Horticultural Sciences, Cornell University, NY State Agricultural Experiment Station, Geneva, NY 14456; [email protected] [RETIRED 2013]
Dr. Anna Katharine Mansfield (co-PI), Assistant Professor of Enology, 60% Extension & 40% Research; Dept. of Food Science & Technology, NYSAES, Cornell University, 630 W North
St., Geneva, NY 14456 [email protected] Dr. Ian Merwin (co-PI), Herman M. Cohn Professor of Horticulture; 50% Teaching, 45%
Research, 5% Extension; Dept. of Horticulture, Cornell University, Ithaca, NY, 14853;
[email protected] [RETIRED 2012] Dr. Brad Rickard (co-PI), Assistant Professor of Applied Economics and Management, 50%
Extension & 50% Research; Cornell University, 255 Warren Hall, Ithaca, NY 14853 [email protected]
Dr. Justine Vanden Heuvel (co-PI), Associate Professor of Viticulture, 50% research & 50%
teaching, Cornell University, Ithaca NY, 14853; [email protected] Dr. Wayne Wilcox (co-PI), Professor of Plant Pathology, 15% Research, 35% Extension, 10%
Teaching, 40% Administration, Dept. of Plant Pathology, Cornell University, NY State Agricultural Experiment Station, Geneva, NY 14456 [email protected]
Dr. Imed Dami (co-PI), Associate Professor, 60% Research & 40% Extension. Department of
Horticulture and Crop Science, Ohio Agricultural Research and Development Center, 1680 Madison Ave., Wooster OH 44691; [email protected]
Dr. John Havlin (co-PI), Professor of Soil Science, 17% Extension, 8% Research, 75% Academic, Dept. Soil Science, Campus Box 7619, NC State University, Raleigh, NC 27695-7619 [email protected]
Dr. K.S.U. (Jay) Jayaratne (co-PI). Assistant Professor and State Leader for Program Evaluation. Campus Box 7607. NC State University, Raleigh, NC 27695-7607
[email protected] Dr. Katie Jennings (co-PI), Research Assistant Professor, 100% Research, Dept. Hort. Science,
Campus Box 7609. NC State University, Raleigh, NC 27695-7609 [email protected]
Mr. Wayne Mitchem (co-PI), Extension Associate, 67% Research, 33% Extension, Mtn. Hort. Crops Res. Ext. Ctr., 455 Research Drive, NCSU, Hope Mills, NC 28732,
[email protected] Dr. Charles Safley (co-PI), Professor of Agricultural and Resource Economics, 87% Extension,
13% Academic, Department of Agric. Res. Econ., Campus Box 8109, North Carolina State
University, Raleigh, NC 27695-8109 [email protected] Dr. Sara Spayd (co-PI), Extension Viticulture Specialist/Professor, 60% Extension & 40%
Research; Department of Horticultural Science, Campus Box 7609, NC State University, Raleigh, NC 27695-7609; [email protected]

34
Dr. Turner Sutton (co-PI), Professor of Plant Pathology, 20% Extension, 60% Research, 20% Academic Affairs, Dept. Plant Pathology, Campus Box 7405, NC State University, Raleigh,
NC 27695-7405 [email protected] Dr. Robert Crassweller (co-PI), Professor of Tree Fruit, 85% Extension & 15% Research; Penn
State University, 102 Tyson Building, University Park, PA 16802, [email protected] Dr. Joseph A. Fiola (co-PI), Professor and Specialist in Viticulture and Small Fruit (85%
Extension, 15% Research), Western MD Research & Education Center, 18330 Keedysville
Road, Keedysville, MD 21756-1104; [email protected] Mr. Peter Sforza (co-PI), Co-Director and Research Scientist, Center for Geospatial
Information Technology, 2060 Torgersen Hall, Virginia Tech, Blacksburg, VA 24061, [email protected]
Dr. Bruce Zoecklein (co-PI), Professor of Enology, 50% Research, 45% Extension, 5%
Teaching; Virginia Tech, Food Science and Technology, Blacksburg, VA 24061 [email protected] [RETIRED 2013]
Collaborators : Collaborators involved with this project include: - Mr. Mark Chien, Wine Grape Extension Educator, Penn State
- Dr. Jodi Creasap Gee, Viticulture Extension Specialist, Cornell - Mr. Chris Gerling, Enology Extension Associate, Cornell
- Dr. Joshua Heitman, Assistant Professor, Soil Science, North Carolina State University - Dr. Gregory Jones, Professor of Environmental Studies and Climatologist, Southern Oregon
University
- Dr. David Monks, Professor, Department of Horticultural Science and Assistant Director, NCARS, NC State University
- Dr. Mizuho Nita, Grape Pathologist, Virginia Tech - Ms. Sonia Schloemann, Extension Fruit Specialist, University of Massachusetts - Mr. Hans Walter-Peterson, Finger Lakes Viticulture Extension Instructor, Cornell


