IMPROVED LABORATORY TRANSITION PROBABILITIES FOR Pt i AND APPLICATION TO THE PLATINUM ABUNDANCES OF BD +17 3248 AND THE SUN E. A. Den Hartog, M. T. Herd, and J. E. Lawler Department of Physics, University of Wisconsin, Madison, WI 53706; [email protected], [email protected], [email protected]C. Sneden Department of Astronomy and McDonald Observatory, University of Texas, Austin, TX 78712; [email protected]J. J. Cowan Department of Physics and Astronomy, University of Oklahoma, Norman, OK 73019; [email protected]and T. C. Beers Department of Physics and Astronomy and JINA: Joint Institute for Nuclear Astrophysics, Michigan State University, East Lansing, MI 48824; [email protected]Received 2004 June 14; accepted 2004 September 28 ABSTRACT Radiative lifetimes, accurate to 5%, have been measured for 58 odd-parity levels of Pt i using laser-induced fluorescence. The lifetimes were combined with branching fractions measured using grating and Fourier transform spectrometry to determine transition probabilities for 127 lines of Pt i. The new Pt lifetime measurements were found to be in good agreement with previous but less extensive measurements based on laser-induced fluores- cence. The new branching fraction measurements were found to be in fair agreement with one earlier study. Absolute atomic transition probabilities from the new measurements were used to determine the platinum abundance in the metal-poor Galactic halo star BD +17 3248. An attempt to refine the solar photospheric abundance of platinum was unsuccessful; the single Pt i line used in an earlier abundance determination was found to be even more severely blended than expected from earlier work. Subject headin gs: atomic data — stars: abundances — Sun: abundances Online material: machine-readable tables 1. INTRODUCTION High-resolution, high signal-to-noise ratio (S/ N) spectra from very large ground-based telescopes and the Hubble Space Telescope (HST ) are providing new insights into the roles of the r (rapid)- and s(slow)-processes in the initial burst of Ga- lactic nucleosynthesis. Recent abundance determinations of heavy neutron-capture (n-capture) elements in very metal-poor stars have revealed nearly pure r-process abundance patterns in some of these stars (Gratton & Sneden 1994; McWilliam et al. 1995; Cowan et al. 1995; Sneden et al. 1996; Ryan et al. 1996). Heavy (A 200) elements in the third n-capture peak (Os, Ir, Pt) were first detected in metal-poor star HD 126238 and more recently in HD 115444 using HST (Cowan et al. 1996; Sneden et al. 1998). The important lines of the elements in the third n-capture peak are in the ultraviolet (UV), and thus observa- tions using the HST are needed for abundance determinations on these elements. The determination of accurate, absolute atomic transition probabilities for deep UV lines of these ele- ments represents a challenge for laboratory spectroscopists, but such lab data are essential for reducing uncertainties in the in- ferred abundances of these elements. The current work on Pt i is part of a continuing effort to improve the transition parameters for heavy n-capture elements and thereby refine the abundance determinations for those spe- cies. Improved transition probability data for numerous spec- tra have been published over the last few years, including La ii ( Lawler et al. 2001a), Ce ii ( Palmeri et al. 2000), Pr ii ( Ivarsson et al. 2001), Nd ii ( Den Hartog et al. 2003), Sm ii ( Xu et al. 2003), Eu i, ii, and iii ( Den Hartog et al. 2002; Lawler et al. 2001c), Tb ii ( Den Hartog et al. 2001; Lawler et al. 2001b), Dy i and ii (Curry et al. 1997; Wickliffe et al. 2000), Ho i and ii ( Den Hartog et al. 1999; Lawler et al. 2004), Tm i and ii (Anderson et al. 1996; Wickliffe & Lawler 1997), Lu i, ii, and iii ( Den Hartog et al. 1998; Quinet et al. 1999; Fedchak et al. 2000), Os i and Ir i ( Ivarsson et al. 2003), Th ii and iii (Bie ´mont et al. 2002; Nilsson et al. 2002b), and U ii ( Lundberg et al. 2001; Nilsson et al. 2002a). The solar abundances of several of these elements have been brought into agreement with meteoritic abundances through improve- ments in the transition probability database (see, e.g., Bord et al. 1998; Den Hartog et al. 1998; Lawler et al. 2001b). The next section describes our new radiative lifetime mea- surements on 58 odd-parity levels of Pt i, and x 3 describes our branching fraction measurements for 127 lines. Section 4 re- ports astrophysical applications of these new data, including a determination of the platinum abundance in the metal-poor Ga- lactic halo star BD +17 3248 and an attempt to refine the solar photospheric platinum abundance. 2. RADIATIVE LIFETIMES Radiative lifetimes of 58 odd-parity levels of Pt i have been measured at the University of Wisconsin using time-resolved laser-induced fluorescence. The technique and details of the apparatus have been described in detail elsewhere, and only an abbreviated description is given here. For more detail the reader is referred to recent work in Eu i, ii, and iii ( Den Hartog et al. 2002) and Tb ii (Den Hartog et al. 2001). A 639 The Astrophysical Journal, 619:639–655, 2005 January 20 # 2005. The American Astronomical Society. All rights reserved. Printed in U.S.A.
Transcript
IMPROVED LABORATORY TRANSITION PROBABILITIES FOR Pt i AND APPLICATIONTO THE PLATINUM ABUNDANCES OF BD +17�3248 AND THE SUN
Department of Astronomy and McDonald Observatory, University of Texas, Austin, TX 78712; [email protected]
J. J. Cowan
Department of Physics and Astronomy, University of Oklahoma, Norman, OK 73019; [email protected]
and
T. C. Beers
Department of Physics and Astronomy and JINA: Joint Institute for Nuclear Astrophysics,
Michigan State University, East Lansing, MI 48824; [email protected]
Received 2004 June 14; accepted 2004 September 28
ABSTRACT
Radiative lifetimes, accurate to �5%, have been measured for 58 odd-parity levels of Pt i using laser-inducedfluorescence. The lifetimes were combined with branching fractions measured using grating and Fourier transformspectrometry to determine transition probabilities for 127 lines of Pt i. The new Pt lifetime measurements werefound to be in good agreement with previous but less extensive measurements based on laser-induced fluores-cence. The new branching fraction measurements were found to be in fair agreement with one earlier study.Absolute atomic transition probabilities from the new measurements were used to determine the platinumabundance in the metal-poor Galactic halo star BD +17�3248. An attempt to refine the solar photosphericabundance of platinum was unsuccessful; the single Pt i line used in an earlier abundance determination was foundto be even more severely blended than expected from earlier work.
Subject headings: atomic data — stars: abundances — Sun: abundances
Online material: machine-readable tables
1. INTRODUCTION
High-resolution, high signal-to-noise ratio (S/N) spectrafrom very large ground-based telescopes and the Hubble SpaceTelescope (HST ) are providing new insights into the roles ofthe r(rapid)- and s(slow)-processes in the initial burst of Ga-lactic nucleosynthesis. Recent abundance determinations ofheavy neutron-capture (n-capture) elements in very metal-poorstars have revealed nearly pure r-process abundance patterns insome of these stars (Gratton & Sneden 1994; McWilliam et al.1995; Cowan et al. 1995; Sneden et al. 1996; Ryan et al. 1996).Heavy (A � 200) elements in the third n-capture peak (Os, Ir,Pt) were first detected in metal-poor star HD 126238 and morerecently in HD 115444 using HST (Cowan et al. 1996; Snedenet al. 1998). The important lines of the elements in the thirdn-capture peak are in the ultraviolet (UV), and thus observa-tions using the HST are needed for abundance determinationson these elements. The determination of accurate, absoluteatomic transition probabilities for deep UV lines of these ele-ments represents a challenge for laboratory spectroscopists, butsuch lab data are essential for reducing uncertainties in the in-ferred abundances of these elements.
The current work on Pt i is part of a continuing effort toimprove the transition parameters for heavy n-capture elementsand thereby refine the abundance determinations for those spe-cies. Improved transition probability data for numerous spec-tra have been published over the last few years, including La ii(Lawler et al. 2001a), Ce ii (Palmeri et al. 2000), Pr ii ( Ivarssonet al. 2001), Nd ii (DenHartog et al. 2003), Sm ii (Xu et al. 2003),
Eu i, ii, and iii (Den Hartog et al. 2002; Lawler et al. 2001c), Tb ii(Den Hartog et al. 2001; Lawler et al. 2001b), Dy i and ii (Curryet al. 1997; Wickliffe et al. 2000), Ho i and ii (Den Hartog et al.1999; Lawler et al. 2004), Tm i and ii (Anderson et al. 1996;Wickliffe&Lawler 1997), Lu i, ii, and iii (DenHartog et al. 1998;Quinet et al. 1999; Fedchak et al. 2000), Os i and Ir i ( Ivarssonet al. 2003), Th ii and iii (Biemont et al. 2002; Nilsson et al.2002b), andU ii (Lundberg et al. 2001; Nilsson et al. 2002a). Thesolar abundances of several of these elements have been broughtinto agreement with meteoritic abundances through improve-ments in the transition probability database (see, e.g., Bord et al.1998; Den Hartog et al. 1998; Lawler et al. 2001b).
The next section describes our new radiative lifetime mea-surements on 58 odd-parity levels of Pt i, and x 3 describes ourbranching fraction measurements for 127 lines. Section 4 re-ports astrophysical applications of these new data, including adetermination of the platinum abundance in the metal-poor Ga-lactic halo star BD +17
�3248 and an attempt to refine the solar
photospheric platinum abundance.
2. RADIATIVE LIFETIMES
Radiative lifetimes of 58 odd-parity levels of Pt i have beenmeasured at the University of Wisconsin using time-resolvedlaser-induced fluorescence. The technique and details of theapparatus have been described in detail elsewhere, and onlyan abbreviated description is given here. For more detail thereader is referred to recent work in Eu i, ii, and iii (Den Hartoget al. 2002) and Tb ii (Den Hartog et al. 2001).
A
639
The Astrophysical Journal, 619:639–655, 2005 January 20
# 2005. The American Astronomical Society. All rights reserved. Printed in U.S.A.
A large-bore hollow cathode discharge is used as a sputtersource of platinum atoms. The discharge is operated in 0.4 torrargon with 10 �s duration, 7 A peak current pulses. Thesepulses are superposed on a 30 mA DC current, which keepsthe discharge lit. The hollow cathode is closed at one end exceptfor a 1 mm hole, through which a slow, weakly collimated beamof platinum atoms is extracted into a low-pressure (10�4 torr)scattering chamber. The beam contains atoms in the groundlevel, as well as in metastable levels up to�20,000 cm�1, whichcan serve as lower levels for laser excitation. The beam densityand the background pressure are low enough that radiationtrapping and collisional depopulation of excited levels are notobserved.
The atomic beam is crossed at right angles by a laser beam1 cm below the nozzle of the hollow cathode. The laser beam isproduced by a nitrogen laser-pumped dye laser, which produces�5 ns pulses with a 0.2 cm�1 bandwidth. The wavelengthrange of this laser, including the use of frequency-doublingcrystals, is from 2050 to 7200 8. The narrow bandwidth andextensive wavelength range of the laser, as well as the flexi-bility in choice of lower level, allows for the selective excita-tion of energy levels up to �57,000 cm�1. Fluorescence fromthe excited level is collected in a direction mutually orthogonalto the two beams using a pair of fused-silica lenses that makeup an f /1 optical system. The fluorescence is detected with a1P28A photomultiplier tube (PMT), and a decay curve, con-sisting of an average over 640 individual pulses, is recordedwith a Tektronix SCD1000 digitizer. The laser wavelength isthen tuned off the excitation transition, and a background traceis recorded. A linear least-squares fit to a single exponentialis performed on the background-subtracted decay to yield thelifetime of the excited level. The lifetime of each level is mea-sured five times during ‘‘run one’’ and is later remeasured fivetimes during ‘‘run two’’ using a different laser transition when-ever possible. This duplication helps to ensure that the tran-sitions are identified correctly, are free from blends, and arecorrectly classified.
Lifetimes of neutral atoms from 2 ns up to �3 �s can bemeasured with this apparatus. The lower limit is determined bythe bandwidth of the electronics. The upper limit arises fromthe atoms in the beam leaving the viewing region before theyfluoresce, causing an apparent shortening of the level life-time. This time-of-flight effect is mitigated for longer lifetimes(>300 ns) by inserting a third lens in the optical collection sys-tem, so as to effectively defocus the fluorescence at the PMT.This lens makes the system much less sensitive to the motionof the atoms, but at a cost of a factor of 4–5 in S/N.
Several other systematic effects must be controlled to avoiddistortion of the exponential fluorescence decay. Unwantedfluorescence from cascades or blends can sometimes be elim-inated with the use of an optical filter inserted between the twocollection lenses. In Pt i, cascade fluorescence from lower lyinglevels is not much of a problem because of a nearly completelack of overlap of the odd and even configurations within therange of energy levels studied. Cascade contributions fromhigher levels are not an issue in this experiment because of theselective nature of the excitation. Another potential source ofdistortion is from Zeeman quantum beats. These beats occurwhen the polarized laser produces dipole-aligned atoms, whichthen precess in the Earth’s magnetic field. The anisotropicradiation pattern rotating through the viewing direction pro-duces an oscillation of the observed fluorescence. This effectcan be controlled by maintaining a near-zero (�20 mG) field inthe scattering chamber with Helmholtz-like coils. For lifetimes
greater than 300 ns, the necessary tolerance on the field be-comes difficult to achieve. In this case a high field (30 G) ismaintained, resulting in very rapid oscillations that average tozero on the timescale of the lifetime.The Pt i lifetimes reported here, with the exception of life-
times under 4 ns, have uncertainties of �5%. To maintain thislevel of uncertainty over a wide dynamic range, we periodi-cally perform end-to-end tests of the experiment by comparingour measurements of certain lifetimes, or ratios of lifetimes,of other elements with the well-known values for these life-times or ratios. These cross-checks are discussed in detail inDen Hartog et al. (2002). They include lifetimes for levels inBe i (Weiss 1995), Be ii (Yan et al. 1998), and Fe ii (Guo et al.1992; Biemont et al. 1991), covering the range from 1.8 to8.8 ns. He i lifetimes are measured in the range 95–220 ns(Kono & Hattori 1984). In addition, relative absorption os-cillator strengths of Fe i (Blackwell et al. 1979a, 1979b) areused to calculate accurate ratios of lifetimes that tie togetherlifetimes near 6, 60, and 90 ns. These ratios help fill in the gapbetween 30 and 95 ns where there are no convenient bench-mark lifetimes to measure. We have recently added a new cross-check near 30 ns. This is the lifetime of the 4p 0[1/2]1 level ofAr i , measured to be 27.85(7) ns by Volz & Schmoranzer(1998) using beam-gas laser spectroscopy. By measuring thesecross-checks periodically, we verify that the experiment is pro-ducing reliable and consistent results.Our results of lifetime measurements of 58 odd-parity levels
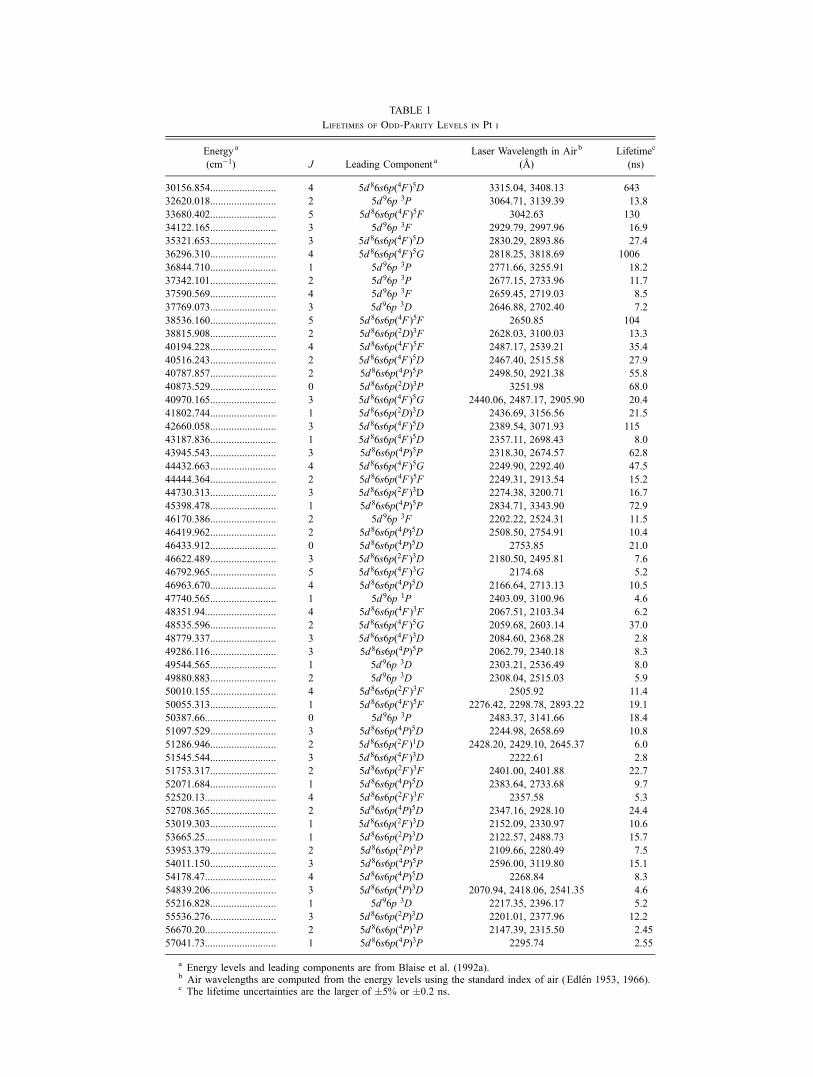
of Pt i are presented in Table 1. Energy levels are taken fromBlaise et al. (1992a), and the air wavelengths are computedfrom the energy levels using the standard index of air (Edlen1953, 1966). The uncertainty of the lifetimes is �5%, with theexception of lifetimes shorter than 4 ns, in which case the un-certainty is �0.2 ns.A comparison of our results and lifetimes available in the
literature appears in Table 2. Our results are in good agree-ment with the earlier LIF measurements of Gough et al. (1982).All of our results agree within the combined uncertainties.The mean difference between our measurements and theirs is�1.4%, and the rms difference is 3.2%. This level of agreementbetween independent LIF measurements is now routine. Theagreement is not so good with the beam-sputtering measure-ments of Ramanujam & Andersen (1978). We are in reason-able agreement with the two short-lived levels at 32,620 and34,122 cm�1 but see a marked discordance with the two longerlived levels. The mean and rms differences between our mea-surements and theirs are +11.5% and 23.9%, respectively.
3. BRANCHING FRACTIONS AND ATOMICTRANSITION PROBABILITIES
Branching ratios from grating spectrometer measurements inour University of Wisconsin (UW) lab were combined withbranching ratios from spectra recorded with the 1 m Fouriertransform spectrometer (FTS) of the US National Solar Ob-servatory (NSO) to determine complete sets of branching frac-tions for Pt i levels. Figure 1 is a block diagram that showsthe energy of the Pt i configurations included in this study. TheFTS spectra from the NSO on Kitt Peak, AZ, provided ex-cellent coverage at lower wavenumbers (<40,000 cm�1), butthe performance of the FTS at higher wavenumbers was notadequate for this study. Although the 1 m FTS has been usedto record spectra to 50,000 cm�1, the low sensitivity of the FTSin the deep UV makes it difficult to achieve good S/Ns in neu-tral atom spectra from a hollow cathode lamp operating at asufficiently low current to eliminate the need for optical depth
DEN HARTOG ET AL.640
TABLE 1
Lifetimes of Odd-Parity Levels in Pt i
Energya
(cm�1) J Leading Component aLaser Wavelength in Air b
a Energy levels and leading components are from Blaise et al. (1992a).b Air wavelengths are computed from the energy levels using the standard index of air (Edlen 1953, 1966).c The lifetime uncertainties are the larger of �5% or �0.2 ns.
corrections. The next subsection describes the UW grating spec-trometer measurements, and the subsequent subsection describesthe FTS measurements. Absolute atomic transition probabilities,determined by combining our branching fraction measurementswith radiative lifetimes from the preceding section, are presented.The final subsection includes comparisons of our branching frac-tions and branching ratios with earlier measurements.
3.1. GratinggSpectrometer Measurements
An Acton Research Corp. 1 m focal length spectrometer witha 3600 g mm�1 grating and a Princeton Instruments 1024 pixelthermoelectrically cooled photodiode array detector was usedto determine the branching ratios of deep UV lines of Pt i. Thesystem has a limit of resolution as small as 0.32 cm�1, and itprovides spectral coverage of the 25,000–50,000 cm�1 region.The spectral coverage of this grating instrument overlaps thespectral coverage of the NSO FTS. The grating spectrome-ter enabled us to measure Pt i branching ratios for lines inthe 40,000–50,000 cm�1 region where the FTS was not suffi-ciently sensitive. The NIST Pt-Ne Atlas (Sansonetti et al. 1992)was used to help identify lines during grating spectrometermeasurements.
The emission source for the grating spectrometer measure-ments of Pt lines was a commercially manufactured, sealedhollow cathode discharge lamp with a fused silica window con-taining a neon fill. The lampwas operated between 5 and 7.9mA;the manufacturer’s suggested maximum current is 8 mA. Eachline measurement was repeated 3 or more times at different cur-rent values to check for a nonnegligible optical depth. Opticaldepth corrections were not needed with this source. Data takenfrom the 1 m grating spectrometer have shown minimal drift.
In the first version of the grating spectrometer experiment,hereafter referred to as the ‘‘single spectrometer setup,’’ lightfrom the hollow cathode lamp was focused using a concavemirror directly onto the entrance slit of the 1 m spectrometer asshown in Figure 2a. Although the single spectrometer setupwas quite suitable for line ratio measurements, it was found tosuffer from excessive scattered light when attempts were made
to radiometrically calibrate the system using continuum lamps.Scattered light is one of the many difficulties in deep UV radio-metric calibrations, along with optical component degradation,intrinsic uncertainties in deep UV standard lamps, and othereffects. We were able to substantially reduce scattered lightin the 1 m spectrometer by introducing a pre-monochromator.This 10 cm focal length monochromator was placed directly infront of the main 1 m spectrometer, such that the entrance slitof the 1 m spectrometer served as the exit slit of the 10 cmmonochromator as shown in Figure 2b. This ‘‘double spec-trometer setup’’ was laser aligned, but some loss of signal wasinevitable from the introduction of the pre-monochromator.The concave mirror was used to focus the light from the hollowcathode lamp onto the entrance slit of the pre-monochromator.Data from both setups were used to determine branching ratiosof lines with small wavenumber separations. However, datataken with the pre-monochromator were used exclusively forwidely separated lines.Two spectroradiometric calibrations were performed. One
was based on an Ar miniarc lamp, and the second based ona D2 lamp. The Ar miniarc calibration covered the 29,850–50,000 cm�1 region. Our primary standard in the deep UV wasan Ar miniarc lamp calibrated directly by M. Bridges at NIST(see Bridges & Ott 1977; Klose et al. 1988 for discussions ofthe Ar miniarc as a deep UV radiometric standard). A secondAr miniarc, which served as a working standard, was used forroutine tests of calibration stability.The D2 lamp calibration covered a larger range from 25,000
to 50,000 cm�1. The UV calibrations of the 1 m spectrometerwithout the pre-monochromator using the Ar miniarc and D2
lamp were in poor agreement. This discordance was due primar-ily to scattered light. The introduction of the pre-monochromatorbrought the two calibrations into satisfactory agreement. Weused the Ar miniarc as our primary calibration standard andused the D2 lamp only for a few lines at lower wavenumbers.The Ar miniarc was used without a window; thus, its calibra-tion should be more reliable than the D2 lamp, which has awindow. Window degradation from color center formation andother effects is often a problem in spectroradiometric cali-brations in the deep UV. Calibrations were performed on boththe single spectrometer and double spectrometer setups in-cluding the concave mirror. Since our Ar miniarc and D2 lampswere calibrated as spectral irradiance [power /(area ; spectralinterval) at a specified distance] standards, these lamps were notfocused on the entrance slits of the spectrometers. Light from
TABLE 2
Comparison of Lifetimes of Odd-Parity Levels in Pt i
a Energy levels are from Blaise et al. (1992a).b Gough et al. (1982).c Ramanujam & Andersen (1978).
Fig. 1.—Block diagram of the Pt i configurations under study in this work.
DEN HARTOG ET AL.642 Vol. 619
the standard lamps was reflected from the concave mirror andinto the spectrometers, but distances were adjusted to ensurethat the standard lamps’ arcs were not focused on the entranceslits. The Ar miniarcs are routinely calibrated as spectral radi-ance [power/(area ; solid angle ; spectral interval)] standards.Because of the small size of the miniarc, image quality andalignment are critical when it is used as a radiance standard.
Our miniarc calibration, when used as a spectral irradiancestandard, did not fill the spectrometer to the same extent asthe Pt hollow cathode lamp. Possible errors introduced by dif-ferences in the filling of the spectrometer between the standardlamp and the Pt hollow cathode lamp were explored by mappingthe spectrometer response as a function of wavenumber for arange of input angles. Variations in the wavenumber dependenceof the radiometric calibration were not significant.
Branching ratios for lines in the UV below 40,000 cm�1 andin the visible were measured on the FTS spectra. The NSO 1 mFTS is a uniquely powerful instrument that provides (1) a limitof resolution as small as 0.01 cm�1, (2) wavenumber accuracyto 1 part in 108, (3) broad spectral coverage from the UV toIR, and (4) the capability of recording a 106 point spectrumin 10 minutes (Brault 1976). It also has an intrinsic advantagefor branching ratio measurements. An interferogram is a simul-taneous measurement across an entire spectrum, which makesthe FTS much less sensitive to source drifts than sequentiallyscanned instruments. Although the FTS performance is limitedin the deep UV, its performance in this region is best just afterits optics have been recoated.
We did not attempt to record new Pt spectra because therecoating of the FTS optics is infrequent. Instead, we made a
search of all spectra in the public digital archives of the NSO.1
We located five Pt spectra in the NSO archives, two of whichwere quite useful. The first and most useful FTS spectrumin this study was No. 001 from 1983 July 25, recorded on acustom, water-cooled Pt-Ar hollow cathode lamp operating at200 mA and 394 V with 2.5 torr of Ar. This spectrum has sixco-adds, and it extends from 7614 to 49,880 cm�1 with a limitof resolution of 0.096 cm�1. The FTS was configured with theUV beam splitter, midrange Si diode detectors, and no addi-tional filters. Spectrum 002 from the same date, recorded underidentical lamp conditions, was also useful. This spectrum haseight co-adds, and it extends from 18,929 to 37,638 cm�1 witha limit of resolution of 0.022 cm�1. The FTS was configuredwith the UV beam splitter, midrange Si diode detectors, andCuSO4 filters. The remaining three spectra were recorded on1985 July 23. Spectrum 015 from this date was recorded on ahigh-pressure source, judging from the continuum present inthe spectrum. The header file specifies that the source was op-erated with 1000 ppm Pt. This was most probably an induc-tively coupled plasma source. This spectrum has three co-adds,and it extends from 14,886 to 36,998 cm�1 with a limit ofresolution of 0.071 cm�1. The FTS was configured with theUV beam splitter, midrange Si diode detectors, and CuSO4
filters. Spectrum 017 from this date was recorded on a Pt-Nehollow cathode lamp operating at 20 mA. This spectrum has 12co-adds, and it extends from 27,774 to 41,661 cm�1 with alimit of resolution of 0.020 cm�1. The FTS was configuredwith the UV beam splitter, midrange Si diode detectors, andSolar Blind filters. Spectrum 021 from this date was also re-corded on a Pt-Ne hollow cathode lamp. This spectrum has 10co-adds, and it extends from 15,161 to 30,322 cm�1 with a
Fig. 2aFig. 2bFig. 2.—(a) Schematic diagram of the single spectrometer setup. (b) Schematic diagram of the double spectrometer setup.
Fig. 2a Fig. 2b
1 Available at http://diglib.nso.edu/.
Pt TRANSITION PROBABILITIES AND ABUNDANCES 643No. 1, 2005
limit of resolution of 0.020 cm�1. The FTS was configuredwith the UV beam splitter, midrange Si diode detectors, andCuSO4 + WG345 filters.
We used the now-standard technique, based on overlappingsets of Ar i and Ar ii branching ratios, to establish a relativeradiometric calibration for the Pt-Ar hollow cathode spectrafrom 1983 July 25. Sets of Ar i and Ar ii lines have beenestablished for this purpose in the range of 4300–35000 cm�1
by Whaling et al. (1993), Hashiguchi & Hasikuni (1985),Danzmann & Kock (1982), and Adams & Whaling (1981).These provided an excellent means of calibrating our FTS spec-tra, since the argon lines are measured in the exact experimentalarrangement and at the exact same time as are the Pt i lines. Thetwo spectra from 1983 July were the most useful for Pt branch-ing ratio measurements, although the other higher resolutionspectra were also useful for measurements on lines with smallseparation and in checking for blends. Strong lines to low-lyinglevels of Pt have large optical depths in the 1983 July spectrabecause the hollow cathode lamps were operated at 200 mAcurrent. Weak lines to higher lying levels of Pt had good S/Nsin the 1983 July spectra; thus, these spectra complemented ourgrating spectrometer measurements to yield complete sets ofbranching fractions for Pt upper levels.
All possible transition wavenumbers between known energylevels of Pt i (Blaise et al. 1992a, 1992b) satisfying both theparity change and �J selection rules were computed and usedduring the analysis of FTS data. Upper levels, primarily fromthe 5d96p and 5d 86s6p configurations, ranging in energy from30,157 to 50,388 cm�1, were included. Branches to unknownlevels and/or branches outside the observed spectral regioncan contribute errors to branching fraction measurements. Sucherrors are not a problem in our work on Pt i because of thefavorable energy level structure of Pt i and because our best FTSspectrum covered the near-infrared down to 7600 cm�1. Thethree lowest even-parity configurations of Pt i are the 5d 96s,5d10, and 5d 86s2, as shown in Figure 1. These three config-urations have 14 levels, 13 of which are known. The missing5d86s2 1S0 level is quite high in energy. This unknown levelmay connect to J ¼ 1 odd-parity levels in this study, but suchbranches, if possible, are too far in the infrared to contributea significant branching fraction error. The absence of othereven-parity Pt i levels between 27,000 and 52,000 cm�1, wherethe 5d 97s configuration starts, greatly simplified the assess-ment of possible missing infrared branches. We have confi-dence that our branching fractions are complete to a smallfraction (�1
5or less) of our final transition probability un-
certainties (5% or more).The same software was used to integrate the Ar calibra-
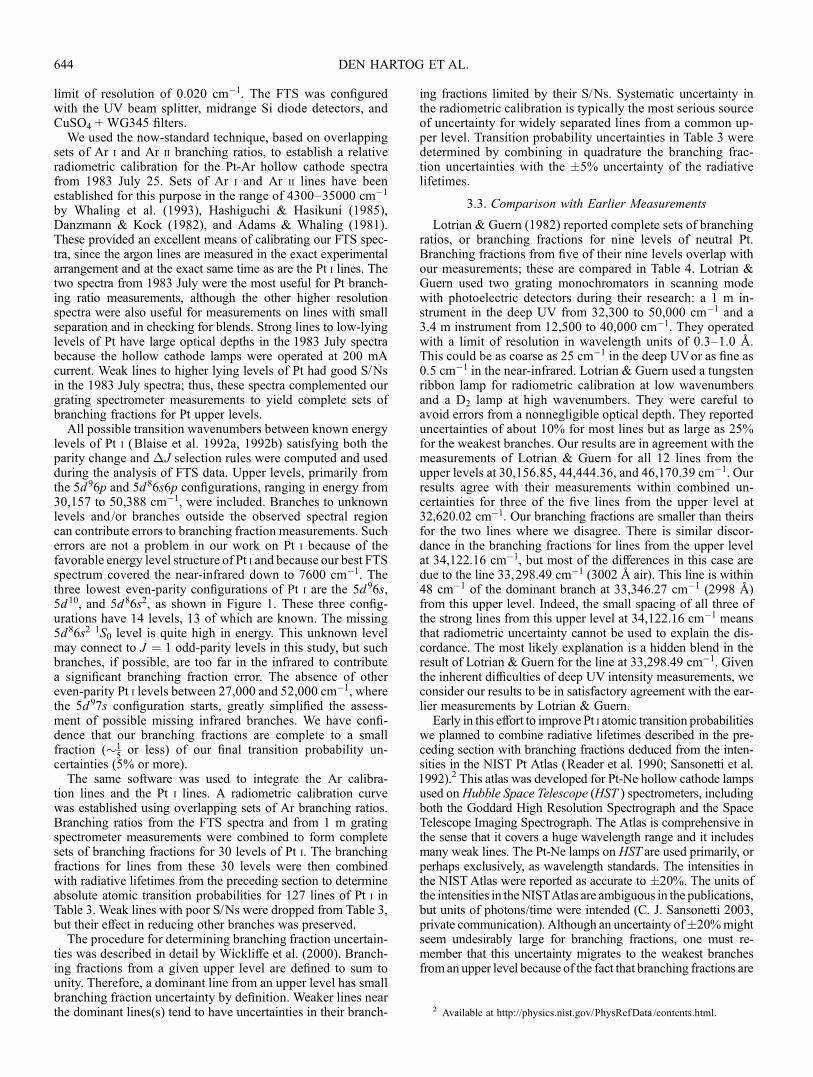
tion lines and the Pt i lines. A radiometric calibration curvewas established using overlapping sets of Ar branching ratios.Branching ratios from the FTS spectra and from 1 m gratingspectrometer measurements were combined to form completesets of branching fractions for 30 levels of Pt i. The branchingfractions for lines from these 30 levels were then combinedwith radiative lifetimes from the preceding section to determineabsolute atomic transition probabilities for 127 lines of Pt i inTable 3. Weak lines with poor S/Ns were dropped from Table 3,but their effect in reducing other branches was preserved.
The procedure for determining branching fraction uncertain-ties was described in detail by Wickliffe et al. (2000). Branch-ing fractions from a given upper level are defined to sum tounity. Therefore, a dominant line from an upper level has smallbranching fraction uncertainty by definition. Weaker lines nearthe dominant lines(s) tend to have uncertainties in their branch-
ing fractions limited by their S/Ns. Systematic uncertainty inthe radiometric calibration is typically the most serious sourceof uncertainty for widely separated lines from a common up-per level. Transition probability uncertainties in Table 3 weredetermined by combining in quadrature the branching frac-tion uncertainties with the �5% uncertainty of the radiativelifetimes.
3.3. Comparison with Earlier Measurements
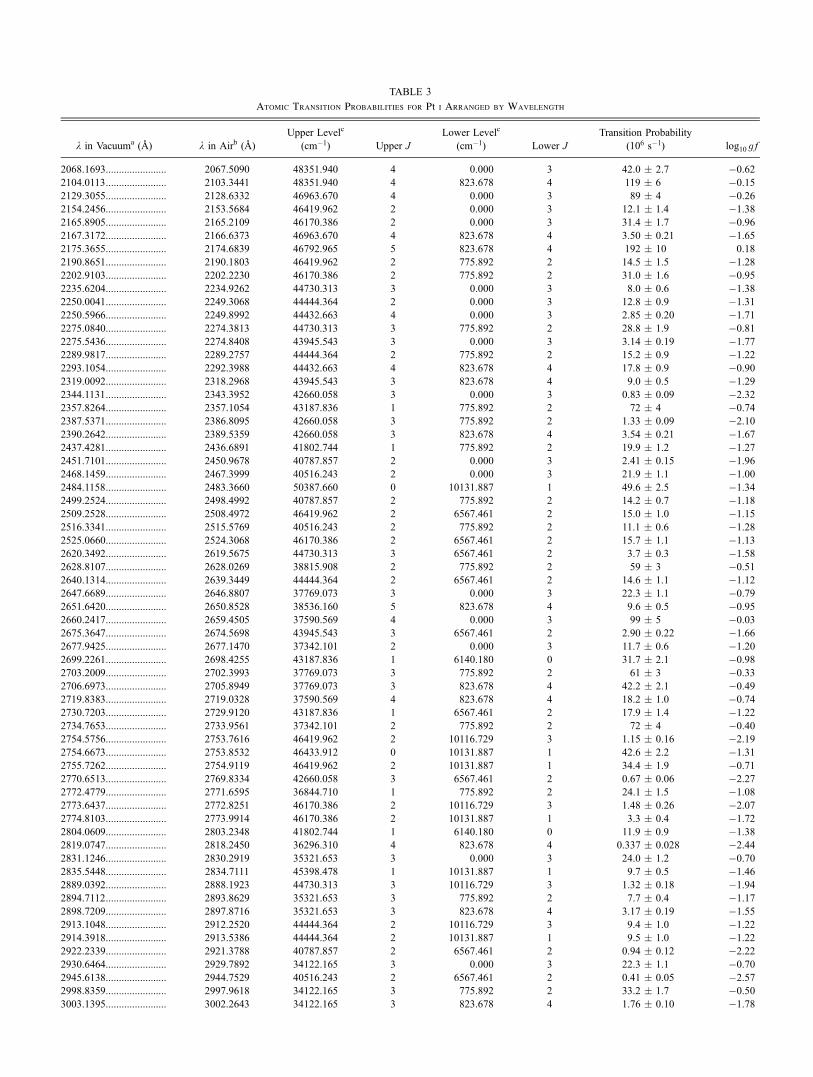
Lotrian & Guern (1982) reported complete sets of branchingratios, or branching fractions for nine levels of neutral Pt.Branching fractions from five of their nine levels overlap withour measurements; these are compared in Table 4. Lotrian &Guern used two grating monochromators in scanning modewith photoelectric detectors during their research: a 1 m in-strument in the deep UV from 32,300 to 50,000 cm�1 and a3.4 m instrument from 12,500 to 40,000 cm�1. They operatedwith a limit of resolution in wavelength units of 0.3–1.0 8.This could be as coarse as 25 cm�1 in the deep UVor as fine as0.5 cm�1 in the near-infrared. Lotrian & Guern used a tungstenribbon lamp for radiometric calibration at low wavenumbersand a D2 lamp at high wavenumbers. They were careful toavoid errors from a nonnegligible optical depth. They reporteduncertainties of about 10% for most lines but as large as 25%for the weakest branches. Our results are in agreement with themeasurements of Lotrian & Guern for all 12 lines from theupper levels at 30,156.85, 44,444.36, and 46,170.39 cm�1. Ourresults agree with their measurements within combined un-certainties for three of the five lines from the upper level at32,620.02 cm�1. Our branching fractions are smaller than theirsfor the two lines where we disagree. There is similar discor-dance in the branching fractions for lines from the upper levelat 34,122.16 cm�1, but most of the differences in this case aredue to the line 33,298.49 cm�1 (3002 8 air). This line is within48 cm�1 of the dominant branch at 33,346.27 cm�1 (2998 8)from this upper level. Indeed, the small spacing of all three ofthe strong lines from this upper level at 34,122.16 cm�1 meansthat radiometric uncertainty cannot be used to explain the dis-cordance. The most likely explanation is a hidden blend in theresult of Lotrian & Guern for the line at 33,298.49 cm�1. Giventhe inherent difficulties of deep UV intensity measurements, weconsider our results to be in satisfactory agreement with the ear-lier measurements by Lotrian & Guern.Early in this effort to improve Pt i atomic transition probabilities
we planned to combine radiative lifetimes described in the pre-ceding section with branching fractions deduced from the inten-sities in the NIST Pt Atlas (Reader et al. 1990; Sansonetti et al.1992).2 This atlas was developed for Pt-Ne hollow cathode lampsused onHubble Space Telescope (HST ) spectrometers, includingboth the Goddard High Resolution Spectrograph and the SpaceTelescope Imaging Spectrograph. The Atlas is comprehensive inthe sense that it covers a huge wavelength range and it includesmany weak lines. The Pt-Ne lamps on HST are used primarily, orperhaps exclusively, as wavelength standards. The intensities inthe NIST Atlas were reported as accurate to �20%. The units ofthe intensities in theNISTAtlas are ambiguous in the publications,but units of photons/time were intended (C. J. Sansonetti 2003,private communication). Although an uncertainty of�20%mightseem undesirably large for branching fractions, one must re-member that this uncertainty migrates to the weakest branchesfrom an upper level because of the fact that branching fractions are
2 Available at http://physics.nist.gov/PhysRefData /contents.html.
DEN HARTOG ET AL.644
TABLE 3
Atomic Transition Probabilities for Pt i Arranged by Wavelength
Note.—Table 3 is also available in machine-readable form in the electronic edition of the Astrophysical Journal.a Vacuum wavelengths are computed from energy levels.b Air wavelengths are computed from the energy levels using the standard index of air (Edlen 1953, 1966).c Energy levels are from Blaise et al. (1992a).
defined to sum to one. Relative intensities accurate to 20% canyield branching fractions for dominant lines that aremore accuratethan �20%.
Reader et al. (1990) and Sansonetti et al. (1992) made noclaims as to whether or not their source was optically thin. Weknew from the type of lamp they used and from the operatingconditions they used that some of the strong lines to low-lyinglevels were likely to need an optical depth correction. We ini-tially planned to use our measurements made with a gratingspectrometer to correct those few lines and then use intensitiesfrom the NIST Atlas for many other longer wavelength lines.This plan had to be abandoned when we discovered a largewavelength-dependent radiometric calibration error in the NISTAtlas. This problem was discussed with NIST personnel inmid-2003, and they subsequently confirmed that there is acalibration problem (C. J. Sansonetti 2003, private communi-cation; G. Nave 2003, private communication).
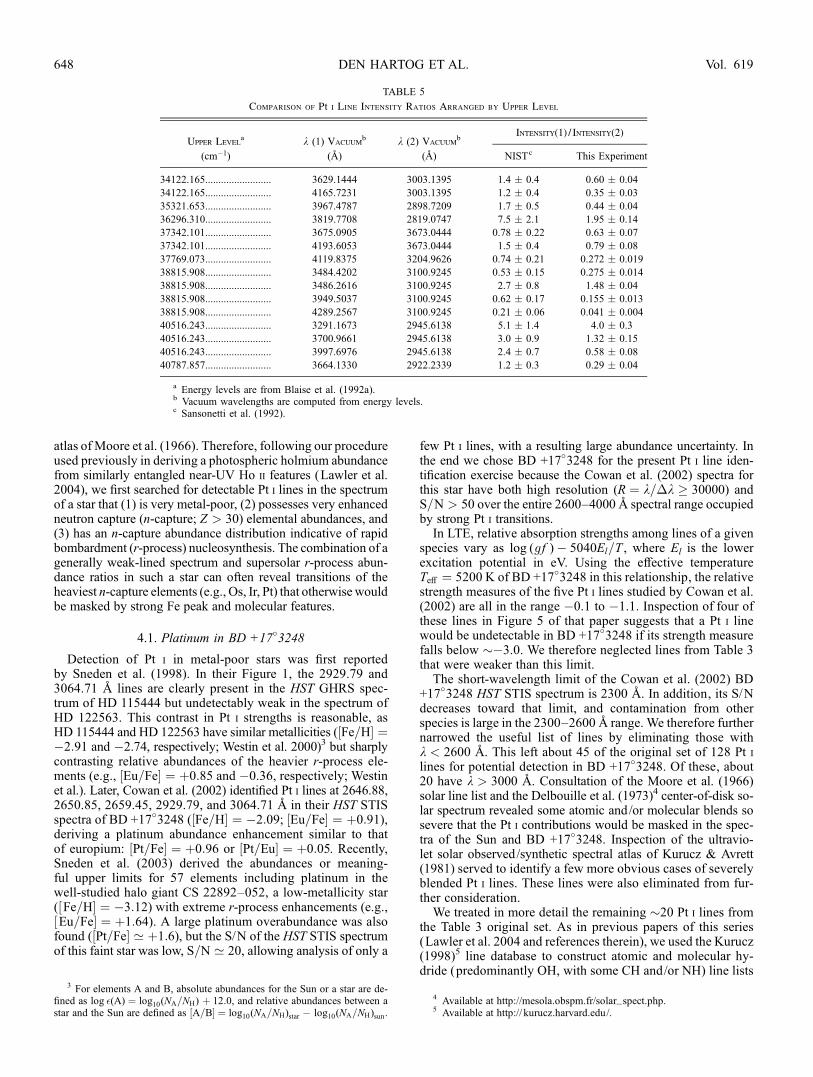
Table 5 compares some of our new branching ratio mea-surements with branching ratios from the NIST Atlas. Thesecomparisons were chosen so that the line ratios are not prone toerrors from a nonnegligible optical depth. The ratios tend toagree for lines with a small wavenumber separation but dis-agree in a systematic fashion for lines with larger separations.The red lines from a given upper level in the NIST Atlas aretoo strong in comparison with blue lines from the same upperlevel. Errors in this direction can be caused by a nonnegligibleoptical depth, but there is a more serious radiometric calibra-
tion problem in the NISTAtlas. Our intent is not to belabor thispoint but simply to alert readers and HST users to the fact thatthe intensities of widely separated lines in the NIST Atlas arenot reliable. Relative intensities of lines from the NIST Atlaswith small separations are reliable. Wavelengths from the NISTAtlas should be unaffected by the intensity errors. New mea-surements on Pt intensities are underway at NIST using theNIST 2 m FTS (G. Nave 2003, private communication). DeepUV intensity measurements are technically difficult.
Independent branching fraction measurements often do notachieve the excellent agreement that is routine for independentLIF measurements of radiative lifetimes. Branching fractionmeasurements in the UVand vacuum UV (VUV) are especiallychallenging. The use of FTS instruments in the UV helps, butbetter (internal) radiometric calibration techniques are needed inthe UV and VUV. Further improvement of FTS performance inthe VUV is also needed.
4. PLATINUM IN METAL-POOR STARS AND THE SUN
Easily detectable Pt i lines in cool stellar spectra occur only inthe ultraviolet, k < 3400 8. In their solar photospheric plati-num abundance study, Youssef & Khalil (1987) affirm that thisspectral region ‘‘is crowded by strongly perturbed lines of manyelements and platinum may only be a minor contributor to theobserved absorption feature, in addition to the uncertainty ofthe continuum location.’’ Their warning applies to all five solarPt i identifications in this wavelength domain in the spectral
TABLE 4
Comparison of Branching Fractions for Pt i Arranged by Upper Level
a Vacuum wavelengths are computed from energy levels.b Air wavelengths are computed from the energy levels using the standard index of air (Edlen 1953, 1966).c Energy levels are from Blaise et al. (1992a).d Lotrian & Guern (1982).
Pt TRANSITION PROBABILITIES AND ABUNDANCES 647
atlas of Moore et al. (1966). Therefore, following our procedureused previously in deriving a photospheric holmium abundancefrom similarly entangled near-UV Ho ii features (Lawler et al.2004), we first searched for detectable Pt i lines in the spectrumof a star that (1) is very metal-poor, (2) possesses very enhancedneutron capture (n-capture; Z > 30) elemental abundances, and(3) has an n-capture abundance distribution indicative of rapidbombardment (r-process) nucleosynthesis. The combination of agenerally weak-lined spectrum and supersolar r-process abun-dance ratios in such a star can often reveal transitions of theheaviest n-capture elements (e.g., Os, Ir, Pt) that otherwise wouldbe masked by strong Fe peak and molecular features.
4.1. Platinum in BD +17�3248
Detection of Pt i in metal-poor stars was first reportedby Sneden et al. (1998). In their Figure 1, the 2929.79 and3064.71 8 lines are clearly present in the HST GHRS spec-trum of HD 115444 but undetectably weak in the spectrum ofHD 122563. This contrast in Pt i strengths is reasonable, asHD 115444 and HD 122563 have similar metallicities (½Fe=H� ¼�2:91 and �2.74, respectively; Westin et al. 2000)3 but sharplycontrasting relative abundances of the heavier r-process ele-ments (e.g., ½Eu=Fe� ¼ þ0:85 and �0.36, respectively; Westinet al.). Later, Cowan et al. (2002) identified Pt i lines at 2646.88,2650.85, 2659.45, 2929.79, and 3064.71 8 in their HST STISspectra of BD +17�3248 (½Fe=H� ¼ �2:09; ½Eu=Fe� ¼ þ0:91),deriving a platinum abundance enhancement similar to thatof europium: ½Pt=Fe� ¼ þ0:96 or ½Pt=Eu� ¼ þ0:05. Recently,Sneden et al. (2003) derived the abundances or meaning-ful upper limits for 57 elements including platinum in thewell-studied halo giant CS 22892–052, a low-metallicity star(½Fe=H� ¼ �3:12) with extreme r-process enhancements (e.g.,½Eu=Fe� ¼ þ1:64). A large platinum overabundance was alsofound (½Pt=Fe� ’ þ1:6), but the S/N of the HST STIS spectrumof this faint star was low, S=N ’ 20, allowing analysis of only a
few Pt i lines, with a resulting large abundance uncertainty. Inthe end we chose BD +17
�3248 for the present Pt i line iden-
tification exercise because the Cowan et al. (2002) spectra forthis star have both high resolution (R ¼ k=�k � 30000) andS=N > 50 over the entire 2600–40008 spectral range occupiedby strong Pt i transitions.In LTE, relative absorption strengths among lines of a given
species vary as log (g f )� 5040El=T , where El is the lowerexcitation potential in eV. Using the effective temperatureTeA ¼ 5200 K of BD +17�3248 in this relationship, the relativestrength measures of the five Pt i lines studied by Cowan et al.(2002) are all in the range �0.1 to �1.1. Inspection of four ofthese lines in Figure 5 of that paper suggests that a Pt i linewould be undetectable in BD +17�3248 if its strength measurefalls below ��3.0. We therefore neglected lines from Table 3that were weaker than this limit.The short-wavelength limit of the Cowan et al. (2002) BD
+17�3248 HST STIS spectrum is 2300 8. In addition, its S/Ndecreases toward that limit, and contamination from otherspecies is large in the 2300–2600 8 range. We therefore furthernarrowed the useful list of lines by eliminating those withk < 2600 8. This left about 45 of the original set of 128 Pt ilines for potential detection in BD +17�3248. Of these, about20 have k > 3000 8. Consultation of the Moore et al. (1966)solar line list and the Delbouille et al. (1973)4 center-of-disk so-lar spectrum revealed some atomic and/or molecular blends sosevere that the Pt i contributions would be masked in the spec-tra of the Sun and BD +17
�3248. Inspection of the ultravio-
let solar observed/synthetic spectral atlas of Kurucz & Avrett(1981) served to identify a few more obvious cases of severelyblended Pt i lines. These lines were also eliminated from fur-ther consideration.We treated in more detail the remaining �20 Pt i lines from
the Table 3 original set. As in previous papers of this series(Lawler et al. 2004 and references therein), we used the Kurucz(1998)5 line database to construct atomic and molecular hy-dride (predominantly OH, with some CH and/or NH) line lists
TABLE 5
Comparison of Pt i Line Intensity Ratios Arranged by Upper Level
a Energy levels are from Blaise et al. (1992a).b Vacuum wavelengths are computed from energy levels.c Sansonetti et al. (1992).
3 For elements A and B, absolute abundances for the Sun or a star are de-fined as log �(A) ¼ log10(NA=NH) þ 12:0, and relative abundances between astar and the Sun are defined as ½A=B� ¼ log10(NA=NH)star � log10(NA=NH)sun.
4 Available at http://mesola.obspm.fr/solar_spect.php.5 Available at http:// kurucz.harvard.edu/.
DEN HARTOG ET AL.648 Vol. 619
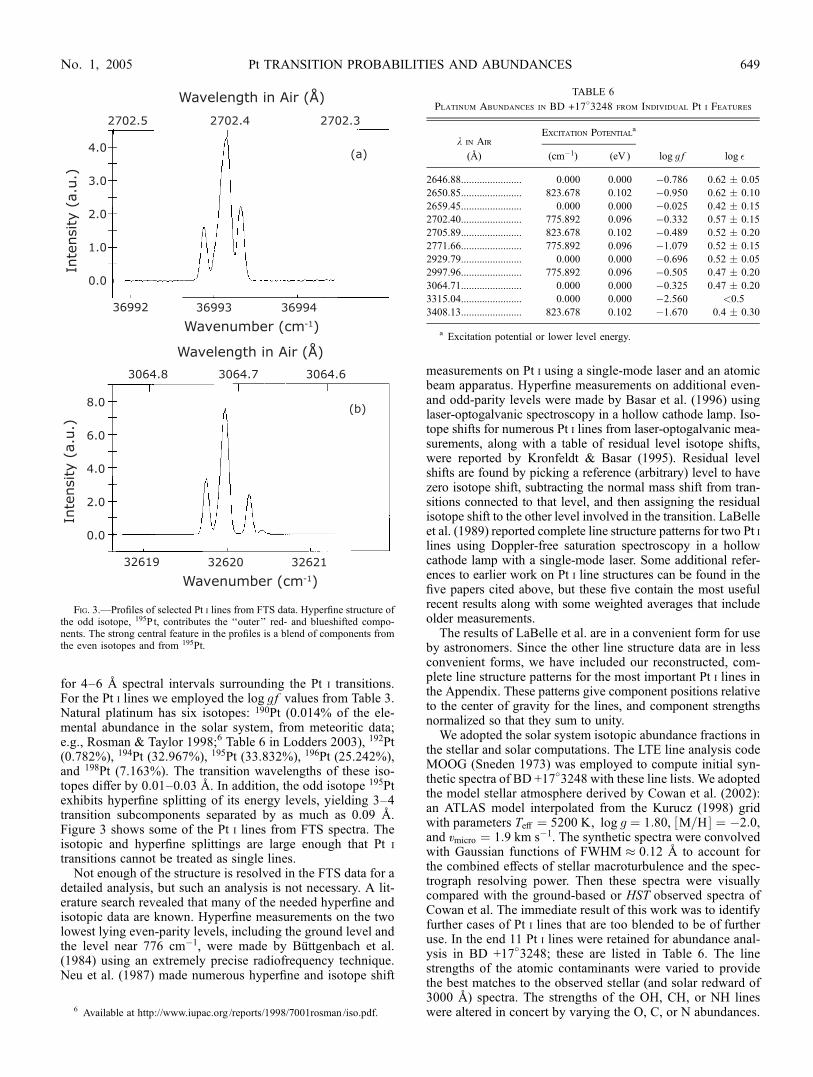
for 4–6 8 spectral intervals surrounding the Pt i transitions.For the Pt i lines we employed the log g f values from Table 3.Natural platinum has six isotopes: 190Pt (0.014% of the ele-mental abundance in the solar system, from meteoritic data;e.g., Rosman & Taylor 1998;6 Table 6 in Lodders 2003), 192Pt(0.782%), 194Pt (32.967%), 195Pt (33.832%), 196Pt (25.242%),and 198Pt (7.163%). The transition wavelengths of these iso-topes differ by 0.01–0.03 8. In addition, the odd isotope 195Ptexhibits hyperfine splitting of its energy levels, yielding 3–4transition subcomponents separated by as much as 0.09 8.Figure 3 shows some of the Pt i lines from FTS spectra. Theisotopic and hyperfine splittings are large enough that Pt i
transitions cannot be treated as single lines.Not enough of the structure is resolved in the FTS data for a
detailed analysis, but such an analysis is not necessary. A lit-erature search revealed that many of the needed hyperfine andisotopic data are known. Hyperfine measurements on the twolowest lying even-parity levels, including the ground level andthe level near 776 cm�1, were made by Buttgenbach et al.(1984) using an extremely precise radiofrequency technique.Neu et al. (1987) made numerous hyperfine and isotope shift
measurements on Pt i using a single-mode laser and an atomicbeam apparatus. Hyperfine measurements on additional even-and odd-parity levels were made by Basar et al. (1996) usinglaser-optogalvanic spectroscopy in a hollow cathode lamp. Iso-tope shifts for numerous Pt i lines from laser-optogalvanic mea-surements, along with a table of residual level isotope shifts,were reported by Kronfeldt & Basar (1995). Residual levelshifts are found by picking a reference (arbitrary) level to havezero isotope shift, subtracting the normal mass shift from tran-sitions connected to that level, and then assigning the residualisotope shift to the other level involved in the transition. LaBelleet al. (1989) reported complete line structure patterns for two Pt ilines using Doppler-free saturation spectroscopy in a hollowcathode lamp with a single-mode laser. Some additional refer-ences to earlier work on Pt i line structures can be found in thefive papers cited above, but these five contain the most usefulrecent results along with some weighted averages that includeolder measurements.
The results of LaBelle et al. are in a convenient form for useby astronomers. Since the other line structure data are in lessconvenient forms, we have included our reconstructed, com-plete line structure patterns for the most important Pt i lines inthe Appendix. These patterns give component positions relativeto the center of gravity for the lines, and component strengthsnormalized so that they sum to unity.
We adopted the solar system isotopic abundance fractions inthe stellar and solar computations. The LTE line analysis codeMOOG (Sneden 1973) was employed to compute initial syn-thetic spectra of BD +17
�3248 with these line lists. We adopted
the model stellar atmosphere derived by Cowan et al. (2002):an ATLAS model interpolated from the Kurucz (1998) gridwith parameters TeA ¼ 5200 K, log g ¼ 1:80, ½M=H � ¼ �2:0,and vmicro ¼ 1:9 km s�1. The synthetic spectra were convolvedwith Gaussian functions of FWHM � 0:12 8 to account forthe combined effects of stellar macroturbulence and the spec-trograph resolving power. Then these spectra were visuallycompared with the ground-based or HST observed spectra ofCowan et al. The immediate result of this work was to identifyfurther cases of Pt i lines that are too blended to be of furtheruse. In the end 11 Pt i lines were retained for abundance anal-ysis in BD +17�3248; these are listed in Table 6. The linestrengths of the atomic contaminants were varied to providethe best matches to the observed stellar (and solar redward of3000 8) spectra. The strengths of the OH, CH, or NH lineswere altered in concert by varying the O, C, or N abundances.
Fig. 3.—Profiles of selected Pt i lines from FTS data. Hyperfine structure ofthe odd isotope, 195P t, contributes the ‘‘outer’’ red- and blueshifted compo-nents. The strong central feature in the profiles is a blend of components fromthe even isotopes and from 195Pt.
6 Available at http://www.iupac.org /reports/1998/7001rosman /iso.pdf.
TABLE 6
Platinum Abundances in BD +17�3248 from Individual Pt i Features
Pt TRANSITION PROBABILITIES AND ABUNDANCES 649No. 1, 2005
No changes were made to the lab data for the Pt i lines. Plat-inum is overwhelmingly synthesized through the r-process. Insolar system material the r-process elemental fraction is ap-proximately 95% (Simmerer et al. 2005). We have thereforeassumed a solar system isotopic mixture for Pt in this paper.
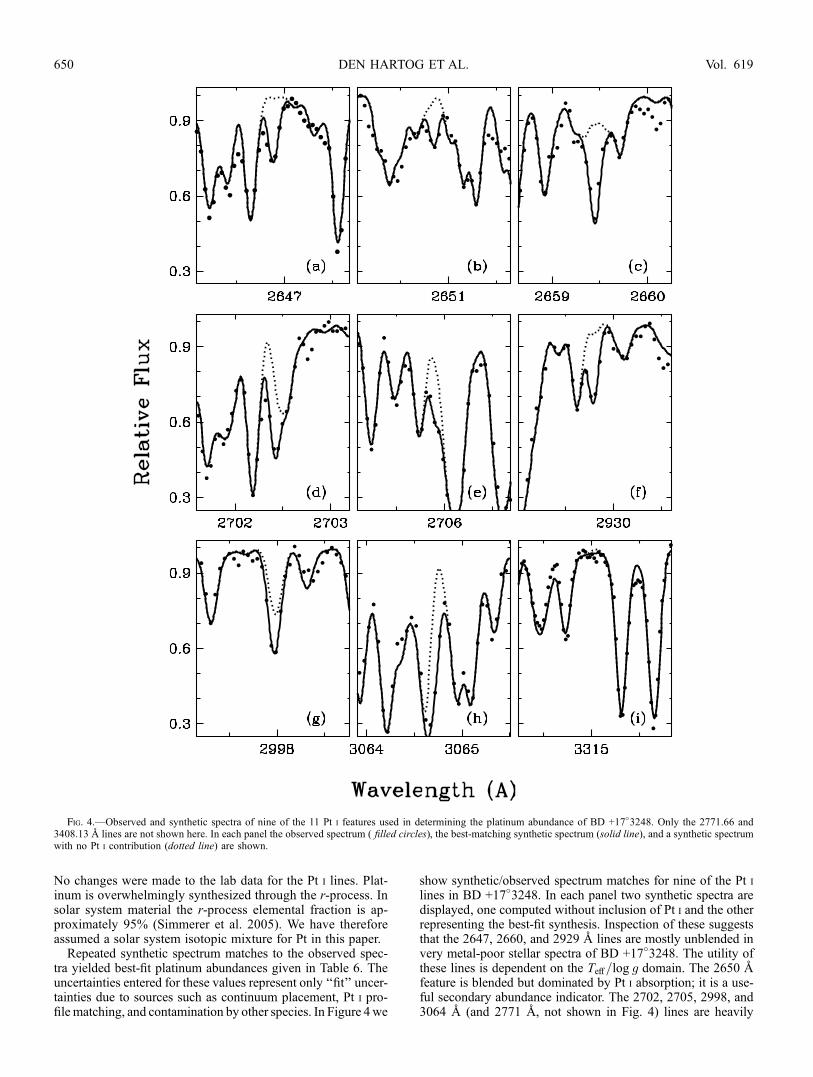
Repeated synthetic spectrum matches to the observed spec-tra yielded best-fit platinum abundances given in Table 6. Theuncertainties entered for these values represent only ‘‘fit’’ uncer-tainties due to sources such as continuum placement, Pt i pro-filematching, and contamination by other species. In Figure 4we
show synthetic/observed spectrum matches for nine of the Pt ilines in BD +17�3248. In each panel two synthetic spectra aredisplayed, one computed without inclusion of Pt i and the otherrepresenting the best-fit synthesis. Inspection of these suggeststhat the 2647, 2660, and 2929 8 lines are mostly unblended invery metal-poor stellar spectra of BD +17�3248. The utility ofthese lines is dependent on the TeA=log g domain. The 2650 8feature is blended but dominated by Pt i absorption; it is a use-ful secondary abundance indicator. The 2702, 2705, 2998, and3064 8 (and 2771 8, not shown in Fig. 4) lines are heavily
Fig. 4.—Observed and synthetic spectra of nine of the 11 Pt i features used in determining the platinum abundance of BD +17�3248. Only the 2771.66 and
3408.13 8 lines are not shown here. In each panel the observed spectrum ( filled circles), the best-matching synthetic spectrum (solid line), and a synthetic spectrumwith no Pt i contribution (dotted line) are shown.
DEN HARTOG ET AL.650 Vol. 619
blended by other atomic and molecular transitions but can beemployed as platinum abundance indicators. The reader is cau-tioned that any combination of overall metallicity [Fe/H] in-crease, [Pt/Fe] decrease, and Teff decrease will cause all Pt ifeatures to suffer more blending and thus increase the platinumabundance uncertainty. Finally, the 3315 and 34088 lines are soweak and/or blended that in all but the most platinum-rich starsthey are best viewed as platinum abundance limit estimators.
A straight mean of the abundances in Table 6, neglectingthe 3315 and 3408 8 lines, is log �(Pt)h i ¼ þ0:53 � 0:02(� ¼ 0:07). The line-to-line scatter �-value is consistent withthe spectral feature matching uncertainties. Cowan et al. (2002)derived log �(Pt)h i ¼ þ0:67 (� ¼ 0:05) from five Pt i lines.The 0.14 dex abundance decrease in the present value is pri-marily due to the improvement in the characterization of thePt i lines from the more reliable transition probabilities andthe inclusion of isotopic and hyperfine splitting. For the BD+17
�3248 Pt i spectrum the transition probability and transition
substructure corrections are of comparable importance to the de-rived abundances. The influence of substructure will of coursevary with overall Pt i line strengths in other stars.
Model atmosphere uncertainties have some influence in de-rived platinum abundances, particularly in comparisons of plat-inum with lighter n-capture elements. For typical Pt i, Fe i, andFe ii lines near 30008 and the well-studied Eu ii line at 4129.88,we computed abundance offsets in response to model parameterchanges representative of the uncertainties derived by Cowanet al. (2002) for BD +17
�3248. For a temperature change�TeA ¼
�150 K, we derive�½Fe i=H � ¼ �0:15,�½Fe ii=H � ¼ �0:00,�½Eu ii=H � ¼ �0:10, and �½Pt i=H � ¼ �0:20. Therefore, thisTeA change results in �½Pt i=Eu ii � ¼ �0:10. For a gravitychange �log g ¼ �0:3, �½Fe i=H � ¼ �0:14, �½Fe ii=H� ¼�0:02, �½Eu ii=H � ¼ �0:07, and �½Pt i=H � ¼ �0:00. There-fore, this log g change results in�½Pt i=Eu ii � ¼ �0:07. Varyingthe assumed model metallicity in the range �½M=H � ¼ �0:20induced no substantial variations in any of the derived abun-dances. Finally, microturbulent velocity variations �vmicro ¼�0:2 km s�1 yielded abundance variations from 0.0 to 0.1,depending on the strengths of the lines in question. Model at-mosphere parameters for BD +17�3248 were determined byCowan et al. from a combination of broadband photometry andexcitation/ionization balances of Fe peak spectral features.Thus, the Teff and log g parameters are not independent; e.g., anincrease in Teff would increase the ion-to-neutral ratio, whichwould in turn necessitate an increase in log g to compensate.These correlated variations suggest that �[Pt /Eu] can be asmuch as 0.15–0.20 with large changes in Teff and log g. Thiscaution should be kept in mind in interpreting n-capture abun-dance distributions that include the rare earths (always detectedin the first ionized species) and the heaviest stable elements (e.g.,Os, Ir, Pt, Au, Pb, always detected in the neutral species).
Cowan et al. (2002) studied nearly 30 n-capture elements inBD +17�3248; see that paper for an extended discussion of themajor abundance trends in the n-capture domain. Here we limitour comments to a comparison of the new platinum abundancewith europium. Cowan et al. derived log �(Eu)h i ¼ �0:67 �0:02 (� ¼ 0:05), yielding log �(Pt=Eu) ¼ þ1:20. Simmereret al. (2005) have computed the most recent breakdown of solarsystem elemental abundances into r- and s-process compo-nents. Since BD +17�3248 is an r-process–rich star, the propercomparison is with the solar system r-only abundances (col. [5]of Table 10 of Simmerer et al.): log �(Pt=Eu)SS ¼ þ1:654�0:494 ¼ þ1:160. The BD +17�3248 and solar system r-processPt /Eu abundance ratios are thus now in excellent agreement.
4.2. Platinum in the Solar Photosphere
The most recent solar system abundance compilation byLodders (2003) adopts log �(Pt) ¼ 1:67 � 0:03 for the plati-num meteoritic abundance and 1.74 for the solar photosphericvalue. These numbers are in basic agreement with previousrecommendations by Grevesse and collaborators (Grevesse &Sauval 1998 and references therein). However, the photosphericabundance comes from the pioneering analysis by Youssef &Khalil (1987) of just a single Pt i line at 3301.86 A8. Therefore,Lodders does not even attach a formal uncertainty to this value.We did not recommend the 33018 line as a platinum abundanceindicator for BD +17
�3248. Here we suggest that this line is a
very blended feature and probably should be discarded as a pho-tospheric platinum abundance indicator.
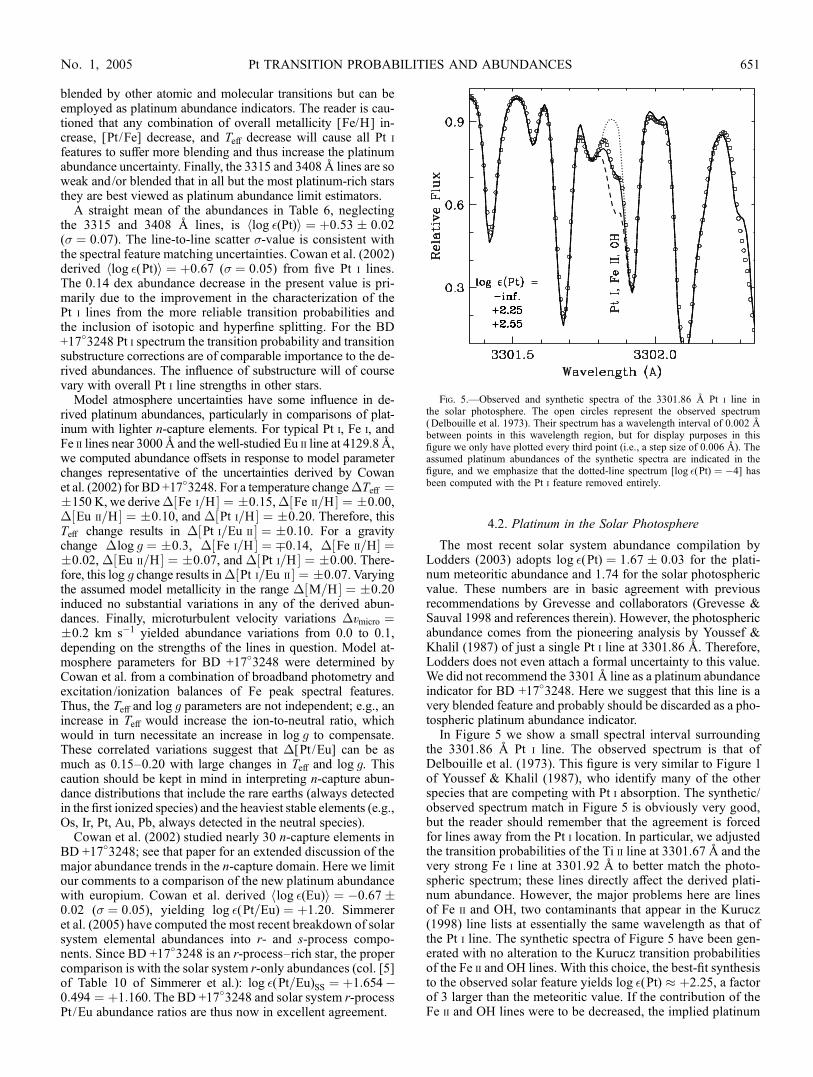
In Figure 5 we show a small spectral interval surroundingthe 3301.86 8 Pt i line. The observed spectrum is that ofDelbouille et al. (1973). This figure is very similar to Figure 1of Youssef & Khalil (1987), who identify many of the otherspecies that are competing with Pt i absorption. The synthetic/observed spectrum match in Figure 5 is obviously very good,but the reader should remember that the agreement is forcedfor lines away from the Pt i location. In particular, we adjustedthe transition probabilities of the Ti ii line at 3301.67 8 and thevery strong Fe i line at 3301.92 8 to better match the photo-spheric spectrum; these lines directly affect the derived plati-num abundance. However, the major problems here are linesof Fe ii and OH, two contaminants that appear in the Kurucz(1998) line lists at essentially the same wavelength as that ofthe Pt i line. The synthetic spectra of Figure 5 have been gen-erated with no alteration to the Kurucz transition probabilitiesof the Fe ii and OH lines. With this choice, the best-fit synthesisto the observed solar feature yields log �(Pt) � þ2:25, a factorof 3 larger than the meteoritic value. If the contribution of theFe ii and OH lines were to be decreased, the implied platinum
Fig. 5.—Observed and synthetic spectra of the 3301.86 8 Pt i line inthe solar photosphere. The open circles represent the observed spectrum(Delbouille et al. 1973). Their spectrum has a wavelength interval of 0.002 8between points in this wavelength region, but for display purposes in thisfigure we only have plotted every third point (i.e., a step size of 0.006 8). Theassumed platinum abundances of the synthetic spectra are indicated in thefigure, and we emphasize that the dotted-line spectrum [log �(Pt) ¼ �4] hasbeen computed with the Pt i feature removed entirely.
Pt TRANSITION PROBABILITIES AND ABUNDANCES 651No. 1, 2005
abundance would become even larger. We can force the solarabundance to agree with the meteoritic abundance by largeincreases in the Fe ii and/or OH transition probabilities, but weknow of no laboratory studies to justify this action.
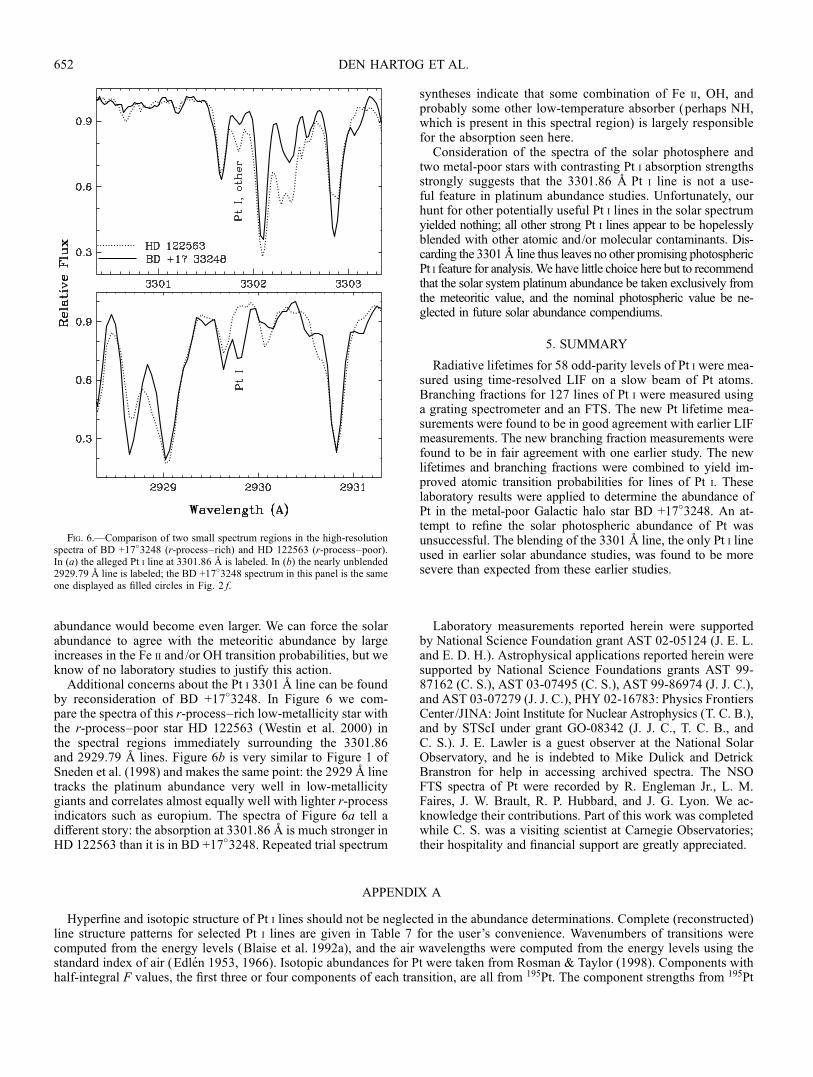
Additional concerns about the Pt i 3301 8 line can be foundby reconsideration of BD +17
�3248. In Figure 6 we com-
pare the spectra of this r-process–rich low-metallicity star withthe r-process–poor star HD 122563 (Westin et al. 2000) inthe spectral regions immediately surrounding the 3301.86and 2929.79 8 lines. Figure 6b is very similar to Figure 1 ofSneden et al. (1998) and makes the same point: the 2929 8 linetracks the platinum abundance very well in low-metallicitygiants and correlates almost equally well with lighter r-processindicators such as europium. The spectra of Figure 6a tell adifferent story: the absorption at 3301.86 8 is much stronger inHD 122563 than it is in BD +17
�3248. Repeated trial spectrum
syntheses indicate that some combination of Fe ii, OH, andprobably some other low-temperature absorber (perhaps NH,which is present in this spectral region) is largely responsiblefor the absorption seen here.Consideration of the spectra of the solar photosphere and
two metal-poor stars with contrasting Pt i absorption strengthsstrongly suggests that the 3301.86 8 Pt i line is not a use-ful feature in platinum abundance studies. Unfortunately, ourhunt for other potentially useful Pt i lines in the solar spectrumyielded nothing; all other strong Pt i lines appear to be hopelesslyblended with other atomic and/or molecular contaminants. Dis-carding the 33018 line thus leaves no other promising photosphericPt i feature for analysis.We have little choice here but to recommendthat the solar system platinum abundance be taken exclusively fromthe meteoritic value, and the nominal photospheric value be ne-glected in future solar abundance compendiums.
5. SUMMARY
Radiative lifetimes for 58 odd-parity levels of Pt i were mea-sured using time-resolved LIF on a slow beam of Pt atoms.Branching fractions for 127 lines of Pt i were measured usinga grating spectrometer and an FTS. The new Pt lifetime mea-surements were found to be in good agreement with earlier LIFmeasurements. The new branching fraction measurements werefound to be in fair agreement with one earlier study. The newlifetimes and branching fractions were combined to yield im-proved atomic transition probabilities for lines of Pt i. Theselaboratory results were applied to determine the abundance ofPt in the metal-poor Galactic halo star BD +17�3248. An at-tempt to refine the solar photospheric abundance of Pt wasunsuccessful. The blending of the 3301 8 line, the only Pt i lineused in earlier solar abundance studies, was found to be moresevere than expected from these earlier studies.
Laboratory measurements reported herein were supportedby National Science Foundation grant AST 02-05124 (J. E. L.and E. D. H.). Astrophysical applications reported herein weresupported by National Science Foundations grants AST 99-87162 (C. S.), AST 03-07495 (C. S.), AST 99-86974 (J. J. C.),and AST 03-07279 (J. J. C.), PHY 02-16783: Physics FrontiersCenter/JINA: Joint Institute for Nuclear Astrophysics (T. C. B.),and by STScI under grant GO-08342 (J. J. C., T. C. B., andC. S.). J. E. Lawler is a guest observer at the National SolarObservatory, and he is indebted to Mike Dulick and DetrickBranstron for help in accessing archived spectra. The NSOFTS spectra of Pt were recorded by R. Engleman Jr., L. M.Faires, J. W. Brault, R. P. Hubbard, and J. G. Lyon. We ac-knowledge their contributions. Part of this work was completedwhile C. S. was a visiting scientist at Carnegie Observatories;their hospitality and financial support are greatly appreciated.
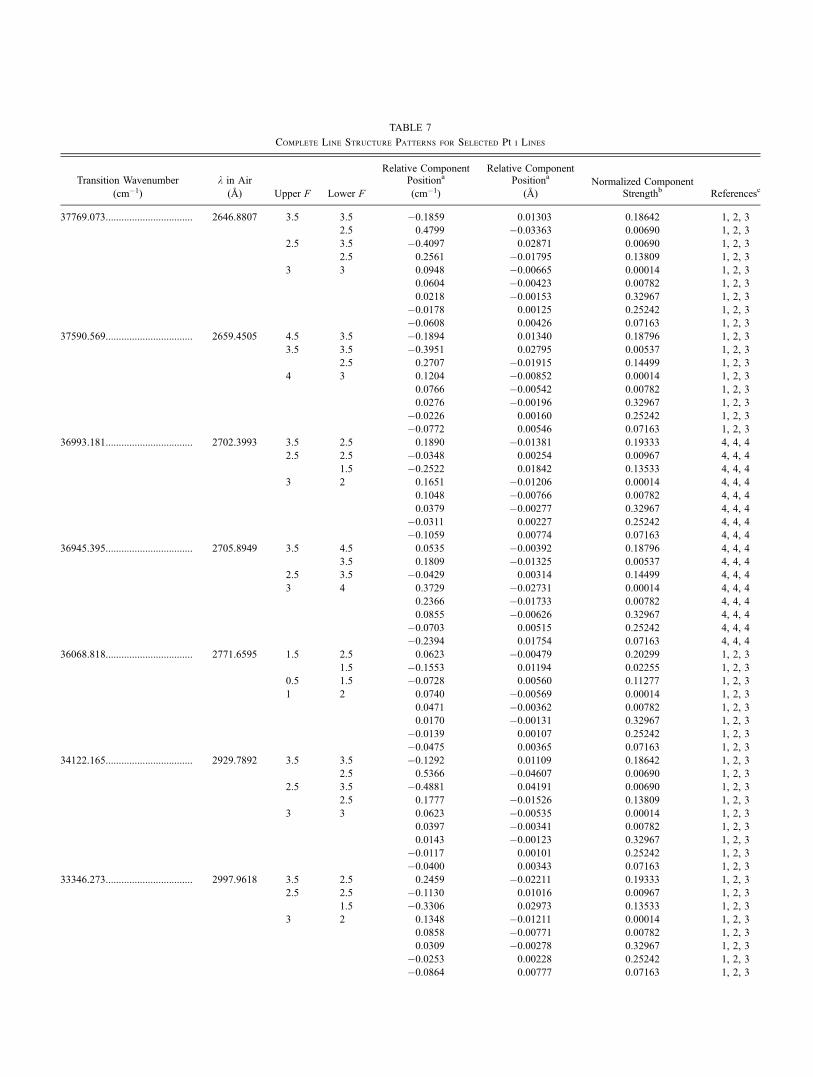
APPENDIX A
Hyperfine and isotopic structure of Pt i lines should not be neglected in the abundance determinations. Complete (reconstructed)line structure patterns for selected Pt i lines are given in Table 7 for the user’s convenience. Wavenumbers of transitions werecomputed from the energy levels (Blaise et al. 1992a), and the air wavelengths were computed from the energy levels using thestandard index of air (Edlen 1953, 1966). Isotopic abundances for Pt were taken from Rosman & Taylor (1998). Components withhalf-integral F values, the first three or four components of each transition, are all from 195Pt. The component strengths from 195Pt
Fig. 6.—Comparison of two small spectrum regions in the high-resolutionspectra of BD +17�3248 (r-process–rich) and HD 122563 (r-process–poor).In (a) the alleged Pt i line at 3301.86 8 is labeled. In (b) the nearly unblended2929.79 8 line is labeled; the BD +17�3248 spectrum in this panel is the sameone displayed as filled circles in Fig. 2 f.
DEN HARTOG ET AL.652
TABLE 7
Complete Line Structure Patterns for Selected Pt i Lines
always sum to 0.33832 (within rounding error). The first component with integral F for each transition, which always has componentstrength 0.00014, is 190Pt. The other even isotopes, 192Pt (0.00782), 194Pt (0.32967), 196Pt (0.25242), and 198Pt (0.07163), are listedfollowing 190Pt. Relative component strengths would need to be modified to model nonsolar isotopic abundances. The center-of-gravity wavenumbers and wavelengths for a solar isotopic abundance in Table 7 would also need to be slightly modified for anonsolar isotopic abundance.
REFERENCES
Adams, D. L., & Whaling, W. 1981, J. Opt. Soc. Am., 71, 1036Anderson, H. M., Den Hartog, E. A., & Lawler, J. E. 1996, J. Opt. Soc. Am. B,13, 2382
Basar, G., Kronfeldt, H.-D., & Kroger, S. 1996, Z. Phys. D, 36, 35Biemont, E., Baudoux, M., Kurucz, R. L., Ansbacher, W., & Pinnington, E. H.1991, A&A, 249, 539
Biemont, E., Palmeri, P., Quinet, P., Zhang, Z. G., & Svanberg, S. 2002, ApJ,567, 1276
Blackwell, D. E., Ibbetson, P. A., Petford, A. D., & Shallis, M. J. 1979a,MNRAS, 186, 633
Blackwell, D. E., Petford, A. D., & Shallis, M. J. 1979b, MNRAS, 186, 657Blaise, J., Verges, J., Wyart, J.-F., & Engleman, R., Jr. 1992a, J. de Phys. II,2, 947
———. 1992b, J. Res. NIST, 97, 213Bord, D. J., Cowley, C. R., & Mirijanian, D. 1998, Sol. Phys., 178, 221Brault, J. W. 1976, J. Opt. Soc. Am., 66, 1081Bridges, J. M., & Ott, W. R. 1977, Appl. Opt., 16, 367Buttgenbach, S., Glaeser, N., Roski, B., & Traber, F. 1984, Z. Phys. A,317, 237
Cowan, J. J., Burris, D. L., Sneden, C., McWilliam, A., & Preston, G. W. 1995,ApJ, 439, L51
Cowan, J. J., Sneden, C., Truran, J. W., & Burris, D. L. 1996, ApJ, 460, L115Cowan, J. J., et al. 2002, ApJ, 572, 861Curry, J. J., Den Hartog, E. A., & Lawler, J. E. 1997, J. Opt. Soc. Am. B,14, 2788
Danzmann, K., & Kock, M. 1982, J. Opt. Soc. Am., 72, 1556Delbouille, L., Roland, G., & Neven, L. 1973, Photometric Atlas of the SolarSpectrum from k3000 to k10000 (Liege: Inst. Ap. Univ. Liege)
Den Hartog, E. A., Curry, J. J., Wickliffe, M. E., & Lawler, J. E. 1998, Sol.Phys., 178, 239
Den Hartog, E. A., Fedchak, J. A., & Lawler, J. E. 2001, J. Opt. Soc. Am. B,18, 861
Den Hartog, E. A., Lawler, J. E., Sneden, C., & Cowan, J. J. 2003, ApJS,148, 543
Den Hartog, E. A., Wickliffe, M. E., & Lawler, J. E. 2002, ApJS, 141, 255Den Hartog, E. A., Wiese, L. M., & Lawler, J. E. 1999, J. Opt. Soc. Am. B,16, 2278
Edlen, B. 1953, J. Opt. Soc. Am., 43, 339———. 1966, Metrologia, 2, 71Fedchak, J. A., Den Hartog, E. A., Lawler, J. E., Palmeri, P., Quinet, P., &Biemont, E. 2000, ApJ, 542, 1109
Gough, D. S., Hannaford, P., & Lowe, R. M. 1982, J. Phys. B, 15, L431Gratton, R., & Sneden, C. 1994, A&A, 287, 927Grevesse, N., & Sauval, A. J. 1998, Space Sci. Rev., 85, 161Guo, B., Ansbacher, W., Pinnington, E. H., Ji, Q., & Berends, R. W. 1992,Phys. Rev. A, 46, 641
Hashiguchi, S., & Hasikuni, M. 1985, J. Phys. Soc. Japan, 54, 1290Ivarsson, S., Litzen, U., & Wahlgren, G. M. 2001, Phys. Scr., 64, 455Ivarsson, S., et al. 2003, A&A, 409, 1141Klose, J. Z., Bridges, J. M., & Ott, W. R. 1988, J. Res. NBS, 93, 21Kono, A., & Hattori, S. 1984, Phys. Rev. A, 29, 2981Kronfeldt, H.-D., & Basar, G. 1995, Phys. Scr., 51, 227Kurucz, R. L. 1998, in IAU Symp. 189, Fundamental Stellar Properties: TheInteraction between Observation and Theory, ed. T. R. Bedding, A. J. Booth,& J. Davis (Dordrecht: Kluwer), 217
Kurucz, R. L., & Avrett, E. H. 1981, Solar Spectrum Synthesis. I. A SampleAltas from 224 to 300 nm (Cambridge: SAO)
LaBelle, R. D., Fairbank, W. M., Jr., Engleman, R., & Keller, R. A. 1989, J.Opt. Soc. Am. B, 6, 137
Lawler, J. E., Bonvallet, G., & Sneden, C. 2001a, ApJ, 556, 452Lawler, J. E., Sneden, C., & Cowan, J. J. 2004, ApJ, 604, 850Lawler, J. E., Wickliffe, M. E., Cowley, C. R., & Sneden, C. 2001b, ApJS,137, 341
Lawler, J. E., Wickliffe, M. E., Den Hartog, E. A., & Sneden, C. 2001c, ApJ,563, 1075
Lodders, K. 2003, ApJ, 591, 1220Lotrian, J., & Guern, Y. 1982, J. Phys. B, 15, 1982Lundberg, H., Johansson, S., Nilsson, H., & Zhang, Z. 2001, A&A, 372, L50
Note.—Table 7 is also available in machine-readable form in the electronic edition of the Astrophysical Journal.a Component position relative to the center of gravity of the transition as given in the first two columns. The center-of-gravity wavenumbers and wavelengths in
the first two columns are for a solar isotopic mix.b Component strengths normalized so that they sum to unity.c The first reference gives the source of the isotope shifts, the second reference gives the source of the lower level hyperfine constant, and the third reference
gives the source of the upper level hyperfine constant.References.—(1) Kronfeldt & Basar 1995; (2) Buttgenbach et al. 1984; (3) Basar et al. 1996; (4) LaBelle et al. 1989; (5) Neu et al. 1987.
DEN HARTOG ET AL.654 Vol. 619
McWilliam, A., Preston, G. W., Sneden, C., & Searle, L. 1995, AJ, 109, 2757Moore, C. E., Minnaert, M. G. J., & Houtgast, J. 1966, The Solar Spectrum2935 8 to 8770 8 (NBS Monogr. 61; Washington, DC: NBS)
Neu, W., Passler, G., Sawatzky, G., Winkler, R., & Kluge, H.-J. 1987, Z. Phys.D, 7, 193
Palmeri, P., Quinet, P., Wyart, J.-F., & Biemont, E. 2000, Phys. Scr., 61, 323Quinet, P., Palmeri, P., Biemont, E., McCurdy, M. M., Rieger, G., Pinnington,E. H., Wickliffe, M. E., & Lawler, J. E. 1999, MNRAS, 307, 934
Ramanujam, P. S., & Andersen, T. 1978, ApJ, 226, 1171Reader, J., Acquista, N., Sansonetti, C. J., & Sansonetti, J. E. 1990, ApJS,72, 831
Rosman, K. J. R., & Taylor, P. D. P. 1998, J. Phys. Chem. Ref. Data, 27, 1275Ryan, S. G., Norris, J. E., & Beers, T. C. 1996, ApJ, 471, 254Sansonetti, J. E., Reader, J., Sansonetti, C. J., & Acquista, N. 1992, J. Res.NIST, 97, 1
Simmerer, J. A., Sneden, C., Cowan, J. J., Collier, J., Woolf, V. M., & Lawler,J. E. 2005, ApJ, in press
Sneden, C. 1973, ApJ, 184, 839Sneden, C., Cowan, J. J., Burris, D. L., & Truran, J. W. 1998, ApJ, 496, 235Sneden, C., McWilliam, A., Preston, G. W., Cowan, J. J., Burris, D. L., &Armosky, B. J. 1996, ApJ, 467, 819
Sneden, C., et al. 2003, ApJ, 591, 936Volz, U., & Schmoranzer, H. 1998, in AIP Conf. Proc. 434, Atomic and Mo-lecular Data and Their Applications, ed. P. J. Mohr & W. L. Wiese(Woodbury: AIP), 67
Weiss, A. W. 1995, Phys. Rev. A, 51, 1067Westin, J., Sneden, C., Gustafsson, B., & Cowan, J. J. 2000, ApJ, 530, 783Whaling, W., Carle, M. T., & Pitt, M. L. 1993, J. Quant. Spectrosc. Radiat.Transfer, 50, 7
Wickliffe, M. E., & Lawler, J. E. 1997, J. Opt. Soc. Am. B, 14, 737Wickliffe, M. E., Lawler, J. E., & Nave, G. 2000, J. Quant. Spectrosc. Radiat.Transfer, 66, 363
Xu, H. L., Svanberg, S., Quinet, P., Garnir, H. P., & Biemont, E. 2003, J. Phys.B, 36, 4773
Yan, Z.-C., Tambasco, M., & Drake, G. W. F. 1998, Phys. Rev. A, 57, 1652Youssef, N. H., & Khalil, N. M. 1987, A&A, 186, 333
Pt TRANSITION PROBABILITIES AND ABUNDANCES 655No. 1, 2005