Improved Lightning Performance for 132 kV OHL Master’s thesis in Electric Power Engineering Tomas Ingmarson Johan Stelin Department of Materials and Manufacturing Technology CHALMERS UNIVERSITY OF TECHNOLOGY Gothenburg, Sweden 2017
Transcript
Improved Lightning Performancefor 132 kV OHLMaster’s thesis in Electric Power Engineering
Tomas IngmarsonJohan Stelin
Department of Materials and Manufacturing TechnologyCHALMERS UNIVERSITY OF TECHNOLOGYGothenburg, Sweden 2017
Master’s thesis 2017:195
Improved Lightning Performance for 132 kV OHL
TOMAS INGMARSONJOHAN STELIN
Department of Materials and Manufacturing TechnologyDivision of High Voltage Engineering
Chalmers University of TechnologyGothenburg, Sweden 2017
Improved Lightning Performance for 132 kV OHLTOMAS INGMARSONJOHAN STELIN
Supervisor: Per Norberg, Vattenfall Eldistribution ABExaminer: Jörgen Blennow, Department of Materials and Manufacturing Technol-ogy
Master’s Thesis 2017:195Department of Materials and Manufacturing TechnologyDivision of High Voltage EngineeringChalmers University of TechnologySE-412 96 GothenburgTelephone +46 31 772 1000
Cover: An old 132 kV wood portal tower without arcing horns and with two shieldwires.
Typeset in LATEXGothenburg, Sweden 2017
iv
Improved Lighting Performance for 132 kV OHLTOMAS INGMARSONJOHAN STELINDepartment of Materials and Manufacturing TechnologyChalmers University of Technology
AbstractLightning strokes to transmission lines causes a majority of the power quality issuesthat are so severe that sensitive industrial loads are disturbed. Historically Vatten-fall concluded that it is too expensive to use shield wires for the 132 kV grid due tothe high soil resistivity in Sweden. Today the situation is different with sensitiveindustrial loads and the current Vattenfall standard is to build portal tower with oneshield wire. The shield wire is however not used to reduce the amount of lightningfaults, it is used to ground the cross arm and reduce the amount of short circuits.
In this project the lightning performance of different tower configurations used in the132 kV grid is investigated using statistical insulation coordination in the softwaresLPE and PSCAD. The optimal placement of the shield wires on towers locatedon flat ground is determined. Furthermore, the shield wire configuration of a newportal tower with two shield wires and typical Swedish conditions is proposed andcompared to a portal tower with one shield wire. The demand is that the amountof lightning faults should be reduced by half compared to the case with a portaltower without shield wires. It is concluded that in order to achieve this decreasein the amount of faults a portal tower with one shield wire requires a tower footresistance of 16.5 Ω while a portal tower with two shield wires requires a tower footresistance of 35.1 Ω. The distribution between single line to ground faults and shortcircuits for both configurations is estimated, where a second shield wire proved to re-duce the amount of short circuits. Furthermore, it is concluded that every cross armneeds to be grounded properly in order to achieve the desired lightning performance.
A cost estimation based on an average 132 kV line with average loading showed thata second shield wire could not cover its own costs. It is important to rememberthat the cost estimation is based on an average 132 kV line and it does not considerimportant industries or costs of groundings. If this would be included a second shieldwire could be profitable in some cases. Therefore it is recommended to consider thelocal conditions when deciding if a new transmission line is built with one or twoshield wires.
AcknowledgementsA special thanks to our supervisor Per Norberg at Vattenfall Eldistribution who gaveus the opportunity to carry out this master thesis and provided continuous supportthroughout the project. Furthermore, we would like to thank our examiner JörgenBlennow at Chalmers for his helpful comments and discussions. Other people whocontributed to the project and should be mentioned are Staffan Moss at VattenfallEldistribution who always provided necessary data. Jan Lundquist at STRI, whoprovided support regarding LPE and helpful discussions about lightning simulations.Tarik Abdulahovic and Ehsan Behrouzian at Chalmers gave us important advicesregarding PSCAD modeling which was very useful.
Tomas Ingmarson & Johan Stelin, Gothenburg, May 2017
This chapter gives a brief introduction to the history of shield wire usage at Vat-tenfall Eldistribution AB, henceforth referred to as Vattenfall, and explains thequestions which are treated in the report.
1.1 Background
People have been fascinated by lightning flashes for decades. Historically it hascaused thousands of deaths and destroyed buildings and ships. Much of the knowl-edge about lightning flashes today is based upon observations from the ground andsatellites [1]. A lightning flash can consist of several lightning strokes. The strokeshas a statistical nature, where the amplitude can range from a few kA to severalhundreds of kA [1, 2].
Today lightning strokes to transmission lines is the source behind a majority of thepower quality issues that are severe enough to disturb sensitive industrial loads [3].If a transmission line is unshielded the lightning strokes may terminate on the phaseconductors, resulting in a high overvoltage and usually flashovers across the insulatorstrings. By equipping the insulator strings with arc horns the flashover takes placein the air instead of on the insulator string and thereby the risk of total destructionof the string is reduced, or in other words, the insulation is self-recovering. Almostevery stroke to an unshielded line with wood poles will cause short circuits betweenthe phases [4]. This is a severe issue for heavy motor industries like paper mills,where a disturbance due to a lightning stroke to a transmission line may causeseveral hours of lost production and scrapping of the paper that is currently in theproduction line [3, 5].
One way to protect transmission lines against lightning strokes is by placing shieldwires above the phase conductors. The purpose is to cover or shield the phase con-ductors from direct lightning strokes. A path to ground from the shield wires isrequired and thereby the shield wires needs to be grounded along the transmissionline [1]. Two common ways of designing the grounding and shield wires is determin-istic respectively statistical insulation coordination. In the deterministic approachno faults are tolerated and the worst case scenario is the design factor. The statis-
1
1. Introduction
tical approach can be used when failure is allowed due to self-restoring insulationand instead of a worst case design a certain risk of failure is allowed [6]. Usuallythe deterministic approach is impossible from an economical aspect, because in or-der to achieve a full protection the shield wires need to cover the phase conductorscompletely and a very low tower foot resistance is required to avoid back flashovers[1]. The tower foot resistance is the resistance between the grounding of tower anda point which is located so far away that the potential at this point is unaffected bya change in potential at the grounding of the tower [7]. The way shield wires areused in practice can vary a lot between different areas and different companies [8].
In the 1930:s Vattenfall concluded that it would be too expensive to achieve a propergrounding to use shield wires for the 132 kV grid due to high soil resistivity [8]. Inthe 1990:s Vattenfall re-introduced the shield wire again. The current Vattenfallstandard is to build with one shield wire. A portal tower with two shield wires for132 kV and typical Swedish conditions has not been investigated yet. It is unknownif it would have a lightning performance that can motivate the usage of an additionalshield wire while also considering an economical aspect. The re-introduction of theshield wire was not done primarily to reduce the amount of flashovers. By groundingthe cross arm the amount of short circuits between the phases is reduced and insteadthe chance of having a single line to ground fault is increased. Historically it wasnot important to distinguish between different kinds of faults for Vattenfall, sincethe line is tripped anyway. With sensitive industrial loads the situation is differenttoday. If a fault is single line to ground there will still be some voltage left on allphases since the line passes one or several wye/delta transformers before the load,compared to the case with a short circuit where several phases could be withoutvoltage at the load. From that perspective Vattenfall prefers single line to groundfaults over short circuits [9]. In order to get single line to ground faults the towerfoot resistance must be low to avoid back flashovers from the shield wires and thecross arm to the phase conductors [1].
The tower foot resistance is depending on the soil resistivity. Sweden has differentsoil resistivities, ranging from a few hundreds of Ω m to several thousands Ω mdepending on the location [7]. The basic insulation level, BIL, for an overhead linewith 132 kV is 550 kV [9]. BIL is defined as the crest value of the voltage of a standardlightning impulse which has a 10% chance of causing a failure [1]. Theoretically thismeans that if an average lightning stroke would be 20 kA (later in this thesis it isshown that the average lightning current is 33.3 kA) and it would meet a resistanceof 550/20 = 27.5 Ω, flashovers for roughly half of the lightning strokes could beprevented. A tower foot resistance of 27.5 Ω is a value that Vattenfall think ispossible to reach in many different areas in Sweden. If the tower foot resistancewould be higher than 27.5 Ω it could still be worth it to reduce it below 27.5 Ωby improving the grounding of the poles. Furthermore, an optimal placement andnumber of shield wires could reduce the amount of short circuits and instead increasethe amount of single line to ground faults, which is preferred.
2
1. Introduction
1.2 Aim
The overall aim of the project is to give Vattenfall a recommendation on shield wireconfiguration for new constructions based on a technical, economical and reliabilityperspective.
1.3 Research questions
The following research questions are treated in the project:
• What is the optimal placement of the shield wires for the different configura-tions?
• Which tower foot resistance is required for portal tower with one respectivelytwo shield wires to reduce the lightning faults by half?
• What is the expected fault distribution with the proposed solutions for portaltowers?
• How frequent should the cross arms of the portal towers be grounded?
• Is a portal tower with an additional shield wire better from an economicalperspective than a portal tower with one shield wire?
In order to give a recommendation, the risk for flashover for typical line designswith shield wires must be calculated. Three different tower topologies are consid-ered. These are concrete tower with one shield wire, steel tower with one shieldwire and wood portal tower with one respectively two shield wires. For the steeland concrete tower it is not possible to add another shield wire with the currenttower construction. Therefore only the optimal position of the shield wire shouldbe determined. In this case the parameter which is determined is the height of theshield wire at the towers located on flat ground. The phase conductors are kept attheir current positions, it is not allowed to move them closer to the shield wires.
For the portal towers with one respectively two shield wires the optimal positioningof the shield wires is determined. The demand is that the shield wires shouldbe configured and grounded in order to avoid flashovers for half of the lightningstrokes. The amount of short circuits for lightning strokes of higher amplitude shouldbe as low as possible, instead single line to ground fault is preferred. Thereforethe expected distribution between single line to ground faults and short circuits isestimated with one respectively two shield wires.
The tower foot resistance is an important parameter which is determined. Forportal towers with one respectively two shield wires the tower foot resistance whichis required in order to meet the demand of a reduction in lightning faults by half is
3
1. Introduction
determined. As mentioned earlier it is believed that it is required to be 27.5 Ω orlower. If this is true or not should be determined. Furthermore, how frequent theshield wires needs to be grounded is determined. This is important since it might bepossible to save some money by for example only grounding every second or everythird pole.
It is also important to determine if a new portal tower with two shield wires is betterthan a portal tower with one shield wire from an economic perspective. Thereforethe cost for an additional shield wire and the cost for the reduction in the amountof faults is estimated.
There are several unknown parameters which needs to be determined to answer thequestions above. The soil resistivity in different areas needs to be determined. Com-mon grounding methods in general and which ones are typical in use for the 132 kVgrid and typical resulting values of tower foot resistances needs to be determined.The lightning and its parameters needs to be characterized. The environmentalgains with an improved lightning performance is also considered and discussed.
1.4 Scope
Typical pole designs provided by Vattenfall are used to test different shield wireconfigurations. Pole constructions without shield wires are not covered since it isnot a Vattenfall standard anymore. The location of the phase conductors is fixed.For portal towers with shield wire the distance between the phase conductors is4.5 m in order to provide a safety margin. No other positioning of the phases iscovered. Only lightning studies are conducted, icing and pollution studies are notconsidered. Furthermore, high altitudes are not considered, the transmission linesare assumed to be located close to the sea level.
Only new constructions are considered for the towers since existing constructionswill not be modified in order to change the location of the shield wire or be equippedwith an additional shield wire.
The use of shield wires to protect against lightning strokes is an old method. Oneother method is to use line surge arresters. STRI, a Swedish power system consultantcompany, developed a 420 kV line that was built without shield wires in Norway.Instead of shield wires the phase conductors were placed in a vertical configurationand the top phase conductor acts as a shield wire. Line surge arresters are usedon every tower and it has a lightning performance similar to a conventional portaltower with shield wires but it was a lot more expensive [10]. Line surge arresters alsorequires low tower foot resistance and Vattenfall considers them to be a complementand too expensive to be used in a standardized solution. Therefore the use of linesurge arresters are not evaluated.
4
1. Introduction
1.5 Method
Statistical insulation coordination is used since faults are tolerated and the insulationis self-restoring. A literature review is conducted with focus on lightning, groundingmethods and shielding of transmission lines. The lightning needs to be characterizedwith respect to amplitude and front time [2]. It is also important to determine howthe outcome of a lightning stroke is depending on the tower foot resistance and thewave impedances. The review of shielding is also including the difference betweengrounded and ungrounded cross arms. Ground flash density, GFD, data is retrievedfrom SMHI [11]. The Swedish soil resistivity in different areas was measured by acommittee consisting of Vattenfall and some other companies [7].
In order to determine typical tower foot resistance values an interview is conductedwith a Vattenfall employee who is working with field measurements on different poleconstructions. Vattenfall is also providing data for towers, phase conductors, shieldwires, insulator strings and distances between towers.
When the literature study is finished and all parameters are known the lightningperformance of the different towers are evaluated in a software called Line Perfor-mance Estimator "LPE" provided by STRI. A detailed study of LPE is done in orderto determine its limitations. It is also important to determine how the lightning ischaracterized in the software. LPE can calculate the amount of faults due to strokesto the phase conductors and faults due to back flashovers from strokes to the shieldwires [12, 13]. It is used for both horizontal and vertical configurations with orwithout shield wires [13]. In order to judge the results from the simulations it iscompared to fault statistics for a portal tower without shield wires from Vattenfall.
Initially it was unknown if LPE considered sag of lines and if it could distinguishbetween different types of faults. Sag of a line can be described as how much theline hangs down between two towers. LPE could not dinstiguish between singleline to ground faults and short circuits. Therefore an additonal model is developedin PSCAD. The PSCAD model is based on the leader propagation model which isused in several different lightning studies from IEEE and CIGRE [1, 2]. CIGRE,International Council on Large Electric Systems, is a European organisation basedin France which gathers members from all around the world. IEEE, Institute ofElectrical and Electronics Engineers, is similar to CIGRE but it covers more fieldsthan large power systems and it is based in the United States.
The PSCAD model is used to estimate the distribution between single line to groundfaults and short ciruits and to determine if every pole needs to be grounded or not.In order to verify that the PSCAD model works as intended the potential at a towerduring a linear increasing stroke is compared to theoretical wave shapes and values.Furthermore, STRI has estimated the fault distribution for a tower with differentdimensions and parameters [14]. These parameters are also used in the PSCADmodel in order to compare with the result STRI achieved.
5
1. Introduction
The cost for an additional shield wire for the portal tower is estimated by lookingat previous line constructions which are similar to the suggested configurations.In order to judge if it is profitable or not it is compared to the reduction in costfor faults. The cost for faults are estimated using a reference line model providedby Vattenfall. The reference line is a 132 kV line with average length and averageloading in a meshed grid. The environmental impact of an additional shield wire isdiscussed based on the extra material required and some papers from IEEE regardingconsequences of disruptions at paper mills due to lightning strokes.
6
2Lightning and transmission lines
This chapter contains the literature review that was conducted. Several characterisa-tions of the lightning has already been done. Models which describes if a lightningstroke terminates on a phase conductor or a shield wire and the soil breakdownaround a ground rod are explained. Furthermore, the difference between groundedand ungrounded cross arms during lightning strokes is explained.
2.1 Lightning flashes
There are four different types of lightning flashes, they are determined by the polarityof the accumulated charges in the thunder cloud and the leader propagation direction[2]. These four types are known as:
• Negative Downward Flash
• Negative Upward Flash
• Positive Downward Flash
• Positive Upward Flash
For structures with heights less than 100 m, about 85-95% of the flashes are ofnegative downward type while upward strokes are more common at mountains andtall buildings [1]. A lightning flash can consist of more than one stroke. Strokes thattakes place after the first stroke are known as subsequent strokes. The subsequentstrokes are usually smaller in amplitude compared to the first stroke, but they cansometimes achieve a higher amplitude than the first stroke [1, 2].
2.1.1 Lightning characteristic
Three important quantities in lightning studies are amplitude, front time and tailtime [1, 2]. Since the negative downward stroke is the most common to low struc-tures such as transmission lines the CIGRE Working Group 01 (Lightning) of Study
7
2. Lightning and transmission lines
Committee 33 studied it at seven different locations in the world [2]. In order tofit a curve to these measurements and get the first stroke amplitude distribution alog-normal probability density distribution is used, which can be described by thefollowing equation [2]
f(I) = 1√2πβI
e−(z2
2 ) (2.1)
where z can be calculated from (2.2).
z =ln( I
M)
β(2.2)
In (2.2) and (2.1) f(I) is the probability density, I is the current in kA, M is themedian value and β is the standard deviation of the stroke current. Initially CIGREused one curve to describe the amplitude distribution but it was later splitted upin two domains in order to get a better curve fitting. The first curve is called theshielding failure domain and is used for currents below 20 kA and the second curveis the backflash domain for currents larger than 20 kA. The values for M and β forthe different domains can be seen below [2].
• Shielding failure domain ( I < 20 kA ) M = 61 and β = 1.33
• Backflash domain ( I > 20 kA ) M = 33.3 and β = 0.605
IEEE is using another method to describe the amplitude [1, 2]. Instead of usinga log-normal distribution as (2.1) a more simplified equation is used, which wasadopted in [15]. This simplified method can be expressed as
p(I) = 11 + ( I
31)2.6 (2.3)
where I is the current in kA [15]. Equation (2.3) is a cumulative distribution anddirectly gives the probability for a stroke below a certain amplitude while (2.1) isthe probability density which needs to be integrated in order to find the cumulativedistribution [2]. In Figure 2.1 the integrated version of (2.1) is the solid red line and(2.3) is the dashed blue line.
8
2. Lightning and transmission lines
100
101
102
103
I [kA]
0
50
100
Per
cent
[%]
IEEE
Cigre
Figure 2.1: Probability that the lightning stroke amplitude is below a certainamplitude [1, 2].
The 50% value has been marked in Figure 2.1. For the CIGRE distribution 50%of the lightning strokes has an amplitude of about 33.3 kA or less [1, 2]. It canalso be noted that IEEEs method deviates a bit from CIGRE’s method but bothcharacterizations are quite similar overall. However, the CIGRE distribution is basedon newer data and more measurements than IEEE and is therefore considered tobe more accurate [1, 2]. Table 2.1 shows the probability of a negative downwardstroke with an amplitude equal to or less than a certain amplitude with steps of5 kA according to the CIGRE distribution from Figure 2.1. Furthermore, in [2] it isalso concluded that a negative downward stroke has a median front time of 2.2 µsand a median tail time of 77.5 µs.
Table 2.1: Probability that the lightning stroke amplitude is below a certainamplitude according to the CIGRE distribution [1, 2].
When a lightning stroke hits the transmission line it can be modeled as travelingwaves of voltage and current propagating on the line. The impedance seen by atraveling wave is known as the characteristic impedance and can be expressed asthe quotient of the voltage and current wave at any position and time on the line[1]
9
2. Lightning and transmission lines
Z = V (t, z)I(t, z) . (2.4)
A distributed transmission line model consists of series elements of resistance andinductance and shunt elements of capacitance and resistance. By starting from thedifferential equations known as the general transmission line equations and assuminga lossless line, (2.4) can be rewritten as
Z =√L
C[Ω] (2.5)
where L and C is the inductance respectively the capacitance per unit length of theline with respect to ground [1, 16]. One important property of the characteristicimpedance, which can be seen in (2.5), is that the characteristic impedance is notdependent on the length of the transmission line [16]. The parameters L and C canbe calculated using image method. For a single conductor they can be expressed as
L = 0.20 ln 2hr
[µH/m]
C = 10−3
18 ln 2hr
[µF/m](2.6)
where h is the average height of the conductor above the ground plane and r isthe radius of the conductor [1]. It is important to notice that the values of L andC from (2.6) is with respect to ground and not the same as the line inductanceand capacitance parameters used in power system calculations. Furthermore, thevelocity of a wave propagating on a transmission line can be calculated as [1]
v = 1√LC
[m/s]. (2.7)
By substituting L and C in (2.7) with (2.6) the resulting wave velocity is close tothe the speed of light, independent of height and radius of the conductor [1].
2.2.1 Unshielded transmission lines
Figure 2.2 shows an example of a 132 kV wood portal tower with some of its impor-tant parts. The wood portal tower has a horizontal phase configuration. The crossarm is the horizontal bar to which the insulator strings are connected, the cross armis typically made of steel [8]. The purpose of the arcing horns is that the flashovershould take place in the air instead of on the insulator string, which could damage
10
2. Lightning and transmission lines
or destroy the insulators [4]. If shield wires are used they are connected to the crossarm which is connected to the earth electrodes via conductors called downleads [1].
Shield wire
Phase wire
Shield wire
Cross arm
Wood poleWood pole
Insulator string
Arcing horn
Arcing hornPhase wirePhase wire
Downlead Downlead
Earth electrodeEarth electrode
Figure 2.2: An example of a wood portal tower 132 kV and some of its mostimportant parts.
The lightning stroke will face different wave impedances depending on if it hits aphase conductor or a shield wire [4]. If there are no shield wires the lightning strokewill terminate on one of the phase conductors. If the stroke terminates on a phaseconductor the traveling wave is splitted up in two equal parts, propagating out inopposite direction from the stroke point, which can be seen in Figure 2.3 [4].
11
2. Lightning and transmission lines
I (t) I (t)I (t)
22
Figure 2.3: When the lightning stroke hits a conductor the wave is splitted upinto two equal parts propagating out in each direction.
Thus, the voltage at any point on the conductor can then be expressed as
V (t) = ZI(t)
2 (2.8)
where Z is the wave impedance from (2.5) [4]. Typically the wave impedance of aconductor is in the range of 400-500 Ω [1]. The traveling wave will induce voltagesresulting in traveling waves on the other conductors. The magnitude of the inducedwaves depends on the coupling factor between the conductors, which is a geometricproperty [4]. Furthermore, the stroke causes an overvoltage across the insulatorstring and across the air gap between the struck conductor and the other conductorsin the span. The insulation strength of the air gap in the span always exceeds theinsulation strength of the air gap between the arcing horns of the insulator stringand thereby most of the flashovers will take place at the towers. Thus the amountof flashovers within the span is negligible [1].
For wood portal tower, which is the old Vattenfall standard, the combination ofwood poles and lack of shield wires results in ungrounded cross arms [4, 9]. Thiswas a standard that Vattenfall proposed for 132 kV and 220 kV where the wood poleswere a part of the insulation in order to be cost efficient [9]. Lack of shield wiresdoes not generally mean that the cross arm has to be ungrounded [4].
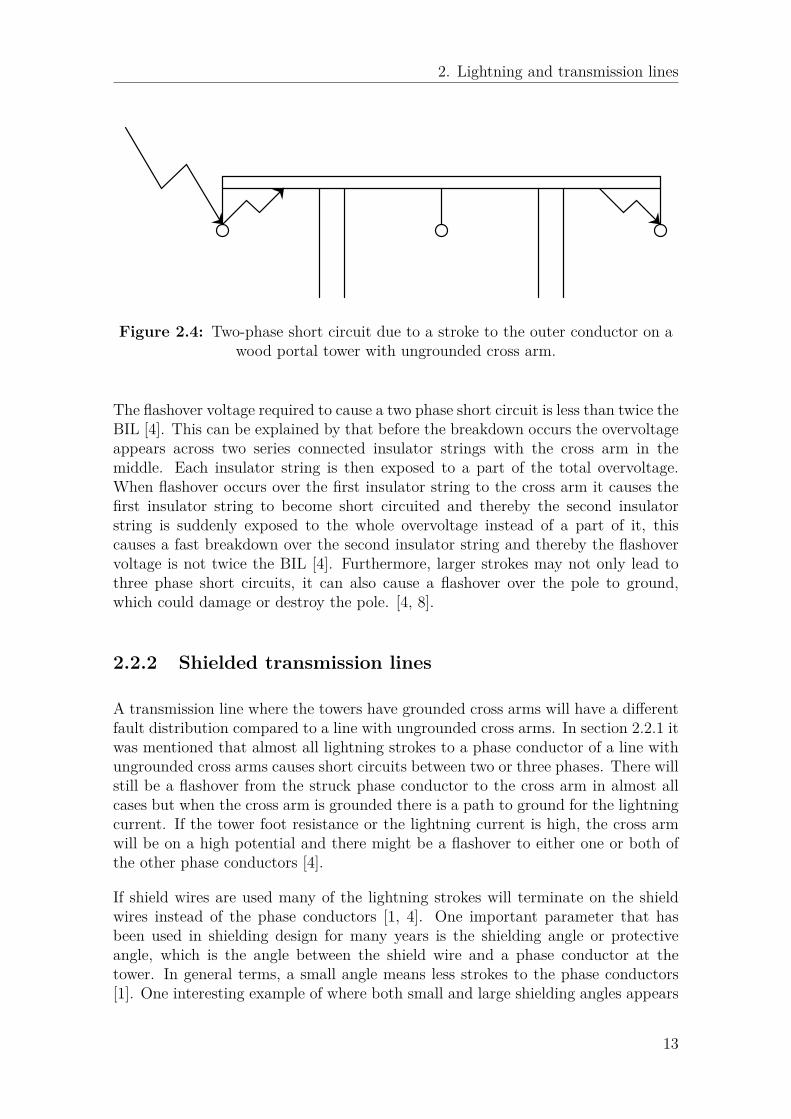
As a consequence of the isolated cross arm, the flashover voltage over the pole fromthe cross arm to ground is about 2-3 MV, which is far above the BIL. In practisethe high flashover voltage of the pole causes almost all of the lightning strokes tolead to either two or three phase short circuits. If it is a two or three phase faultdepends on the magnitude of the stroke current and which phase that it terminateson, since that will effect the amplitude of the induced waves on the other conductors[4]. Figure 2.4 shows the case when the lightning stroke terminates on one of theouter conductors. The middle conductor is located closer to the struck conductor,therefore a wave with higher amplitude is induced compared to the other outerconductor. This means that the largest potential difference occurs between the twoouter conductors and if a two phase flashover takes place it is between the outerconductors via the cross arm [4].
12
2. Lightning and transmission lines
Figure 2.4: Two-phase short circuit due to a stroke to the outer conductor on awood portal tower with ungrounded cross arm.
The flashover voltage required to cause a two phase short circuit is less than twice theBIL [4]. This can be explained by that before the breakdown occurs the overvoltageappears across two series connected insulator strings with the cross arm in themiddle. Each insulator string is then exposed to a part of the total overvoltage.When flashover occurs over the first insulator string to the cross arm it causes thefirst insulator string to become short circuited and thereby the second insulatorstring is suddenly exposed to the whole overvoltage instead of a part of it, thiscauses a fast breakdown over the second insulator string and thereby the flashovervoltage is not twice the BIL [4]. Furthermore, larger strokes may not only lead tothree phase short circuits, it can also cause a flashover over the pole to ground,which could damage or destroy the pole. [4, 8].
2.2.2 Shielded transmission lines
A transmission line where the towers have grounded cross arms will have a differentfault distribution compared to a line with ungrounded cross arms. In section 2.2.1 itwas mentioned that almost all lightning strokes to a phase conductor of a line withungrounded cross arms causes short circuits between two or three phases. There willstill be a flashover from the struck phase conductor to the cross arm in almost allcases but when the cross arm is grounded there is a path to ground for the lightningcurrent. If the tower foot resistance or the lightning current is high, the cross armwill be on a high potential and there might be a flashover to either one or both ofthe other phase conductors [4].
If shield wires are used many of the lightning strokes will terminate on the shieldwires instead of the phase conductors [1, 4]. One important parameter that hasbeen used in shielding design for many years is the shielding angle or protectiveangle, which is the angle between the shield wire and a phase conductor at thetower. In general terms, a small angle means less strokes to the phase conductors[1]. One interesting example of where both small and large shielding angles appears
13
2. Lightning and transmission lines
in reality is from the Swedish grid, which can be seen in Figure 2.5. The towerwas originally intended to be used in a quadruple 800 kV line but it is used for twoduplex 400 kV lines instead [9]. The shielding angle to the outer two phases is toolarge and therefore the insulation level had to be increased for those two phases,which can be seen by the increased length of the insulator strings [9].
Figure 2.5: Increased insulation level on the outer phases due to large shieldingangles at a tower used in the Swedish grid which was originally intended to be usedfor a 800 kV line but is instead used for two 400 kV lines. Photo taken by Puggen.
If proper shielding angles are used for all phase conductors, unlike the example inFigure 2.5, many of the strokes will terminate on the shield wires but this does not
14
2. Lightning and transmission lines
mean that there will not be any faults. A stroke to the shield wire might causea flashover from the cross arm to any of the phase conductors if the potential onthe cross arm is high. This type of flashover from the cross arm to one or severalof the phase conductors is known as a back flashover [1, 4]. For the case with oneshield wire a lightning stroke to a tower will produce one wave propagating downon the tower and two waves propagating out in each direction on the shield wire [1].The maximum voltage on the tower without considering any reflections can then beexpressed as
e = ZTZg/2ZT + Zg/2
I (2.9)
where ZT is the tower surge impedance and Zg is the wave impedance of the shieldwire [1]. If two shield wires would be used instead it would provide two additionalpaths for the waves [4]. Furthermore, (2.9) is valid for strokes to a tower. A strokein the span results in the same voltage as a stroke to the tower if the front time isshorter than the travel time for the reflected wave from the other adjacent tower.Otherwise a stroke to the span results in a lower voltage at the tower compared toa stroke to the tower [1]. In [1] it was concluded that back flash rate, BFR, whilealso considering strokes in the span can be approximated good by calculating theBFR for strokes to the tower multiplied by 0.6 [1].
The wave that propagates down on the tower will be reflected against ground andreduce the voltage at the tower top. The resulting voltage on the tower top afterthe reflection from ground depends on front time, tower travel time and reflectioncoefficient. Tower travel time is the quotient between tower height and the wavevelocity [1]. The reflection coefficient can be calculated as
ΓT = Ri − ZTRi + ZT
(2.10)
where Ri is the impulse resistance of the grounding rod from (2.22) and ZT is thetower surge impedance [1, 2]. The impulse resistance Ri is the current dependenttower foot resistance, which is lower than the measured value of the tower footresistance [1].
As mentioned earlier the tower foot resistance and lightning amplitude dictates ifthere is a back flashover [1]. With practical values the tower foot resistance accountsfor about 80% of the potential on the tower due to a stroke to the tower [1]. Oneway to estimate the potential on a tower due to a lightning stroke to the tower isthen (2.11)
U ≈ R0I (2.11)
where R0 is the measured tower foot resistance and I is the lightning stroke amplitude[4]. This is however an approximation, as mentioned earlier the tower foot resistance
15
2. Lightning and transmission lines
is not a constant parameter, all of the current from the stroke will not flow throughthe struck tower and furthermore reflections from ground will reduce the potentialat the tower [1, 4].
As mentioned earlier waves also propagate out on the shield wires. As soon as thesewaves reach a discontinuity a portion of the wave is reflected. For a transmissionline this means that there will be reflections from every tower the wave reaches backtowards the point where the lightning stroke took place [1]. There are also reflectionsfrom ground at these towers. Reflections that reach the lightning stroke point willfurther reduce the voltage at this point. Towers located far from the stroke pointwill not have a large effect on the voltage at the stroke point since not so much isreflected back [1]. Furthermore, if the distance is long the reflected waves might notreach the stroke point before the crest value is reached and thereby only reduce thetail voltage. In practise towers beyond the adjacent towers has a negligible effect onthe voltage [1].
The tower surge impedance ZT is a time varying parameter which reaches its maxi-mum value after two times the tower travel time. However, the tower surge impedanceis not a sensitive parameter and thereby the average value is used in calculations[1]. The average tower surge impedance can be calculated as
ZT = 60(ln(√
22hr− 1)) (2.12)
where h is the tower height and r is the radius [1]. The equation is actually for acylinder shape but since the tower surge impedance is not a sensitive parameter itis also used for portal towers [1]. If two downleads are used on portal tower themutual surge impedance needs to be considered. The mutual surge impedance canbe expressed as
Zm = 60(ln(√
22hD− 1)) (2.13)
where D is the distance between the poles [1]. The total surge impedance for twodownleads on a portal tower can then be calculated from
ZTotal = ZT + Zm2 (2.14)
where ZT is the tower surge impedance according to (2.12) and Zm is the mutualimpedance from (2.13) [1].
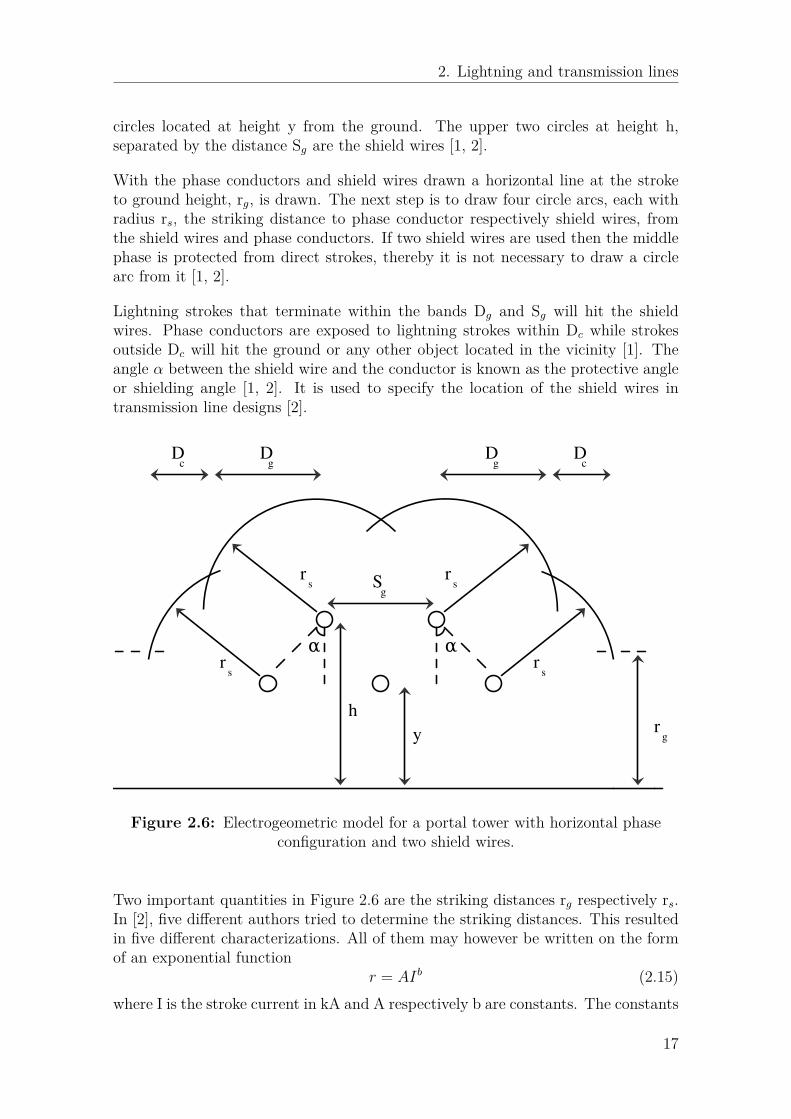
If shield wires are used it is important to determine if the lightning stroke terminateson a shield wire, phase conductor or on ground. The electrogeometric model, whichcan be seen in Figure 2.6, is used to determine this [2]. The model is limitedto vertical negative downward strokes. The phase conductors are the lower three
16
2. Lightning and transmission lines
circles located at height y from the ground. The upper two circles at height h,separated by the distance Sg are the shield wires [1, 2].
With the phase conductors and shield wires drawn a horizontal line at the stroketo ground height, rg, is drawn. The next step is to draw four circle arcs, each withradius rs, the striking distance to phase conductor respectively shield wires, fromthe shield wires and phase conductors. If two shield wires are used then the middlephase is protected from direct strokes, thereby it is not necessary to draw a circlearc from it [1, 2].
Lightning strokes that terminate within the bands Dg and Sg will hit the shieldwires. Phase conductors are exposed to lightning strokes within Dc while strokesoutside Dc will hit the ground or any other object located in the vicinity [1]. Theangle α between the shield wire and the conductor is known as the protective angleor shielding angle [1, 2]. It is used to specify the location of the shield wires intransmission line designs [2].A A
B B
C C
D D
1
1
2
2
3
3
4
4
5
5
TITLE:
New Schematic REV: 1.0
Date: 2017-01-30 Sheet: 1/1
EasyEDA V4.1.3 Drawn By: Your Name
yh
rs
s s
s
r r
rαα
rg
Sg
Dgg
D Dc
Dc
Figure 2.6: Electrogeometric model for a portal tower with horizontal phaseconfiguration and two shield wires.
Two important quantities in Figure 2.6 are the striking distances rg respectively rs.In [2], five different authors tried to determine the striking distances. This resultedin five different characterizations. All of them may however be written on the formof an exponential function
r = AIb (2.15)where I is the stroke current in kA and A respectively b are constants. The constants
17
2. Lightning and transmission lines
have different values for different characterizations. Once the striking distances rsand rg are known it is possible to calculate the bands Dg respectively Ds [2]. Thenumber of strokes that terminate on the phase conductors, which is usually denotedas the shielding failure rate, SFR, can then be calculated as
SFR = 2N gL∫ Imax
Imin
Dcf(I)dI (2.16)
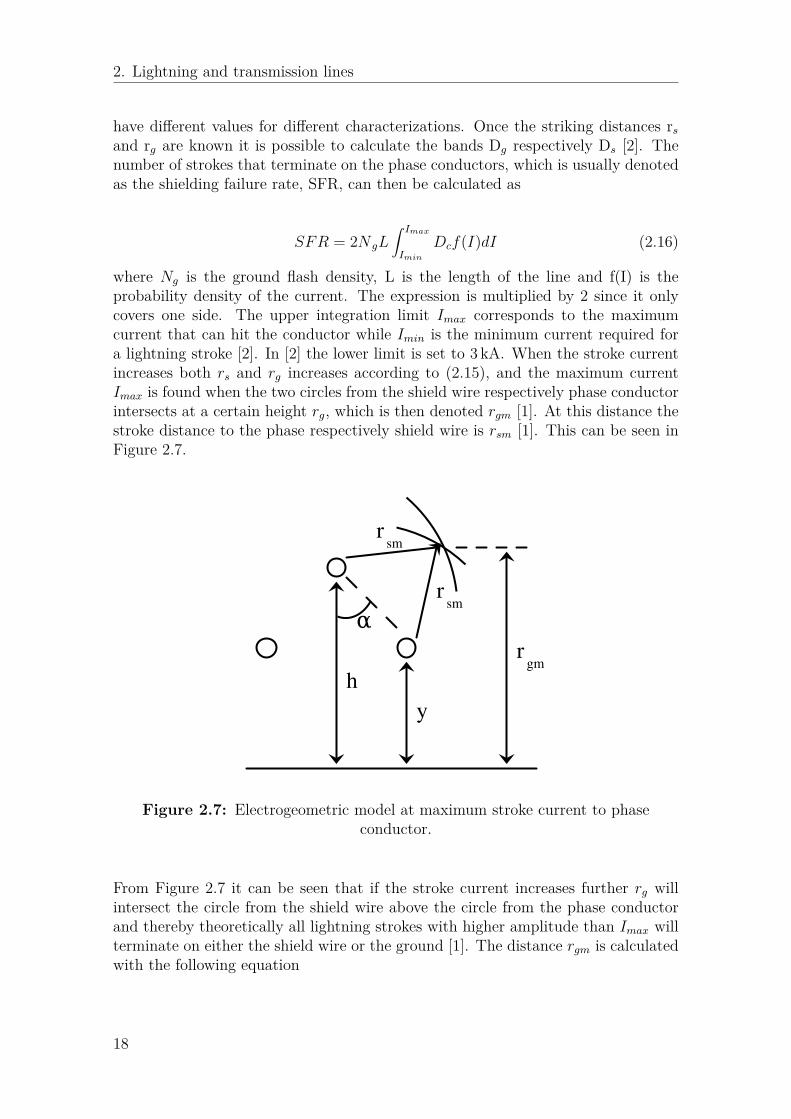
where Ng is the ground flash density, L is the length of the line and f(I) is theprobability density of the current. The expression is multiplied by 2 since it onlycovers one side. The upper integration limit Imax corresponds to the maximumcurrent that can hit the conductor while Imin is the minimum current required fora lightning stroke [2]. In [2] the lower limit is set to 3 kA. When the stroke currentincreases both rs and rg increases according to (2.15), and the maximum currentImax is found when the two circles from the shield wire respectively phase conductorintersects at a certain height rg, which is then denoted rgm [1]. At this distance thestroke distance to the phase respectively shield wire is rsm [1]. This can be seen inFigure 2.7.
α
yh
rgm
r
r
sm
sm
Figure 2.7: Electrogeometric model at maximum stroke current to phaseconductor.
From Figure 2.7 it can be seen that if the stroke current increases further rg willintersect the circle from the shield wire above the circle from the phase conductorand thereby theoretically all lightning strokes with higher amplitude than Imax willterminate on either the shield wire or the ground [1]. The distance rgm is calculatedwith the following equation
18
2. Lightning and transmission lines
rgm = h+ y
2(1− rsm
rgmsin(α)) . (2.17)
Once the distance rgm is known the maximum current Imax can be calculated byrearranging (2.15) to (2.18) [1]
Imax = (rgmA
) 1b . (2.18)
Furthermore, (2.16) can be modified in order to calculate the amount of shieldingfailure that causes a flashover from the phase conductor to the cross arm, whichis known as the shielding failure flashover rate or SFFOR. This can be done byreplacing the lower limit in the integration with Icrit
SFFOR = 2N gL∫ Imax
Icrit
Dcf(I)dI. (2.19)
In (2.19) Icrit is the critical current required to cause a flashover. It can be calculatedby rearranging (2.8) into
Icrit = 2UCFOZ
(2.20)
where UCFO is the critical flashover voltage and Z is the wave impedance of thephase conductor, which is calculated using (2.5) [1].
2.3 Tower groundings
A decrease of the tower foot resistance can be achieved by grounding the pole indifferent ways. For the wood portal tower these different ways could be deep earthelectrode, shallow earth electrode or an underground earth electrode. Shallow earthelectrode is ground rods placed radially at a depth of 1 m while deep earth electrodeis placed vertically deeper than 1 m. An underground earth electrode is a conductorwhich is buried in the ground along the transmission line. The most used onehowever is deep earth electrode, but this is depending the earth geology and howhigh the soil resistivity is. Even if deep earth electrode is used it might not beenough in order to decrease the tower foot resistance. Therefore an undergroundearth electrode can be added to further decrease the tower foot resistance or evenmore deep earth electrodes has to be added. The material used for these methodsis often iron and copper [17, 18].
High currents causes the tower foot resistance to decrease below the measured valuesdue to soil breakdown around the electrode [1, 2]. Figure 2.8 shows a ground rodwhich is exposed to a high current due to a lightning stroke. The high current causes
19
2. Lightning and transmission lines
a potential build up on the ground rod. Soil has a certain breakdown strength andwhen the critical gradient Eo, which is typically 400 kV/m, is exceeded breakdownof soil around the ground rod occurs [1, 2]. Streamers are produced evaporatingmoisture followed by arcs in the soil. The resistivity within the affected area isdecreased drastically and it behaves as a conductor. The ground rod will increase insize to the limit that is denoted as "first" in Figure 2.8. As the breakdown processcontinues, the equivalent ground rod will take on a hemispherical shape, which isdenoted as "last" in Figure 2.8 [1].
Ir
Ground surface
Radius, r
Rho,p = 0
Eo
Ground rod
First
Last
Figure 2.8: Ground rod acts like a hemisphere when exposed to a high current.
It is possible to describe this mathematically by assuming that the ground rod hasthe shape of a hemisphere before the lightning stroke, which is seen in Figure 2.9.
20
2. Lightning and transmission lines
Ir
Ground surface
Radius, r
Rho,p = 0
Eo
ro
Figure 2.9: By assuming that the ground rod has a hemispherical shape beforebreakdown it is possible to describe the breakdown process mathematically.
The amount of current that is required to the break the boundary labeled r0 can bereferred to as Ig and it can be represented by the following equation
Ig = Eoρ
2πR2o
(2.21)
where Ro is the measured value for the tower foot resistance for low currents, Eois the critical gradient as explained earlier and ρ is the soil resistivity [1, 2]. Thebreakdown process will continue as long as the current is larger than Ig. In Figure2.9 this is the case until the radius r is reached. The soil resistivity inside thisradius r, is about zero and therefore the soil can be seen as a conductor. Theresulting resistance is known as the impulse resistance Ri and it is calculated withthe following equation [1]
Ri = Ro√1 + IR
Ig
(2.22)
where IR is the current through the tower foot and Ig is the current required forsoil breakdown according to (2.21). The number one in the denominator makes theequation valid for both low and high currents [1].
21
2. Lightning and transmission lines
22
3Transmission line models
This chapter presents the different transmission line models that are used in theproject and describes how they are implemented in LPE and PSCAD.
3.1 Line performance estimator
LPE, line performance estimator, is a software which is used to estimate the perfor-mance of different transmission line structures. It can be used for lightning perfor-mance, switching studies, icing tests and pollution of insulators [13]. The output ofLPE is the number of faults due to these events, which is given in faults per 100 kmand year or for each section of the line. As mentioned in section 1.4 only lightning isconsidered in this study. For lightning studies LPE outputs the number of shieldingfailure flashovers and back flashover events. LPE utilizes the electrogeometric modeldescribed in section 2.2.2 for lightning studies. The striking distances are calculatedusing (2.15) with the constants determined by Brown and Whitehead [12]. Accord-ing to Brown and Whitehead the constant b equals 0.75 for both striking distanceswhile A differs. For striking distance to ground A equals 6.4 and for striking distanceto conductor respectively shield wire A equals 7.1 [2].
The SFR, shielding failure rate, is calculated with (2.16), where the minimum currentis set to 3 kA. The upper limit is calculated from (2.17) and (2.18). LPE is thencalculating the SFFOR, shielding failure flashover rate, by implementing (2.19).Back flashovers are considered in LPE but there is no distinction between differenttypes of short circuits. Furthermore, some assumptions are used in the software. Thecorona effect on shield wires is neglected. All flashovers are assumed to occur at thetower, no flashovers can occur in the span [12]. In section 2.2.2 it was mentionedthat strokes within the span results in equal or less voltage at the tower compared toa stroke at the tower. In the backflash calculation this is considered by calculatingthe backflash rate, BFR, based on strokes to the tower and then multiplying it with0.6. BFR is calculated with the following equation
BFR = 0.6NLP (I > Ic) (3.1)
23
3. Transmission line models
where NL is the amount of of strokes per year for a 100 km line and P(I>Ic) is theprobability of a current larger than the critical current Ic which is required to causea backflashover. The critical current is calculated with (3.2)
Ic = CFONS − VPFKSP (KTA − CAKTT ) . (3.2)
In (3.2) VPF corresponds to the effect of the system voltage. For a vertical phaseconfiguration VPF is 0.4 times the peak phase voltage and for a horizontal config-uration it is 0.7 times the peak phase voltage [12]. In general the waveshapes ofthe voltages across the insulator strings deviates from the CFO, critical flashovervoltage, for standard lightning impulse [1]. In LPE this is considered by by usingCFONS, the non-standard CFO, which is calculated from a regression analysis ofthe leader progression model LPM. CA is the coupling factor between either a singleor two shield wires and the phase conductor. KSP is the reduction of tower voltagecaused by reflection from all adjacent towers and KTT is the combined impedanceof the shield wires and the tower foot impulse resistance with reflection from thetower foot seen from the top of the tower. KTA is defined in the same way as KTT
but it is seen from the same height as the phase conductor. Furthermore, towersurge impedance is modeled using (2.12) respectively (2.14) and tower foot impulseresistance with (2.22) [12]. One limitation for the tower foot resistance is that it ispossible to use different values for different towers but LPE will only use the largestvalue in the calculations. Furthermore, there needs to be a tower foot resistance forevery tower which means that it is not possible to leave some towers ungrounded[13].
3.1.1 Environmental parameters
Only negative downward strokes and first stroke is considered in LPE. Furthermore,LPE assumes a flat terrain around the transmission line and thereby any effectscaused by vegetation is neglected. For lightning studies the distribution character-ized by CIGRE in section 2.1.1 is used. The only lightning related parameter whichmay be changed by the user is the ground flash density, GFD, which is the numberof strokes that terminate on 1 km2 per year [12]. SMHI has collected data over thelightning activity in Sweden during several decades. GFD in most parts of Swedenis 0.2-0.25 per km2 and year. The exception is the northern parts, where the groundflash density is close to zero in some areas [11]. In LPE the GFD was selected to0.25 per km2 and year.
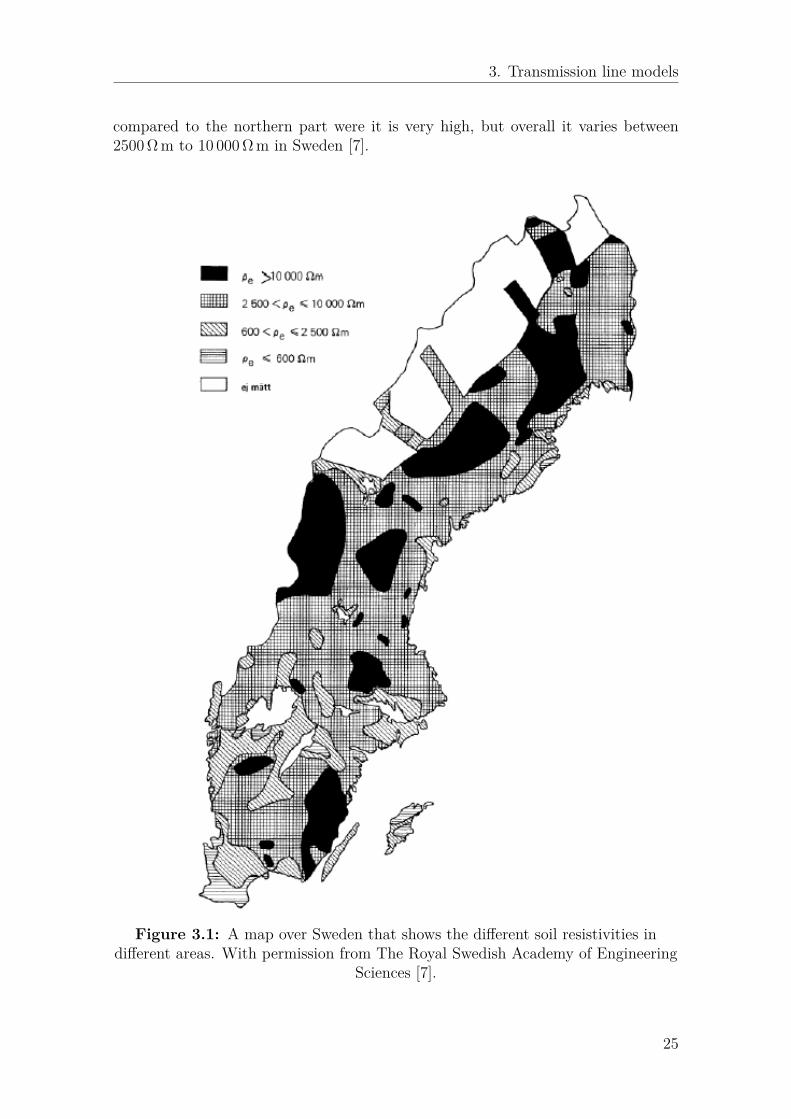
Another environmental parameter which is used in lightning studies is soil resistivity.The soil resistivity in different parts of Sweden has been measured by a committeefrom The Royal Swedish Academy of Engineering Sciences [7]. Based on this thesoil resistivity in all simulations was selected to 3000 Ω m. The soil reisistivity inSweden varies a lot from the southern part to the northern part of Sweden, whichcan be seen in 3.1. It can be seen that southern part has a very low soil resistiviy
24
3. Transmission line models
compared to the northern part were it is very high, but overall it varies between2500 Ω m to 10 000 Ω m in Sweden [7].
Figure 3.1: A map over Sweden that shows the different soil resistivities indifferent areas. With permission from The Royal Swedish Academy of Engineering
Sciences [7].
25
3. Transmission line models
3.2 Tower configurations
The different tower configurations that are considered are the wood portal towerwithout shield wire and with one respectively two shield wires. These towers areconstructed in LPE based on pole design data acquired from Vattenfall. There aretwo types of wires: AlMgSi phase conductors with a diameter of 31.7 mm and ACSRshield wire with a diameter of 15.4 mm. The insulator strings used in all studies arecap and pin type with a total length of 2 m, considering mechanical couplings thenominal length is 1.95 m and the distance between the arcing horns is 1.02 m.
3.2.1 Wood portal tower
An example of a wood portal tower without shield wire can be seen in Figure 3.2.The poles are located in the middle between the phase conductors. The height of a132 kV portal tower on plain ground is 14 m. The phase conductors are located 2 mbelow the cross arm, they have a sag of 5.5 m in the middle of the span.
Phase wirePhase wire Phase wire
12 m
14 m
1.965 m 2 m 2 m 1.965 m
2 m
5.5 mPhase wiresag
Phase wiresag
Phase wiresag
Figure 3.2: Wood portal tower without shield wire.
In Figure 3.2 it can be noticed that the distance between the phase conductors isroughly 4 m, compared to the same tower type with shield wires where the distancebetween the phase conductors is 4.5 m instead. Figure 3.3 shows an example of aportal tower with one shield wire. The sag of the phase wires is 5.5 m as previously
26
3. Transmission line models
while the sag of the shield wire is 3.8 m. The sag is effected by line temperature, spanlength, line area and spanned. The values of the sags that are used in the simulationsis for a phase conductor temperature of 50 C and a shield wire temperature of 15 C.
Shield wire
Phase wirePhase wire Phase wire
12 m
h
4.5 m
4.5 m
Phase wiresag 5.5 m
Phase wiresag
Phase wiresag
Shield wiresag, 3.8 m
Figure 3.3: Wood portal tower with one shield wire.
The height of the shield wire at the tower, labeled as h in Figure 3.3, is one of theparameters of interest. The current Vattenfall standard is 16 m. In the simulationsthe height of the shield wire at the tower is swept from 16 m to 23 m in steps of0.5 m.
Figure 3.4 depicts a wood portal tower in real life with one shield wire. Comparedto the schematic in Figure 3.3 it can be noticed that the shield wire is placed on thecross arm and a little bit under instead of having it placed on the pole. Furthermore,the insulator strings are equipped with arcing horns, which can be seen at both endsof the insulator string, compared to the front cover.
27
3. Transmission line models
Figure 3.4: Wood portal tower with one shield wire and insulator strings witharcing horns.
Figure 3.5 shows an example of the portal tower with two shield wires. The sag ofphase wires respectively shield wires are the same as previously. Same shield wireheight sweeping is performed for this configuration.
28
3. Transmission line models
Shield wire
Phase wirePhase wire Phase wire
Shield wire
h
12 m
4.5 m
4.5 m
Phase wiresag
Phase wiresag
Phase wiresag
5.5 m
Shield wiresag, 3.8 m
Shield wiresag, 3.8 m
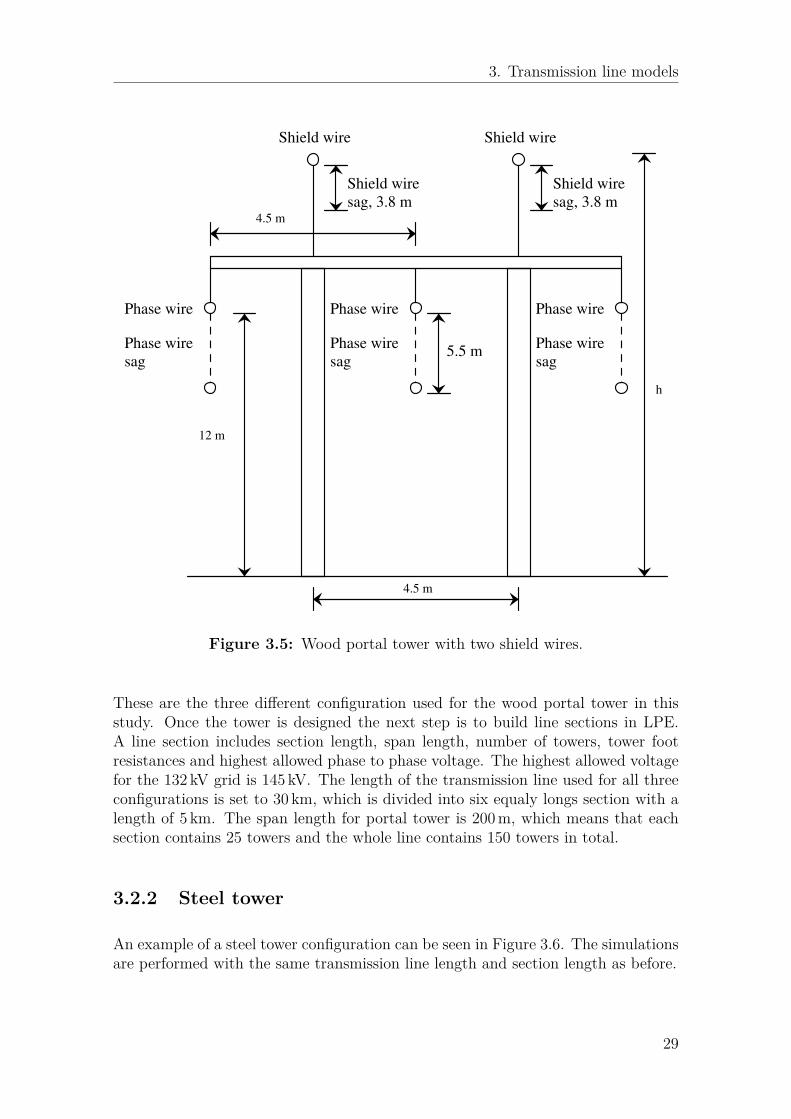
Figure 3.5: Wood portal tower with two shield wires.
These are the three different configuration used for the wood portal tower in thisstudy. Once the tower is designed the next step is to build line sections in LPE.A line section includes section length, span length, number of towers, tower footresistances and highest allowed phase to phase voltage. The highest allowed voltagefor the 132 kV grid is 145 kV. The length of the transmission line used for all threeconfigurations is set to 30 km, which is divided into six equaly longs section with alength of 5 km. The span length for portal tower is 200 m, which means that eachsection contains 25 towers and the whole line contains 150 towers in total.
3.2.2 Steel tower
An example of a steel tower configuration can be seen in Figure 3.6. The simulationsare performed with the same transmission line length and section length as before.
29
3. Transmission line models
2 m
h
20 m
2.5 m
Phase wire
Phase wire
Phase wire
Shield wire
2.5 m
Phase wiresag, 7.67 m
Phase wiresag, 7.67 m
Shield wiresag, 7.67 m
Phase wiresag, 7.67 m
Figure 3.6: Steel tower with vertical phase configuration and one shield wire.
In Figure 3.6 it can be observed that the phase configuration has changed comparedto the portal tower. For steel and concrete tower the phase configuration is verticalin a triangular shape. The height of the shield wire is initially 28.5 m and it is sweptin steps of 0.5 m up to 33 m. Furthermore, the phase wires are located at a higherheight compared to the portal tower. As a consequence the average span length is250 m. When the span length is increased the sag is also increasing. With a spanlength of 250 m the sag for the phase wires is about 7.67 m for a temperature of50 C and the shield wire sag is about 5.14 m for a temperature of 15 C.
3.2.3 Concrete tower
The concrete tower is the last tower structure that is simulated in LPE, an exampleof its configuration can be seen in Figure 3.7. It has the same phase configuration
30
3. Transmission line models
at the steel tower, the only difference is that the phase wires are slightly closer toground. Initially the height of the shieldwire is 26 m and it is swept in the same wayas for the steel tower. Furthermore, sag and span distances are the same as for steeltower. It can be seen in Figure 3.8 how the concrete tower looks like in real life.
2 m
h
17 m
2.5 m
Phase wire
Phase wire
Phase wire
Shield wire
2.5 m
Phase wiresag, 7.67 m
Phase wiresag, 7.67 m
Shield wiresag, 7.67 m
Phase wiresag, 7.67 m
Figure 3.7: Concrete tower with a vertical phase displacement and one shieldwire.
31
3. Transmission line models
Figure 3.8: Concrete tower with a vertical phase displacement and one shieldwire.
3.3 PSCAD model
A model was developed in PSCAD since LPE cannot distinguish between differentshort circuits caused by the lightning and the limitations in the software with differ-ent tower foot resistances and ungrounded poles. The aim with the PSCAD modelis to estimate the fault distribution for portal tower and to determine if every poleneeds to be grounded. Furthermore, it is also used to determine the performance ofa transmission line with mixed tower foot resistances. There are two separate mod-els, one with portal towers with one shield wire and one model with portal towerswith two shield wires. Each model consists of 9 towers. The system voltage is set to145 kV. The towers, phase conductors and shield wires are modeled with parametersfrom section 3.2.1.
A small section of the model with one shield wire can be seen in Figure 3.9. TheFigure shows one of the towers with adjacent span on each side. Towers are builtas modules. In [19] it is recommended to use the Frequency Dependent (Phase)model for the lines in the span. It is a distributed model and it has a high accuracyfor calculations with wave propagation [19]. Therefore the phase conductors andshield wires are modelled using Frequency Dependent (Phase) model. Furthermore,as suggested in [14], phase conductors and shield wires are terminated at the endsby their respective wave impedance according to (2.5) in order to avoid reflections.
32
3. Transmission line models
Figure 3.9: Portal tower with one shield wire and adjacent spans in the PSCADmodel.
Tower foot impulse resistance is modeled using (2.22), the constant Ig is calculatedaccording to (2.21) with a soil resistivity of 3000 Ω m. For the model with one shieldwire the towers are modeled with one downlead and a wave impedance of 247.3 Ωaccording to (2.12) while the model with two shield wires is using two downleadswith a resulting wave impedance of 162.9 Ω according to (2.14). In PSCAD the waveimpedance of the towers is modeled using a Bergeron model as wave impedance. TheBergeron model is a PSCAD model of a wave impedance which can be used to modeltransmission towers, apart from the value of the wave impedance it also considersheight and travel time [19]. Ungrounded towers are modeled without any downlead.
The flashover characteristic for the insulator strings are modeled with a nonstandardflashover voltage using the leader progression model, LPM, which is valid for a largerange of impulse shapes. LPM describes the leader propagation in a gap after the gapwas bridged by streamers [1, 2]. It is based on experimental results presented in [20],where the performance of air gaps exposed to lightning impulses were investigated[20]. The leader propagation is described by the following equation
dL
dt= ku(t)( u(t)
dg − l1− E0) (3.3)
where u(t) is the voltage across the gap, dg is the gap length, l1 is the currentlength of the leader, k is a constant and E0 is the breakdown gradient constantwhich determines when the breakdown process may start. The values of k and E0are geometry and polarity dependent. For cap and pin insulators with a positivepolarity CIGRE recommends E0 equal to 520 kV and k equal to 1.2 µm2v−2s−1 [2].
Based on the work in [21], the insulator string are modeled as modules containing astray capacitance in parallel with a switch. The length of the leader at every time
33
3. Transmission line models
step is calculated with (3.3) and once the gap is bridged and breakdown occurs theswitch is closed.
The lightning in PSCAD is modeled using a double exponential function
i(t) = I
η(e−t/τ1 − e−t/τ2) (3.4)
where I is the current amplitude, η is a correction factor used to achieve the correctamplitude, τ1 and τ2 are constants determining front and tail time [22]. They areselected in order to achieve a front and tail time of 2.2 µs respectively 77.5 µs.
In [14] it is mentioned that flashover from cross arm to ground can be modeledusing (3.3) by adjusting the gap distance. Furthermore, in [23] it is mentioned thatthe flashover voltage of a dry wood pole can be assumed to be 3000 kV. Therefore(3.3) is used to model flashover over the pole with dg adjusted to achieve a flashovervoltage of 3000 kV.
3.3.1 Distributed tower foot resistance
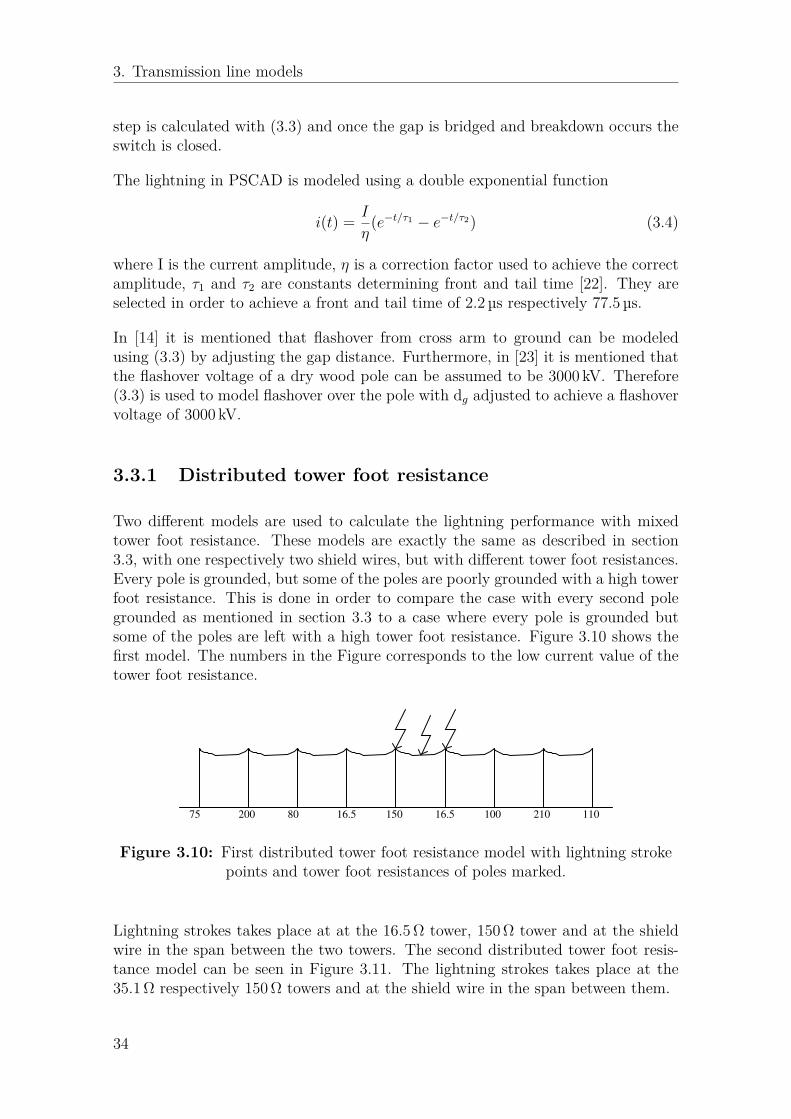
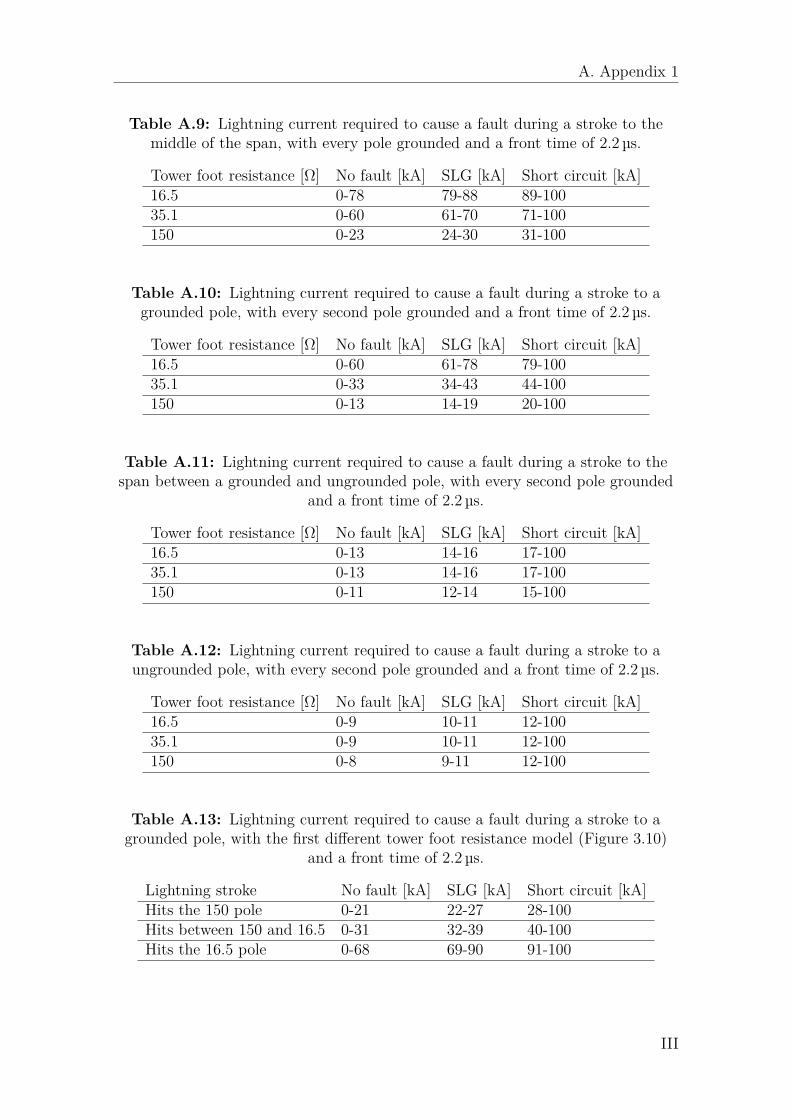
Two different models are used to calculate the lightning performance with mixedtower foot resistance. These models are exactly the same as described in section3.3, with one respectively two shield wires, but with different tower foot resistances.Every pole is grounded, but some of the poles are poorly grounded with a high towerfoot resistance. This is done in order to compare the case with every second polegrounded as mentioned in section 3.3 to a case where every pole is grounded butsome of the poles are left with a high tower foot resistance. Figure 3.10 shows thefirst model. The numbers in the Figure corresponds to the low current value of thetower foot resistance.
75 200 80 16.5 150 16.5 100 210 110
Figure 3.10: First distributed tower foot resistance model with lightning strokepoints and tower foot resistances of poles marked.
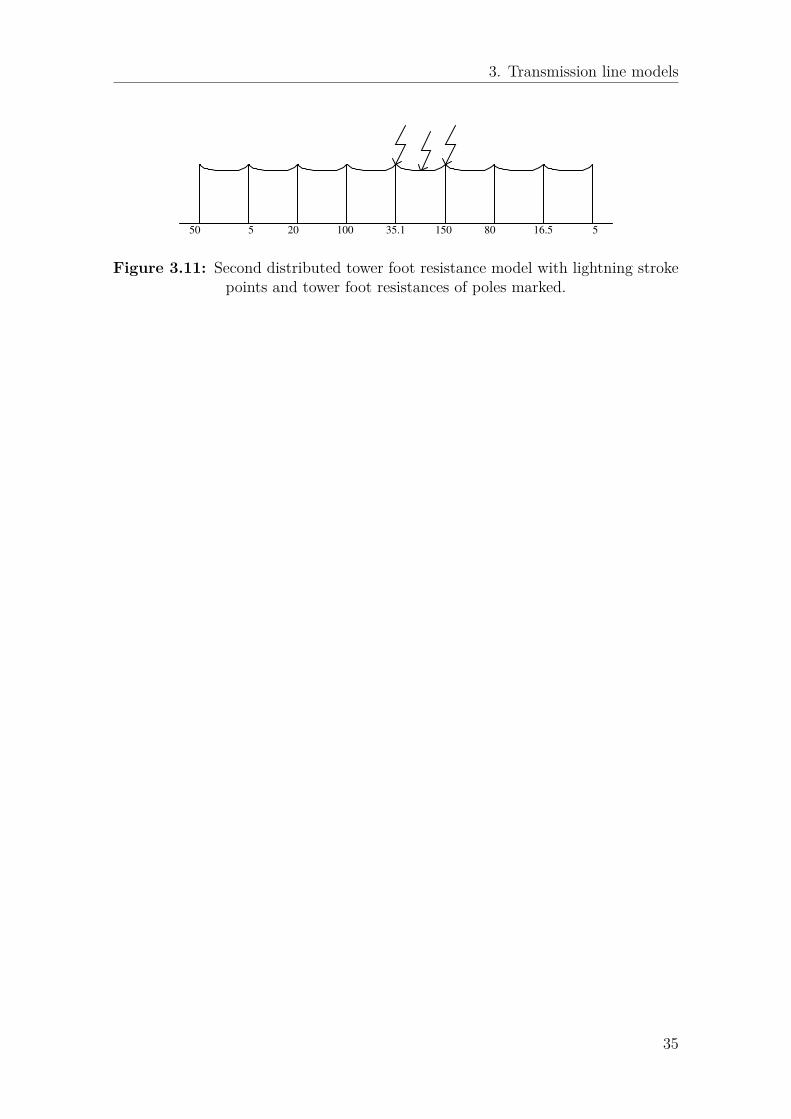
Lightning strokes takes place at at the 16.5 Ω tower, 150 Ω tower and at the shieldwire in the span between the two towers. The second distributed tower foot resis-tance model can be seen in Figure 3.11. The lightning strokes takes place at the35.1 Ω respectively 150 Ω towers and at the shield wire in the span between them.
34
3. Transmission line models
50 5 20 100 35.1 150 80 16.5 5
Figure 3.11: Second distributed tower foot resistance model with lightning strokepoints and tower foot resistances of poles marked.
35
3. Transmission line models
36
4Lightning performance
This chapter presents the lightning performance for three tower configurations withdifferent shield wire positions and tower foot resistances. According to Vattenfall’sfault statistics a portal tower without shield wires has about 2.5 faults per 100 kmand year [9]. Initially it was believed that the average lightning stroke was about20 kA and that a foot resistance of 27.5 Ω is something to strive for. However,in section 2.1.1 it is shown that the average lightning stroke has an amplitude of33.3 kA or less, therefore a new resistance value was calculated from BIL to 16.5 Ω.Furthermore, some real tower foot resistance values are also used in the simulations.These are based on field measurements of tower foot resistances and they are: 5 Ωfrom an area with clay in the soil, the average value of the poles on a line in theSwedish inland 35.1 Ω and 150 Ω, which corresponds to poles located on mountainoussoil.
4.1 Steel tower
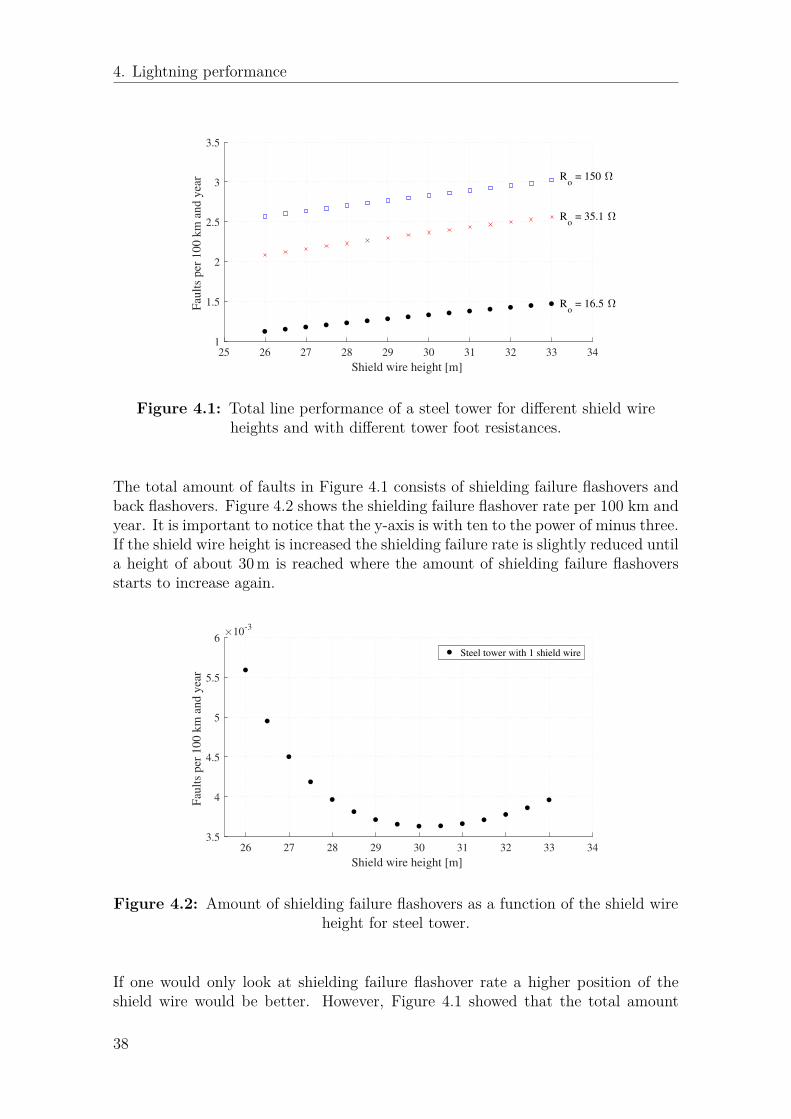
As mentioned in section 1.3 the position of the shield wire for concrete and steel toweris evaluated. Figure 4.1 shows the total line performance for steel tower with a towerfoot resistances of 16.5 Ω, 35.1 Ω and 150 Ω. It can be seen that number of faultsper 100 km and year increases almost linearly with increased shield wire height. Anincreased height does not improve the lightning performance. Independently of thetower foot resistance the lightning performance would improve if the height of theshield wire is decreased slightly. For example, if the shield wire is placed at 28.5 mit gives 1.25 faults per 100 km and year for a tower foot resistance of 16.5 Ω. If it ispossible to move the shield wire down to 26 m the number of faults would decreaseby 0.13 faults per 100 km and year to 1.12 faults per 100 km and year.
37
4. Lightning performance
25 26 27 28 29 30 31 32 33 34
Shield wire height [m]
1
1.5
2
2.5
3
3.5
Fau
lts
per
100 k
m a
nd y
ear
Ro = 16.5
Ro = 35.1
Ro = 150
Figure 4.1: Total line performance of a steel tower for different shield wireheights and with different tower foot resistances.
The total amount of faults in Figure 4.1 consists of shielding failure flashovers andback flashovers. Figure 4.2 shows the shielding failure flashover rate per 100 km andyear. It is important to notice that the y-axis is with ten to the power of minus three.If the shield wire height is increased the shielding failure rate is slightly reduced untila height of about 30 m is reached where the amount of shielding failure flashoversstarts to increase again.
26 27 28 29 30 31 32 33 34
Shield wire height [m]
3.5
4
4.5
5
5.5
6
Fau
lts
per
100 k
m a
nd y
ear
10-3
Steel tower with 1 shield wire
Figure 4.2: Amount of shielding failure flashovers as a function of the shield wireheight for steel tower.
If one would only look at shielding failure flashover rate a higher position of theshield wire would be better. However, Figure 4.1 showed that the total amount
38
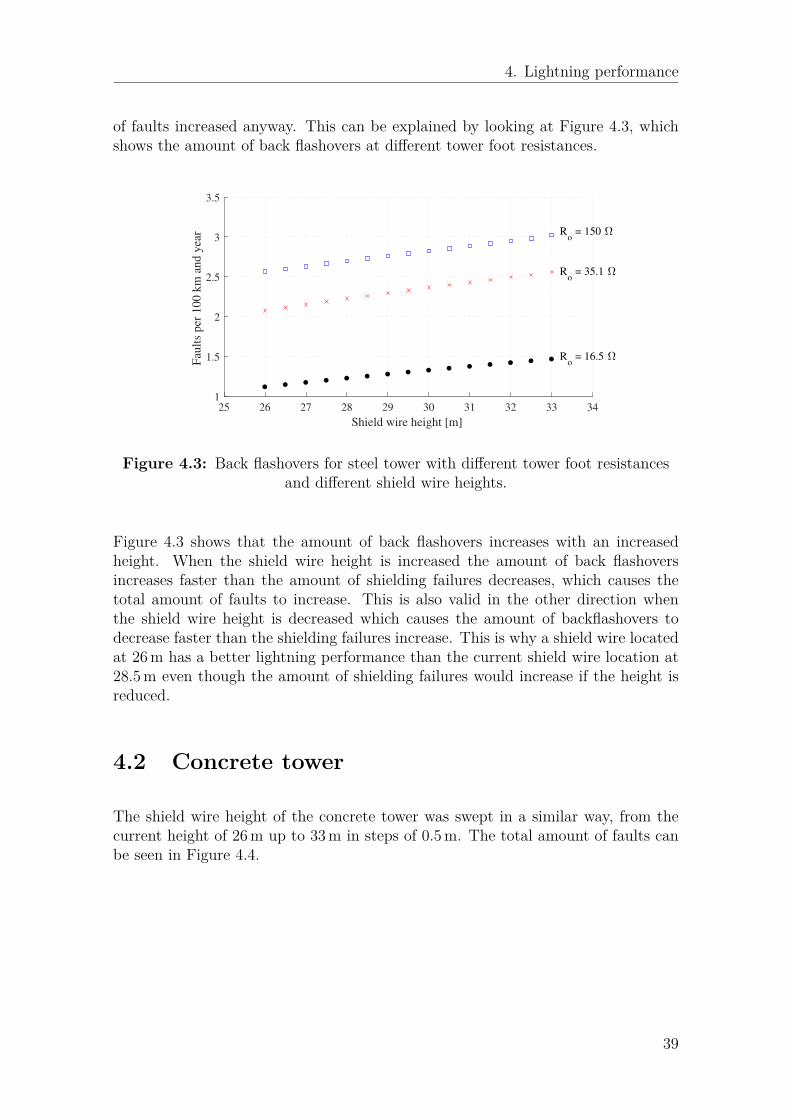
4. Lightning performance
of faults increased anyway. This can be explained by looking at Figure 4.3, whichshows the amount of back flashovers at different tower foot resistances.
25 26 27 28 29 30 31 32 33 34
Shield wire height [m]
1
1.5
2
2.5
3
3.5F
ault
s per
100 k
m a
nd y
ear
Ro = 16.5
Ro = 35.1
Ro = 150
Figure 4.3: Back flashovers for steel tower with different tower foot resistancesand different shield wire heights.
Figure 4.3 shows that the amount of back flashovers increases with an increasedheight. When the shield wire height is increased the amount of back flashoversincreases faster than the amount of shielding failures decreases, which causes thetotal amount of faults to increase. This is also valid in the other direction whenthe shield wire height is decreased which causes the amount of backflashovers todecrease faster than the shielding failures increase. This is why a shield wire locatedat 26 m has a better lightning performance than the current shield wire location at28.5 m even though the amount of shielding failures would increase if the height isreduced.
4.2 Concrete tower
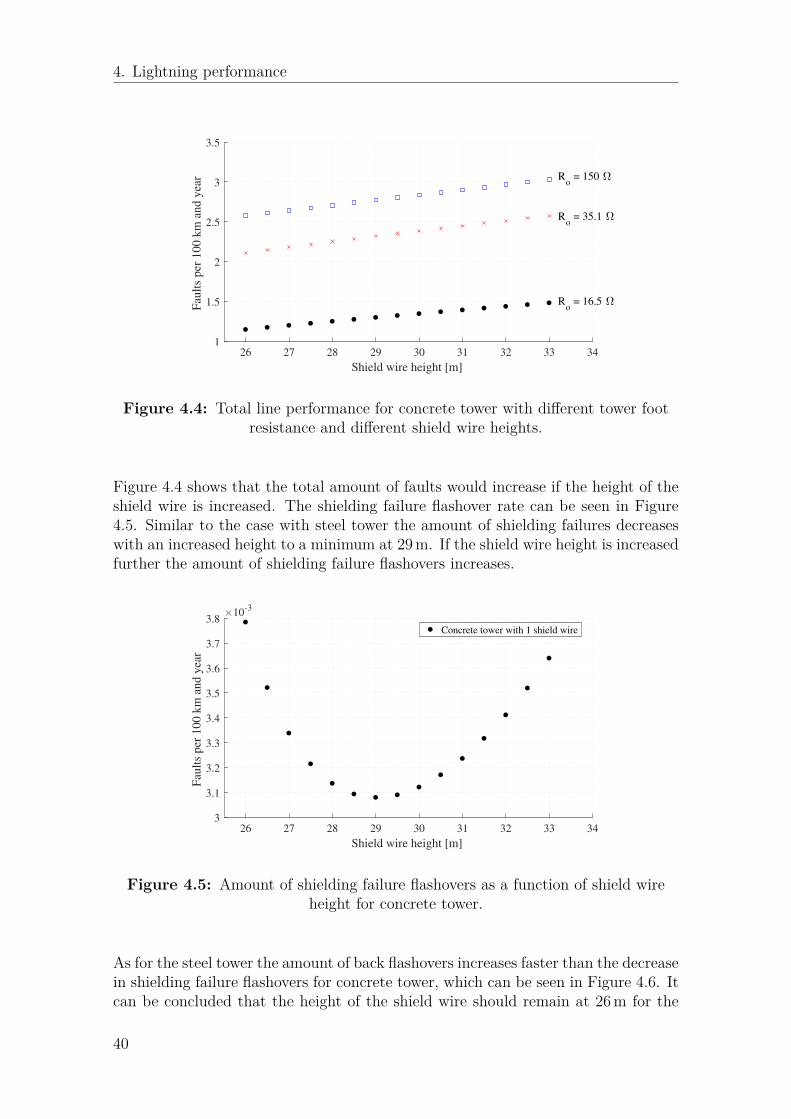
The shield wire height of the concrete tower was swept in a similar way, from thecurrent height of 26 m up to 33 m in steps of 0.5 m. The total amount of faults canbe seen in Figure 4.4.
39
4. Lightning performance
26 27 28 29 30 31 32 33 34
Shield wire height [m]
1
1.5
2
2.5
3
3.5
Fau
lts
per
100 k
m a
nd y
ear
Ro = 16.5
Ro = 35.1
Ro = 150
Figure 4.4: Total line performance for concrete tower with different tower footresistance and different shield wire heights.
Figure 4.4 shows that the total amount of faults would increase if the height of theshield wire is increased. The shielding failure flashover rate can be seen in Figure4.5. Similar to the case with steel tower the amount of shielding failures decreaseswith an increased height to a minimum at 29 m. If the shield wire height is increasedfurther the amount of shielding failure flashovers increases.
26 27 28 29 30 31 32 33 34
Shield wire height [m]
3
3.1
3.2
3.3
3.4
3.5
3.6
3.7
3.8
Fau
lts
per
100 k
m a
nd y
ear
10-3
Concrete tower with 1 shield wire
Figure 4.5: Amount of shielding failure flashovers as a function of shield wireheight for concrete tower.
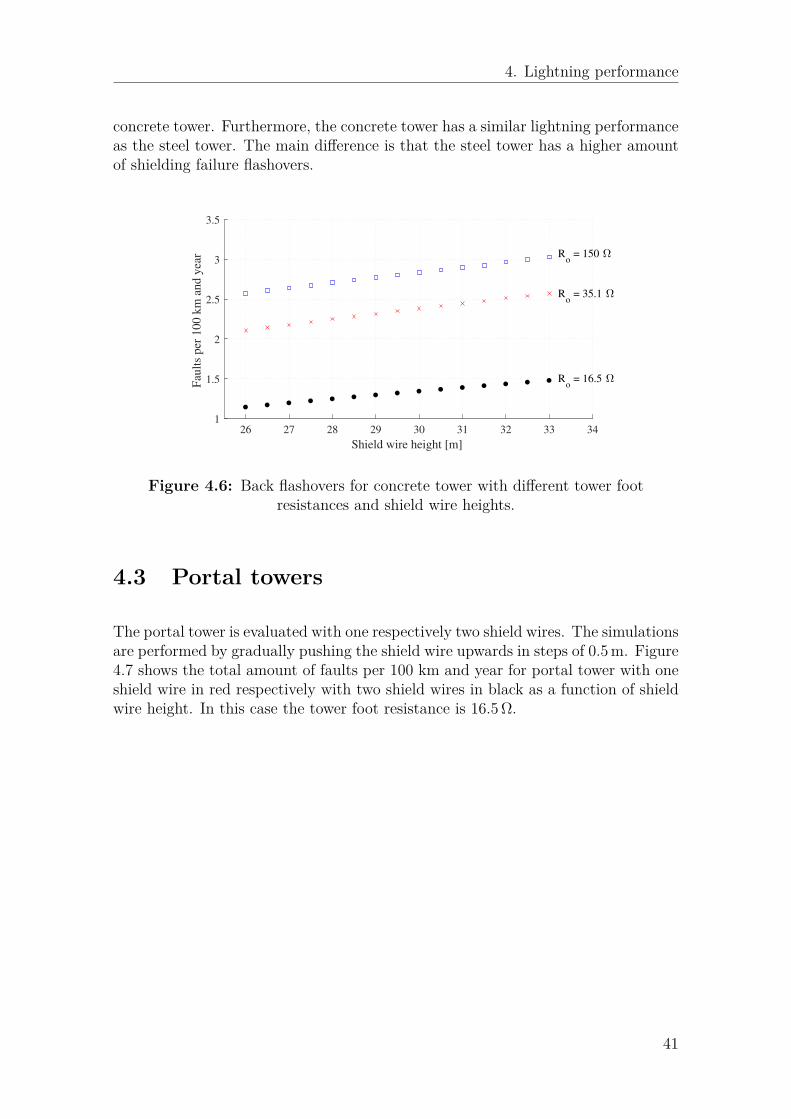
As for the steel tower the amount of back flashovers increases faster than the decreasein shielding failure flashovers for concrete tower, which can be seen in Figure 4.6. Itcan be concluded that the height of the shield wire should remain at 26 m for the
40
4. Lightning performance
concrete tower. Furthermore, the concrete tower has a similar lightning performanceas the steel tower. The main difference is that the steel tower has a higher amountof shielding failure flashovers.
26 27 28 29 30 31 32 33 34
Shield wire height [m]
1
1.5
2
2.5
3
3.5
Fau
lts
per
100 k
m a
nd y
ear
Ro = 16.5
Ro = 35.1
Ro = 150
Figure 4.6: Back flashovers for concrete tower with different tower footresistances and shield wire heights.
4.3 Portal towers
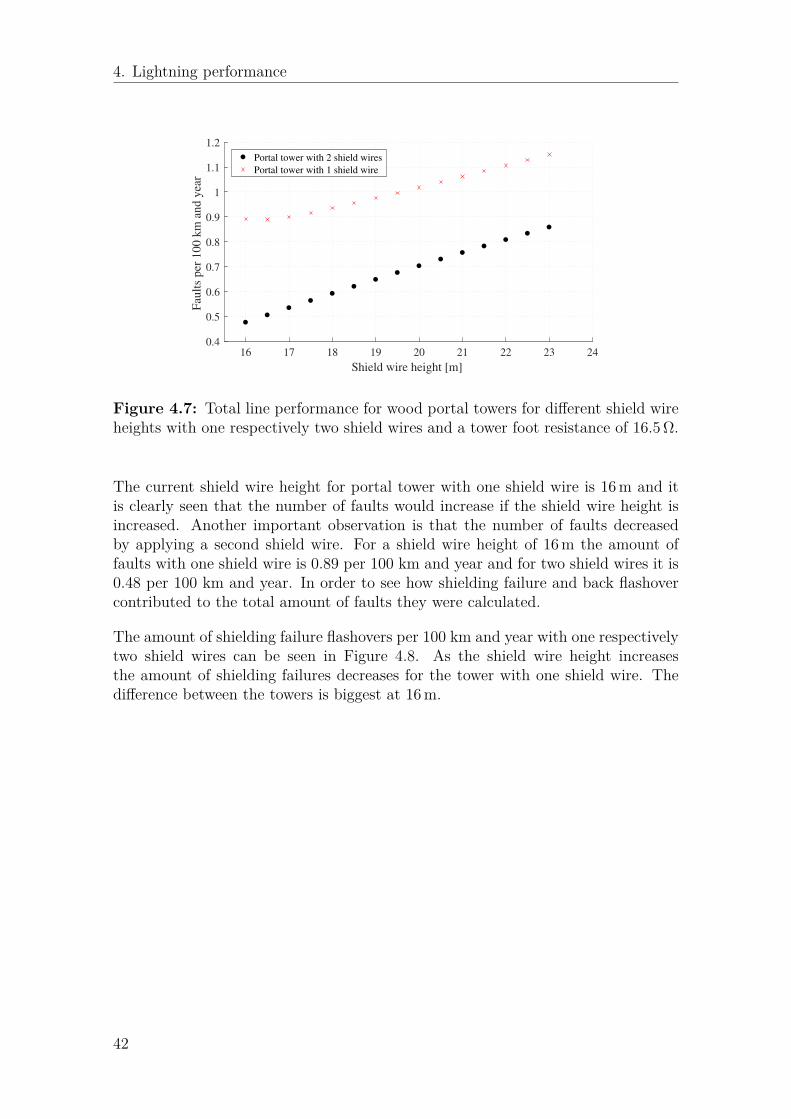
The portal tower is evaluated with one respectively two shield wires. The simulationsare performed by gradually pushing the shield wire upwards in steps of 0.5 m. Figure4.7 shows the total amount of faults per 100 km and year for portal tower with oneshield wire in red respectively with two shield wires in black as a function of shieldwire height. In this case the tower foot resistance is 16.5 Ω.
41
4. Lightning performance
16 17 18 19 20 21 22 23 24
Shield wire height [m]
0.4
0.5
0.6
0.7
0.8
0.9
1
1.1
1.2
Fau
lts
per
100 k
m a
nd y
ear
Portal tower with 2 shield wires
Portal tower with 1 shield wire
Figure 4.7: Total line performance for wood portal towers for different shield wireheights with one respectively two shield wires and a tower foot resistance of 16.5 Ω.
The current shield wire height for portal tower with one shield wire is 16 m and itis clearly seen that the number of faults would increase if the shield wire height isincreased. Another important observation is that the number of faults decreasedby applying a second shield wire. For a shield wire height of 16 m the amount offaults with one shield wire is 0.89 per 100 km and year and for two shield wires it is0.48 per 100 km and year. In order to see how shielding failure and back flashovercontributed to the total amount of faults they were calculated.
The amount of shielding failure flashovers per 100 km and year with one respectivelytwo shield wires can be seen in Figure 4.8. As the shield wire height increasesthe amount of shielding failures decreases for the tower with one shield wire. Thedifference between the towers is biggest at 16 m.
42
4. Lightning performance
16 17 18 19 20 21 22 23 24
Shield wire height [m]
0
0.01
0.02
0.03
0.04
0.05
0.06
Fau
lts
per
100 k
m a
nd y
ear
Portal tower with 2 shield wires
Portal tower with 1 shield wire
Figure 4.8: Amount of shielding failure flashovers as a function of shield wireheight with one respectively two shield wires for wood portal tower.
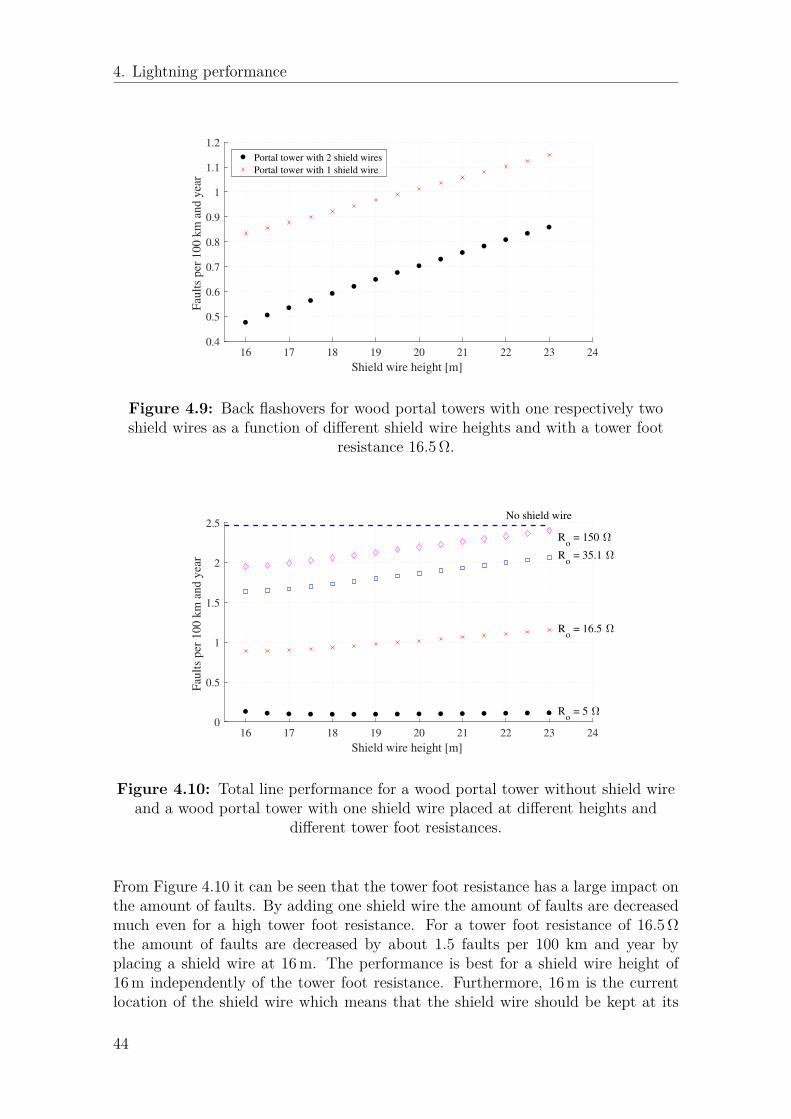
Furthermore, the amount of shielding failure flashovers with two shield wires isalmost zero regardless of the shield wire height. This does not mean that the totalamount of faults with two shield wires is zero since the back flashovers needs tobe considered. Figure 4.9 shows the back flashover contribution to the total lineperformance for one respectively two shield wires. There is a large difference in theamount of back flashovers for the two configurations. Back flashovers are increasingwith shield wire height and they account for the majority of the faults for bothconfigurations.
So far the simulations showed that two shield wires are superior to one shield wirefor a tower foot resistance of 16.5 Ω. In order to verify that this holds even if thetower foot resistance is changed simulations were performed for a range of differenttower foot resistances.
Figure 4.10 shows the total amount of faults per 100 km and year with these towerfoot resistances for a portal tower with one shield wire. The tower foot resistance hasa large influence on the amount of faults due to lightning strokes. The dashed lineshows the amount of faults for a portal tower without shield wires. As mentionedearlier a portal tower without any shield wires has about 2.5 faults per 100 km andyear according to Vattenfall’s fault statistics [9]. This is quite close to the dashedline in Figure 4.10, where the total amount of faults without any shield wire isslightly below 2.5 faults per 100 km and year.
43
4. Lightning performance
16 17 18 19 20 21 22 23 24
Shield wire height [m]
0.4
0.5
0.6
0.7
0.8
0.9
1
1.1
1.2
Fau
lts
per
100 k
m a
nd y
ear
Portal tower with 2 shield wires
Portal tower with 1 shield wire
Figure 4.9: Back flashovers for wood portal towers with one respectively twoshield wires as a function of different shield wire heights and with a tower foot
resistance 16.5 Ω.
16 17 18 19 20 21 22 23 24
Shield wire height [m]
0
0.5
1
1.5
2
2.5
Fau
lts
per
100 k
m a
nd y
ear
Ro = 5
Ro = 16.5
Ro = 35.1
Ro = 150
No shield wire
Figure 4.10: Total line performance for a wood portal tower without shield wireand a wood portal tower with one shield wire placed at different heights and
different tower foot resistances.
From Figure 4.10 it can be seen that the tower foot resistance has a large impact onthe amount of faults. By adding one shield wire the amount of faults are decreasedmuch even for a high tower foot resistance. For a tower foot resistance of 16.5 Ωthe amount of faults are decreased by about 1.5 faults per 100 km and year byplacing a shield wire at 16 m. The performance is best for a shield wire height of16 m independently of the tower foot resistance. Furthermore, 16 m is the currentlocation of the shield wire which means that the shield wire should be kept at its
44
4. Lightning performance
current placement. The reduction in faults with a low tower foot resistance and aslightly increased shield wire height to 16.5 m is negligible.
The same simulation was also performed for portal tower with two shield wires.The total amount of faults per 100 km and year can be viewed in Figure 4.11. Aspreviously, the dashed line marks the amount of faults for portal tower without shieldwire, while the dotted lines are portal tower with two shield wires with different towerfoot resistances. Once again it can be seen that the tower foot resistance has a biginfluence on the amount of faults.
16 17 18 19 20 21 22 23 24
Shield wire height [m]
0
0.5
1
1.5
2
2.5
Fau
lts
per
100 k
m a
nd y
ear
Ro = 5
Ro = 16.5
Ro = 35.1
Ro = 150
No shield wire
Figure 4.11: Total line performance for a wood portal tower without shield wireand a wood portal tower with two shield wires placed at different heights and
different tower foot resistances.
By applying two shield wires at a height of 16 m and a tower foot resistance of 16.5 Ωthe amount of faults is reduced by about 2 faults per 100 km and year comparedto a portal tower without shield wires. It is however sufficient with a tower footresistance of 35.1 Ω in order to decrease the amount of faults by half. Furthermore,if a portal tower is equipped with two shield wires they should be placed at 16 mindependently of the tower foot resistance. The amount of faults for portal towerwith one respectively two shield wires with the different tower foot resistances canbe seen in Table 4.1.
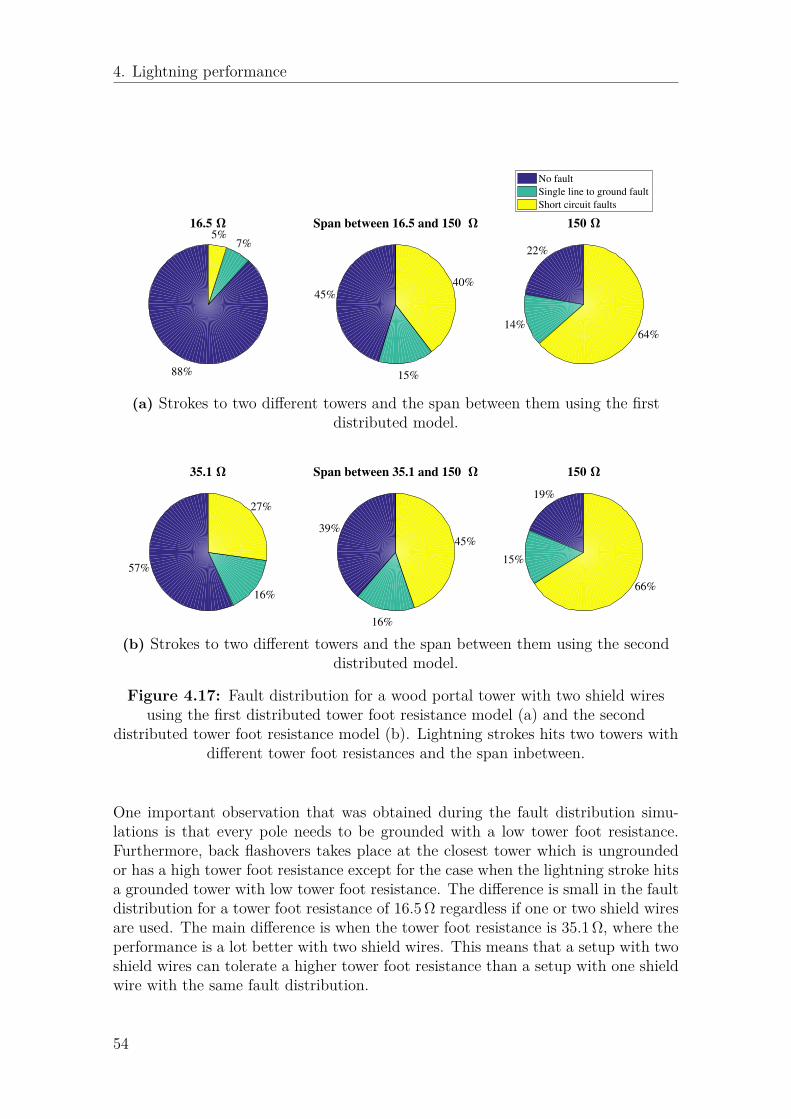
Earlier it is only mentioned how the amount of faults changed with different towerfoot resistances, an additional shield wire and the location of the shield wires. Thischapter presents the fault distribution for strokes to towers and shield wires in thespan. Furthermore, in the previous section it was seen that the number of faultsdue to strokes to the phase conductors was small and therefore the distribution ofthose faults are not calculated. Lightning amplitude required to cause a certainfault is calculated in PSCAD with the models described in section 3.3 and the resultis presented in Appendix A.1 and A.2. The results in this chapter are howeverpresented as the percentage of the strokes that are expected to cause a certain fault.This is calculated by translating a current amplitude to how often it occurs by usingthe CIGRE distribution from section 2.1.1. First it is done for the tower setupwith one shield wire with the same tower foot resistance for every pole and laterwith every second pole grounded. Furthermore, it is also done with the distributedtower foot resistance models from section 3.3.1. The same procedure is also carriedout for the portal tower with two shield wires. In section 4.3 it was concludedthat the shield wires should be placed at a height of 16 m for an optimal lightningperformance. Therefore the shield wires are placed on a height of 16 m in all of thePSCAD simulations.
4.3.1.1 Portal tower with one shield wire
The first case is a portal tower with one shield wire and every pole grounded withthe same tower foot resistance. The results for strokes to the tower is depictedin Figure 4.12a. It shows the expected fault distribution for a system with threedifferent tower foot resistances. It should be noted that the yellow pie chart containsboth the two-phase short circuits and three-phase short circuits. They are lumpedtogether since they are both considered severe and it is not necessary to distinguishbetween them. The lightning performance is very good for the case when all thetowers has a tower foot resistance of 16.5 Ω. Almost 80 % of the strokes will causeno faults. As the tower foot resistance is increased to 35.1 Ω respectively 150 Ω theamount of faults increases, especially the short circuits. With a tower foot resistanceof 150 Ω a majority of the strokes will lead to a short circuit.
In Figure 4.12a it is seen what happens when the lightning stroke hits the tower.However, all strokes are not expected to hit towers and therefore it is interestingto calculate the lightning performance for strokes to the span. This can be seen inFigure 4.12b. For the system with a tower foot resistance of 16.5 Ω it has not changedmuch but the difference is large for the systems with high tower foot resistance,especially for 35.1 Ω. Almost 70 % of the strokes to the span causes no fault comparedto 40 % from the previous case when the lightning stroke hit the tower. As explainedin section 2.2.2 a stroke to the span is expected to produce either the same or lessovervoltage at the tower compared to a stroke at the tower. However, since strokesalso are expected to hit the towers a tower foot resistance of 35.1 Ω with one shield
46
4. Lightning performance
wire is not sufficient to manage half the lightning strokes without any faults.
16.5
79%
8%
13%
35.1
39%
25%
36%
150
11%
5%
84%
No fault
Single line to ground fault
Short circuit faults
(a) Lightning strokes to the tower.
16.5
79%
6%
15%
35.1
68%
8%
24%
150
16%
14%
70%
(b) Lightning strokes to shield wire in the span between two towers.
Figure 4.12: Fault distribution for wood portal tower with one shield wire andthree different tower foot resistances. Strokes to the tower (a) and strokes to the
shield wire in the span between two towers (b).
Furthermore, the fault distribution with every second tower grounded is calculated.Figure 4.13a shows the expected fault distribution for strokes to a grounded tower.It has slightly worse performance compared to the system with every tower groundedand strokes to the tower. The back flashovers occurs first at the grounded towerwhich was struck by the lightning.
A lightning stroke in the span between a grounded and ungrounded tower decreasedthe lightning performance a lot, which is seen in Figure 4.13b. Almost all of thestrokes results in short circuit independently of the tower foot resistance. It shouldalso be noted that the back flashovers occurs first at the closest ungrounded tower.
Figure 4.13c shows the lightning performance for strokes to an ungrounded tower.As with strokes to the span the back flashovers occurs at the ungrounded tower, but
47
4. Lightning performance
now its even worse than a stroke to the span. For a tower foot resistance of 16.5 Ωrespectively 35.1 Ω 96% of the strokes to an ungrounded tower causes short circuits.
The lightning performance for a system with every third pole grounded or even lessfrequent is not calculated since the lightning performance is so poor for a systemwith every second tower grounded. Another interesting question is then how thelightning performance is if every tower is grounded but if some of the groundingshas a high tower foot resistance. The two different models with mixed tower footresistance that are used are the ones which can be seen in Figure 3.10 and 3.11. Thelightning performance with one shield wire for the first model is depicted in 4.14a.It shows when the lightning stroke hits the tower with a tower foot resistance of16.5 Ω, a tower with 150 Ω tower foot resistance and the span between the towers.When the lightning hits the tower with a tower foot resistance of 16.5 Ω the lightningperformance is almost the same as for the case with every pole grounded. However,if the lightning stroke hits the shield wire in the span or the tower with 150 Ω towerfoot resistance the lightning performance is severely reduced and the amount ofshort circuits is increased.
The fault distribution for the second case of mixed tower foot resistances fromFigure 3.11 can be seen in Figure 4.14b. As with the previous case, the lightningperformance is more or less the same for strokes to the 35.1 Ω tower as for thecase with every pole grounded. Furthermore, the amount of short circuits increasesrapidly when the lightning stroke takes place in the span or at the 150 Ω tower.
So far it can be concluded that for a portal tower with one shield wire every poleneeds to be grounded with a low tower foot resistance. It is not sufficient to groundevery second tower or to leave every second tower with a tower foot resistance of35.1 Ω.
48
4. Lightning performance
16.5
71%
13%
16%
35.1
32%
17%
51%
150
7%5%
88%
No fault
Single line to ground fault
Short circuit faults
(a) Lightning strokes to a grounded tower.
16.5 5%
2%
93%
35.1 5%
2%
93%
150 4%3%
93%
(b) Lightning strokes to the shield wire in the span between a grounded and anungrounded tower.
16.5 3%1%
96%
35.1 3%1%
96%
150 2%2%
96%
(c) Lightning strokes to an ungrounded tower.
Figure 4.13: Fault distribution for wood portal tower with one shield wire andevery second tower grounded with three different tower foot resistances. Strokes to
the grounded tower (a), strokes to the span between a grounded and anungrounded tower (b) and strokes to an ungrounded tower (c).
49
4. Lightning performance
16.5
78%
8%
14%
Span between 16.5 and 150
20%
16%
64%
150
12%
6%
82%
No fault
Single line to ground fault
Short circuit faults
(a) Strokes to two different towers and the span between them using the firstdistributed model.
35.1
39%
25%
36%
Span between 35.1 and 150
19%
15%
66%
150
12%
5%
83%
(b) Strokes to two different towers and the span between them using the seconddistributed model.
Figure 4.14: Fault distribution for a wood portal tower with one shield wireusing the first distributed tower foot resistance model (a) and the second
distributed tower foot resistance model (b). Lightning strokes hits two towers withdifferent tower foot resistances and the span inbetween.
4.3.1.2 Portal tower with two shield wires
This chapter presents the fault distribution for a portal tower with two shield wires.Results are presented in the same way as in the previous chapter, in terms of howlarge amount of the lightning strokes that will cause a certain fault. Strokes takesplace at towers or to the shield wires in the span. Figure 4.15a shows the lightningperformance with every pole grounded with the same tower foot resistance. Theamount of faults has decreased compared to the setup with one shield wire, though itis still not good enough when the tower foot resistance is as high as 150 Ω. The majordifference between one and two shield wires occurs when the tower foot resistance is
50
4. Lightning performance
35.1 Ω. For this case with two shield wires there are no faults for about 60% of thelightning strokes to the tower compared to about 40% of the strokes to the towerwith one shield wire.
The fault distributions for strokes to the span is depicted in Figure 4.15b. For thelow tower foot resistance it is slightly better compared to a stroke to the tower.Similar to the case with one shield wire the amount of short circuits decreases whenthe stroke hits the span. For the case when the system has a tower foot resistanceof 35.1 Ω there are no faults for slightly more than 80% of the strokes to the shieldwire in the span.
16.5
89%
6%5%
35.1
62% 15%
23%
150
17%
13%
70%
No fault
Single line to ground fault
Short circuit faults
(a) Lightning strokes to the tower.
16.5
92%
3%5%
35.1
83%
6%
11%
150
27%
16%
57%
(b) Lightning strokes to one of the shield wires in the span between two towers.
Figure 4.15: Fault distribution for wood portal tower with two shield wires andthree different tower foot resistances. Strokes to the tower (a) and strokes to the
shield wire in the span between two towers (b).
The performance with every second pole grounded is also calculated for the casewith two shield wires. First when the lightning stroke hits a grounded tower, whichis seen in Figure 4.16a. In this case the back flashovers occurs at the grounded tower
51
4. Lightning performance
first. The performance is still good for a tower foot resistance of 16.5 Ω. For thecase with a tower foot resistance of 35.1 Ω the amount of strokes that does not causea fault has decreased to about 50%. For the high tower foot resistance the shortcircuits are dominating.
Figure 4.16b shows the fault distribution when the lightning hits the span betweenan ungrounded and a grounded tower. Similar to the case with one shield wire thelightning performance is poor. More than 80% of the strokes causes a short circuitindependently of the tower foot resistance value. It should also be noted that thefirst back flashovers takes place at the ungrounded tower.
Furthermore, the expected fault distribution when the lightning stroke hits an un-grounded tower in the system can be seen in Figure 4.16c. It is slightly worse thana stroke to the span. The short circuits are dominating regardless of the tower footresistance. The flashovers occurs at the ungrounded tower.
So far it has been observed that the fault distribution contains a large amount ofshort circuits if every second poled is grounded. It can be concluded that everypole needs to be grounded, regardless of if one or two shield wires are used. Aswith the previous case with one shield wire it is not necessary to calculate thefault distribution with every third pole grounded, instead it is calculated with everypole grounded and a mixed tower foot resistance. The same models with mixedresistances that was used for the case with one shield wire is used again. The faultdistribution with the first model from Figure 3.10 and two shield wires can be seenin Figure 4.17a. The performance for strokes to the 16.5 Ω tower is slightly betterthan the case with one shield wire. The big difference occurs for strokes in the span,where the amount of strokes which causes no fault has doubled with two shield wires.Furthermore, for strokes to the 150 Ω tower the performance is slightly better thanfor the case with one shield wire.
The final simulation is the second model with mixed tower foot resistances fromFigure 3.11 with two shield wires. The resulting fault distribution can be seen inFigure 4.17b. The performance is quite poor for strokes in the span and for strokesto the 150 Ω tower.
52
4. Lightning performance
16.5
84%
9%
8%35.1
49%
17%
34%
150
12%
7%
81%
No fault
Single line to ground fault
Short circuit faults
(a) Lightning strokes to a grounded tower.
16.5
12%
4%
84%
35.1
12%
4%
84%
150
10%
3%
87%
(b) Lightning strokes to one of the shield wires in the span between a groundedand an ungrounded tower.
16.5
8%2%
90%
35.1
8%2%
90%
150
6%4%
90%
(c) Lightning strokes to an ungrounded tower.
Figure 4.16: Fault distribution for wood portal tower with two shield wires andevery second tower grounded with three different tower foot resistances. Strokes to
the grounded tower (a), strokes to the span between a grounded and anungrounded tower (b) and strokes to an ungrounded tower (c).
53
4. Lightning performance
16.5
88%
7%5%
Span between 16.5 and 150
45%
15%
40%
150
22%
14%64%
No fault
Single line to ground fault
Short circuit faults
(a) Strokes to two different towers and the span between them using the firstdistributed model.
35.1
57%
16%
27%
Span between 35.1 and 150
39%
16%
45%
150
19%
15%
66%
(b) Strokes to two different towers and the span between them using the seconddistributed model.
Figure 4.17: Fault distribution for a wood portal tower with two shield wiresusing the first distributed tower foot resistance model (a) and the second
distributed tower foot resistance model (b). Lightning strokes hits two towers withdifferent tower foot resistances and the span inbetween.
One important observation that was obtained during the fault distribution simu-lations is that every pole needs to be grounded with a low tower foot resistance.Furthermore, back flashovers takes place at the closest tower which is ungroundedor has a high tower foot resistance except for the case when the lightning stroke hitsa grounded tower with low tower foot resistance. The difference is small in the faultdistribution for a tower foot resistance of 16.5 Ω regardless if one or two shield wiresare used. The main difference is when the tower foot resistance is 35.1 Ω, where theperformance is a lot better with two shield wires. This means that a setup with twoshield wires can tolerate a higher tower foot resistance than a setup with one shieldwire with the same fault distribution.
54
4. Lightning performance
4.4 Comparison between the three tower types
In this section a comparison of the total line performance for the three different towertypes is done. These are concrete tower, steel tower and tree portal tower withoutshield wire or with one respectively two shield wires. Figure 4.18(a) shows the portaltowers while 4.18(b) shows steel and concrete tower. All tower foot resistances are16.5 Ω in this case. Firstly, the tower that has the most faults per 100 km and yearis the portal tower without shield wire. It has almost 2.5 faults per 100 km and year.The tower configuration that has the lowest amount of faults is the portal tower withtwo shield wires. It never goes above 1 fault per 100 km and year even if the shieldwires are placed high. The lowest amount of faults for two respectively one shieldwire occurs when the shield wire is placed at 16 m. At 16 m the difference betweenone and two shield wires is almost 0.5 faults per 100 km and year. The concrete andsteel tower has more faults per 100 km and year than any of the portal towers withshield wires even when they have the same tower foot resistance. Furthermore, insection 4.1 respectively 4.2 it was shown that the amount of shielding failures waslow for both concrete and steel tower. The total amount of faults is higher sincethe back flashover rate is higher. Since their structures are higher they attract morelightning strokes. After all these simulations it can be concluded that the tower footresistance has a large impact on the amount of faults for all tower configurations
55
4. Lightning performance
14 15 16 17 18 19 20 21 22 23 24
Shield wire height [m]
0
0.5
1
1.5
2
2.5
3
Fau
lts
per
100 k
m a
nd y
ear
Portal tower with no shield wire
Portal tower with one shield wire
Portal tower with two shield wires
(a)
26 27 28 29 30 31 32 33 34
Shield wire height [m]
1.1
1.15
1.2
1.25
1.3
1.35
1.4
1.45
1.5
Fau
lts
per
100 k
m a
nd y
ear
Concrete tower with one shield wire
Steel tower with one shield wire
(b)
Figure 4.18: Total line performance for all configurations for the wood portaltowers (a) with a tower foot resistance 16.5 Ω and total line performance for steel
and concrete tower in (b).
Furthermore, for the portal tower with one shield wire, the shielding failure is lowerwhen the shield wire is placed higher on the tower. For shielding failure the steeltower has an optimal height of about 30 m and for concrete tower it was about 29 m.However, these heights does not improve the overall lightning performance since theamount of back flashovers increases faster than the decrease in shielding failure. Theback flashover rate is the main contributor to lightning faults. Therefore the theshield wire position should be kept at its current location for concrete tower andportal tower with one shield wire. For the steel tower the shield wire height shouldbe reduced from 28.5 m to 26 m if possible.
56
4. Lightning performance
4.5 Cost estimation
The construction cost for a steel or concrete tower is about 2.9 million SEK/km ,which includes the cost for one shield wire. The wood portal tower without anyshield wire costs 1.8 million SEK/km [9]. The cost for the first shield wire on aportal tower for a new construction is estimated to 160000 SEK/km [9]. If theportal tower is built with a second shield wire the additional shield wire is slightlycheaper than the first one since the work is slightly reduced. Therefore the cost foran additional shield wire for a new construction can be estimated to 150000 SEK/km[9]. As mentioned in section 1.4 only new constructions are considered since it isexpected to be to expensive to rebuilt an existing line with an additional shield wire.However, the cost for rebuilding an existing line with an additional shield wire isestimated to 260000 SEK/km [9]. It is very expensive since the height of the poleneeds to be increased, either by replacing the pole with a longer one or building asteel frame on top of the existing poles.
An average Vattenfall 132 kV line is used as a reference case. The average lengthof a 132 kV line is 20 km and the average load is 75 MW. Since the 132 kV grid ismeshed, customers are usually not experiencing an outage due to a lightning fault.However, industries may still experience severe disturbances and therefore half ofthe cost for a fault is used as a reference by Vattenfall [9]. The fault cost consists ofa fixed part and a time dependent part. The lightning faults are however expectedto be cleared fast and thereby only the fixed cost is used in the estimation, accordingto Vattenfall the cost is 24 SEK/kW [9]. The annual cost for faults per year for thereference line can then be estimated as
annual cost per km =faults per 100 km and year · l
100 · Pavg · cost per kW2 · l (4.1)
where Pavg is the average load mentioned earlier, l is the line length and l/100 isused to recalculate it from faults per 100 km and year to the reference line of 20 km.The whole expression is divided by 2 in order to get half the cost according towhat was described earlier and 20 in order to get the annual cost per km. If (4.1)should be comparable to an investment cost it needs to be capitalized, or in simpleterms, the cost needs to be calculated in SEK/km instead of SEK per km and year.This is done by using an interest of 5% and a time frame of 30 years, which isapproximated by multiplying (4.1) with 15.4 [9]. Table 4.2 shows the result of theeconomic calculations. The annual cost per km for the different configurations iscalculated using (4.1) and it is displayed in the second column. The third columnshows the annual cost difference per km between the portal tower without a shieldwire and the actual configuration, or in other words how much that is saved peryear and km due to the reduction in amount of faults. This is then capitalizedas described earlier. The last column is the difference in SEK/km between theestimated cost for the construction and the capitalized value.
57
4. Lightning performance
Table 4.2: Cost estimation for portal towers with different shield wireconfigurations and tower foot resistances.
Since lines with a 150 Ω tower foot resistance has a terrible lightning performanceand the configurations with a tower foot resistance of 35.1 Ω is not profitable the costfor 150 Ω is not calculated. As shown in section 4.3 a portal tower with one shieldwire and a tower foot resistance of 16.5 Ω has a similar lightning performance as aportal tower with two shield wires and a tower foot resistance of 35.1 Ω. However,the only one which is profitable according to (4.1) is the solution with one shieldwire and a tower foot resistance of 16.5 Ω. It is very important to notice that thecost for an improved grounding is not included in the comparison. This means thatthe cost difference between two shield wires and a tower foot resistance of 35.1 Ω andone shield wire and 16.5 Ω would be less in reality. However, it is hard to estimatethe cost for an improved grounding since it is very terrain and location dependent.Therefore it is necessary to consider the local conditions where the transmission lineis supposed to be constructed. It can however be concluded from Table 4.2 that thereference case equipped with two shield wires and a fault reduction by half can notcover its own costs.
As mentioned earlier the cost for two shield wires for a new construction is 310000SEK/km. By back calculating using (4.1) with an interest of 5% and a time frame of30 years the break even cost with two shield wires occurs when the number of faultsper 100 km and year equals 0.2073. According to LPE this corresponds to a towerfoot resistance of 9.8 Ω. The difference can be changed by except from including thecost of the groundings as mentioned earlier either reducing the cost of the secondshield wire, if a larger portion customers are affected by the faults or if the load ishigher.
The load required to reach a break even state with the different tower foot resistancesis calculated by setting the annual cost per km equal to the estimated cost of theshield wire topology and putting the power as unknown in (4.1). The break evenload can be seen in Table 4.3. The costs of groundings is not included in thiscalculation either. If it is pure industrial loads the break even power can be reducedby a maximum of 50%.
Table 4.3: Power required to reach a break even cost for different portal towerconfigurations.
The CIGRE characterization of the negative downward stroke is used in all simu-lations. It is based on more observations and they are more recent in time thanthe IEEE characterization. Both characterizations are based on measurements andobservations. In reality it can probably deviate a bit from the used amplitude dis-tribution. In section 2.1 it was mentioned that the most common stroke type totransmissions lines is the negative downward stroke. This means that in realitythere is a small chance that large positive strokes might hit the transmission lines.This has not been accounted for in the simulations. However, it is rare and at thesame time statistical insulation coordination is used so some faults are tolerated.Furthermore, the terrain around the transmission lines are flat in the simulation,which means that effects of objects in the vicinity has not been considered. Thiscould affect the results in both directions since tall objects can provide some shieldingagainst lightning strokes while strokes to trees near the line may result in flashoverfrom the tree to a phase conductor. In order to judge if the results from LPE arecredible or not it was compared to Vattenfalls fault statistics for the portal towerwithout shield wires. According to the statistics it has about 2.5 lightning faults per100 km and year, which is very close to the simulation results which were slightlybelow 2.5.
All heights mentioned in the report is for towers on flat terrain. When transmissionlines are built the heights may have to be adjusted due to the topography so thatthe safety regulations regarding the distance to ground from the phase conductorsand distance between shield wires and phase conductors are followed. Thereforethe heights needs to be considered individually for each line project, maybe evenindividually for each tower depending on the topography. The heights in the previoussection are however the recommended height for shield wires at flat terrain.
The PSCAD model is based on LPM which is used in many lightning studies. Itis important to notice that it is a model of the breakdown between the arcinghorns for non-standard lightning impulses. Therefore the fault distributions areestimated expectations. Neither LPE or PSCAD considers flashovers within thespan. They are however rare in reality since the breakdown strength of the airbetween the conductors is higher than the breakdown strength between the arcinghorns at the insulator strings. In order to verify that the reflections in the modelworked as expected it was initially fed with a lightning stroke with linearly increasing
59
5. Discussion
amplitude. This made it possible to calculate potentials at towers before and afterreflections by hand. Front time was changed with respect to the travel times in orderto make sure that all reflections were considered. LPM was verified by calculatingthe fault distribution for a transmission line with different parameters. This wasdone since STRI had done a fault distribution for this line. The resulting faultdistribution matched the one obtained by STRI.
In section 4.3.1 it is concluded that every pole needs to be grounded in order toachieve a good lightning performance. However, it is important to remember thatthis is a recommendation and that in practise there are regulations which must befollowed in order to avoid dangerous step voltages due to the 50 Hz fault current.If it is not possible to achieve a safe grounding at a pole then the downlead couldbe removed. As shown earlier this will result in a poor lightning performance forstrokes to the ungrounded tower or in the adjacent spans.
Steel and concrete tower has a good lightning performance if the tower foot resis-tance is as low as 16.5 Ω. They are however more expensive than portal towers andit is not possible to recommend a tower type only based on its lightning perfor-mance since there are many other parameters which needs to be considered whena new transmission line is built. The price difference might change in the futurethough. Today the wood poles of the portal tower is impregnated with creosote.The environmental impact of creosote is discussed and the future is uncertain, sinceit might be forbidden. This means that in the future the wood poles might need tobe impregnated by something else or maybe made of composites or similar. Thiscould change the cost difference between portal tower and steel respectively concretetower.
The cost estimation showed that the reference case equipped with two shield wirescould not cover its own costs. This does not consider the cost of the groundings,which means that it is not entirely true. Since a portal tower with two shield wiresand a tower foot resistance of 35.1 Ω has almost the same performance as a portaltower with one shield wire and a tower foot resistance of 16.5 Ω it might be possibleto save money by not improving the tower foot resistance and instead building withan additional shield wire instead. Cost of groundings are however hard to estimatesince they are very terrain and location dependent. This is something that Vattenfallhas to do from case to case. It was also shown that another shield wire reduced theamount of short circuits, which is desired by Vattenfall. This is not considered inthe cost estimation either. Furthermore, two shield wires can be profitable if theload is higher or more valuable, like an important industry or similar. This is alsosomething that needs to be considered from case to case.
Industries is probably also where the greatest sustainable gain could be with animproved lightning performance. As mentioned in section 1.1 an interruption due tolightning results in scrapping of the paper that is currently on the production line. Areduction of the amount of lightning related faults is therefore assumed to reduce theamount of paper that needs to be scrapped every year, which would be a gain froma sustainable perspective. Paper mills are just one example of sensitive industries.
60
5. Discussion
In order to be more precise of how lightning disturbances affects industries it isnecessary to know how long faults last and how the supply is designed at the actualindustry, with several connections to the grid or UPS for example. So far it is easyto believe that an improved lightning performance would be sustainable. However,by using an additional shield wires for the portal tower the material consumptionis increased. The shield wire currently used by Vattenfall, which is mentioned insection 3.2, is an ACSR wire. It is quite thin compared to the phase conductors andit does not contain any rare materials or similar. Therefore it is believed that animproved lightning performance is beneficial for the environment.
Another possible solution would have been to use line surge arresters. They arehowever considered to be too expensive at the moment. If the price of line surgearresters drops it could maybe be an alternative to shield wires in the future.
61
5. Discussion
62
6Conclusions and future work
The shield wires should be placed as a low a possible. When the height is increasedthe protective angle is improved and less strokes terminates on the phase conductors.However, the back flashovers increases faster and therefore the amount of faults isincreasing at higher shield wire heights. The height of the shield wire at the steeltower should be decreased from 28.5 m to 26 m if possible. For the concrete towerthe shield wire is already optimally placed at 26 m. The portal tower should bebuilt with a shield wire height of 16 m independently of if one or two shield wiresare used. All these heights corresponds to towers located on flat ground.
In order to reduce the amount of lightning faults by half a portal tower with oneshield wire requires a tower foot resistance of 16.5 Ω while a portal tower with twoshield wires requires 35.1 Ω. An additional shield wire boosts the fault distributionwhere it reduces the amount of short circuits. Furthermore, every tower needs to begrounded properly. If a tower is left ungrounded or with a high tower foot resistancethe performance will be very poor for lightning strokes to the tower or the adjacentspans.
According to the cost estimation used in this project a portal tower with two shieldwires could not cover its own costs. This did not include the costs for groundings.Since a portal tower with two shield wires may have roughly twice the tower footresistance of a portal tower with one shield wire and still have the same performanceit might be possible to save money in many areas in Sweden by not improvingthe grounding and instead building an additional shield wire. Costs of groundingsare hard to estimate and this needs to be considered from case to case when newtransmission lines are constructed.
One of the advantages of portal towers made of wood is that they are cheap comparedto concrete and steel towers. If creosote is banned the cost difference might bechanged or even decreased. If this happens it is necessary to make a new costestimation.
If the price of line surge arresters drops significantly they should be evaluated andcompared to the shield wire configurations of the different towers. Furthermore, itcan also be investigated to add a lightning rod on every second tower to attractthe lightning to them instead of the shield wire and have a separate grounding
63
6. Conclusions and future work
system for that. It can also be further investigated if a lightning rod on a groundedtower with every second wood portal tower grounded could increase the chance ofhaving the lightning stroke hit the grounded tower instead of hitting the span or theungrounded tower.
Another solution can be to change the location of the phase wires to a new topol-ogy for the wood portal tower. The lowest height cannot be changed but the theplacement of the phases can be further investigated.
The grounding for the system can also be further evaluated with another solutionwith an underground earth electrode that is connected to every tower in order toreduce the tower foot resistance. Furthermore, it can also be investigated if it ispossible to somehow decrease the high soil resistivity but pouring something in theground or similar.
64
Bibliography
[1] A. R. Hileman, Insulation Coordination for Power Systems. New York: MarcelDekker, Inc, 1999.
[2] A Eriksson et al, Guide To Procedures For Estimating The Lightning Perfor-mance Of Transmission Lines. Cigre Working Group 01 (Ligtning) of StudyCommittee 33 (Overvoltages and Insulation Coordination), 1991.
[3] Ashkish Bendre et al, “Are Voltage Sags Destroying Equipment?,” IEEE In-dustry Applications Magazine, July/August 2006.
[4] R. Lundholm, ÖVERSPÄNNINGAR OCH ÖVERSPÄNNINGSSKYDD IELEKTRISKA STARKSTRÖMSANLÄGGNINGAR. Stockholm, 1944.
[5] C.A. Warren et al, “Power Quality at Champion Paper - The Myth and theReality,” IEEE Transactions on Power Delivery, vol. 14, no. 2, 1999.
[6] E Kuffel et al, High Voltage Engineering: Fundamentals. Oxford: Elsevier Ltd.,2 ed., 2009.
[7] G. Pettersson, Den svenska markens och berggrundens elektriska resistivitet -speciellt med hänsyn till kraftfrekvent inverkan och åska. Stockholm, Sweden:Ingenjörsvetenskapsakademien, 1975.
[8] C. Johansson, “LCC-ANALYS PÅ TRE OLIKA 130 kV LEDNINGAR,” 1992.
[9] P. Norberg, “private communication,” January 2017.
[10] Diarmid Loudon et al, “A compact 420 kV line utilising line surge arresters forareas with low isokeraunic levels,” CIGRE Session 1998, Paris - France, 1998.
[11] L. Isaksson and L. Wern, “Åska i Sverige 2002-2009,” METEOROLOGI,no. 141, 2010.
[13] STRI Line Performance Estimator LPE 4.0 User Manual. STRI AB., Ludvika,
65
Bibliography
Sweden, 2016.
[14] J. Lundquist and I. Gutman, “Tillförlitlighet hos isolationen i trästolpledningarför 130-220 kV,” 2006.
[15] J.G. Anderson et al, “A Simplified Method for Estimating Lightning Perfor-mance of Transmission Lines,” IEEE Transactions on Power Apparatus andSystems, no. PAS-104, 1985.
[16] D. K. Cheng, Field and Wave Electromagnetics. Harlow, England: PearsonEducation Limited, 2 ed., 2014.
[17] Vast-Vattenfall, “Överspänningsskydd i 0,4-132 kV anläggningar,” 1985.
[18] Vast-Vattenfall jordningskommitté, “Jordning av stationer och ställverk,” 1987.
[19] PSCAD User Guide v4.3.1. MANITOBA-HVDC Research Centre., Winnipeg,Manitoba, Canada, 2010.
[20] A. Pigini et al, “Performance of large air gaps under lightning overvoltages:Experimental study and analysis of accuracy of predetermination methods,”IEEE Transactions on Power Delivery, vol. 4, no. 2, 1989.
[21] W. Naon and S. Premrudeepreechacharn, “Flashover Occurence Factor of Insu-lator String with Arc Horn on High Voltage Transmission Line,” North Amer-ican Power Symposium, Starkville, MS, USA, 2009.
[22] F Heidler et al, “Calculation of Lightning Current Parameters,” IEEE Trans-actions on Power Delivery, vol. 14, no. 2, 1999.
[23] D. Karlsson and P. Norberg, “Earthing of 130 kV Power Lines - Effects on De-pendability and Line Cost,” IEEE/PES Transmission and Distribution Con-ference and Exposition, 2001.
66
AAppendix 1
A.1 Portal tower with one shield wire
Table A.1: Lightning current required to cause a fault during a stroke to a pole,with every pole grounded and a front time of 2.2 µs.
Table A.4: Lightning current required to cause a fault during a stroke to thespan between a grounded and ungrounded pole, with every second pole grounded
Table A.5: Lightning current required to cause a fault during a stroke to aungrounded pole, with every second pole grounded and a front time of 2.2 µs.
Table A.6: Lightning current required to cause a fault during a stroke to agrounded pole, for the first distributed tower foot resistance model (Figure 3.10)
and a front time of 2.2 µs.
Lightning stroke No fault [kA] SLG [kA] Short circuit [kA]Hits the 150 pole 0-13 14-18 19-100Hits between 150 and 16.5 0-20 21-27 28-100Hits the 16.5 pole 0-53 54-64 65-100
Table A.7: Lightning current required to cause a fault during a stroke to agrounded pole, with the second distributed tower foot resistance model (Figure
3.11) and a front time of 2.2 µs.
Lightning stroke No fault [kA] SLG [kA] Short circuit [kA]Hits the 35.1 pole 0-28 29-41 42-100Hits between 35.1 and 150 0-19 20-26 27-100Hits the 150 pole 0-13 14-17 18-100
A.2 Portal tower with two shield wires
Table A.8: Lightning current required to cause a fault during a stroke to a pole,with every pole grounded and a front time of 2.2 µs.
Table A.11: Lightning current required to cause a fault during a stroke to thespan between a grounded and ungrounded pole, with every second pole grounded
Table A.12: Lightning current required to cause a fault during a stroke to aungrounded pole, with every second pole grounded and a front time of 2.2 µs.
Table A.13: Lightning current required to cause a fault during a stroke to agrounded pole, with the first different tower foot resistance model (Figure 3.10)
and a front time of 2.2 µs.
Lightning stroke No fault [kA] SLG [kA] Short circuit [kA]Hits the 150 pole 0-21 22-27 28-100Hits between 150 and 16.5 0-31 32-39 40-100Hits the 16.5 pole 0-68 69-90 91-100
III
A. Appendix 1
Table A.14: Lightning current required to cause a fault during a stroke to agrounded pole, with the second different tower foot resistance model (Figure 3.11)
and a front time of 2.2 µs.
Lightning stroke No fault [kA] SLG [kA] Short circuit [kA]Hits the 35.1 pole 0-37 38-48 49-100Hits between 150 and 16.5 0-28 29-36 37-100Hits the 150 pole 0-19 20-26 27-100