Improved Methods for Nutrient Improved Methods for Nutrient Tissue Testing in Tissue Testing in Alfalfa Alfalfa Steve Orloff, Dan Putnam, Chris DeBen,and Andre Biscaro UC Cooperative Extension, Siskiyou County, UC Davis and Los Angeles County.
Transcript
Improved Methods for Nutrient Improved Methods for Nutrient Tissue Testing in Tissue Testing in AlfalfaAlfalfa
Steve Orloff, Dan Putnam, Chris DeBen,and Andre BiscaroUC Cooperative Extension, Siskiyou County, UC Davis and Los Angeles County.
Largest acreage crop in California Largest acreage crop in California
• Important component of California’s f tili d i lt l f t i tfertilizer and agricultural footprint
• Most limiting nutrients for alfalfa production in California are phosphorusproduction in California are phosphorus followed by potassium, and sulfur
• Occasionally in the Intermountain b d l bdboron and molybdenum
• Despite the importance of fertility management many alfalfa growers domanagement, many alfalfa growers do not assess the fertility status of fields – Fertilizer practices often based on past
practicespractices – Costly in terms of lost production or high
fertilizer costs
Favorite QuoteFavorite QuoteFavorite Quote Favorite Quote “Last time I fertilized there was a government subsidy program to help paygovernment subsidy program to help pay for the fertilizer.”
“At that time I wasn’t sure it was worth it because when we fertilized, I had to spend so much more for baling wire”spend so much more for baling wire
N t i t D fi i S t i Alf lfN t i t D fi i S t i Alf lfNutrient Deficiency Symptoms in AlfalfaNutrient Deficiency Symptoms in Alfalfa
N t i t D fi i S tNutrient Deficiency Symptoms
Nitrogen Generally yellow stunted plantsNitrogen Generally yellow, stunted plants.
Phosphorus Stunted plants with small leaves; sometimes leaves are dark blue greenleaves are dark blue-green.
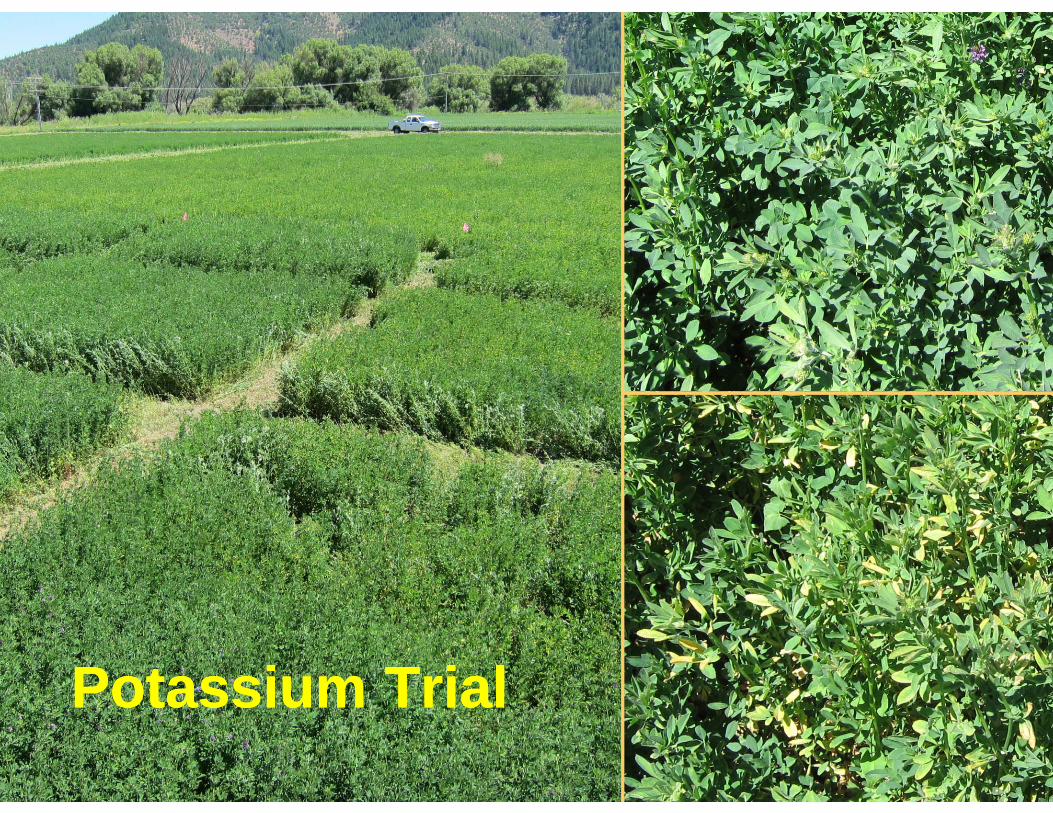
Potassium Pinhead-sized yellow or white spots on margins of leaves: on more mature leavesmargins of leaves: on more mature leaves, yellow turning to brown leaf tips and edges.
S lf G ll ll d lSulfur Generally yellow, stunted plants.
Molybdenum Generally yellow, stunted plants.
N t i t D fi i S t i Alf lfN t i t D fi i S t i Alf lfNutrient Deficiency Symptoms in AlfalfaNutrient Deficiency Symptoms in Alfalfa
N t i t D fi i S tNutrient Deficiency Symptoms
Nitrogen Generally yellow stunted plantsNitrogen Generally yellow, stunted plants.
Phosphorus Stunted plants with small leaves; sometimes leaves are dark blue greenleaves are dark blue-green.
Potassium Pinhead-sized yellow or white spots on i f l t lmargins of leaves: on more mature leaves,
yellow turning to brown leaf tips and edges.
S f GSulfur Generally yellow, stunted plants.
Molybdenum Generally yellow, stunted plants.
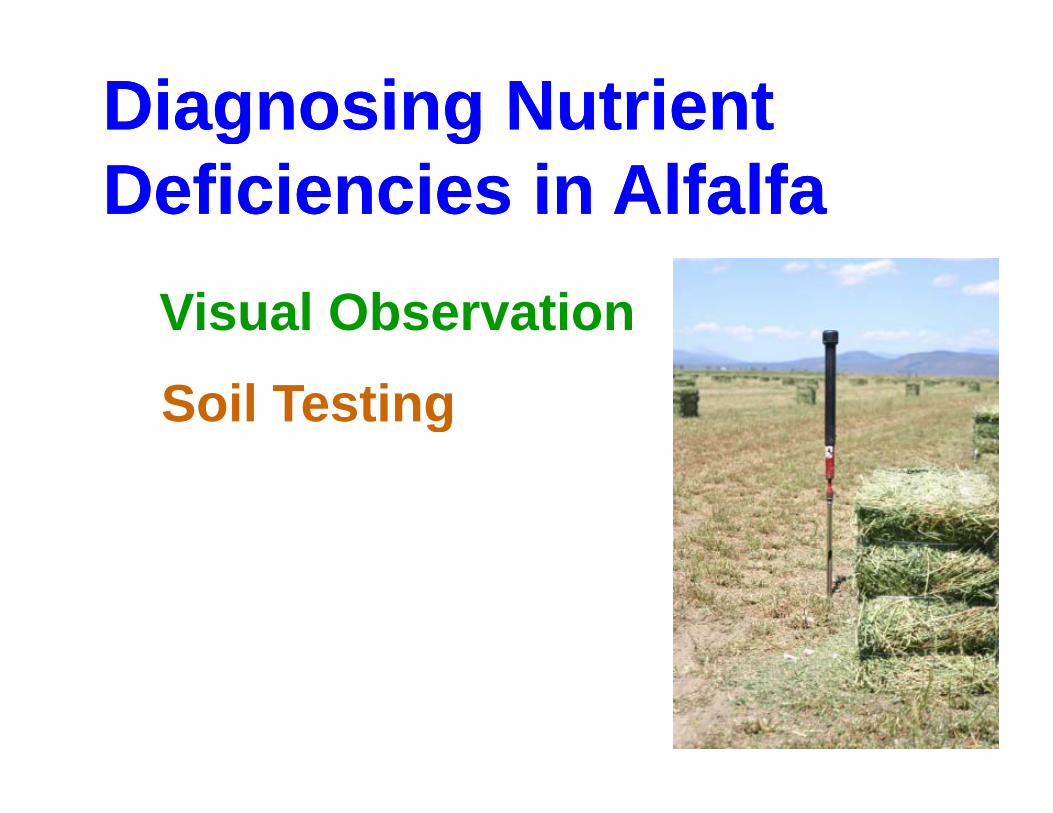
Diagnosing NutrientDiagnosing NutrientDiagnosing Nutrient Diagnosing Nutrient Deficiencies in AlfalfaDeficiencies in AlfalfaDeficiencies in AlfalfaDeficiencies in Alfalfa
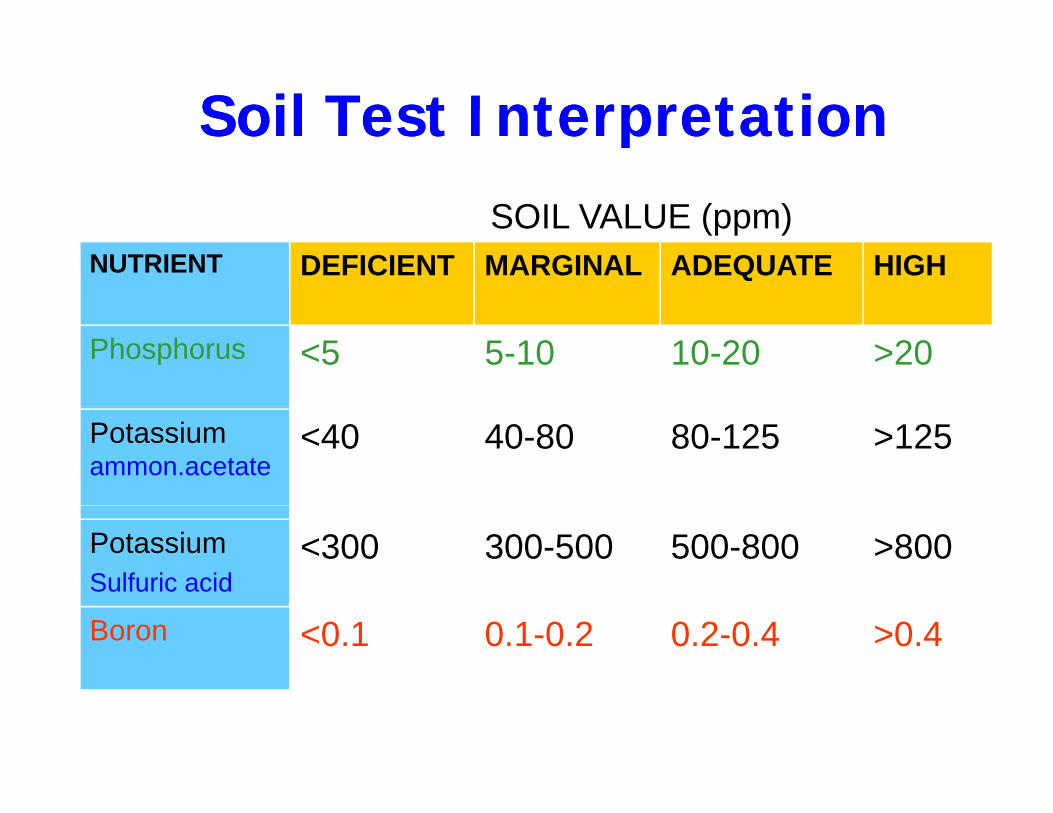
Soil Test InterpretationSoil Test InterpretationSoil Test InterpretationSoil Test InterpretationSOIL VALUE ( )SOIL VALUE (ppm)
NUTRIENT DEFICIENT MARGINAL ADEQUATE HIGH
Phosphorus <5 5-10 10-20 >20
Potassium ammon.acetate
<40 40-80 80-125 >125
PotassiumSulfuric acid
<300 300-500 500-800 >800
Boron <0.1 0.1-0.2 0.2-0.4 >0.4
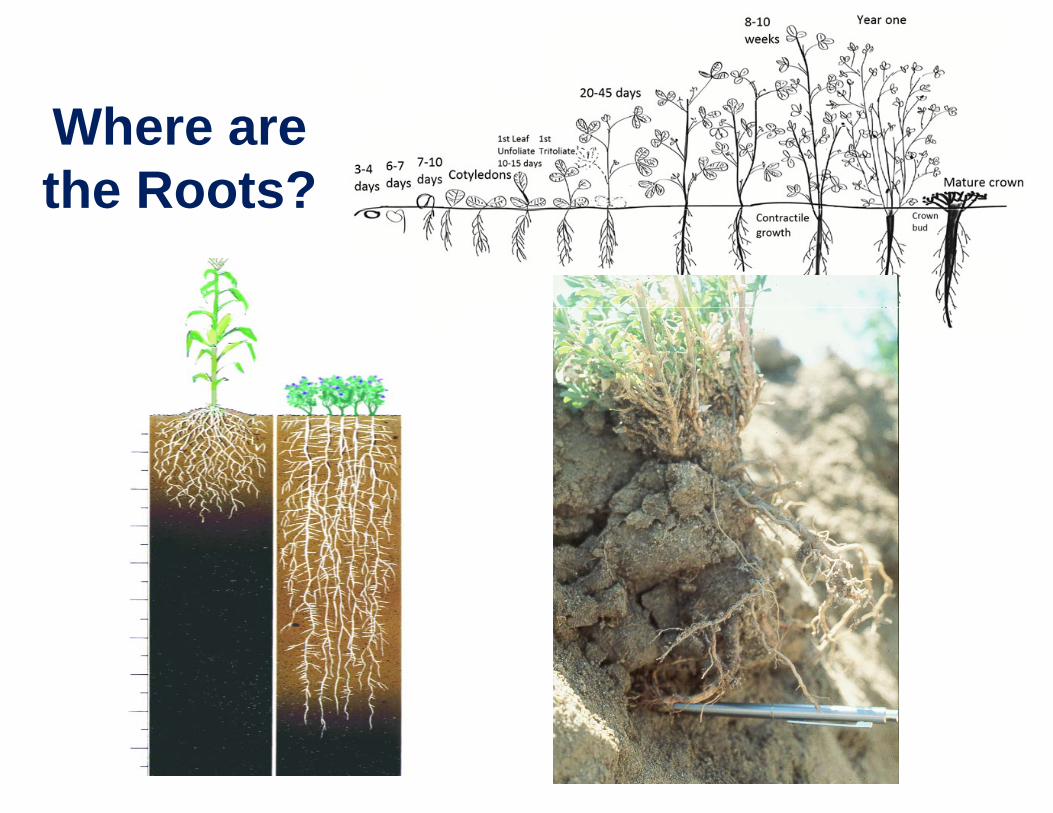
WhWhere are the Roots?
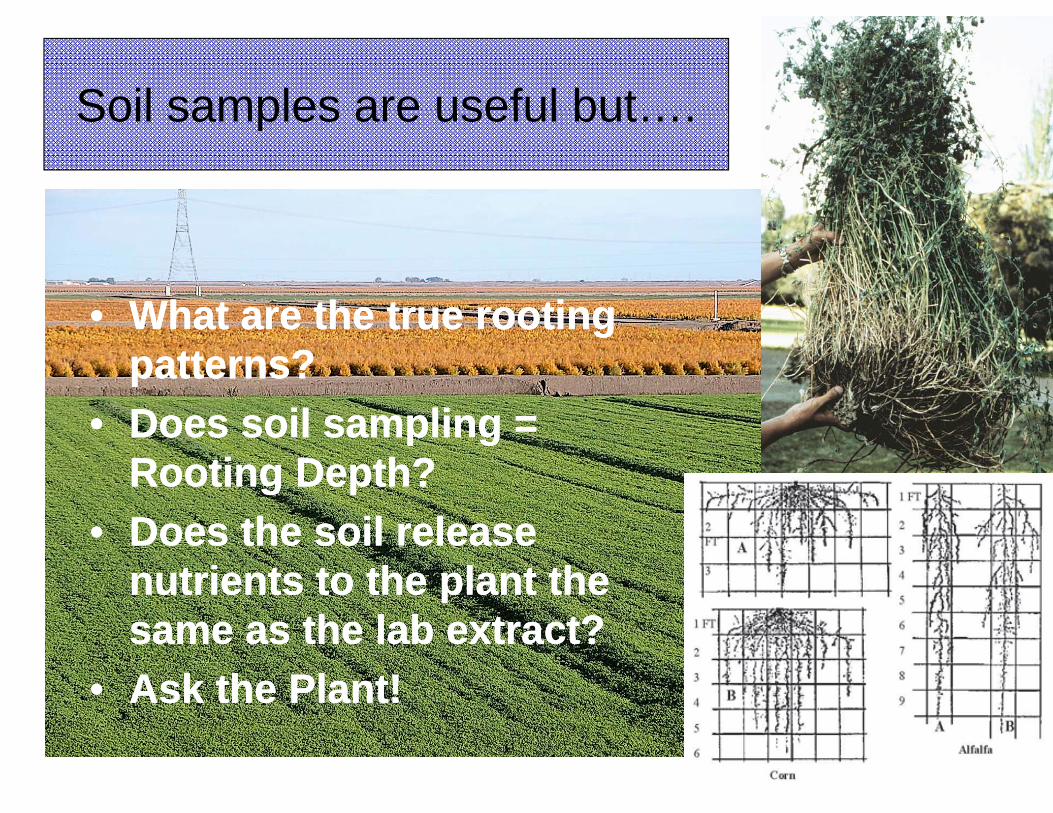
Soil samples are useful butSoil samples are useful but….
What are the true rootingWhat are the true rooting•• What are the true rooting What are the true rooting patterns?patterns?
•• Does soil sampling = Does soil sampling = Rooting Depth?Rooting Depth?
•• Does the soil release Does the soil release nutrients to the plant the nutrients to the plant the same as the lab extract? same as the lab extract?
•• Ask the Plant!Ask the Plant!s t e a ts t e a t
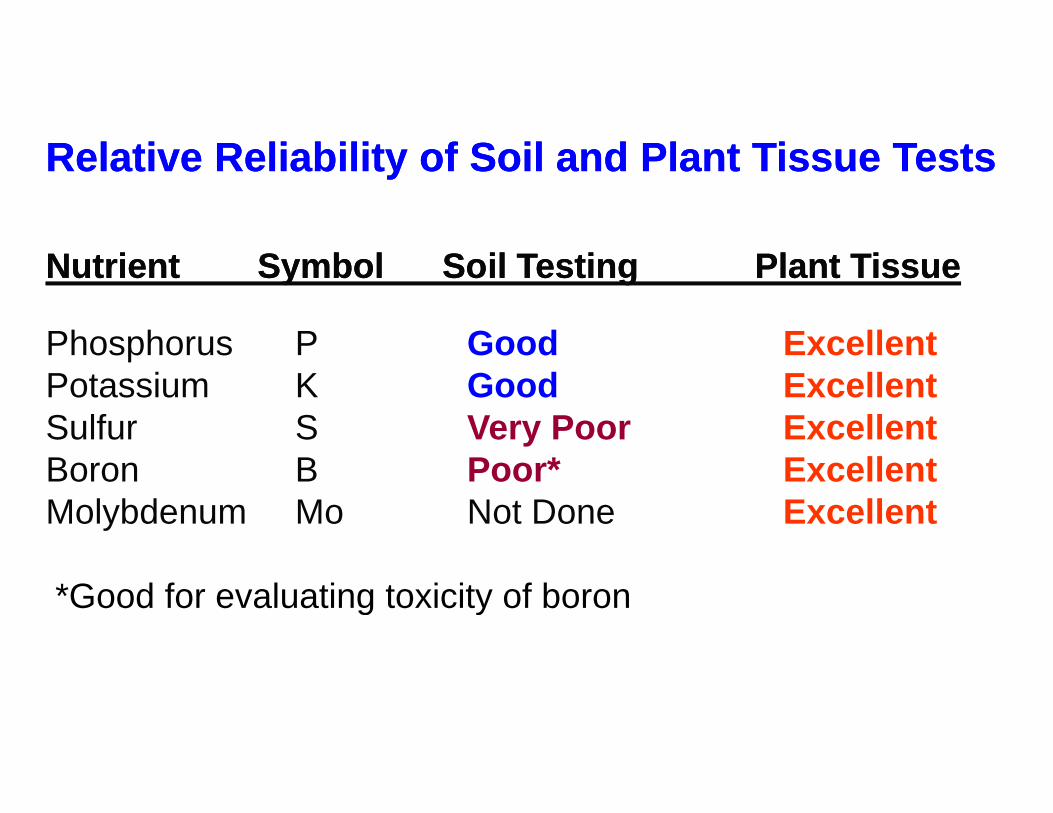
Relative Reliability of Soil and Plant Tissue TestsRelative Reliability of Soil and Plant Tissue Tests
Nutrient Symbol Soil Testing Plant Tissue Nutrient Symbol Soil Testing Plant Tissue
Phosphorus P Good ExcellentPotassium K Good ExcellentSulfur S Very Poor ExcellentBoron B Poor* ExcellentMolybdenum Mo Not Done ExcellentMolybdenum Mo Not Done Excellent____________________________________________________________________________________________________*Good for evaluating toxicity of boronGood for evaluating toxicity of boron
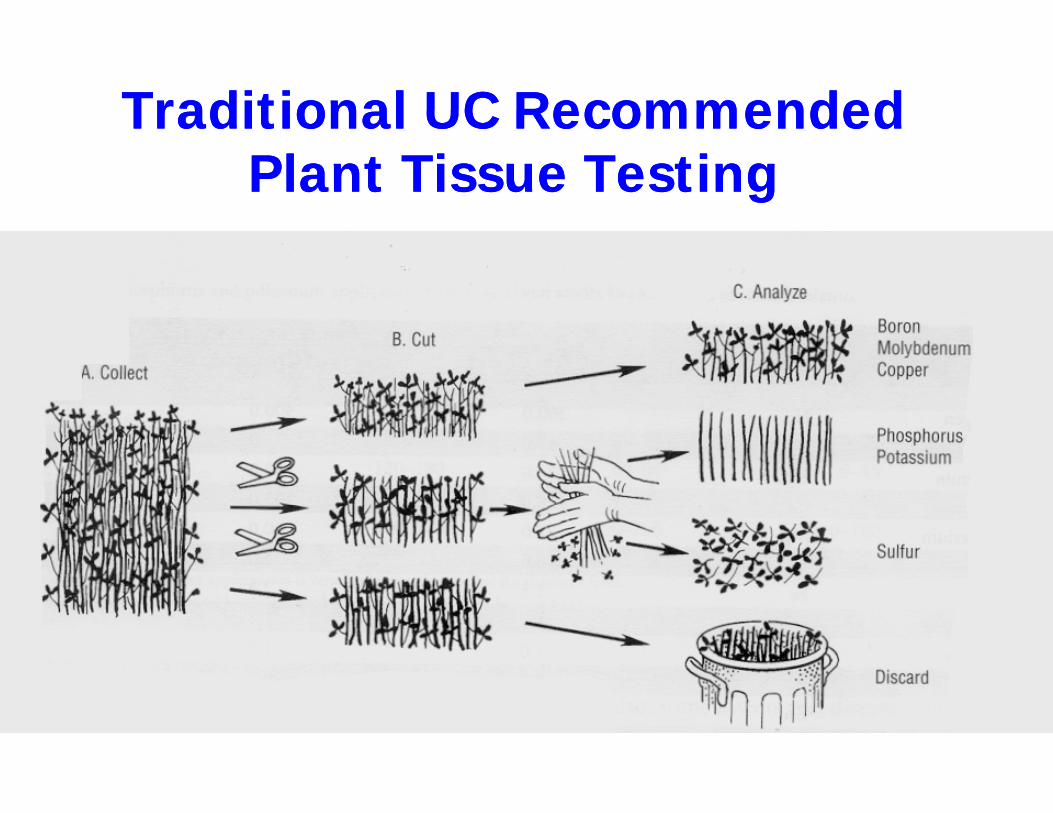
Traditional UC RecommendedTraditional UC RecommendedTraditional UC Recommended Traditional UC Recommended Plant Tissue TestingPlant Tissue Testing
Alt ti Ti T ti T h iAlt ti Ti T ti T h iAlternative Tissue Testing Technique Alternative Tissue Testing Technique Analyze Cored Bale Samples?Analyze Cored Bale Samples?y py p
Drawbacks to Current SystemDrawbacks to Current System• Time to collect samples• Time to collect samples• Must be taken prior to cutting
F ti ti l h t• Fractionating samples somewhat laborious
• Difficult to get representative sample
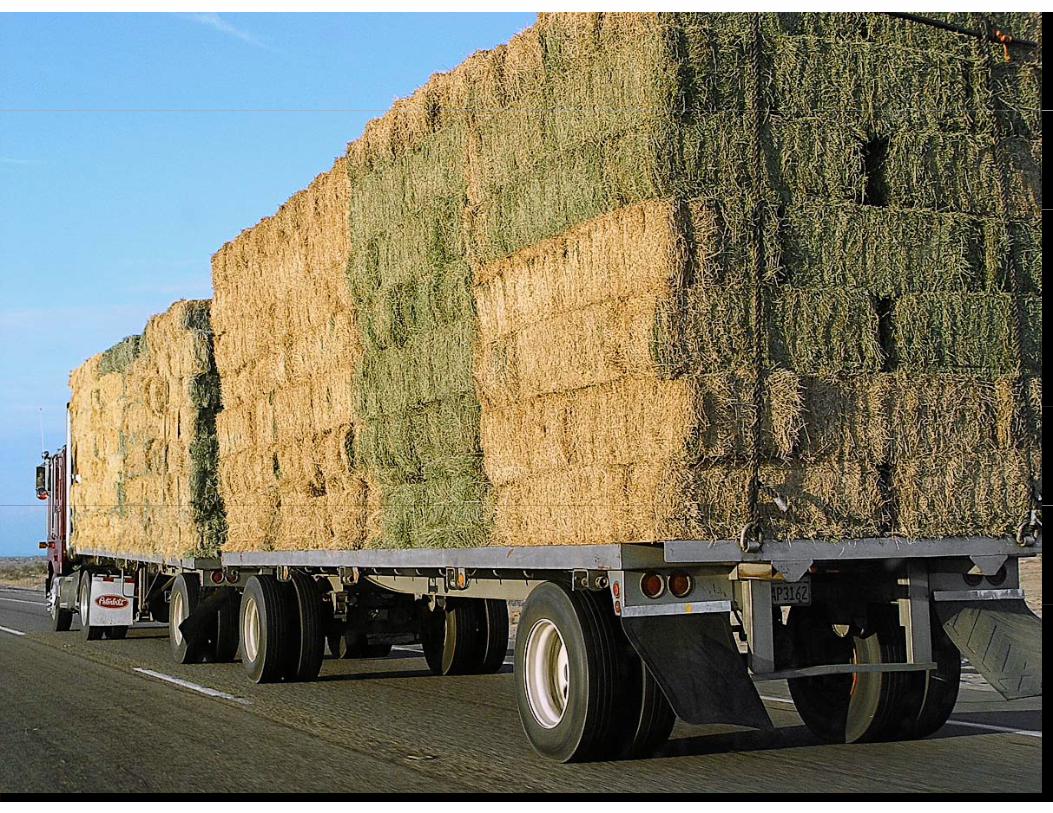
O 70% f th lf lf h• Over 70% of the alfalfa hay used by dairies
• Average 2013 dairy cow produces >70% more milkproduces >70% more milk than a cow in 1970, and dairies have demanded higher quality forage as a g q y gresult
• Could the same sample used for FQ be used for nutrient
l i ?analysis?
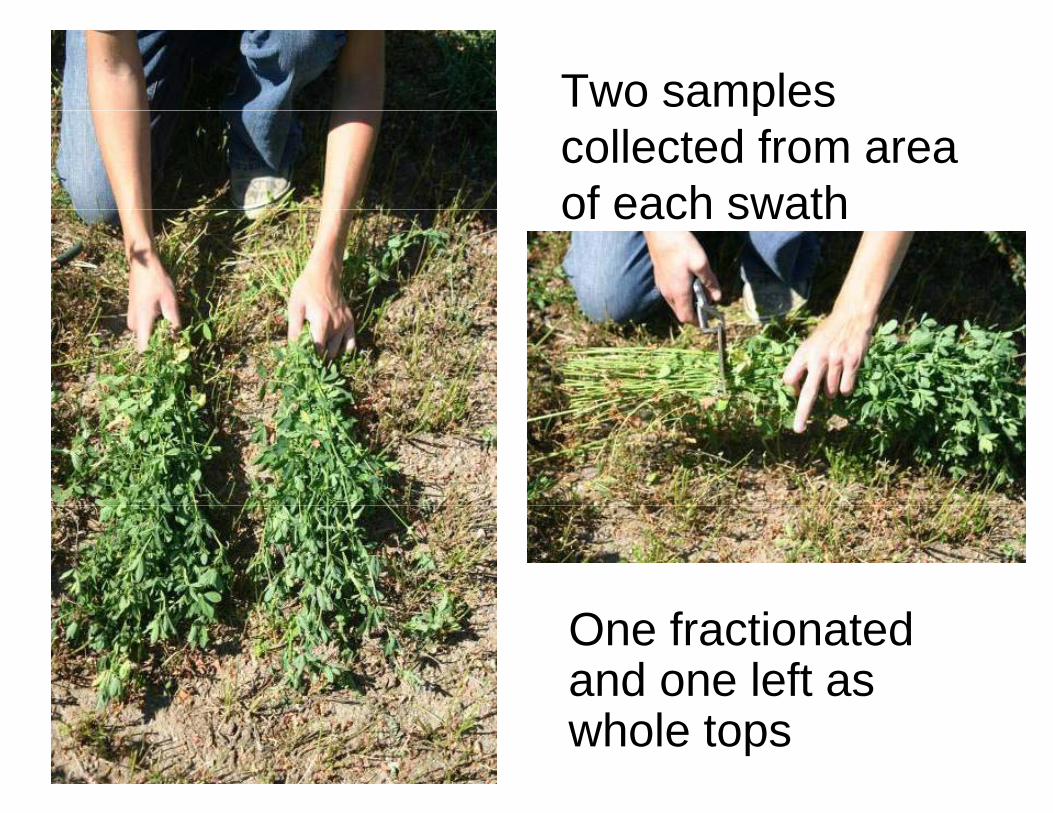
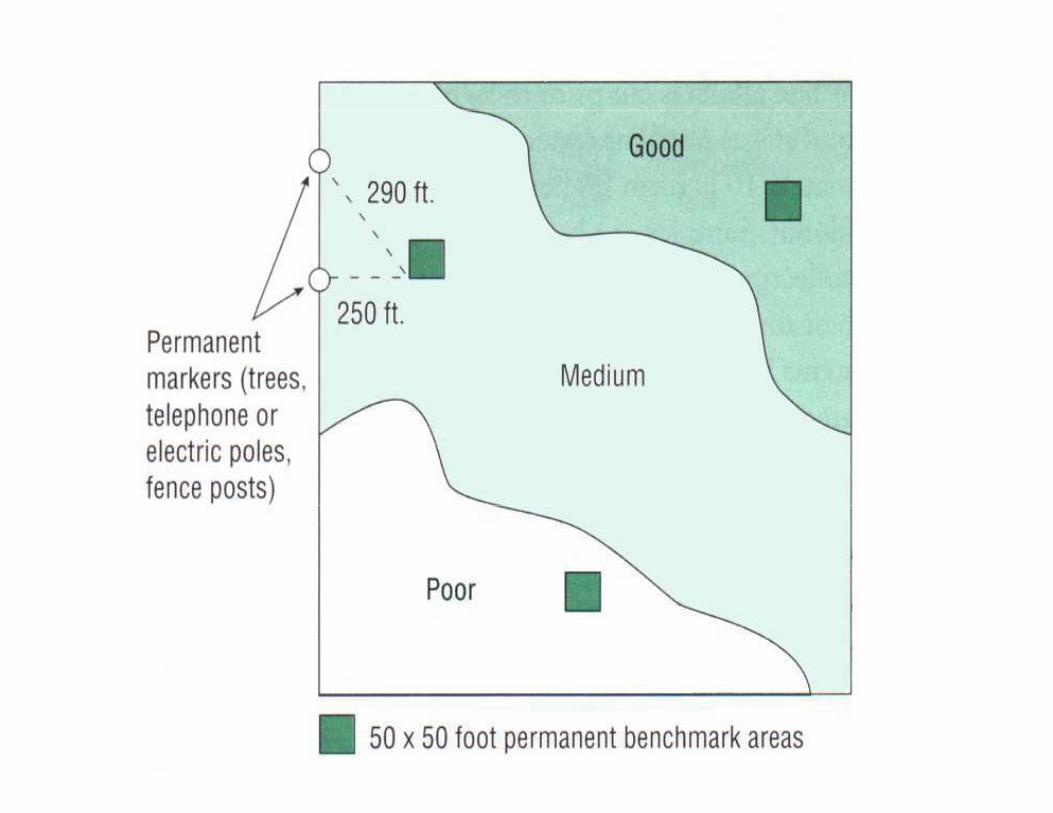
Two samples pcollected from area of each swathof each swath
One fractionated and one left as whole tops
Bales from each windrow cored before removed from field
S il l t kSoil samples taken along each windrow (15 t 20 )(15 to 20 cores)
Interpretation of Test Results for Alfalfa Plant Interpretation of Test Results for Alfalfa Plant ththTissue Samples Taken at 1/10Tissue Samples Taken at 1/10thth BloomBloom
Plant Tissue ValueaPlant Tissue ValueNutrient Plant Part Unit Deficient Marginal Adequate High
1000Boron Top 3rd ppm Under 15 15-20 20-40 Over 200
Molybdenum Top 3rd ppm Under 0.3 0.3-1.0 1-5 5-10
a) Nutrient concentrations should be approximately 10% higher than when sampled at the 1/10th bloom growth stage (multiply tabular values by 1.10).
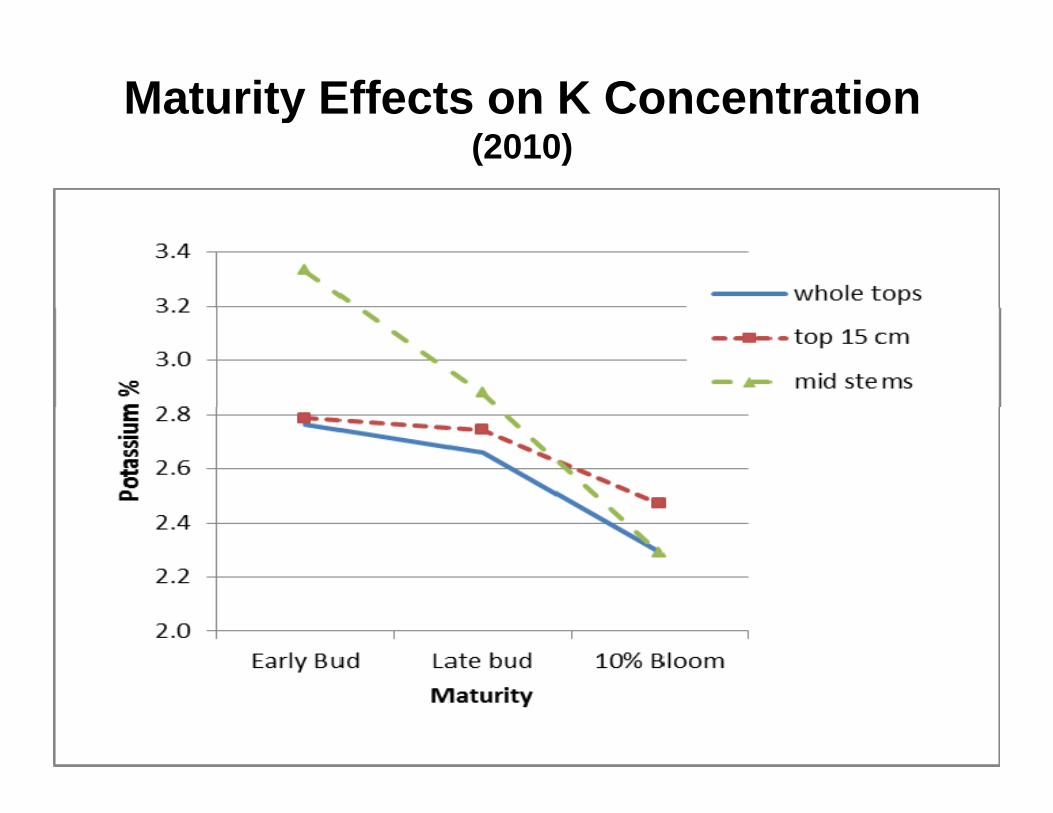
Eff t f G th StEffect of Growth Stage on Nutrient Concentration
Research ProtocolResearch ProtocolResearch ProtocolResearch Protocol
• Sampled 3-5 fields inSampled 3 5 fields in IM, CV, HD
• Sampled at early• Sampled at early bud, late bud and 10% bloom10% bloom
• 3 cuttings• 3 different plant
tissue protocols
• Whole tops, fractionated plants, top 6”• Analyzed for P K S B and Mo• Analyzed for P, K, S, B and Mo
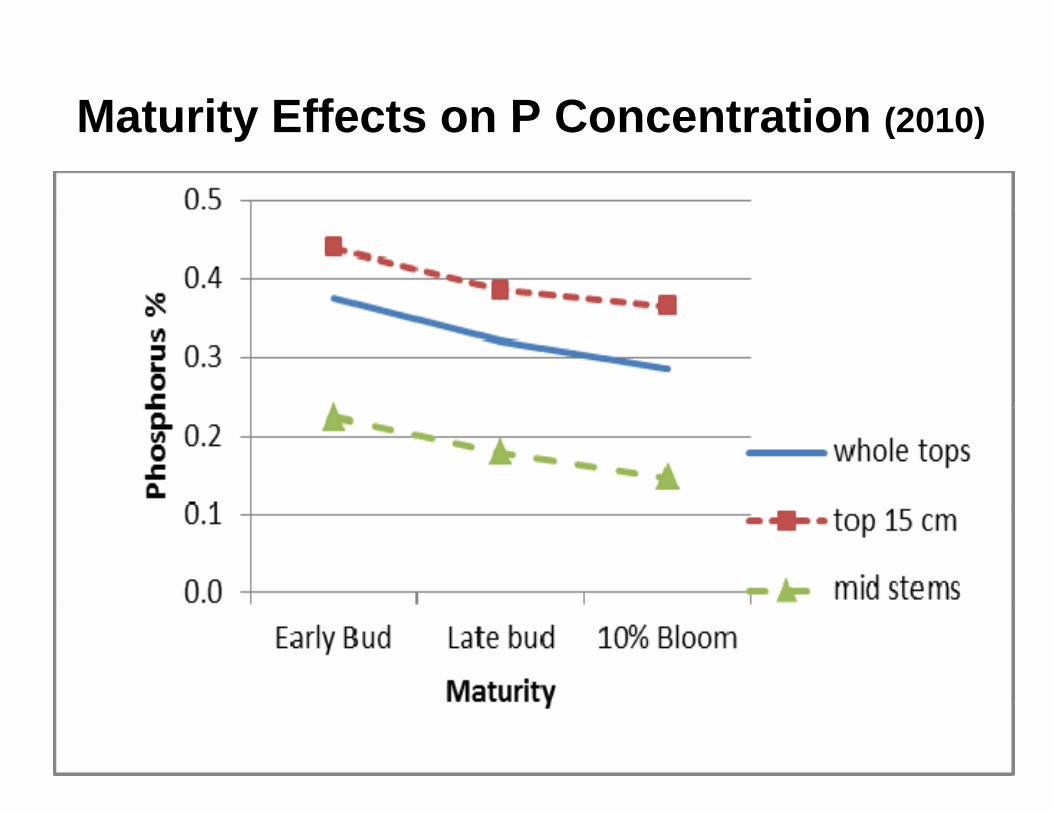
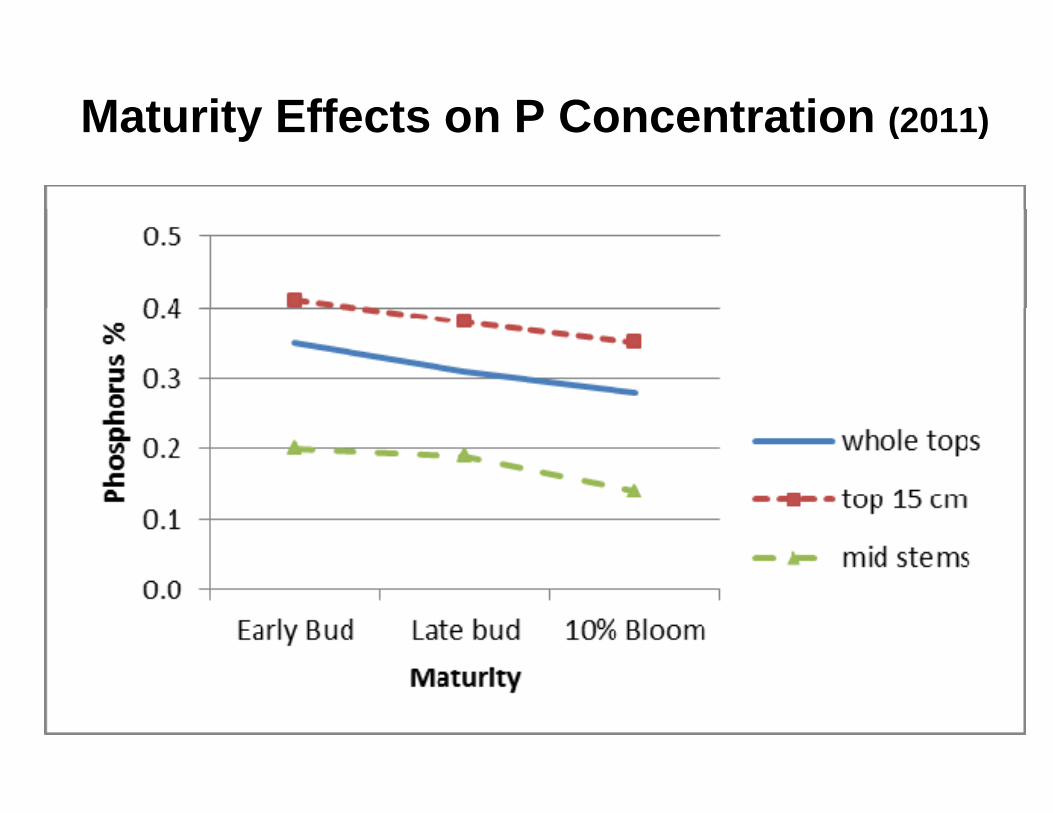
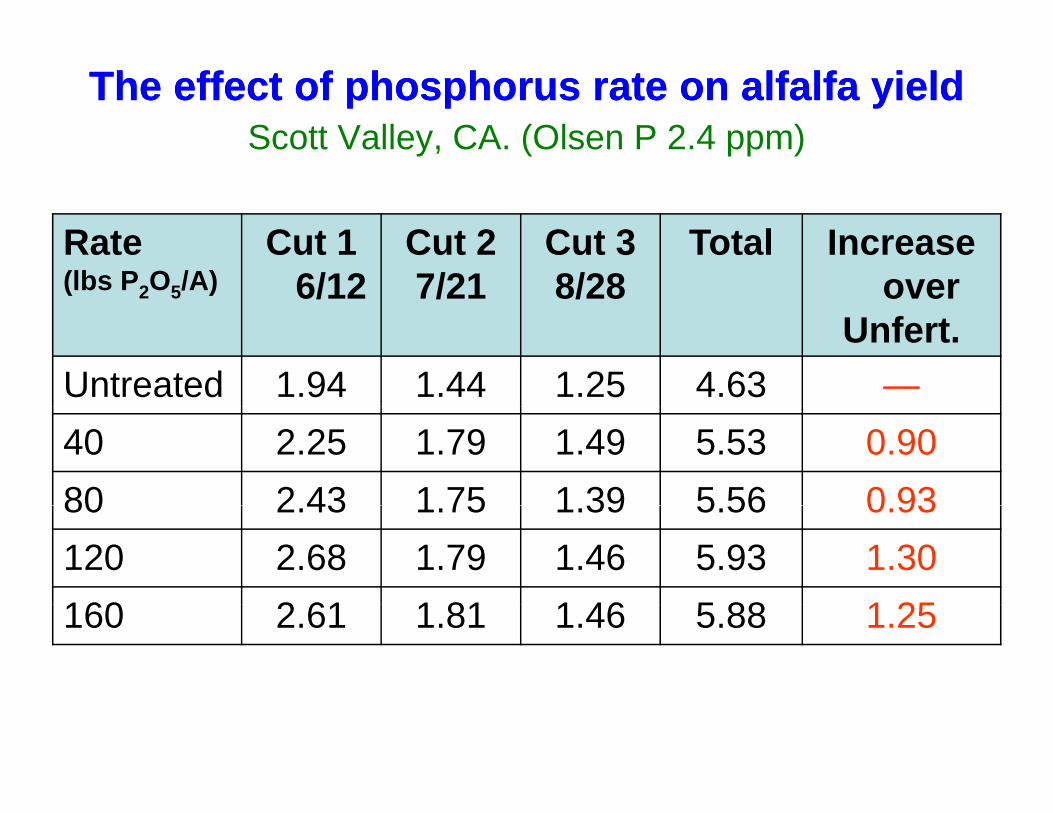
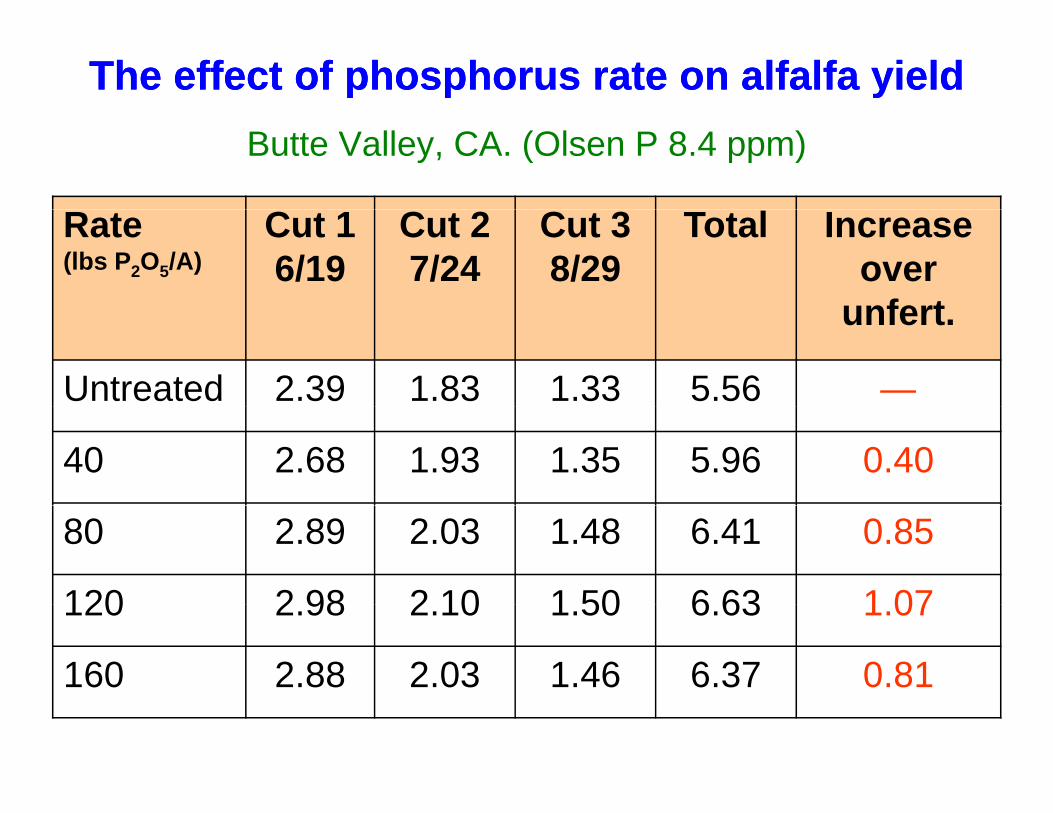
Phosphorus application rate studies to determine thePhosphorus application rate studies to determine the effect of maturity and cutting on whole tops and mid stem phosphorus levelsphosphorus levels
Effect of Potassium Fertilization Rate on Yield Scott Valley, Siskiyou County
5.5
6
4 5
5
ons/
A)
4
4.5
Yiel
d (to
3
3.5
Y
30 100 200 300 400
K2O Rate (lbs/A)( )
Maturity Effects on P Concentration (2010)Maturity Effects on P Concentration (2010)
Maturity Effects on P Concentration (2011)Maturity Effects on P Concentration (2011)
Effect of Maturity and Cutting on MidEffect of Maturity and Cutting on Mid--Stem Stem POPO44--PP
Could ADF be used as to quantify maturity?Could ADF be used as to quantify maturity?
2400
2600
2800
3000
2400
2600
2800
3000
1600
1800
2000
2200
O4
(ppm
)
1600
1800
2000
2200
O4
(ppm
)
800
1000
1200
1400
Mid
Ste
m P
O800
1000
1200
1400
Mid
Ste
m P
O
0306090120
0
200
400
600
0
200
400
600120150180210
7/9 7/11 7/13 7/15 7/17 7/19 7/21 7/23 7/25
Date
5/8 5/13 5/18 5/23 5/28 6/2 6/7 6/12 6/17
Date
1st Cut 2nd Cut
Maturity Effects on K ConcentrationMaturity Effects on K Concentration (2010)
Maturity Effects on K ConcentrationMaturity Effects on K Concentration (2011)
Relationship between Whole Top and Top 6 inch Sampling Protocols for K Concentration (All Regions) 2011Protocols for K Concentration (All Regions). 2011
5.0
4.0
3.0
p K%
y = 0.7158x + 0.6729R² = 0.9252
2.0Who
le Top
1.0
W
0.00.0 0.5 1.0 1.5 2.0 2.5 3.0 3.5 4.0 4.5 5.0
Top 6 inches K %
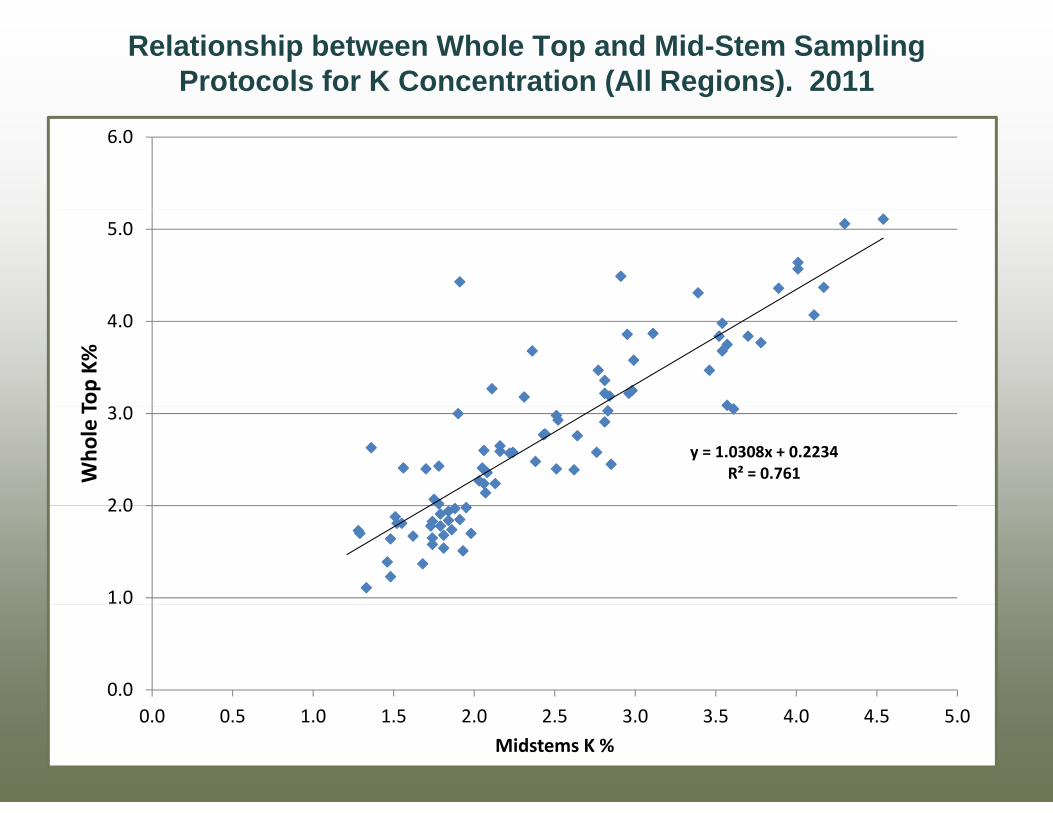
Relationship between Whole Top and Mid-Stem Sampling Protocols for K Concentration (All Regions). 2011
6.0
5.0
3 0
4.0
Top K%
y = 1.0308x + 0.2234R² = 0.761
2 0
3.0
Who
le T
1.0
2.0
0.00.0 0.5 1.0 1.5 2.0 2.5 3.0 3.5 4.0 4.5 5.0
Midstems K %
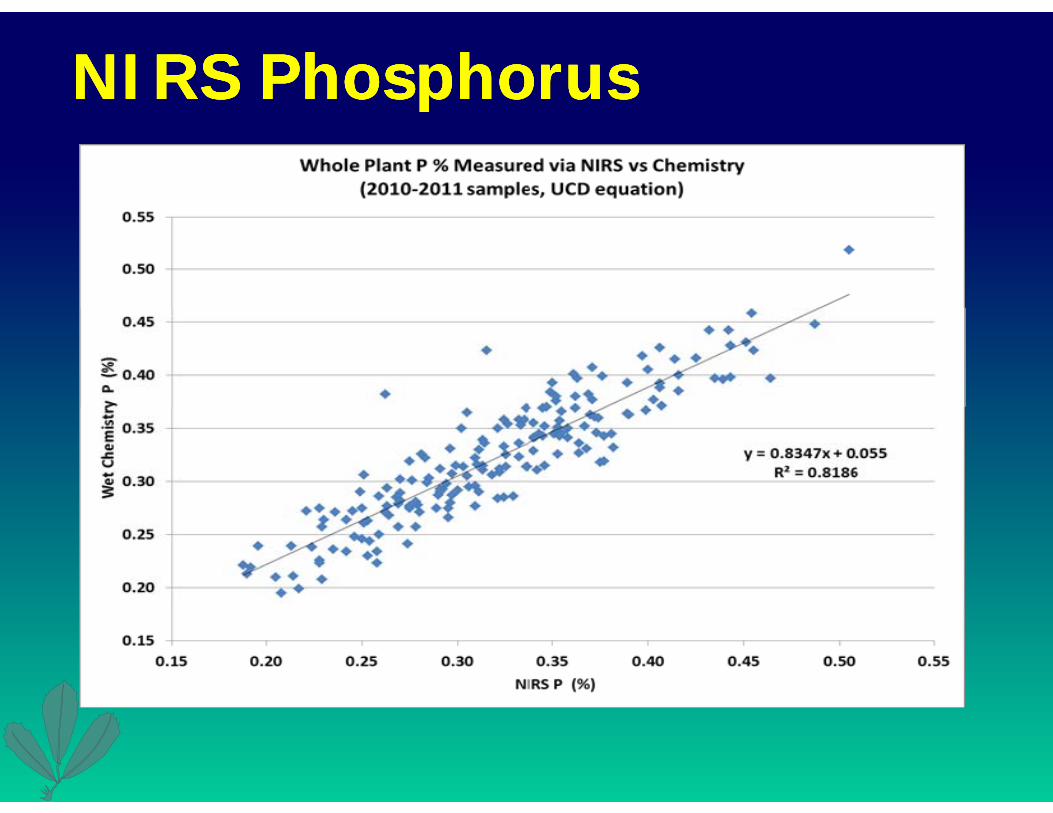
Near Infrared Spectroscopy (NIRS)Near Infrared Spectroscopy (NIRS)Near Infrared Spectroscopy (NIRS)Near Infrared Spectroscopy (NIRS)ea a ed Spect oscopy ( S)ea a ed Spect oscopy ( S)ea a ed Spect oscopy ( S)ea a ed Spect oscopy ( S)
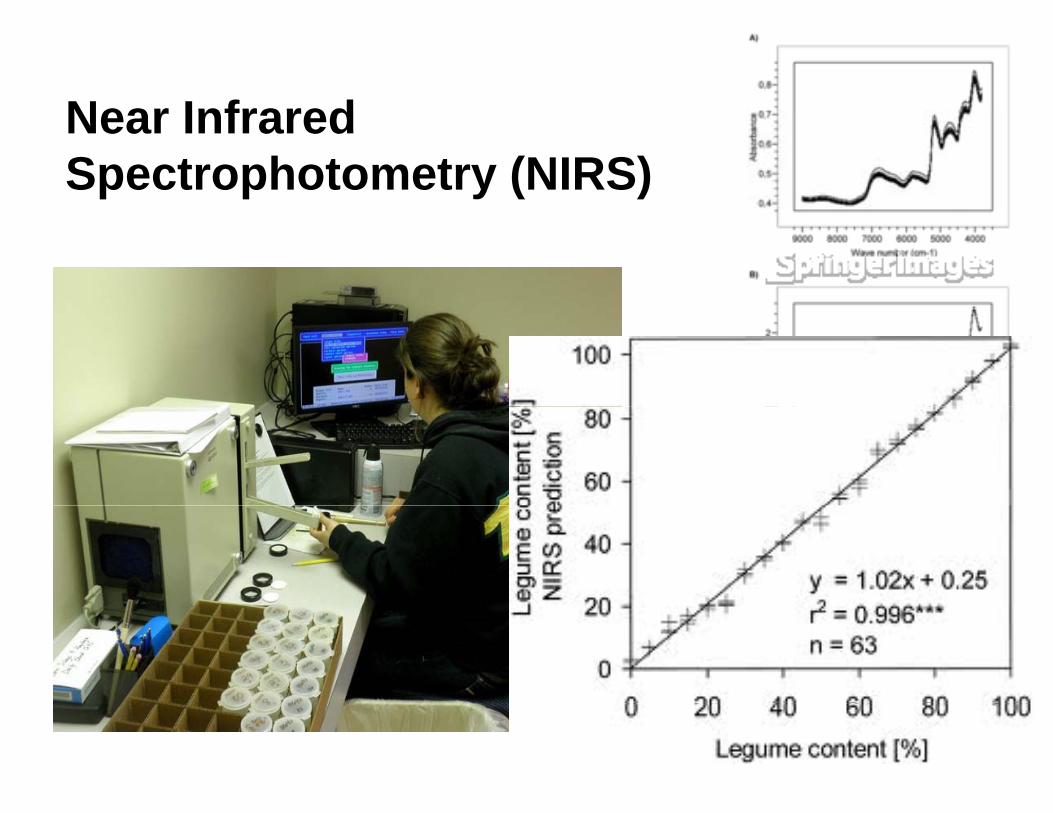
Near Infrared Spectrophotometry Near Infrared Spectrophotometry (NIRS)(NIRS)Near Infrared Spectrophotometry Near Infrared Spectrophotometry (NIRS)(NIRS)
Specialized light source Specialized light source Reflectance from a sampleReflectance from a sample Specialized light source Specialized light source Reflectance from a sampleReflectance from a sample Reflectance from a sample Reflectance from a sample
creates a large data setcreates a large data set Based upon ‘bending’ of OH, CH,Based upon ‘bending’ of OH, CH,
Reflectance from a sample Reflectance from a sample creates a large data setcreates a large data set
Based upon ‘bending’ of OH, CH,Based upon ‘bending’ of OH, CH, Based upon bending of OH, CH, Based upon bending of OH, CH, and NH bondsand NH bonds
‘Fingerprint’ of sample is ‘Fingerprint’ of sample is
Based upon bending of OH, CH, Based upon bending of OH, CH, and NH bondsand NH bonds
‘Fingerprint’ of sample is ‘Fingerprint’ of sample is g p pg p pcompared with NIRS spectra compared with NIRS spectra with known wet chemistry with known wet chemistry
ll
g p pg p pcompared with NIRS spectra compared with NIRS spectra with known wet chemistry with known wet chemistry
llvaluesvalues New value is predicted (within a New value is predicted (within a
statistical tolerance)statistical tolerance)
valuesvalues New value is predicted (within a New value is predicted (within a
statistical tolerance)statistical tolerance)statistical tolerance)statistical tolerance) Fast and accurateFast and accurate
What is its fit ith minerals?What is its fit ith minerals?
statistical tolerance)statistical tolerance) Fast and accurateFast and accurate
What is its fit ith minerals?What is its fit ith minerals? What is its fit with minerals?What is its fit with minerals? What is its fit with minerals?What is its fit with minerals?
NIRS for tissue testsNIRS for tissue testsNIRS for tissue testsNIRS for tissue testsNIRS for tissue testsNIRS for tissue testsNIRS for tissue testsNIRS for tissue testsMay work for P, K, not sure about SMay work for P, K, not sure about SMay work for P, K, not sure about SMay work for P, K, not sure about Sy , ,y , ,Not entirely sure why Not entirely sure why
C id hi h d l lC id hi h d l l
y , ,y , ,Not entirely sure why Not entirely sure why
C id hi h d l lC id hi h d l lConsider high, med, low values Consider high, med, low values ––don’t pay as much attention to don’t pay as much attention to
Consider high, med, low values Consider high, med, low values ––don’t pay as much attention to don’t pay as much attention to absolute values (bias)absolute values (bias)
Watch the different calibrationsWatch the different calibrationsabsolute values (bias)absolute values (bias)
Watch the different calibrationsWatch the different calibrationsWatch the different calibrations Watch the different calibrations from different labs (labfrom different labs (lab--toto--lab lab
i ti h i t d)i ti h i t d)
Watch the different calibrations Watch the different calibrations from different labs (labfrom different labs (lab--toto--lab lab
i ti h i t d)i ti h i t d)variation, chemistry used)variation, chemistry used) Labs may need to improve Labs may need to improve
variation, chemistry used)variation, chemistry used) Labs may need to improve Labs may need to improve y py p
SummarySummary• Large differences in fertility status• Soil analysis good for pre-plant assessment
pH, salinity, P and K • Plant tissue analysis more accurate in season
Evaluate most limiting nutrient then fertilize and resample Evaluate most limiting nutrient then fertilize and resample• Bale sampling for tissue testing practical • Can use whole tops (bale), fractionated plant or top 6 inches• Plant stage of development has a large influence on nutrient
concentrations, Especially for phosphorus and potassium Especially for phosphorus and potassium Standardization by maturity important
• Less than perfect system (soil and tissue don’t always agree)• NIRS may be useful for first approximations
Link to Standard Forage Quality analysis• Initial NIRS analysis should likely be followed up with moreInitial NIRS analysis should likely be followed up with more
vigorous field testing
NIRS:NIRS:NIRS:NIRS: …. has high repeatability and is widely used in…. has high repeatability and is widely used in …. has high repeatability and is widely used in…. has high repeatability and is widely used in …. has high repeatability and is widely used in …. has high repeatability and is widely used in
forage testingforage testing …. has high repeatability and is widely used in …. has high repeatability and is widely used in
forage testingforage testing
Spectra:Spectra: Crude ProteinCrude Protein Spectra:Spectra: Crude ProteinCrude ProteinStatistical Statistical
techniquestechniques
Near InfraredNear Infrared Spectrophotometry (NIRS)
Relationship Between NIRS and Wet Chemistry Values
The effect of phosphorus rate on alfalfa yieldThe effect of phosphorus rate on alfalfa yieldScott Valley, CA. (Olsen P 2.4 ppm)